Author Contributions
Conceptualization, A.E.-Z., O.M.-R., D.O.-T. and R.G.-C.; methodology, C.G.S.-H. and R.G.-C.; software, R.G.-C.; validation, A.E.-Z., O.M.-R., C.G.S.-H., J.E.R.-H. and R.G.-C.; formal analysis, A.E.-Z., O.M.-R. and R.G.-C., D.O.-T. and J.E.R.-H.; investigation, A.E.-Z., O.M.-R., D.O.-T. and R.G.-C., J.E.R.-H.; resources, A.E.-Z., D.O.-T. and O.M.-R.; data curation, C.G.S.-H. and R.G.-C.; writing—original draft preparation, A.E.-Z. and R.G.-C.; writing—review and editing, A.E.-Z. and R.G.-C.; visualization, R.G.-C.; supervision, A.E.-Z., O.M.-R., C.G.S.-H. and R.G.-C.; project administration, A.E.-Z. and O.M.-R.; funding acquisition, A.E.-Z. and O.M.-R. All authors have read and agreed to the published version of the manuscript.
Figure 1.
Ultrasonic micro injection molding (UMIM) section view scheme. The pelletized material is pushed upwards by the plunger as the sonotrode vibrates. As the material melts, it is injected into the cavity. After a specific cooling time, the mold is opened, and the ejector pins release the specimen.
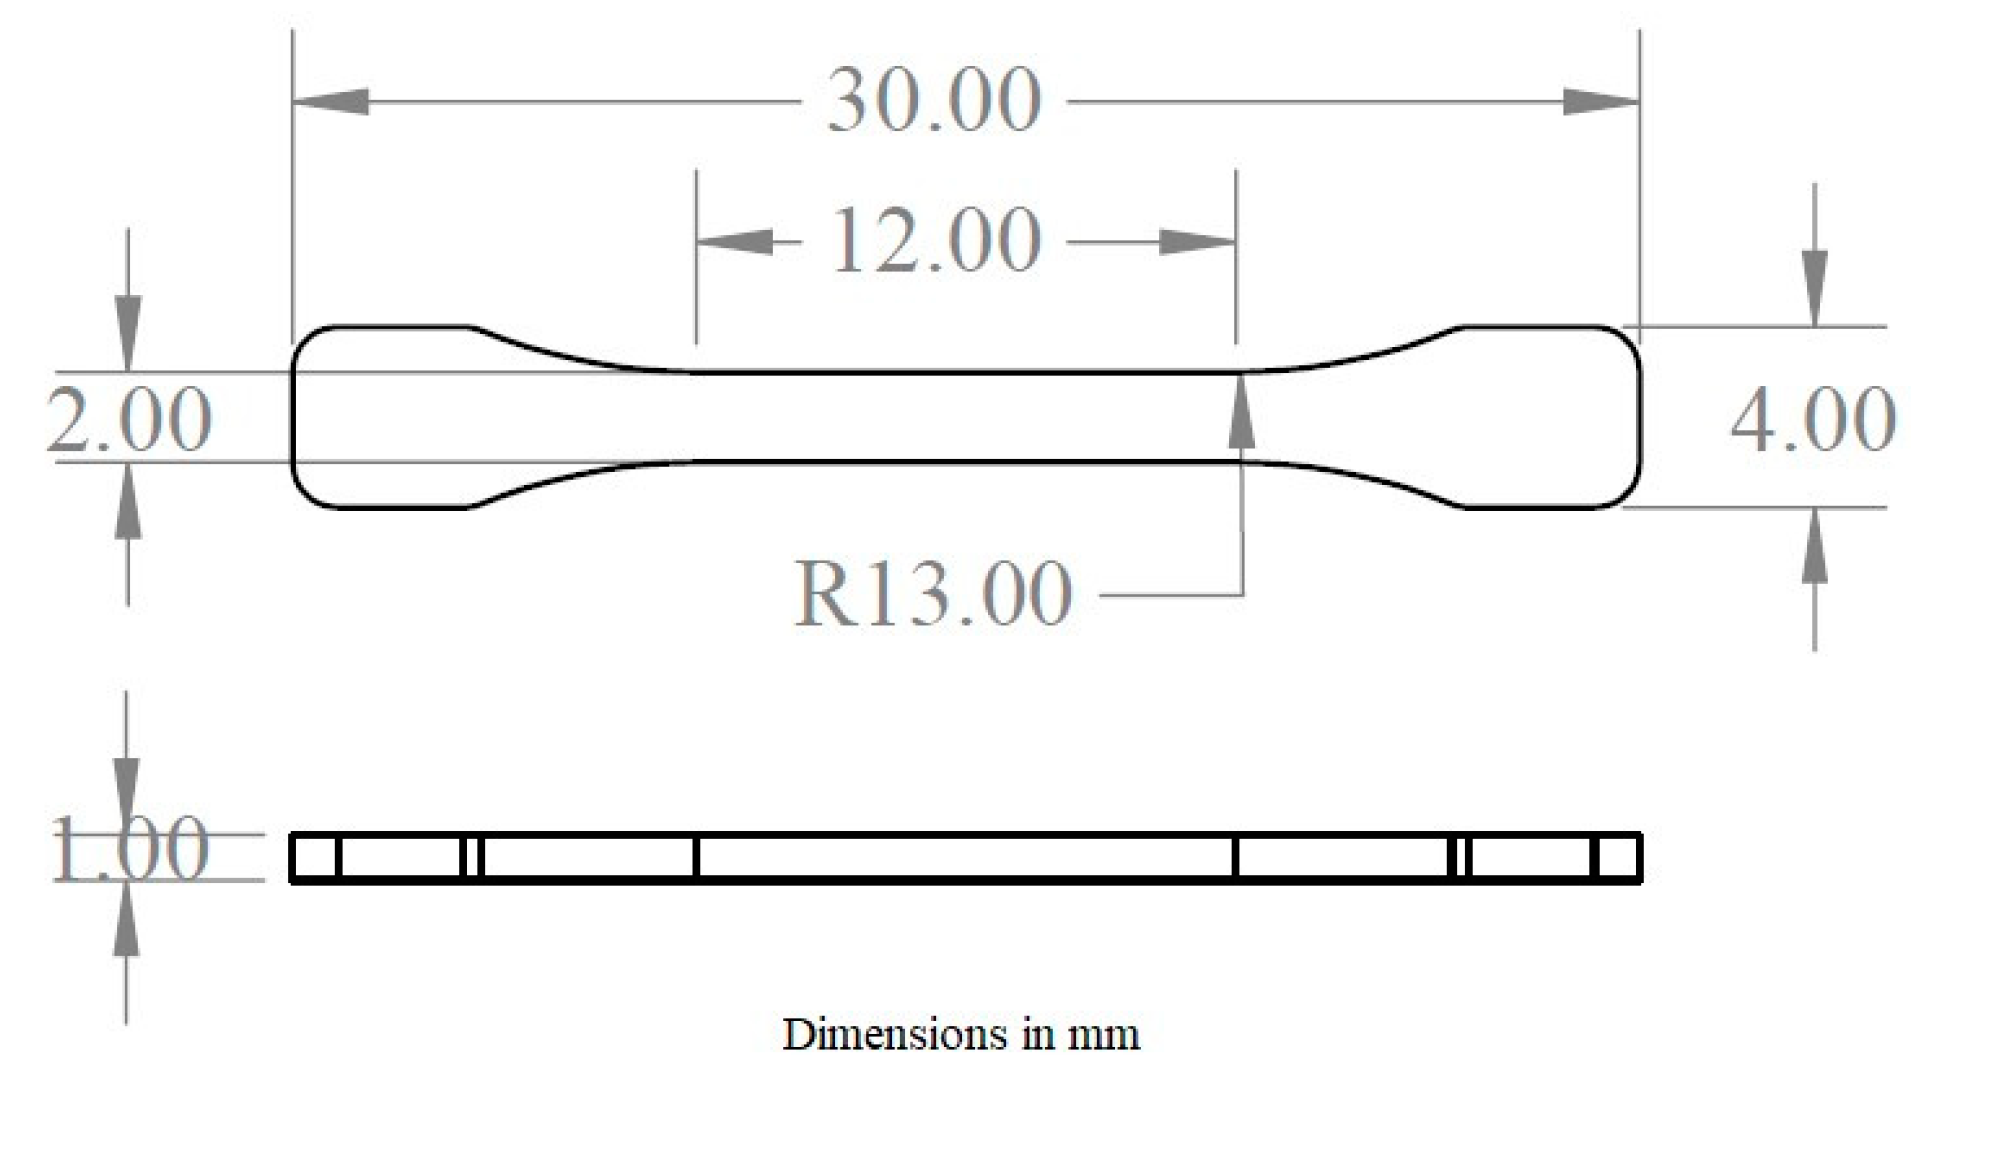
Figure 2.
Scaled ASTM D638 tensile specimen.
Figure 2.
Scaled ASTM D638 tensile specimen.
Figure 3.
Plunger position and injection velocity profile. The distance from the plunger (in its retracted position) to the tip of the sonotrode is divided into five intervals that are used to control the injection velocity.
Figure 3.
Plunger position and injection velocity profile. The distance from the plunger (in its retracted position) to the tip of the sonotrode is divided into five intervals that are used to control the injection velocity.
Figure 4.
Material preparation process. (a) Virgin material; (b) produce specimens by UMIM; (c) IKA analytical mill; (d) granulate material; (e) powder morphology shape obtained after grinding polypropylene (PP) specimens.
Figure 4.
Material preparation process. (a) Virgin material; (b) produce specimens by UMIM; (c) IKA analytical mill; (d) granulate material; (e) powder morphology shape obtained after grinding polypropylene (PP) specimens.
Figure 5.
Complete specimen with homogenous and translucid color before ejection.
Figure 5.
Complete specimen with homogenous and translucid color before ejection.
Figure 6.
Pareto plots for specimen: (a) mass, (b) yield stress, (c) ultimate stress, and (d) strain. Here, A: amplitude; B: shape; C: velocity; D: mold temperature.
Figure 6.
Pareto plots for specimen: (a) mass, (b) yield stress, (c) ultimate stress, and (d) strain. Here, A: amplitude; B: shape; C: velocity; D: mold temperature.
Figure 7.
Main effects plot for the four selected response variables: (a) mass, (b) yield stress, (c) ultimate stress, and (d) strain. All the plots coincide in a [2.5, 2.5, 2.5, 5.5, 5.5, 20] injection velocity profile and a temperature of 80 °C to enhance the responses. The amplitude could statistically be either 90% or 100%. However, a complete evaluation is explored through microscopy and mechanical testing.
Figure 8.
Worst defects found in samples from the base runs. (a–c) are porosity defects caused mainly by insufficient ultrasonic energy (due to amplitude). Images (d–f) show flow marks mainly due to high injection velocity.
Figure 8.
Worst defects found in samples from the base runs. (a–c) are porosity defects caused mainly by insufficient ultrasonic energy (due to amplitude). Images (d–f) show flow marks mainly due to high injection velocity.
Figure 9.
SEM micrographs comparison for the (a) virgin, (b) granulate and (c) powder materials. A homogeneous surface is observed without the presence of flow marks or porosities. No significant difference between the recycled samples and the virgin samples is observed. The micrographs suggest that a proper parameter combination in UMIM can produce homogeneous samples without surface finishing defects, even in the recycled materials.
Figure 10.
Stress–strain curves for virgin and recycled PP. (a) shows a significant increment of the tensile strength for the (1-cycle) recycled material. A slight improvement in strain is obtained for the powder samples. (b) Decreasing mechanical properties in specimens produced from PP powder by applying high injection velocity and low vibration amplitudes. The low strain value observed could be due to porous formation in the produced specimens that cause stress concentrations.
Figure 11.
Stress–strain curves for five consecutive reprocessing cycles. Results shows that recycled material can withstand up to five cycles without showing a considerable reduction in mechanical properties.
Figure 11.
Stress–strain curves for five consecutive reprocessing cycles. Results shows that recycled material can withstand up to five cycles without showing a considerable reduction in mechanical properties.
Figure 12.
Thermal degradation of PP. (a) TGA measurements of three different sections of a specimen compared to the unprocessed material, the difference along the sample suggest an effect of the drop pressure and residence time. (b) TGA measurements performed in specimens manufactured by UMIM from recycle materials.
Figure 13.
FTIR shows the comparison of the spectra between the reference material, the virgin specimen, and the recycled specimens.
Figure 13.
FTIR shows the comparison of the spectra between the reference material, the virgin specimen, and the recycled specimens.
Figure 14.
DSC experimental curves recorded for the reference material and for the recycle material: (a) melting temperature; (b) crystallization temperature.
Figure 14.
DSC experimental curves recorded for the reference material and for the recycle material: (a) melting temperature; (b) crystallization temperature.
Figure 15.
(a) Shear viscosity; (b) storage and loss moduli for the raw virgin PP and for the specimen produced with virgin PP material.
Figure 15.
(a) Shear viscosity; (b) storage and loss moduli for the raw virgin PP and for the specimen produced with virgin PP material.
Figure 16.
(a) Storage and (b) loss moduli for the consecutive recycling of PP.
Figure 16.
(a) Storage and (b) loss moduli for the consecutive recycling of PP.
Figure 17.
(a) Loss phase angle; (b) vector diagram for complex shear modulus.
Figure 17.
(a) Loss phase angle; (b) vector diagram for complex shear modulus.
Figure 18.
Plot of the loss modulus (G’’) versus the natural logarithm of frequency (ω), for the raw PP and the processing cycles, at 200 °C. The complete curves exhibit almost a symmetrical shape-form, satisfying the criteria needed to estimate the plateau modulus with Equation (10).
Figure 18.
Plot of the loss modulus (G’’) versus the natural logarithm of frequency (ω), for the raw PP and the processing cycles, at 200 °C. The complete curves exhibit almost a symmetrical shape-form, satisfying the criteria needed to estimate the plateau modulus with Equation (10).
Table 1.
Screening table used to test combinations and obtain proper values for the design of experiment (DOE). The injection velocity profiles are V1: [2.5, 2.5, 5.5, 5.5, 5.5, 20], V2: [5.5, 5.5, 5.5, 5.5, 5.5, 20] and V3: [6, 6, 6, 7, 8, 20] (mm/s).
Table 1.
Screening table used to test combinations and obtain proper values for the design of experiment (DOE). The injection velocity profiles are V1: [2.5, 2.5, 5.5, 5.5, 5.5, 20], V2: [5.5, 5.5, 5.5, 5.5, 5.5, 20] and V3: [6, 6, 6, 7, 8, 20] (mm/s).
| Parameter | Experiments |
| A (%) | 80 | 90 | 100 |
| V (mm/s) | V1, V2, V3 | V1, V2, V3 | V1, V2, V3 |
| MT (°C) | 40, 60 | 40, 60 | 40, 60 |
| F (N) | 3000, 6000 | 3000, 6000 | 3000, 6000 |
Table 2.
Screening combinations that delivered at least three complete specimens, denoted by a letter C.
Table 2.
Screening combinations that delivered at least three complete specimens, denoted by a letter C.
| Combination | 1 | 2 | 3 | 4 | 5 |
|---|
| 80/V2/40/3000 | C | C | C | - | - |
| 90/V1/60/6000 | - | C | - | C | C |
| 90/V3/60/3000 | C | - | C | - | C |
| 100/V1/60/3000 | - | - | C | C | C |
Table 3.
General full factorial design. The injection velocity profiles are VA: [2.5, 2.5, 2.5, 5.5, 5.5, 20], VB: [5.5, 5.5, 5.5, 5.5, 5.5, 20].
Table 3.
General full factorial design. The injection velocity profiles are VA: [2.5, 2.5, 2.5, 5.5, 5.5, 20], VB: [5.5, 5.5, 5.5, 5.5, 5.5, 20].
| Parameter | Level 1 | Level 2 | Level 3 |
|---|
| A (%) | 90 | 100 | - |
| V (mm/s) | A | B | - |
| MT (°C) | 80 | 90 | - |
| F (N) | 3000 | 3000 | 3000 |
| Shape | Virgin | Granulate | Powder |
Table 4.
General full factorial design. The injection velocity profiles are VA: [2.5, 2.5, 2.5, 5.5, 5.5, 20], VB: [5.5, 5.5, 5.5, 5.5, 5.5, 20].
Table 4.
General full factorial design. The injection velocity profiles are VA: [2.5, 2.5, 2.5, 5.5, 5.5, 20], VB: [5.5, 5.5, 5.5, 5.5, 5.5, 20].
| Label | A (%) | Shape | V (mm/s) | MT (°C) | Mass (mg) | Yield Stress (MPa) | Strain (mm/mm) | Ultimate Stress (MPa) |
|---|
| R1 | 90 | Virgin | A | 90 | 68.461 | 84.577 | 8.024 | 40.276 |
| R2 | 90 | Virgin | B | 80 | 72.561 | 66.831 | 1.389 | 26.367 |
| R3 | 100 | Granulate | A | 80 | 67.284 | 59.462 | 4.025 | 29.501 |
| R4 | 90 | Granulate | B | 90 | 56.396 | 53.879 | 2.361 | 26.950 |
| R5 | 100 | Granulate | B | 80 | 62.539 | 62.211 | 4.017 | 35.205 |
| R6 | 90 | Powder | A | 90 | 64.207 | 55.117 | 0.606 | 23.241 |
| R7 | 90 | Granulate | B | 80 | 66.167 | 54.101 | 4.152 | 29.653 |
| R8 | 100 | Powder | A | 80 | 65.783 | 59.266 | 6.775 | 38.073 |
| R9 | 100 | Virgin | A | 90 | 64.986 | 46.447 | 0.085 | 21.398 |
| R10 | 100 | Virgin | B | 90 | 63.267 | 45.128 | 0.067 | 23.551 |
| R11 | 100 | Powder | B | 90 | 65.299 | 52.442 | 2.655 | 23.252 |
| R12 | 100 | Powder | A | 90 | 66.556 | 57.060 | 2.788 | 27.916 |
| R13 | 90 | Powder | B | 80 | 62.777 | 51.780 | 2.551 | 24.314 |
| R14 | 90 | Virgin | B | 90 | 61.440 | 56.993 | 3.383 | 28.283 |
| R15 | 100 | Granulate | B | 90 | 64.097 | 57.665 | 6.829 | 28.211 |
| R16 | 90 | Granulate | A | 80 | 64.357 | 54.444 | 2.704 | 23.658 |
| R17 | 90 | Granulate | A | 90 | 63.414 | 64.913 | 3.038 | 32.218 |
| R18 | 100 | Virgin | B | 80 | 64.204 | 69.030 | 2.966 | 34.959 |
| R19 | 100 | Virgin | A | 80 | 64.499 | 57.884 | 6.125 | 33.014 |
| R20 | 90 | Powder | B | 90 | 65.531 | 60.055 | 6.024 | 22.758 |
| R21 | 90 | Virgin | A | 80 | 67.886 | 56.789 | 5.505 | 32.844 |
| R22 | 90 | Powder | A | 80 | 66.747 | 64.658 | 6.345 | 31.619 |
| R23 | 100 | Granulate | A | 90 | 66.311 | 62.364 | 3.078 | 31.551 |
| R24 | 100 | Powder | B | 80 | 63.964 | 49.737 | 0.188 | 25.641 |
| R1 | 90 | Virgin | A | 90 | 67.379 | 58.931 | 4.186 | 27.080 |
| R2 | 90 | Virgin | B | 80 | 71.747 | 61.247 | 0.263 | 24.870 |
| R3 | 100 | Granulate | A | 80 | 68.024 | 62.255 | 4.475 | 40.750 |
| R4 | 90 | Granulate | B | 90 | 57.921 | 59.702 | 2.237 | 28.448 |
| R5 | 100 | Granulate | B | 80 | 64.630 | 63.248 | 4.567 | 31.328 |
| R6 | 90 | Powder | A | 90 | 64.611 | 54.987 | 0.300 | 27.031 |
| R7 | 90 | Granulate | B | 80 | 66.967 | 57.388 | 0.173 | 14.223 |
| R8 | 100 | Powder | A | 80 | 68.073 | 54.888 | 4.900 | 31.527 |
| R9 | 100 | Virgin | A | 90 | 66.756 | 41.274 | 0.057 | 24.320 |
| R10 | 100 | Virgin | B | 90 | 62.267 | 54.971 | 1.223 | 22.516 |
| R11 | 100 | Powder | B | 90 | 65.494 | 56.860 | 1.184 | 25.397 |
| R12 | 100 | Powder | A | 90 | 66.723 | 49.939 | 0.203 | 26.039 |
| R13 | 90 | Powder | B | 80 | 57.559 | 55.175 | 0.163 | 25.456 |
| R14 | 90 | Virgin | B | 90 | 63.689 | 46.060 | 0.115 | 20.442 |
| R15 | 100 | Granulate | B | 90 | 64.533 | 63.504 | 3.530 | 32.127 |
| R16 | 90 | Granulate | A | 80 | 62.027 | 53.452 | 4.940 | 26.374 |
| R17 | 90 | Granulate | A | 90 | 66.897 | 65.330 | 5.541 | 31.732 |
| R18 | 100 | Virgin | B | 80 | 64.396 | 54.927 | 0.072 | 23.332 |
| R19 | 100 | Virgin | A | 80 | 64.020 | 53.315 | 3.825 | 22.194 |
| R20 | 90 | Powder | B | 90 | 63.003 | 56.085 | 2.642 | 29.942 |
| R21 | 90 | Virgin | A | 80 | 68.390 | 83.062 | 3.404 | 41.963 |
| R22 | 90 | Powder | A | 80 | 60.870 | 58.557 | 3.634 | 26.955 |
| R23 | 100 | Granulate | A | 90 | 61.879 | 53.147 | 1.708 | 24.597 |
| R24 | 100 | Powder | B | 80 | 65.954 | 53.990 | 3.856 | 27.842 |
Table 5.
Experimental data confirm an improvement of the mechanical properties of recycled samples. The improvement percentage (in parenthesis) is determined with respect to the virgin PP material specimen properties.
Table 5.
Experimental data confirm an improvement of the mechanical properties of recycled samples. The improvement percentage (in parenthesis) is determined with respect to the virgin PP material specimen properties.
| Sample | Average Young’s Modulus (MPa) | Average Yield Stress (MPa) | Average Ultimate Stress (MPa) | Average Maximum Strain (mm/mm) |
|---|
| Virgin | 561.39 | 24.14 | 29.67 | 5.348 |
| Granulate | 578.66 (+3.07%) | 26.79 (+10.97%) | 37.78 (+27.33%) | 5.279 (−1.29%) |
| Powder | 510.07 (−9.14%) | 25.13 (+4.10%) | 33.07 (+11.46%) | 5.478 (+2.43%) |
Table 6.
The results show a strengthening of the recycled samples for 4-cycles regrind. Notice a slight reduction of the ultimate stress and average toughness values for samples made from material regrind 5-cycles.
Table 6.
The results show a strengthening of the recycled samples for 4-cycles regrind. Notice a slight reduction of the ultimate stress and average toughness values for samples made from material regrind 5-cycles.
| Sample | Average Young’s Modulus (MPa) | Average Yield Stress (MPa) | Average Ultimate Stress (MPa) | Average Maximum Strain (mm/mm) | Average Toughness (MJ/m3) |
|---|
| 0 cycles (virgin) | 561.39 | 24.14 | 29.67 | 5.35 | 120.40 |
| 1 cycle regrind | 578.66 (+3.07%) | 26.79 (+10.97%) | 37.78 (+27.33%) | 5.28 (−1.30%) | 151.33 (+25.68%) |
| 2 cycles regrind | 547.45 (−2.48%) | 24.65 (+2.11%) | 32.4 (+9.20%) | 7.74 (+44.67%) | 180.82 (+50.18%) |
| 3 cycles regrind | 517.15 (−7.88%) | 24.47 (+1.36%) | 31.23 (+5.25%) | 7.31 (+36.63%) | 171.03 (+42.05%) |
| 4 cycles regrind | 767.27 (+36.66%) | 29.01 (+20.17%) | 33.68 (+13.51%) | 6.76 (+26.35%) | 178.31 (+48.09%) |
| 5 cycles regrind | 679.79 (+21.09%) | 25.98 (+7.62%) | 23.67 (−20.22%) | 5.23 (−2.24%) | 107.24 (−10.93%) |
Table 7.
Thermogravimetric analysis performed in the raw reference material and in recycle material. There is a significant decrease of the temperature at which degradation starts. After the first recycling of the specimen made from raw PP material, the regrind material preserves its thermal resistance.
| Sample | Degradation (°C) | 50 wt % Loss (°C) | 100 wt % Loss (°C) |
|---|
| 0 cycles (virgin) | 364 | 463 | 496 |
| 1 cycle regrind | 280 | 433 | 477 |
| 2 cycle regrind | 265 | 411 | 460 |
| 3 cycle regrind | 250 | 410 | 460 |
| 4 cycle regrind | 275 | 408 | 459 |
| 4 cycle regrind | 285 | 417 | 465 |
Table 8.
Results were obtained by differential scanning calorimetry (DSC) experimental characterization tests. The melting and crystallization temperatures show an oscillating behavior over the recycling history. The ultrasonic plasticizing made the material more amorphous, as shown in the degree of crystallinity achieved.
| Sample | Melting Temperature (°C) | Enthalpy
(J/g) | Crystallization
Temperature (°C) | Crystallinity
(%) |
|---|
| Virgin PP | 148.0 | 75 | 118.7 | 36.2 |
| 0 cycles (virgin) | 148.8 | 66 | 118.6 | 31.9 |
| 1 cycle regrind | 146.0 | 70 | 119.1 | 33.8 |
| 2 cycles regrind | 145.1 | 63 | 119.5 | 30.4 |
| 3 cycles regrind | 145.0 | 65 | 119.1 | 31.4 |
| 4 cycles regrind | 144.9 | 68 | 118.7 | 32.8 |
| 5 cycles regrind | 148.9 | 67 | 119.0 | 32.3 |
Table 9.
Molecular weight data obtained from experimental rheological tests.
Table 9.
Molecular weight data obtained from experimental rheological tests.
| Sample | η0 (Pa·s) | Mw (g/mol) | Crossover
Modulus (Pa) | PDI | Mn (g/mol) |
|---|
| Virgin PP | 12,040 | 556,148 | 27,000 | 3.70 | 150,310 |
| 0 cycles (virgin) | 5059 | 437,109 | 23,600 | 4.23 | 103,335 |
| 1 cycle regrind | 4057 | 411,114 | 24,300 | 4.11 | 100,027 |
| 2 cycles regrind | 3417 | 391,969 | 25,000 | 4.00 | 97,992 |
| 3 cycles regrind | 1873 | 331,682 | 23,300 | 4.29 | 77,315 |
| 4 cycles regrind | 1652 | 320,313 | 19,400 | 5.15 | 62,197 |
| 5 cycles regrind | 1144 | 289,232 | 17,900 | 5.58 | 51,834 |
Table 10.
Molecular data regarding to plateau moduli, molecular weight between entanglements, weight average molecular weight, and polydispersity.
Table 10.
Molecular data regarding to plateau moduli, molecular weight between entanglements, weight average molecular weight, and polydispersity.
| Sample | | Me (g/mol) | Mw (g/mol) | Mn/Mn |
|---|
| Virgin PP(Pellets) | 442,560 | 6798 | 556,148 | 3.70 |
| 0 cycles (virgin) | 359,000 | 8380 | 437,109 | 4.23 |
| 1 cycle regrind | 249,900 | 12,038 | 411,114 | 4.11 |
| 2 cycles regrind | 199,840 | 15,054 | 391,969 | 4.00 |
| 3 cycles regrind | 228,910 | 13,142 | 331,682 | 4.29 |
| 4 cycles regrind | 172,810 | 17,409 | 320,313 | 5.15 |
| 5 cycles regrind | 143,890 | 20,907 | 289,232 | 5.58 |

 ,
, 


