Moisture Absorption Effects on Mode II Delamination of Carbon/Epoxy Composites


 ,
,  , and
, and
Abstract
: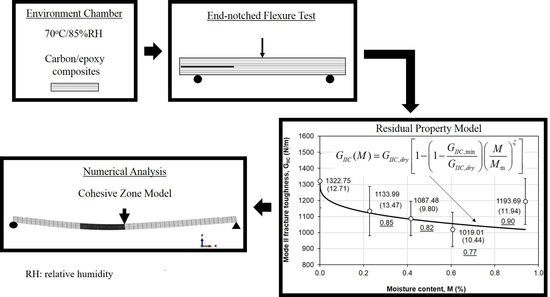
1. Introduction
2. Materials and Methods
2.1. Materials and Specimens
2.2. Moisture Absorption Test
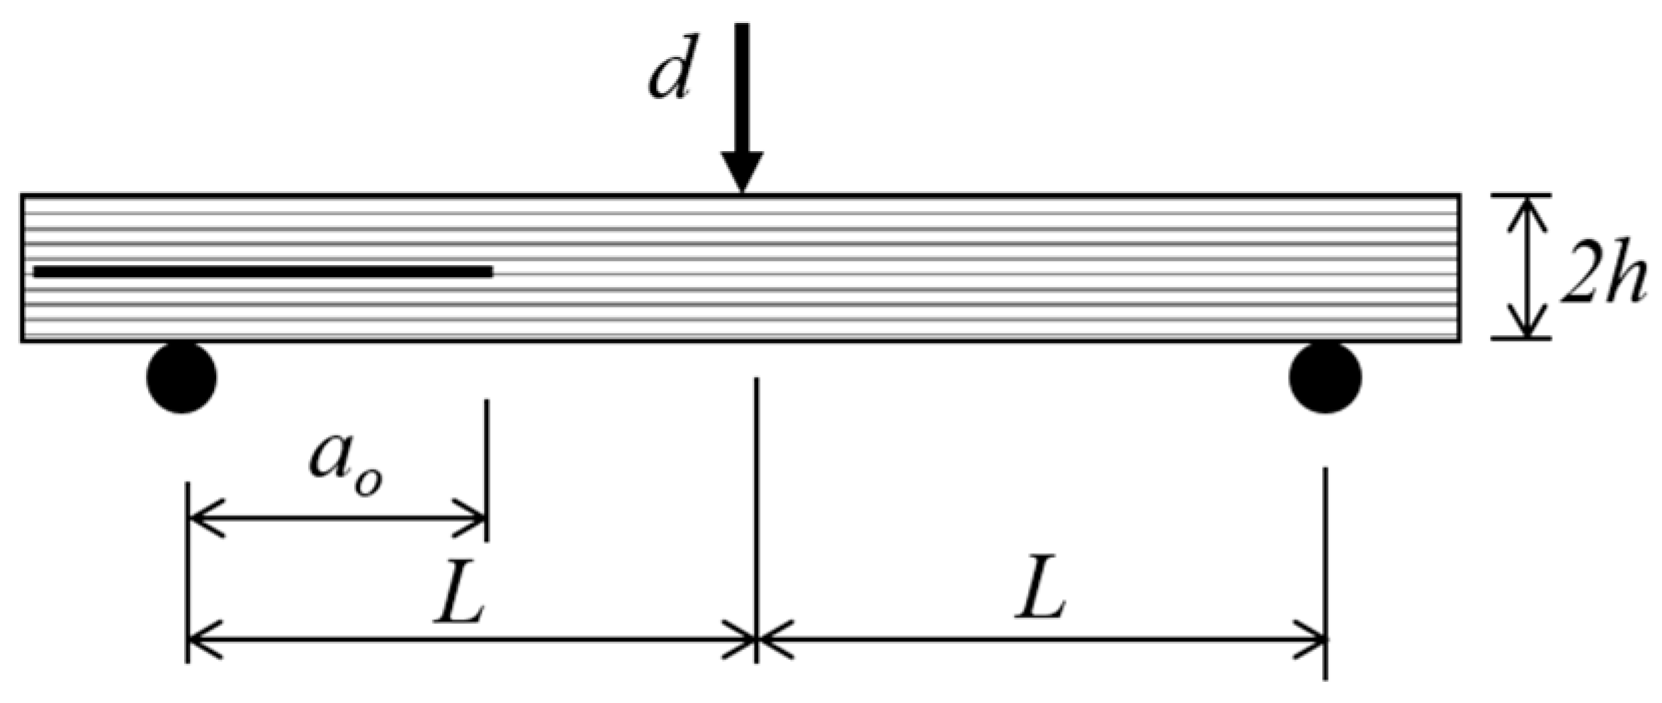
2.3. Mode II Delamination Test
2.4. Date Reduction Scheme
3. Experimental Results and Discussion
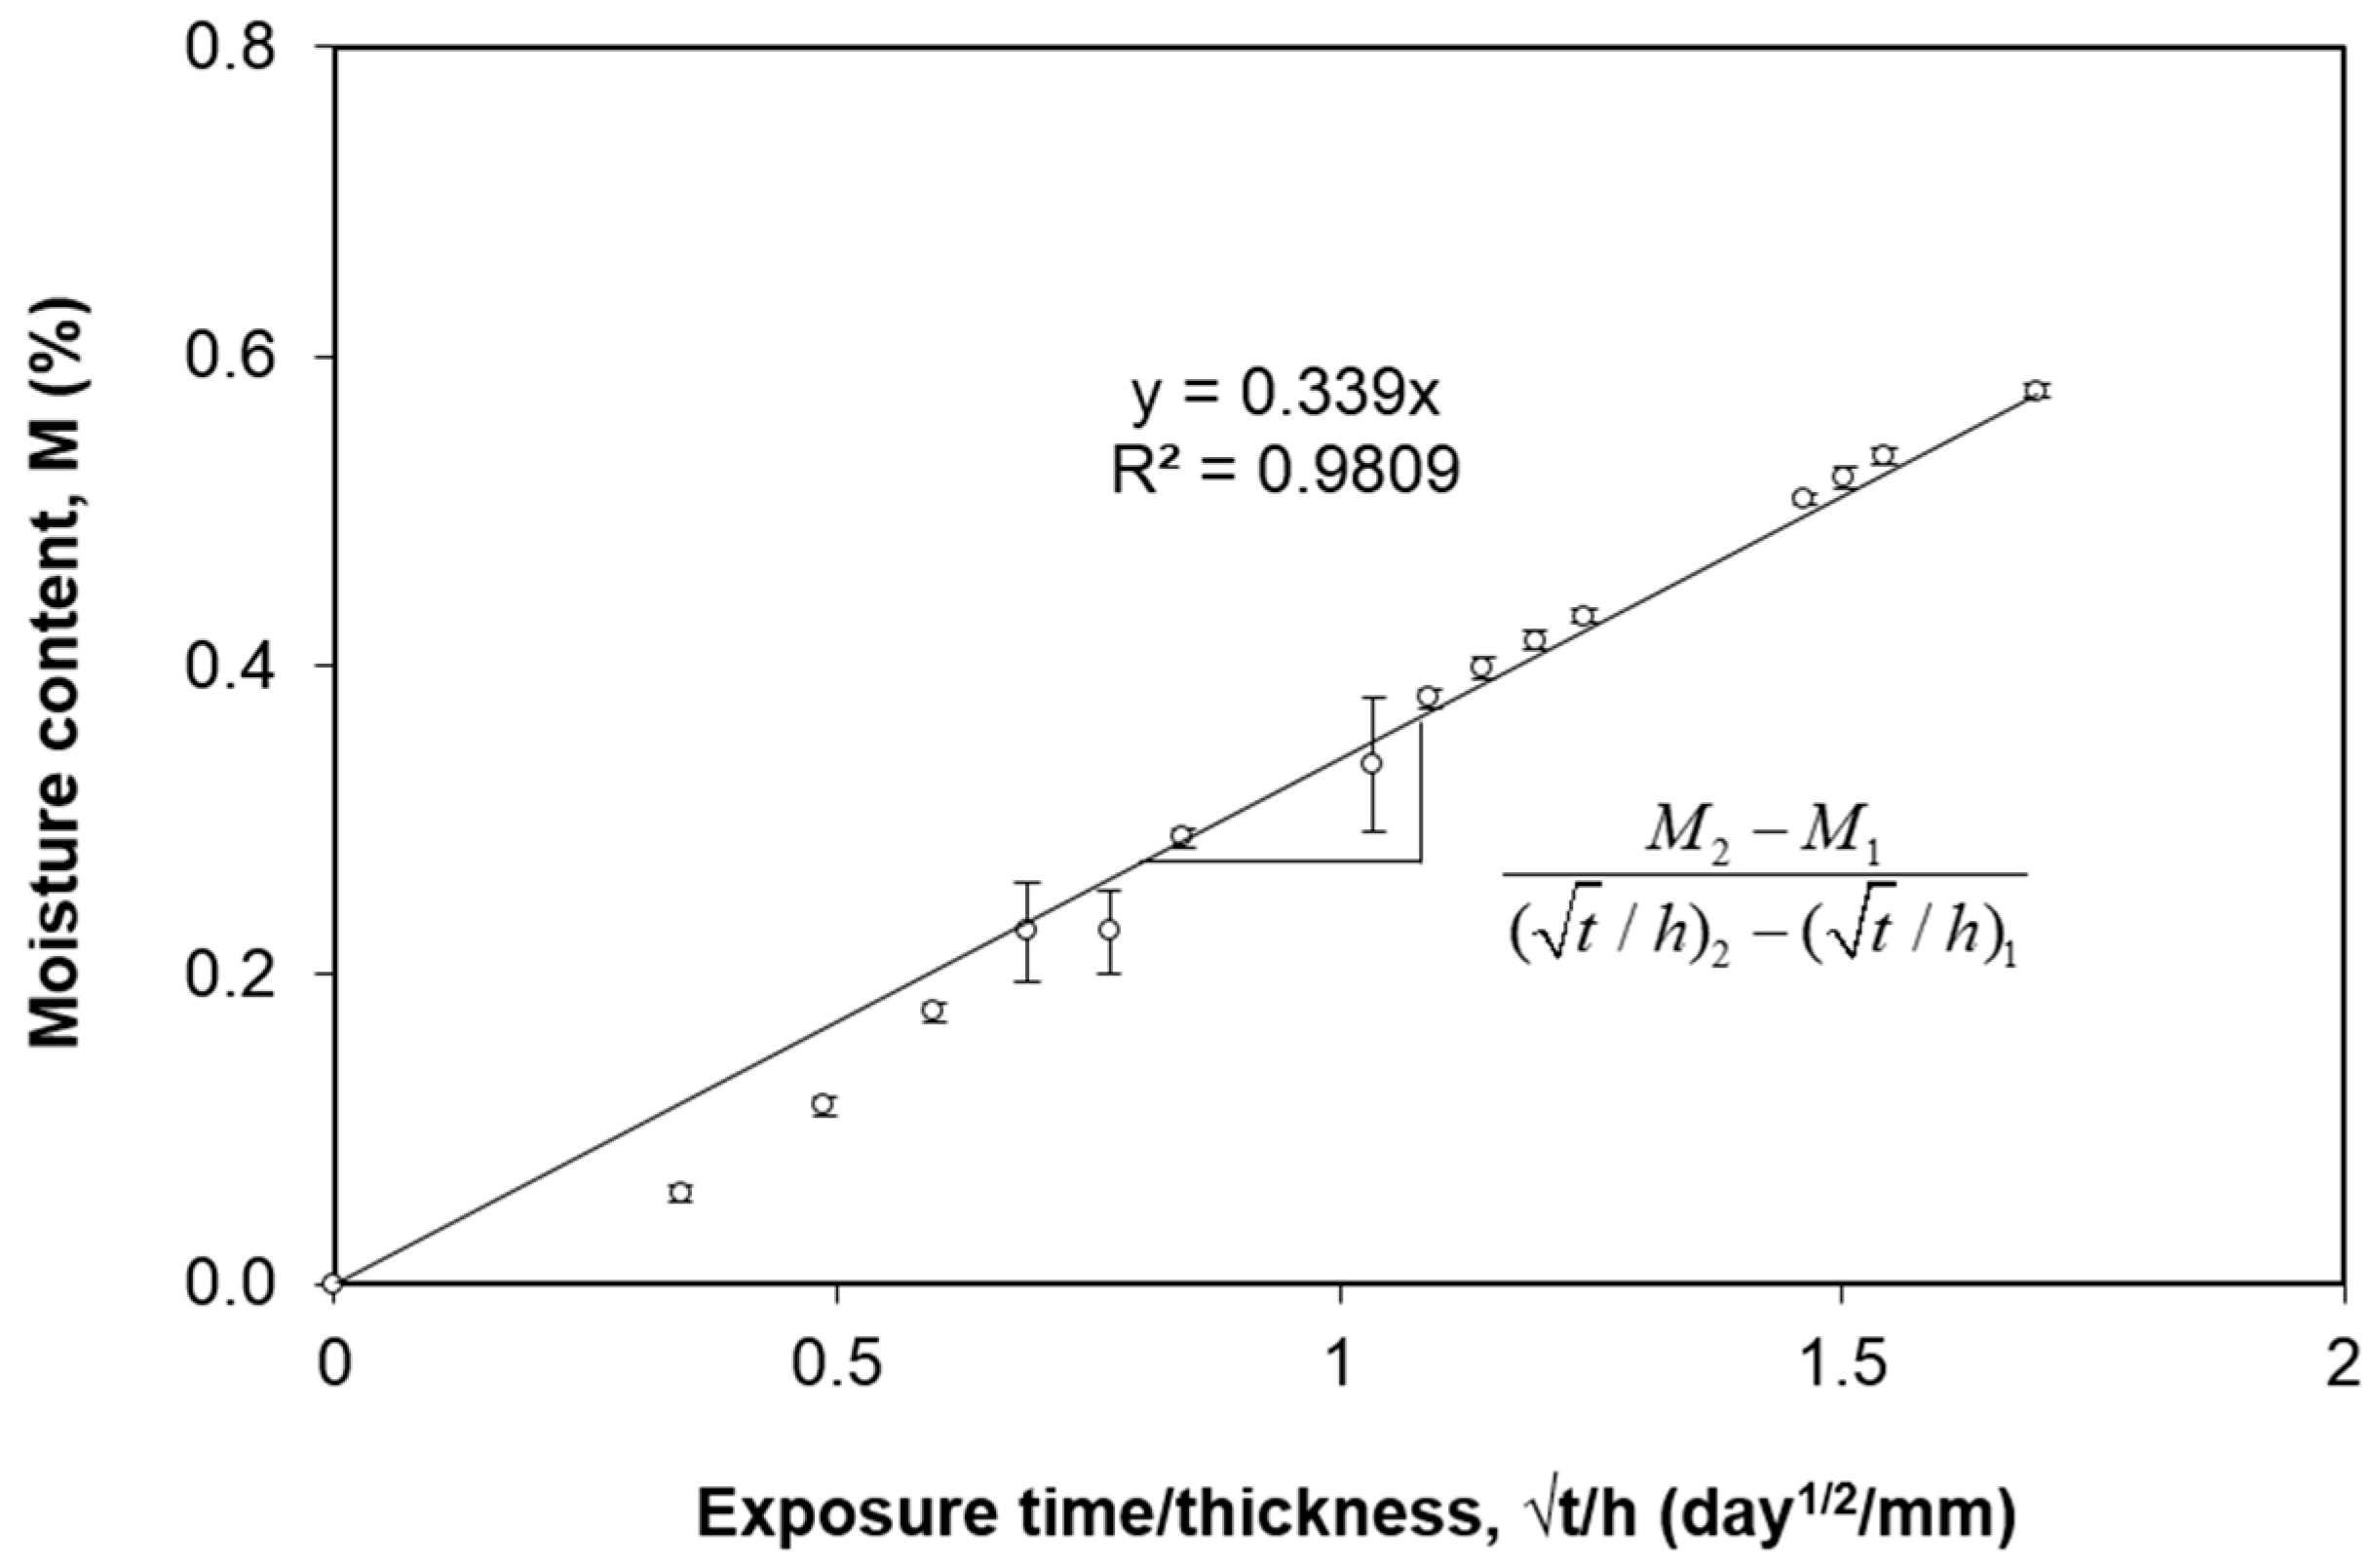
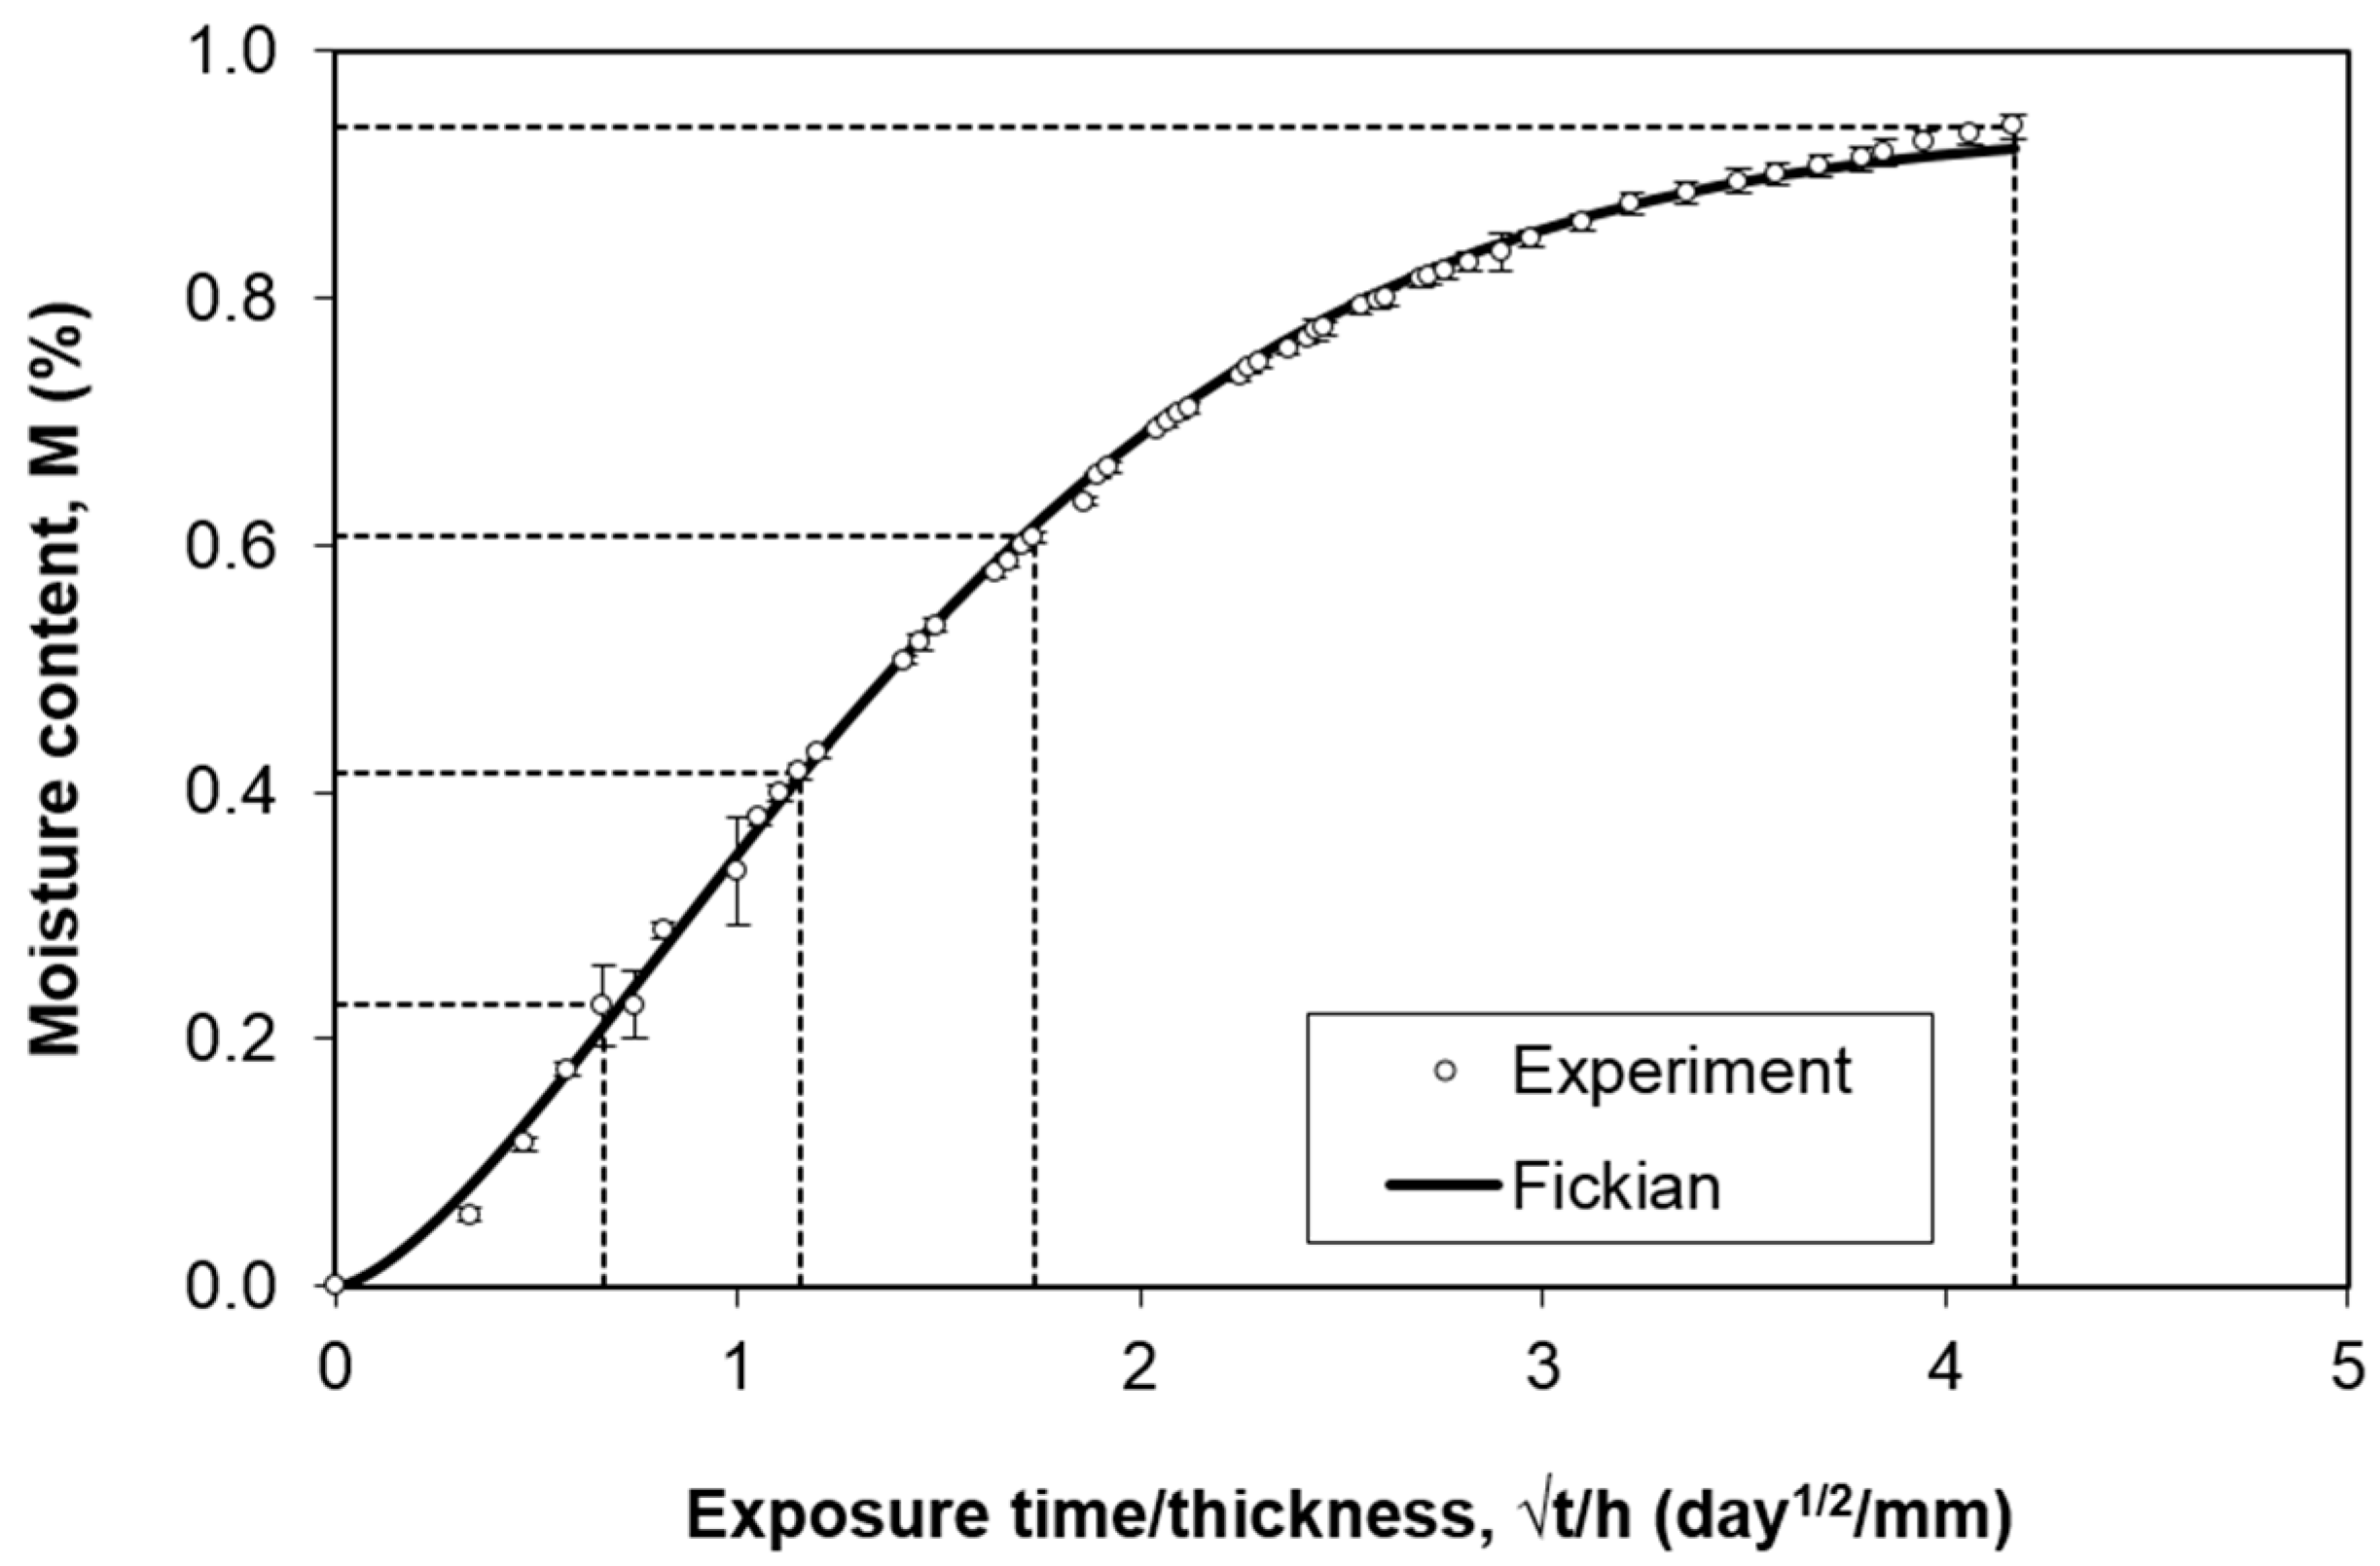
3.1. Moisture Absorption Curves
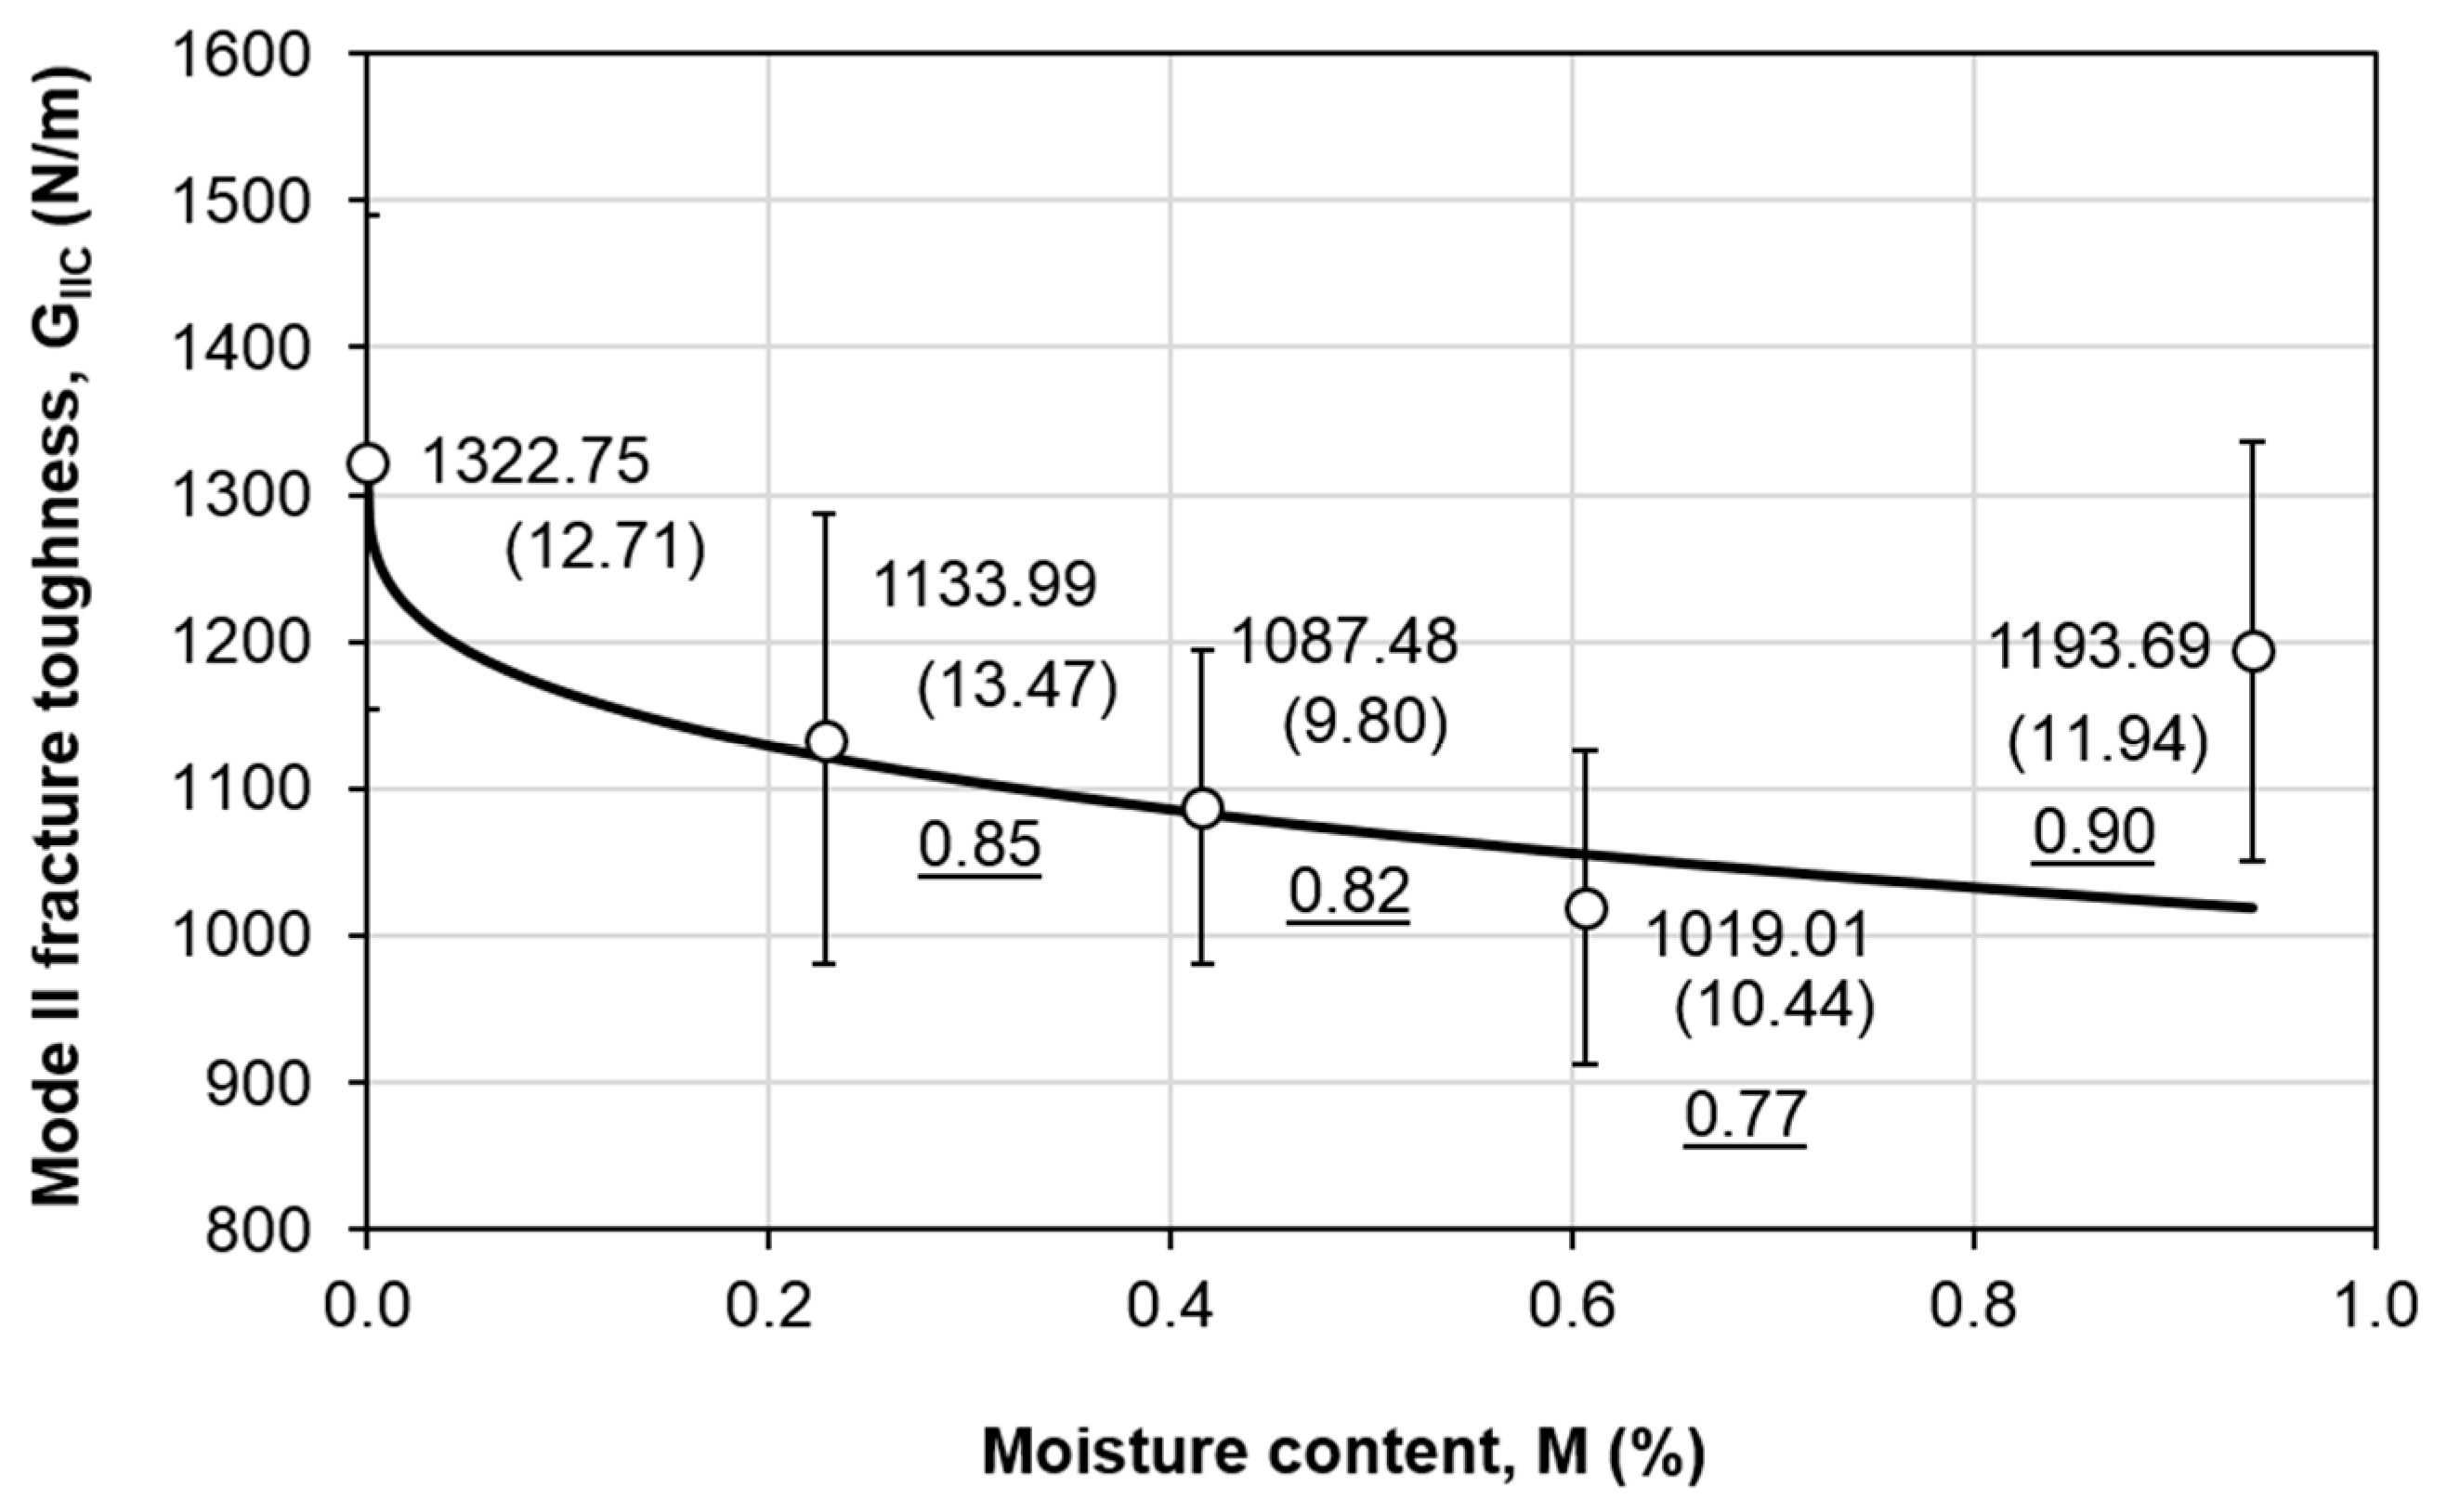
3.2. Mode II Fracture Toughness
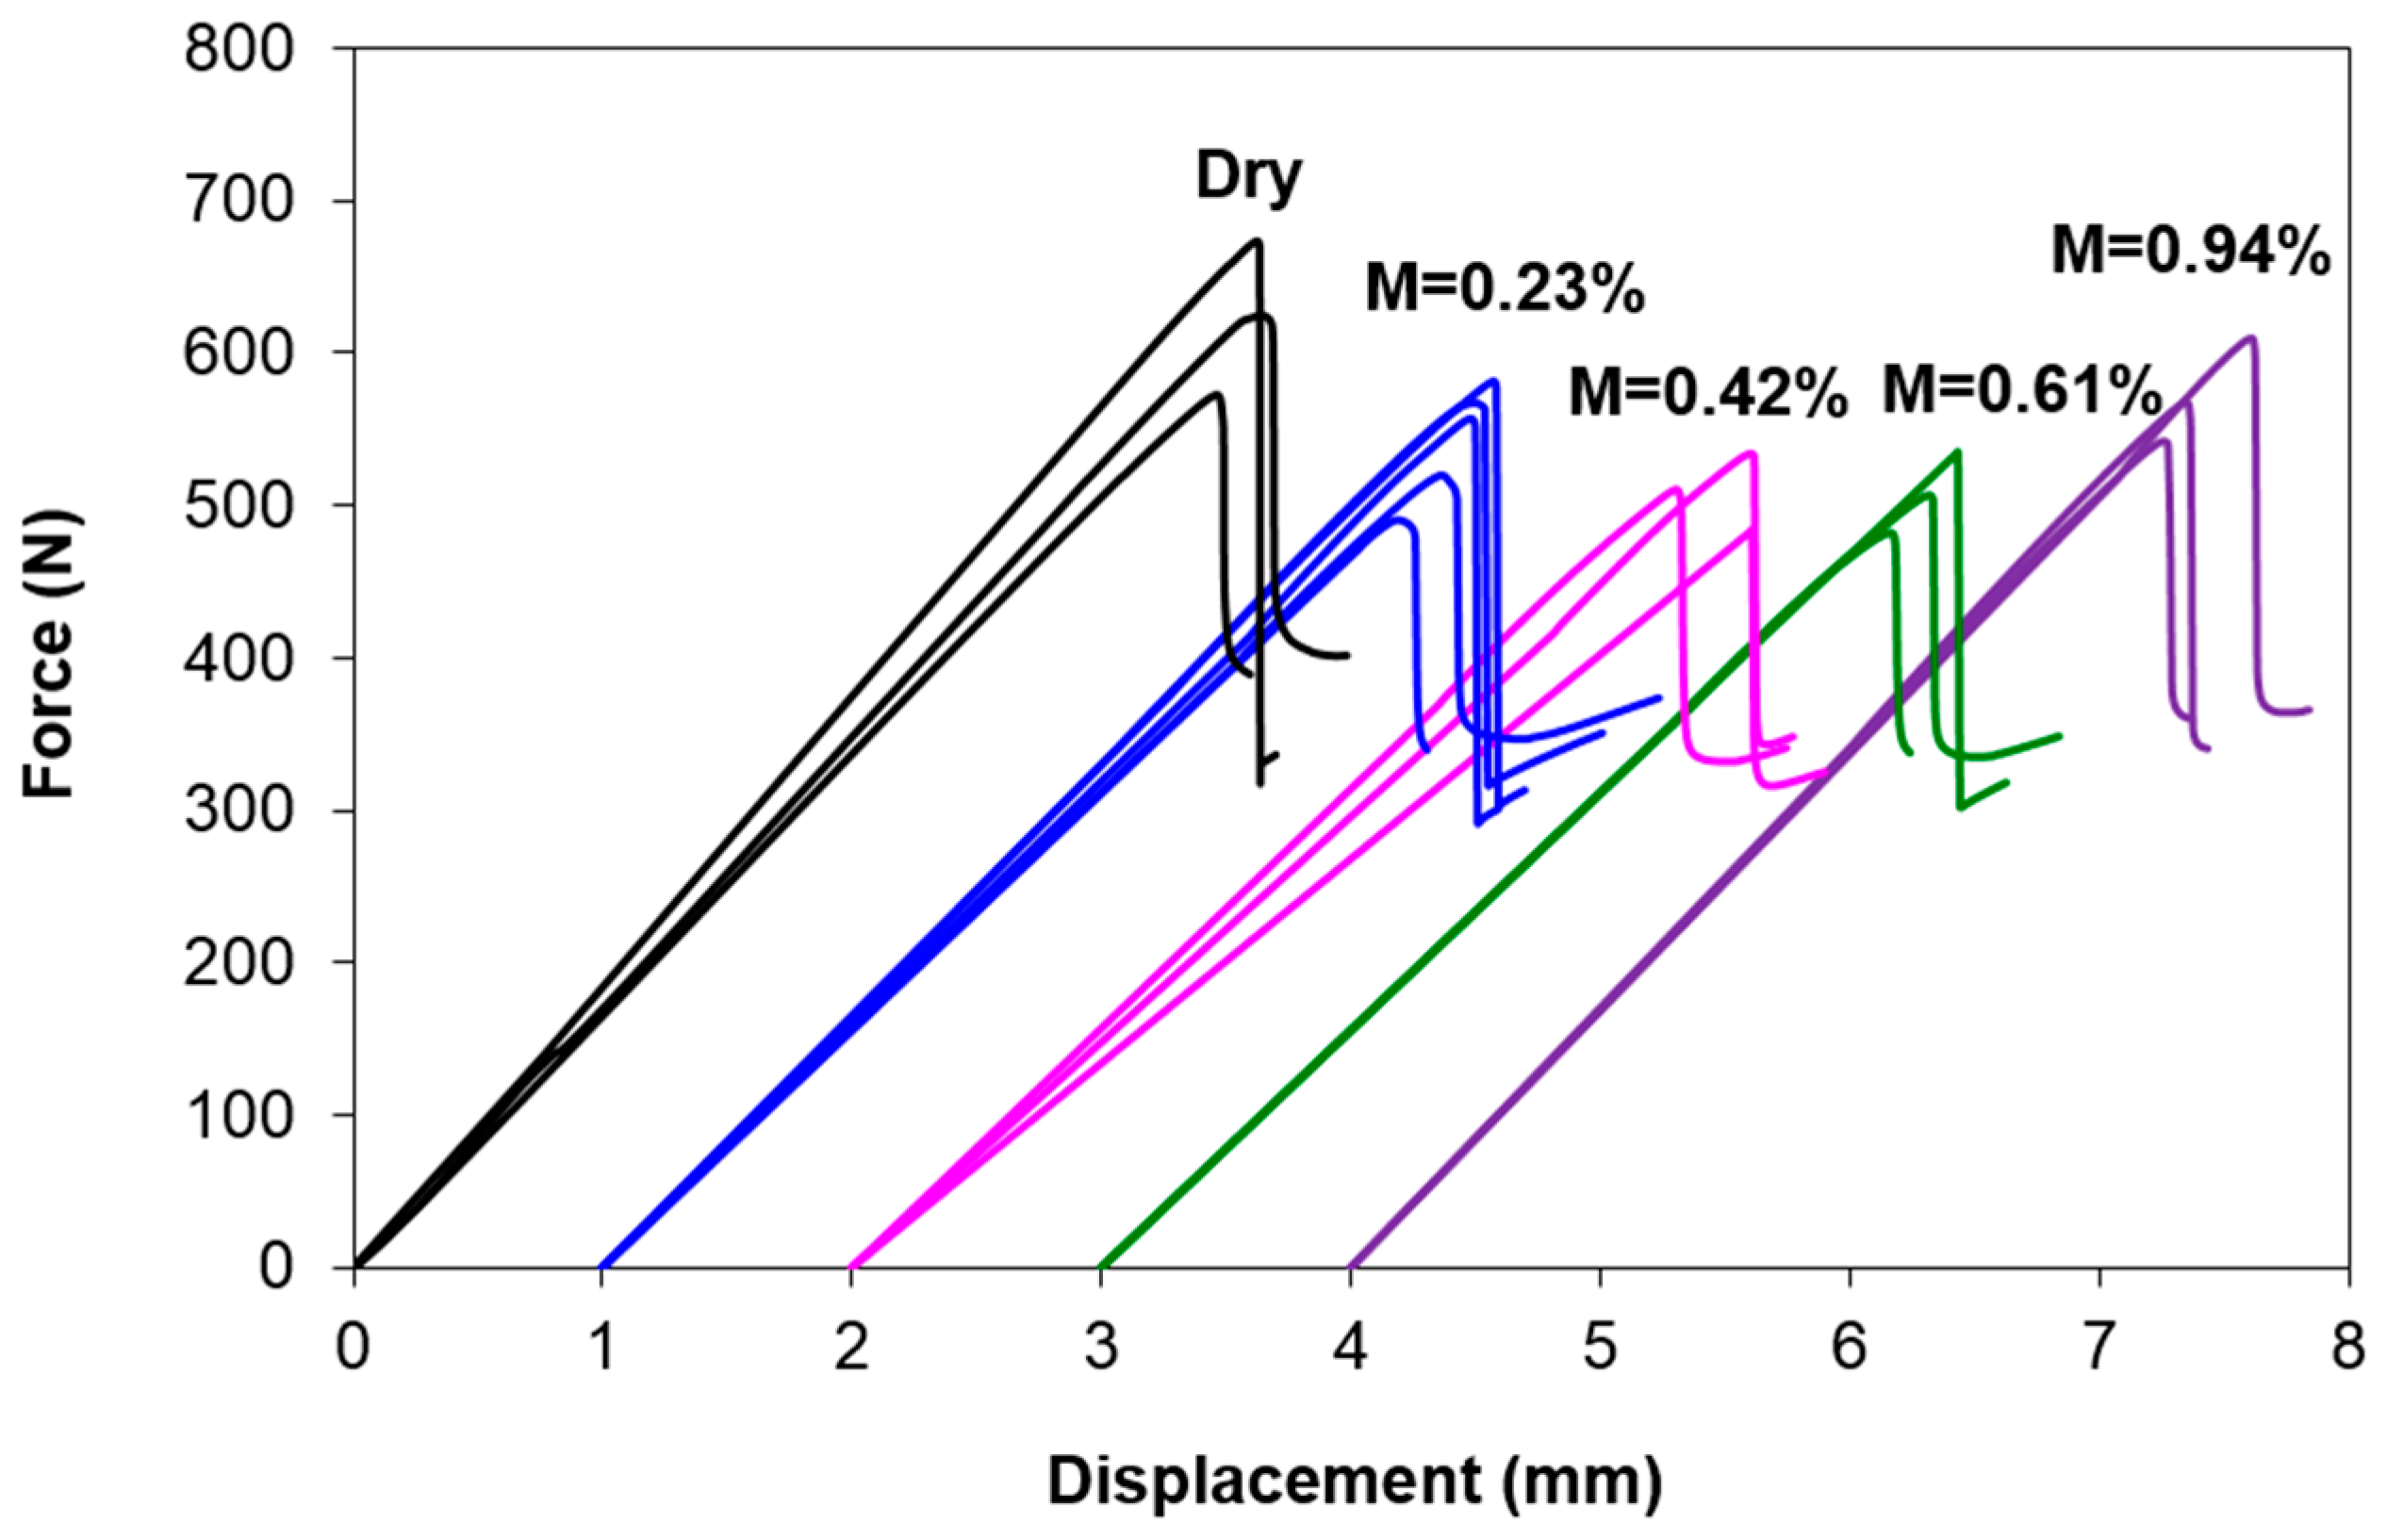
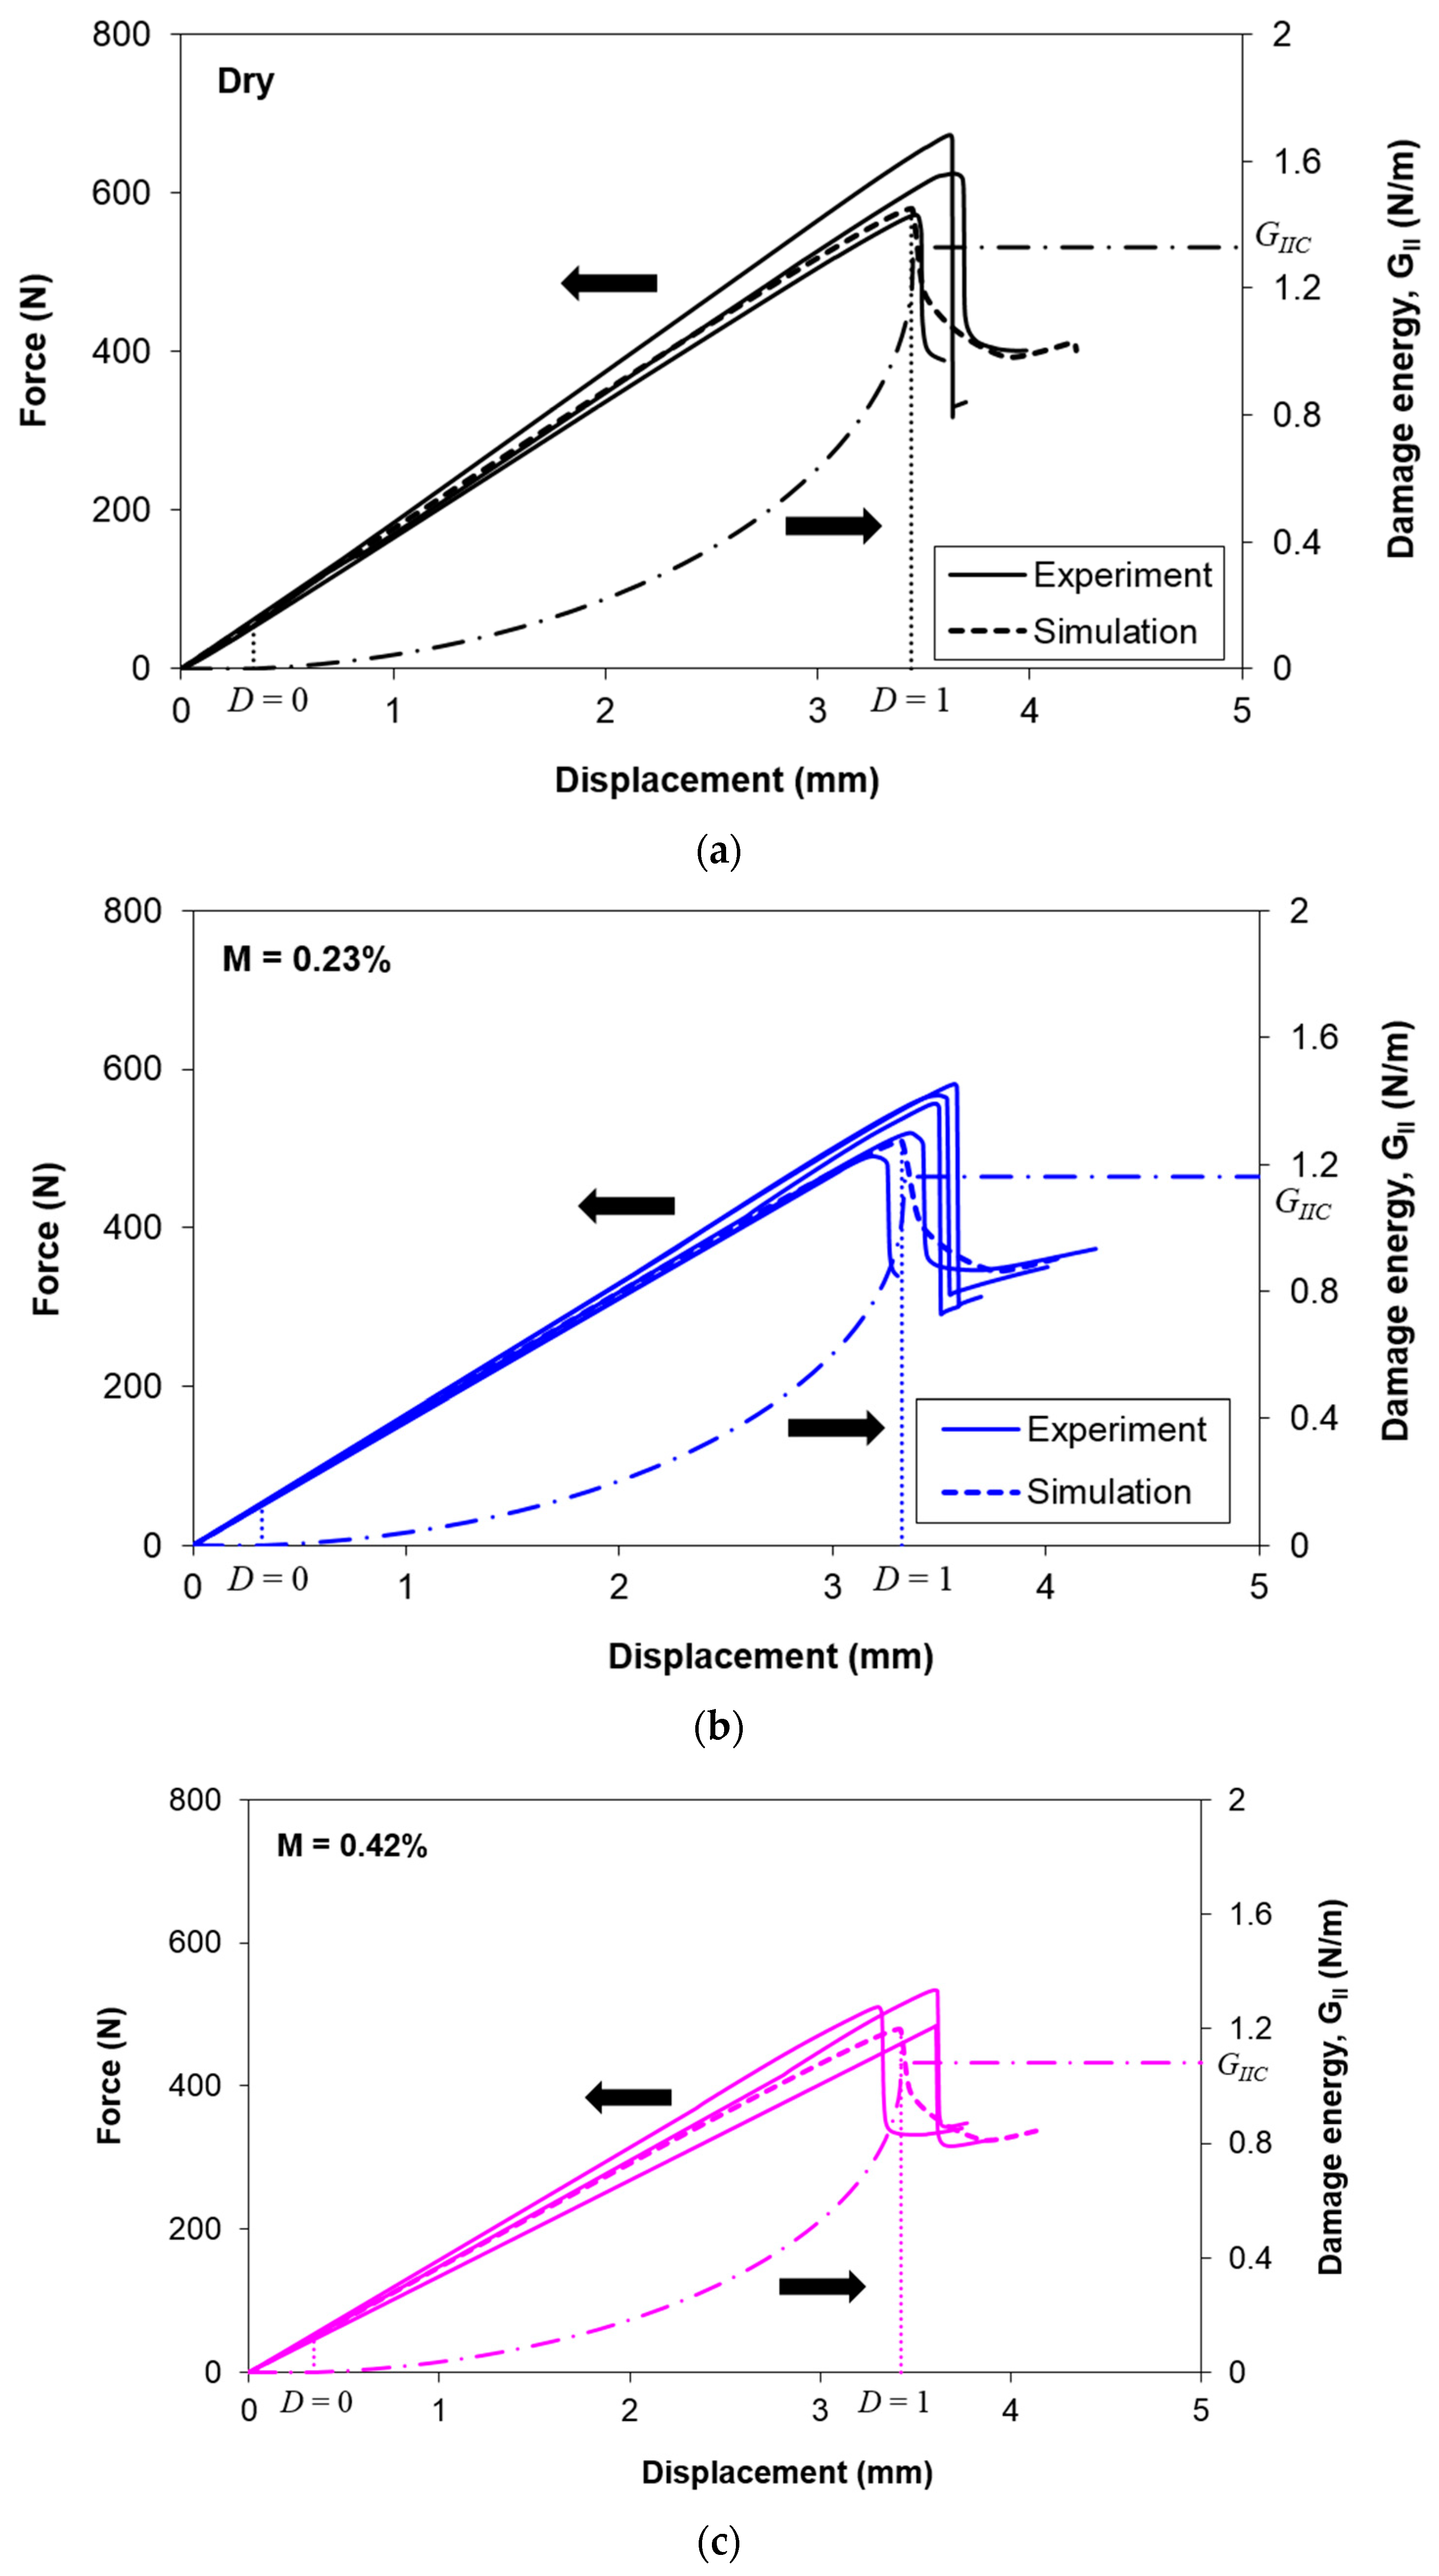
3.3. Force–Displacement Curves
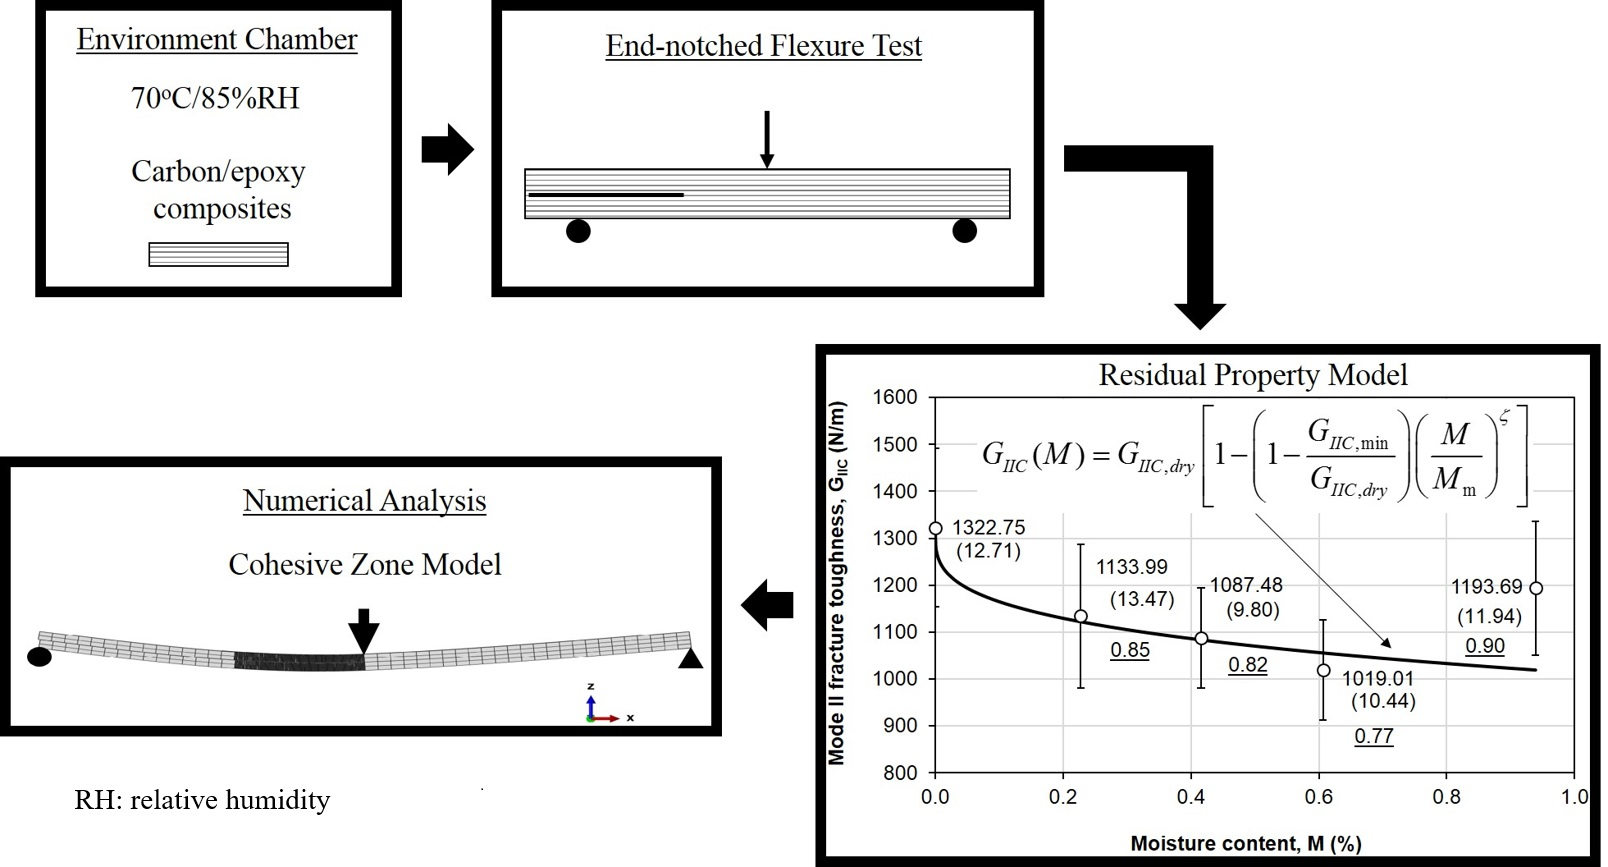
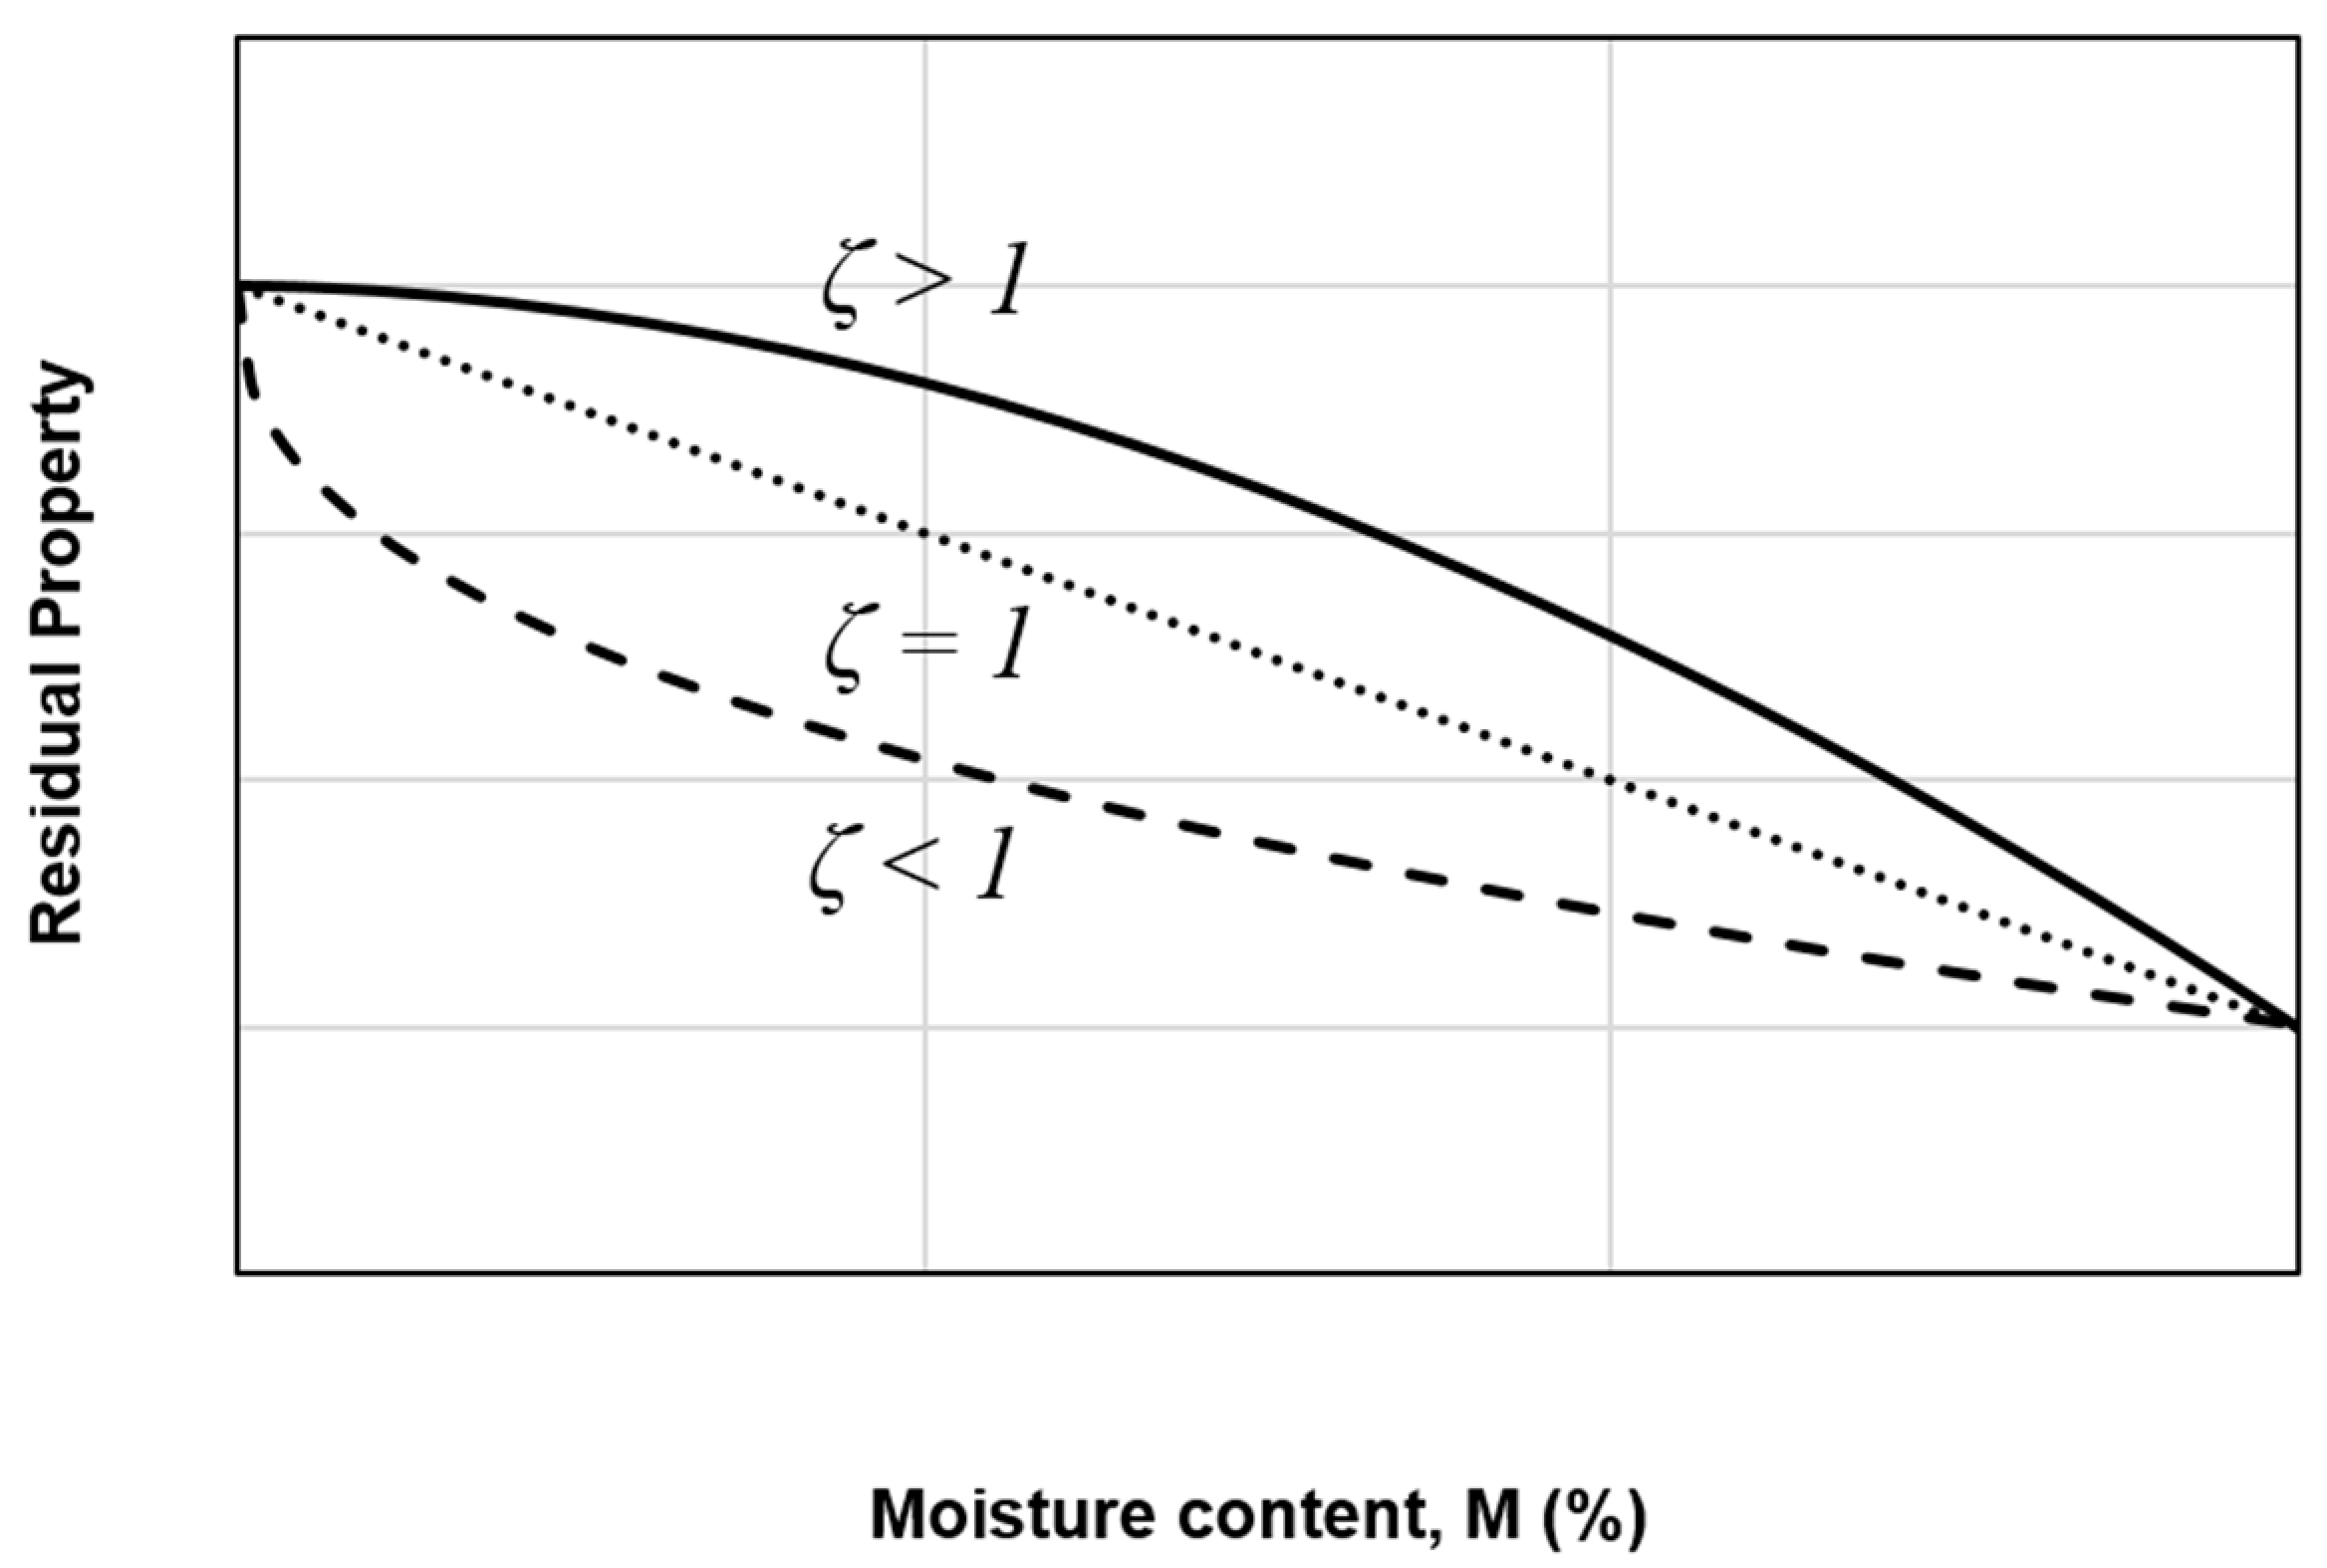
3.4. Residual Property Model
4. Numerical Simulation
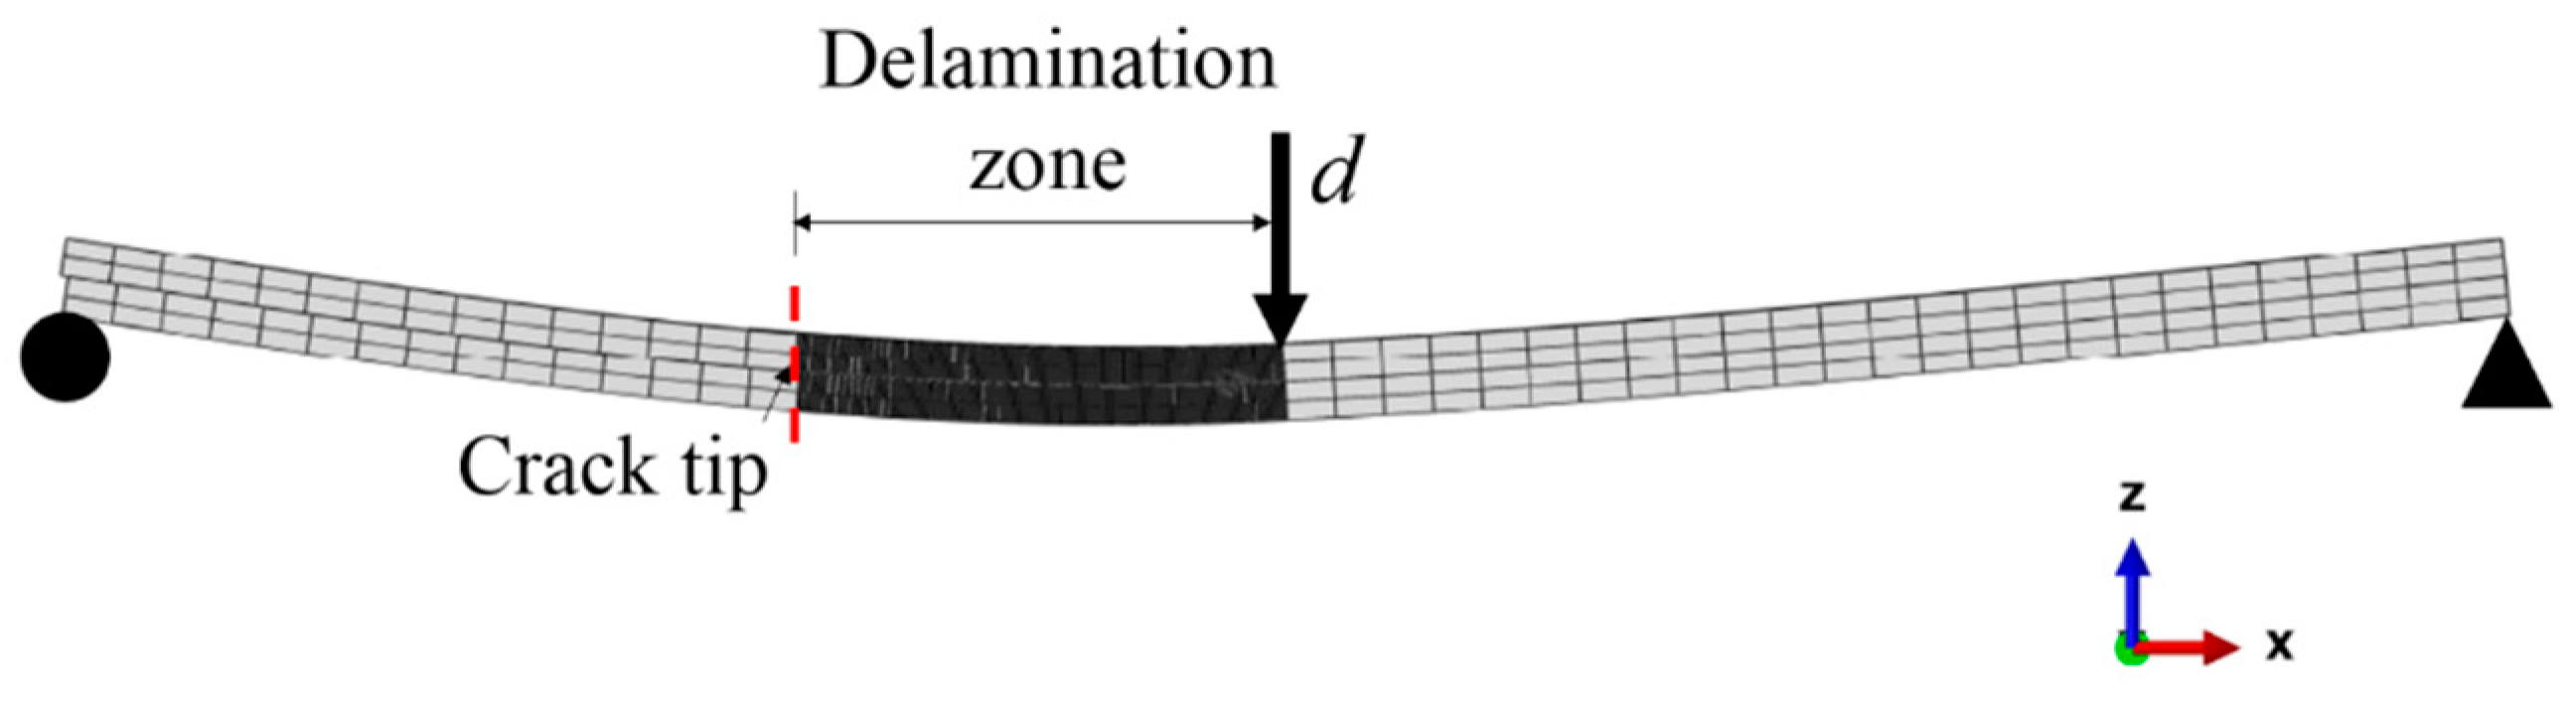
4.1. Finite Element Model
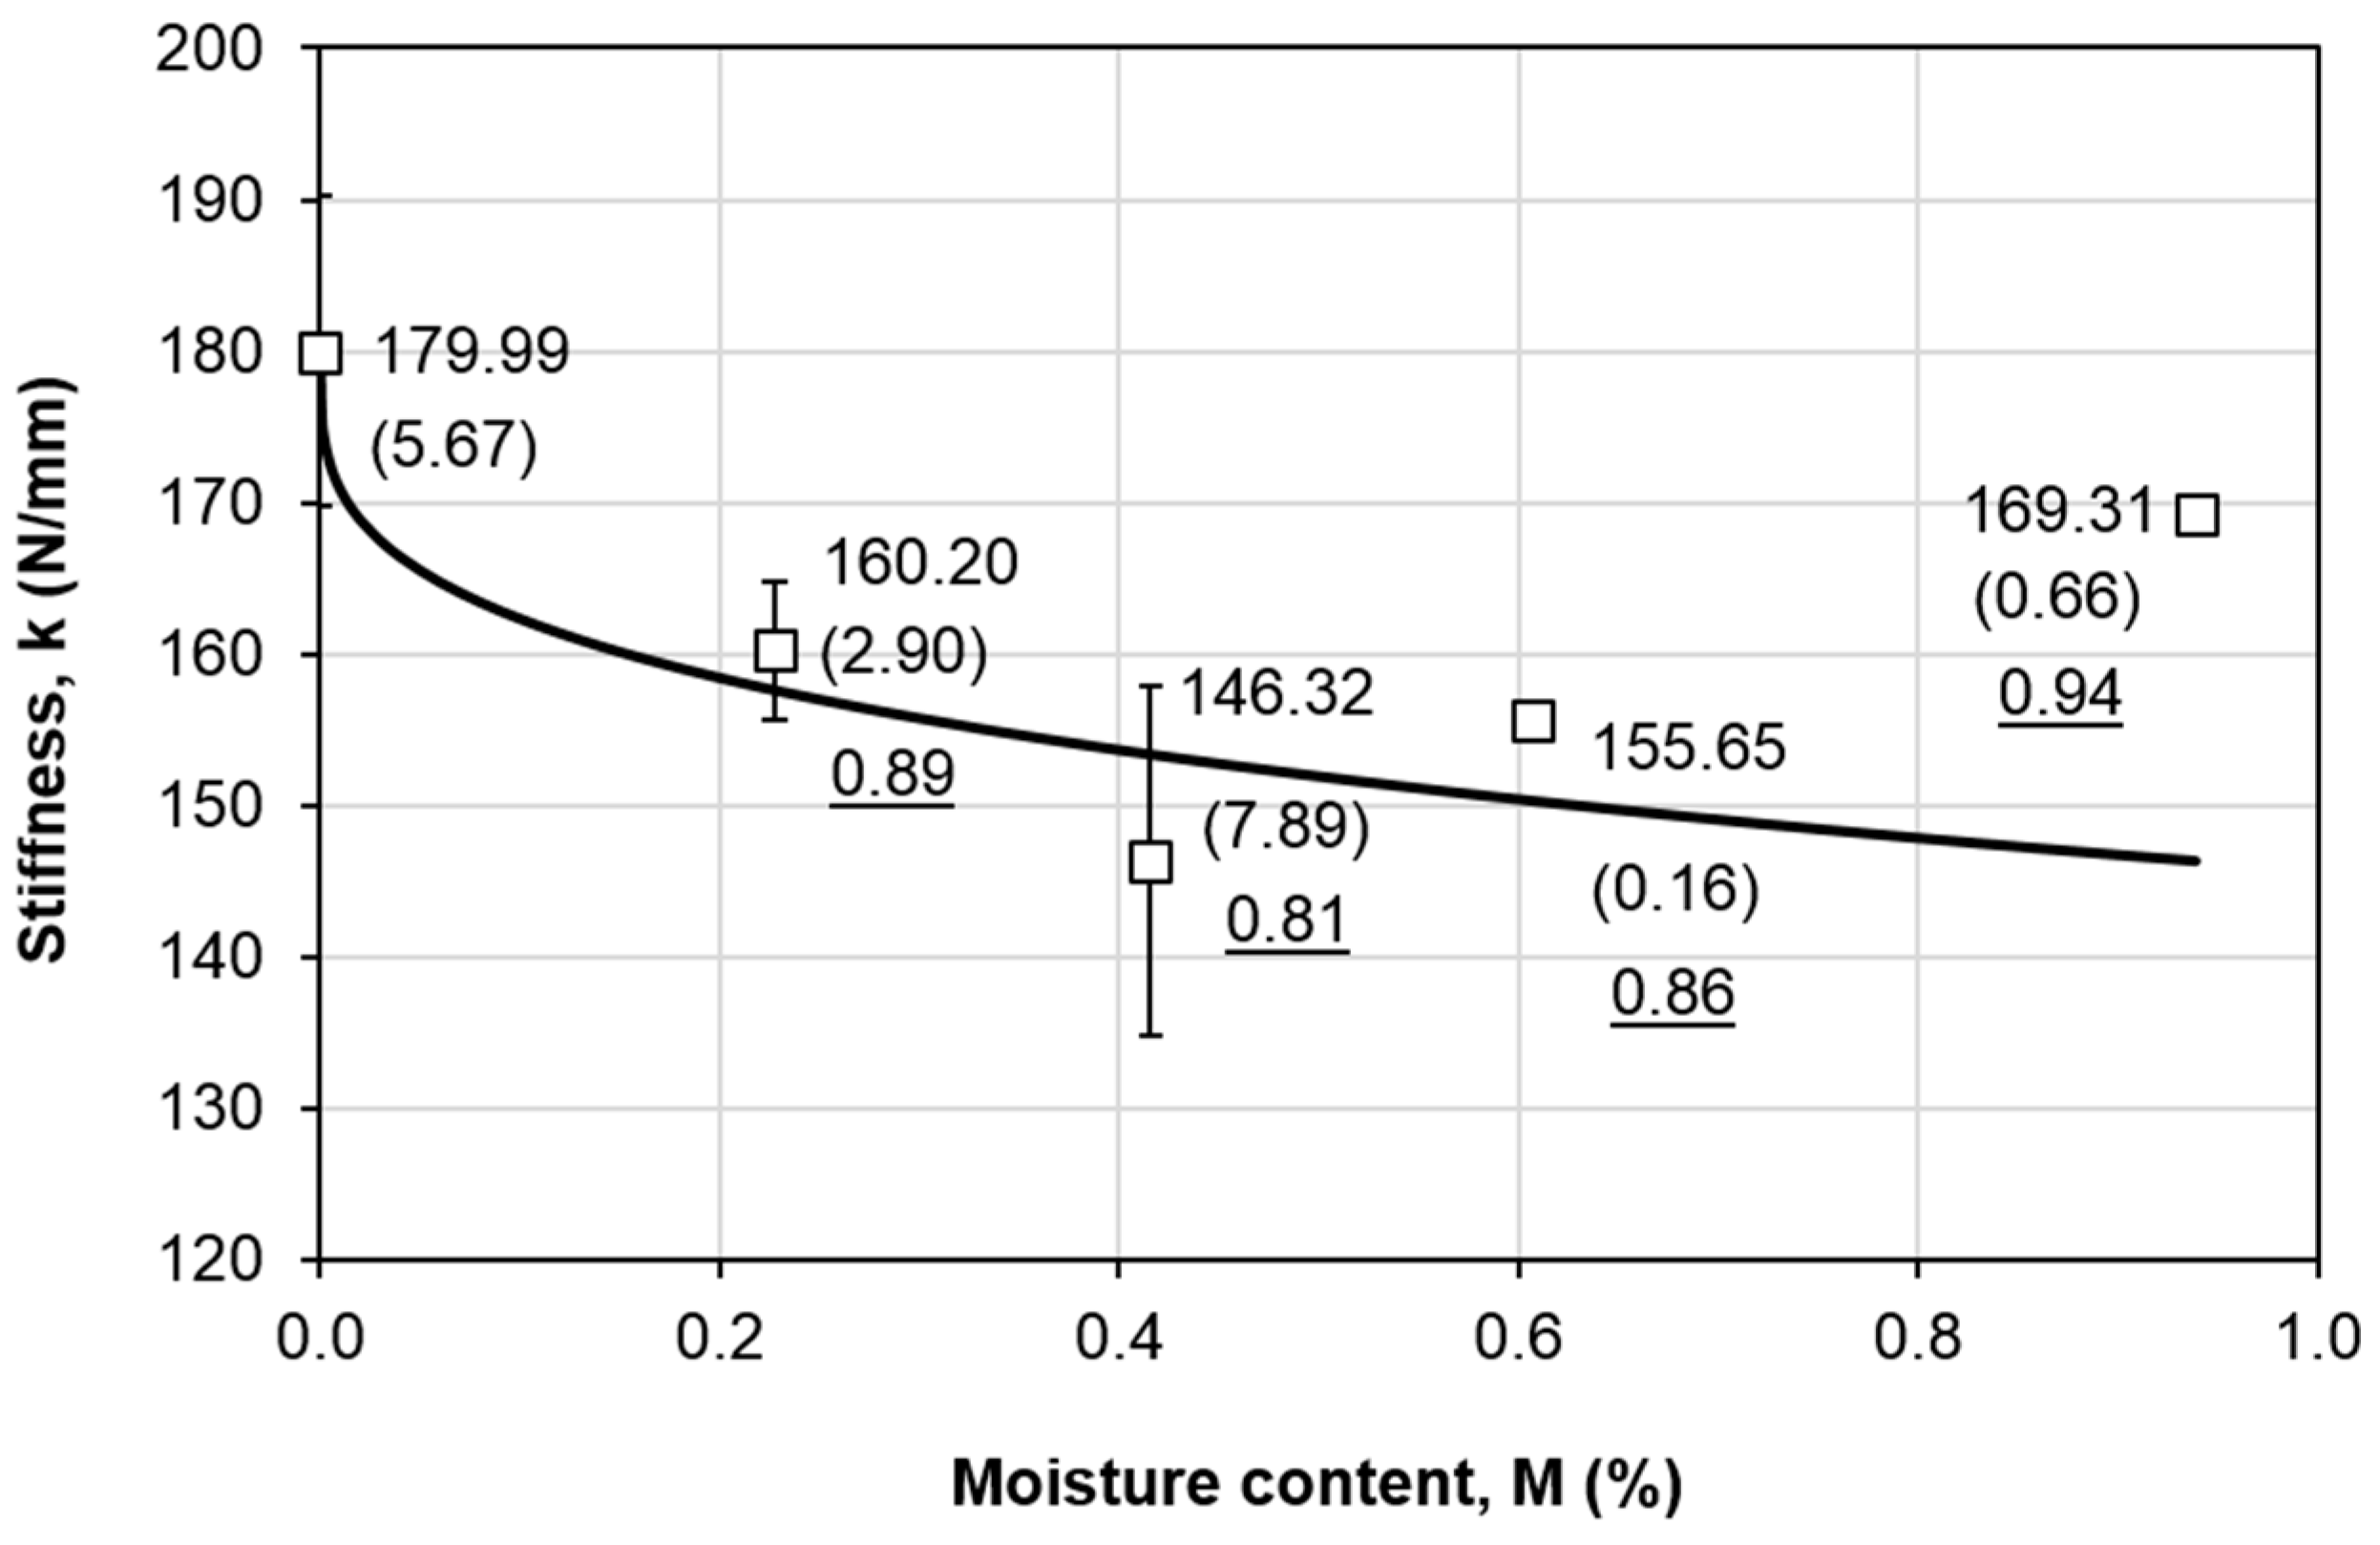
4.2. Lamina Properties
4.3. Cohesive Properties
4.4. Simulation Results
5. Conclusions
- The moisture absorption is well fitted using Fick’s law, with the maximum moisture content of approximately 0.94% and diffusivity of 2.56 × 10⁻² mm2/day.
- In general, mode II fracture toughness decreases with the moisture content. The maximum degradation is 23% at moisture content of 0.61%.
- The variation of the mode II fracture toughness is well fitted using the residual property model, with a 15% difference at the moisture content of 0.94%.
- The maximum difference between the experimental and numerical slopes is 10% under dry conditions. This signifies that the approach of estimating the lamina properties and interface shear stiffness used in this study is reliable.
- The difference between the experimental and numerical peak loads is less than 12.5%, except for the case at maximum moisture content of 0.94%. This indicates that the mode II fracture toughness values predicted using the residual property model and the methodology adopted to estimate the interface shear strength provide sufficient accuracy in predicting the mode II delamination behavior of the composite.
- The numerical results show that the damage is initiated in the interface during the early stage of loading. When the numerical peak load is attained, the first element has reached its total failure.
Author Contributions
Funding
Conflicts of Interest
References
- Guermazi, N.; Ben Tarjem, A.; Ksouri, I.; Ayedi, H.F. On the durability of FRP composites for aircraft structures in hygrothermal conditioning. Compos. Part B-Eng. 2016, 85, 294–304. [Google Scholar] [CrossRef]
- Middendorf, P.; Metzner, C. 18—Aerospace applications of non-crimp fabric composites. In Non-Crimp Fabric Composites; Lomov, S.V., Ed.; Woodhead Publishing: Cambridge, UK, 2011; pp. 441–449. [Google Scholar]
- Wong, K.J.; Israr, H.A.; Tamin, M.N. Characterisation of moisture absorption effects on the strength of composite materials. Adv. Mater. Res. 2015, 1125, 69–73. [Google Scholar] [CrossRef]
- Cysne Barbosa, A.P.; Fulco, A.P.P.; Guerra, E.S.S.; Arakaki, F.K.; Tosatto, M.; Costa, M.C.B.; Melo, J.D.D. Accelerated aging effects on carbon fiber/epoxy composites. Compos. Part B-Eng. 2017, 110, 298–306. [Google Scholar] [CrossRef]
- Meng, M.; Rizvi, M.J.; Grove, S.M.; Le, H.R. Effects of hygrothermal stress on the failure of CFRP composites. Compos. Struct. 2015, 133, 1024–1035. [Google Scholar] [CrossRef] [Green Version]
- Mad Asasaari, S.F.; Wong, K.J.; Tamin, M.N.; Johar, M. Moisture absorption effects on the mechanical properties of carbon/epoxy composites. Int. J. Struct. Integr. 2020, 11, 605–614. [Google Scholar] [CrossRef]
- Nash, N.H.; Ray, D.; Young, T.M.; Stanley, W.F. The influence of hydrothermal conditioning on the Mode-I, thermal and flexural properties of Carbon/Benzoxazine composites with a thermoplastic toughening interlayer. Compos. Part A 2015, 76, 135–144. [Google Scholar] [CrossRef]
- LeBlanc, L.R.; LaPlante, G. Experimental investigation and finite element modeling of mixed-mode delamination in a moisture-exposed carbon/epoxy composite. Compos. Part A 2016, 81, 202–213. [Google Scholar] [CrossRef]
- Davidson, B.D.; Kumar, M.; Soffa, M.A. Influence of mode ratio and hygrothermal condition on the delamination toughness of a thermoplastic particulate interlayered carbon/epoxy composite. Compos. Part A 2009, 40, 67–79. [Google Scholar] [CrossRef]
- Gong, X.J.; Wong, K.J.; Tamin, M.N. Moisture absorption effects on interlaminar fracture toughness of woven glass/epoxy composite laminates. In Damage and Fracture of Composite Materials and Structures, Advanced Structured Materials; Tamin, M.N., Ed.; Springer: Berlin/Heidelberg, Germany, 2012; pp. 107–129. [Google Scholar]
- Zhao, Y.; Liu, W.; Seah, L.K.; Chai, G.B. Delamination growth behavior of a woven E-glass/bismaleimide composite in seawater environment. Compos. Part B-Eng. 2016, 106, 332–343. [Google Scholar] [CrossRef]
- Nash, N.H.; Young, T.M.; Stanley, W.F. The influence of a thermoplastic toughening interlayer and hydrothermal conditioning on the Mode-II interlaminar fracture toughness of Carbon/Benzoxazine composites. Compos. Part A 2016, 81, 111–120. [Google Scholar] [CrossRef]
- Johar, M.; Chong, W.W.F.; Kang, H.S.; Wong, K.J. Effects of moisture absorption on the different modes of carbon/epoxy composites delamination. Polym. Degrad. Stab. 2019, 165, 117–125. [Google Scholar] [CrossRef]
- ASTM D5229. Standard Test Method for Moisture Absorption Properties and Equilibrium Conditioning of Polymer Matrix Composite Materials; ASTM International: West Conshohocken, PA, USA, 2010. [Google Scholar]
- Low, K.O.; Teng, S.M.; Johar, M.; Israr, H.A.; Wong, K.J. Mode I delamination behaviour of carbon/epoxy composite at different displacement rates. Compos. Part B-Eng. 2019, 176, 107293. [Google Scholar] [CrossRef]
- ASTM D7905. Standard Test Method for Determination of the Mode II Interlaminar Fracture Toughness of Unidirectional Fiber-Reinforced Polymer Matrix Composites; ASTM International: West Conshohocken, PA, USA, 2014. [Google Scholar]
- Irwin, G.R.; Kies, J.A. Critical energy rate analysis of fracture strength. Weld. J. Res. Suppl. 1954, 33, 193–198. [Google Scholar]
- Fick, A. Über diffusion. Poggendorff’s Annalen der Physik und Chemie 1855; Volume 94, pp. 59–86. Available online: https://onlinelibrary.wiley.com/doi/pdf/10.1002/andp.18551700105 (accessed on 21 September 2020).
- Wang, Z.; Zhao, X.-L.; Xian, G.; Wu, G.; Singh Raman, R.K.; Al-Saadi, S.; Haque, A. Long-term durability of basalt- and glass-fibre reinforced polymer (BFRP/GFRP) bars in seawater and sea sand concrete environment. Constr. Build. Mater. 2017, 139, 467–489. [Google Scholar] [CrossRef]
- Wang, Z.; Zhao, X.-L.; Xian, G.; Wu, G.; Singh Raman, R.K.; Al-Saadi, S. Durability study on interlaminar shear behaviour of basalt-, glass- and carbon-fibre reinforced polymer (B/G/CFRP) bars in seawater sea sand concrete environment. Constr. Build. Mater. 2017, 156, 985–1004. [Google Scholar] [CrossRef]
- Wang, Z.; Xian, G.; Zhao, X.-L. Effects of hydrothermal aging on carbon fibre/epoxy composites with different interfacial bonding strength. Constr. Build. Mater. 2018, 161, 634–648. [Google Scholar] [CrossRef]
- Zhong, Y.; Joshi, S.C. Impact behavior and damage characteristics of hygrothermally conditioned carbon epoxy composite laminates. Mater. Des. 2015, 65, 254–264. [Google Scholar] [CrossRef]
- Mollón, V.; Bonhomme, J.; Elmarakbi, A.M.; Argüelles, A.; Viña, J. Finite element modelling of mode I delamination specimens by means of implicit and explicit solvers. Polym. Test. 2012, 31, 404–410. [Google Scholar] [CrossRef] [Green Version]
- Turon, A.; Dávila, C.G.; Camanho, P.P.; Costa, J. An engineering solution for mesh size effects in the simulation of delamination using cohesive zone models. Eng. Fract. Mech. 2007, 74, 1665–1682. [Google Scholar] [CrossRef]
- Camanho, P.P.; Davila, C.G.; de Moura, M.F.S.F. Numerical simulation of mixed-mode progressive delamination in composite materials. J. Compos. Mater. 2003, 37, 1415–1438. [Google Scholar] [CrossRef]
- Fan, C.; Jar, P.Y.B.; Cheng, J.J.R. Cohesive zone with continuum damage properties for simulation of delamination development in fibre composites and failure of adhesive joints. Eng. Fract. Mech. 2008, 75, 3866–3880. [Google Scholar] [CrossRef]
- Zhao, L.; Gong, Y.; Zhang, J.; Chen, Y.; Fei, B. Simulation of delamination growth in multidirectional laminates under mode I and mixed mode I/II loadings using cohesive elements. Compos. Struct. 2014, 116, 509–522. [Google Scholar] [CrossRef]
- Turon, A.; Camanho, P.P.; Costa, J.; Renart, J. Accurate simulation of delamination growth under mixed-mode loading using cohesive elements: Definition of interlaminar strengths and elastic stiffness. Compos. Struct. 2010, 92, 1857–1864. [Google Scholar] [CrossRef]


| Moisture Content M (%) | C2 (×10−8 N−1mm−2) |
|---|---|
| 0 | 5.57 |
| 0.23 | 5.65 |
| 0.42 | 6.18 |
| 0.61 | 5.82 |
| 0.94 | 5.35 |
| M (%) | E11 (GPa) | E22 (GPa) | G12 (GPa) | G13 (GPa) | G23 (GPa) | ν12 |
|---|---|---|---|---|---|---|
| 0 | 103 (4.95) | 6.7 | 2.7 | 2.7 | 2.5 | 0.34 |
| 0.23 | 94 (2.90) | 6.1 | 2.4 | 2.4 | 2.3 | 0.34 |
| 0.42 | 86 (7.89) | 5.5 | 2.2 | 2.2 | 2.1 | 0.34 |
| 0.61 | 91 (0.16) | 5.9 | 2.4 | 2.4 | 2.2 | 0.34 |
| 0.94 | 99 (0.66) | 6.4 | 2.6 | 2.6 | 2.4 | 0.34 |
| M (%) | GIIC (N/m) | Kss (MPa/mm) | tu,s (MPa) |
|---|---|---|---|
| 0 | 1322.75 | 4.50 × 10⁵ | 81 |
| 0.23 | 1121.90 | 3.94 × 10⁴ | 70 |
| 0.42 | 1083.24 | 3.83 × 10⁴ | 68 |
| 0.61 | 1055.34 | 3.76 × 10⁴ | 66 |
| 0.94 | 1019.01 | 3.66 × 10⁴ | 64 |
© 2020 by the authors. Licensee MDPI, Basel, Switzerland. This article is an open access article distributed under the terms and conditions of the Creative Commons Attribution (CC BY) license (http://creativecommons.org/licenses/by/4.0/).
Share and Cite
Wong, K.J.; Johar, M.; Koloor, S.S.R.; Petrů, M.; Tamin, M.N. Moisture Absorption Effects on Mode II Delamination of Carbon/Epoxy Composites. Polymers 2020, 12, 2162. https://doi.org/10.3390/polym12092162
Wong KJ, Johar M, Koloor SSR, Petrů M, Tamin MN. Moisture Absorption Effects on Mode II Delamination of Carbon/Epoxy Composites. Polymers. 2020; 12(9):2162. https://doi.org/10.3390/polym12092162
Chicago/Turabian StyleWong, King Jye, Mahzan Johar, Seyed Saeid Rahimian Koloor, Michal Petrů, and Mohd Nasir Tamin. 2020. "Moisture Absorption Effects on Mode II Delamination of Carbon/Epoxy Composites" Polymers 12, no. 9: 2162. https://doi.org/10.3390/polym12092162