
Influence of Infill Pattern on Mechanical Behavior of Polymeric and Composites Specimens Manufactured Using Fused Filament Fabrication Technology


Abstract
:
1. Introduction
2. Materials and Methods
2.1. Materials
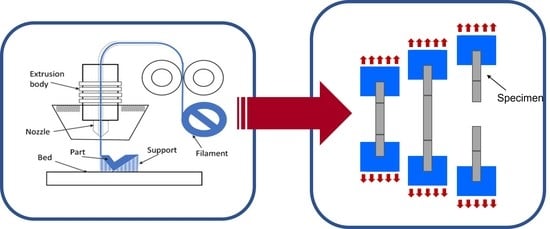
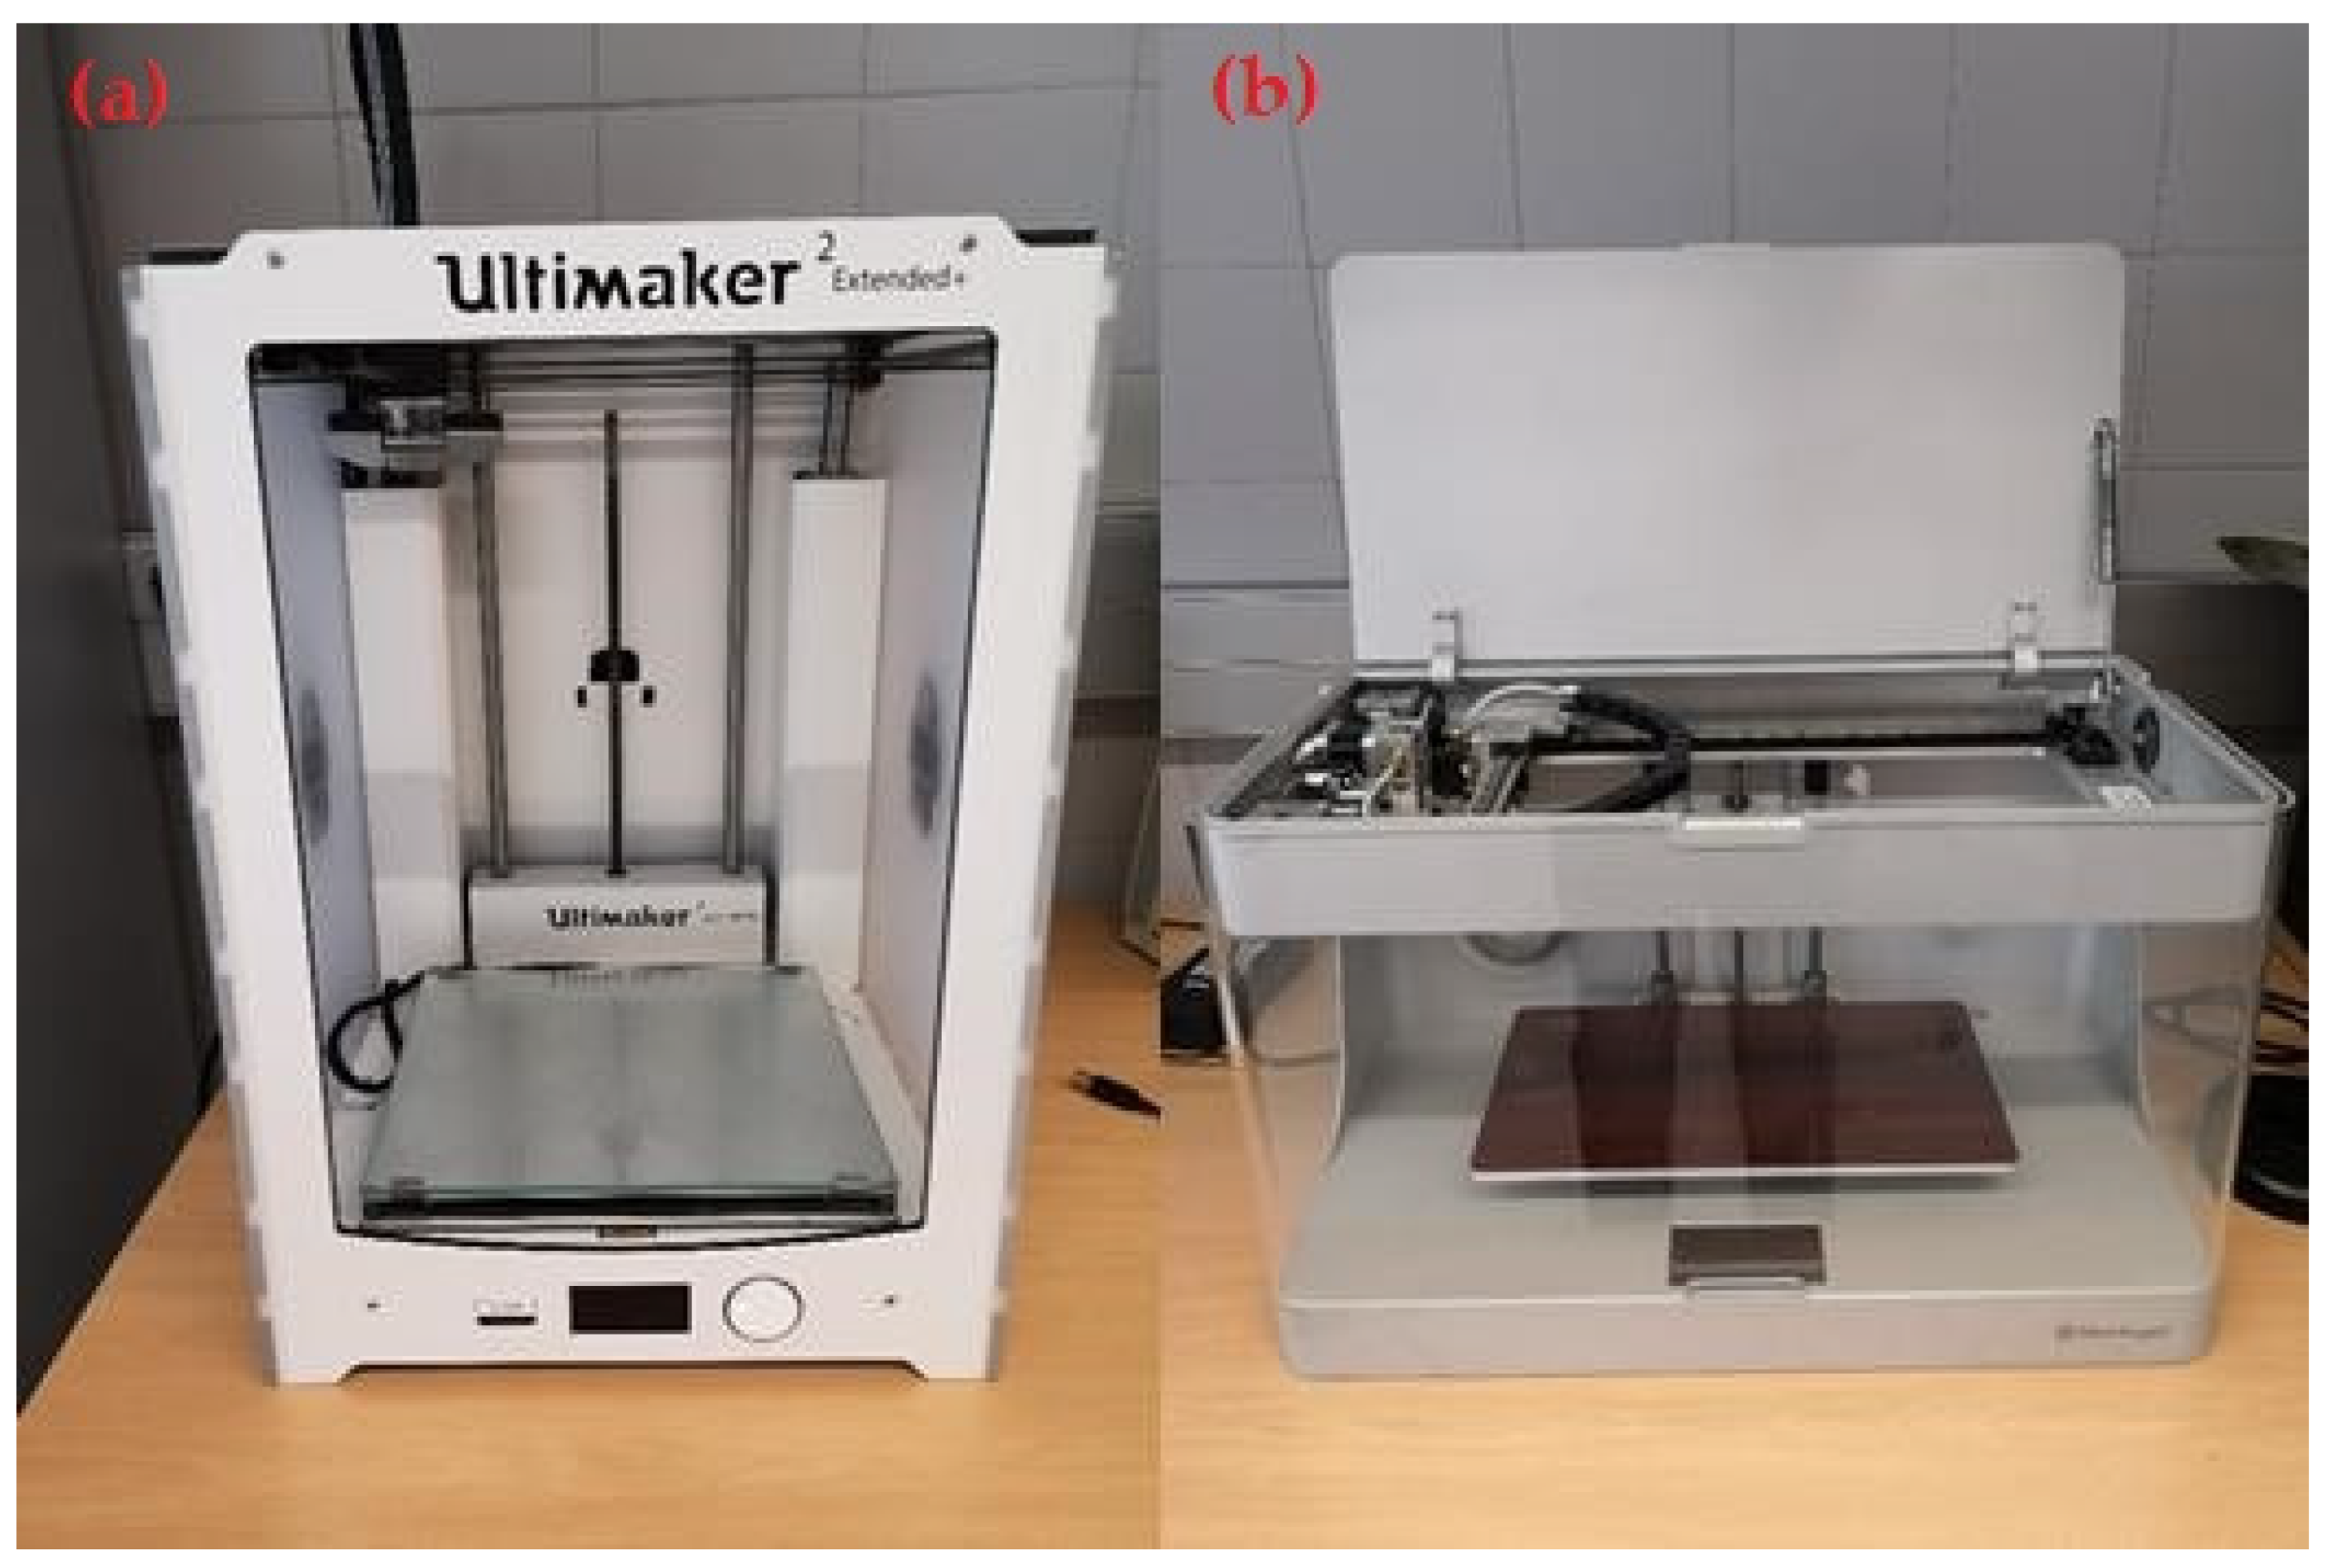
2.2. 3D Printer Equipment
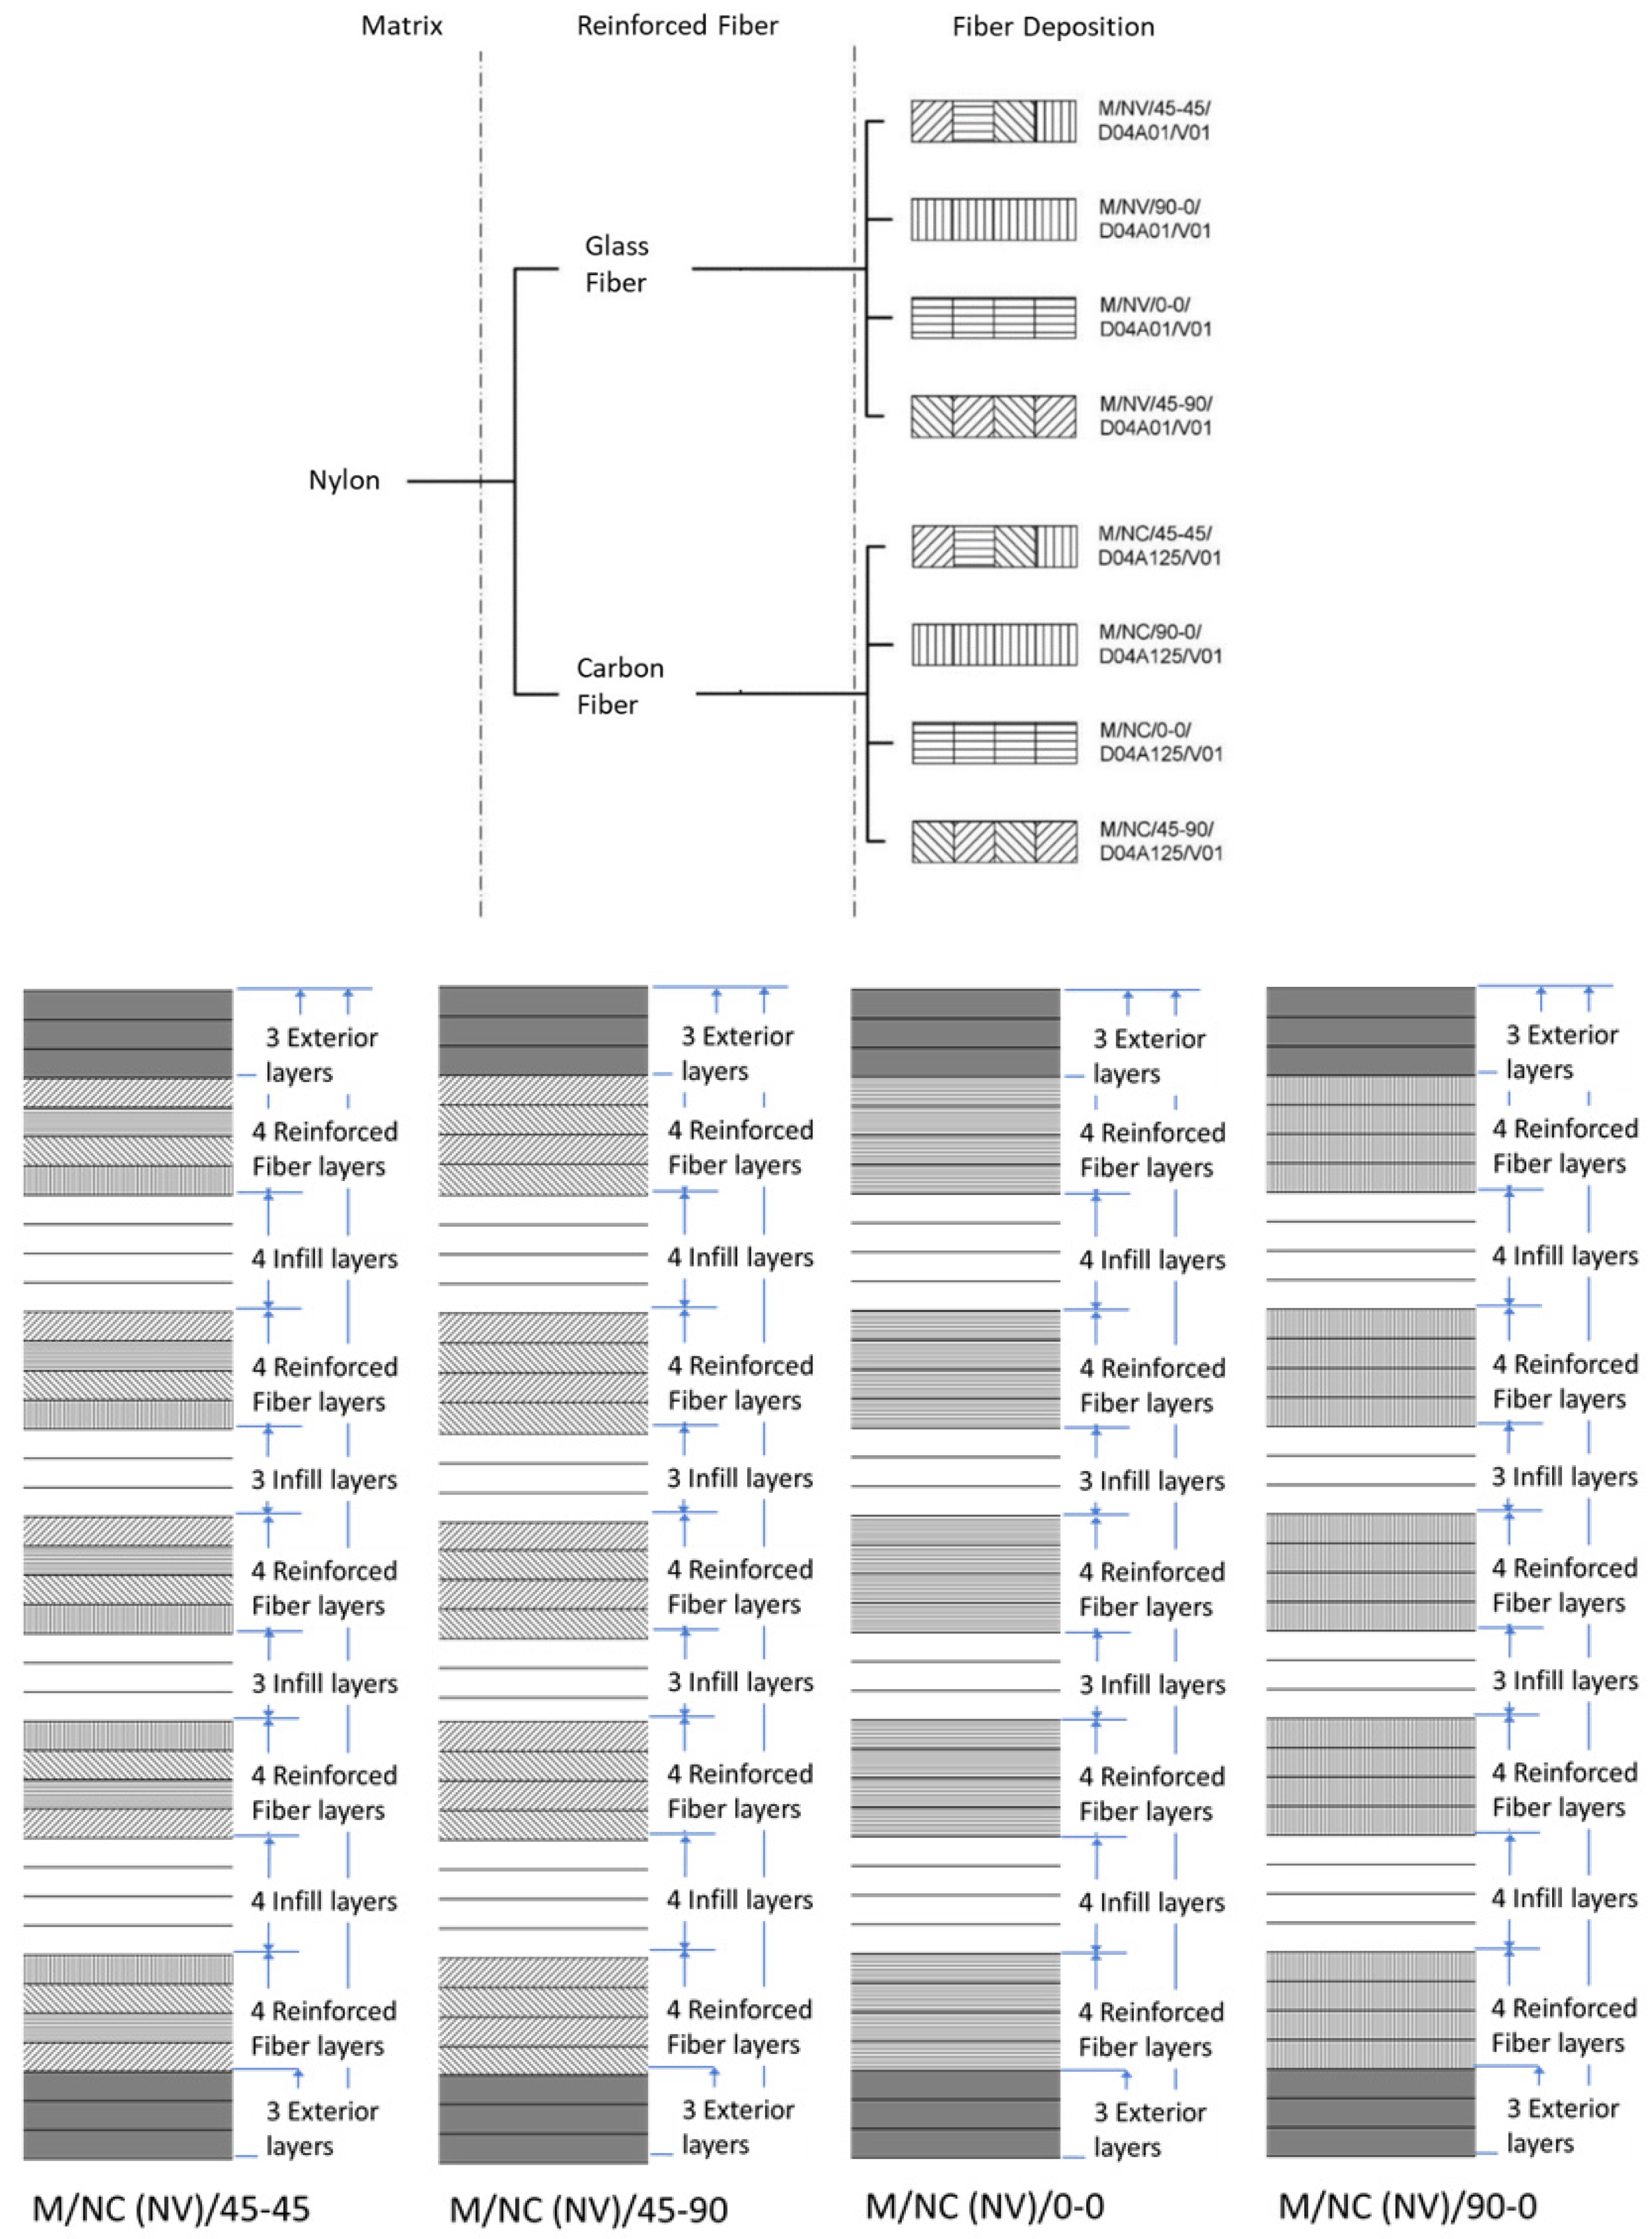
2.3. Infill Patterns
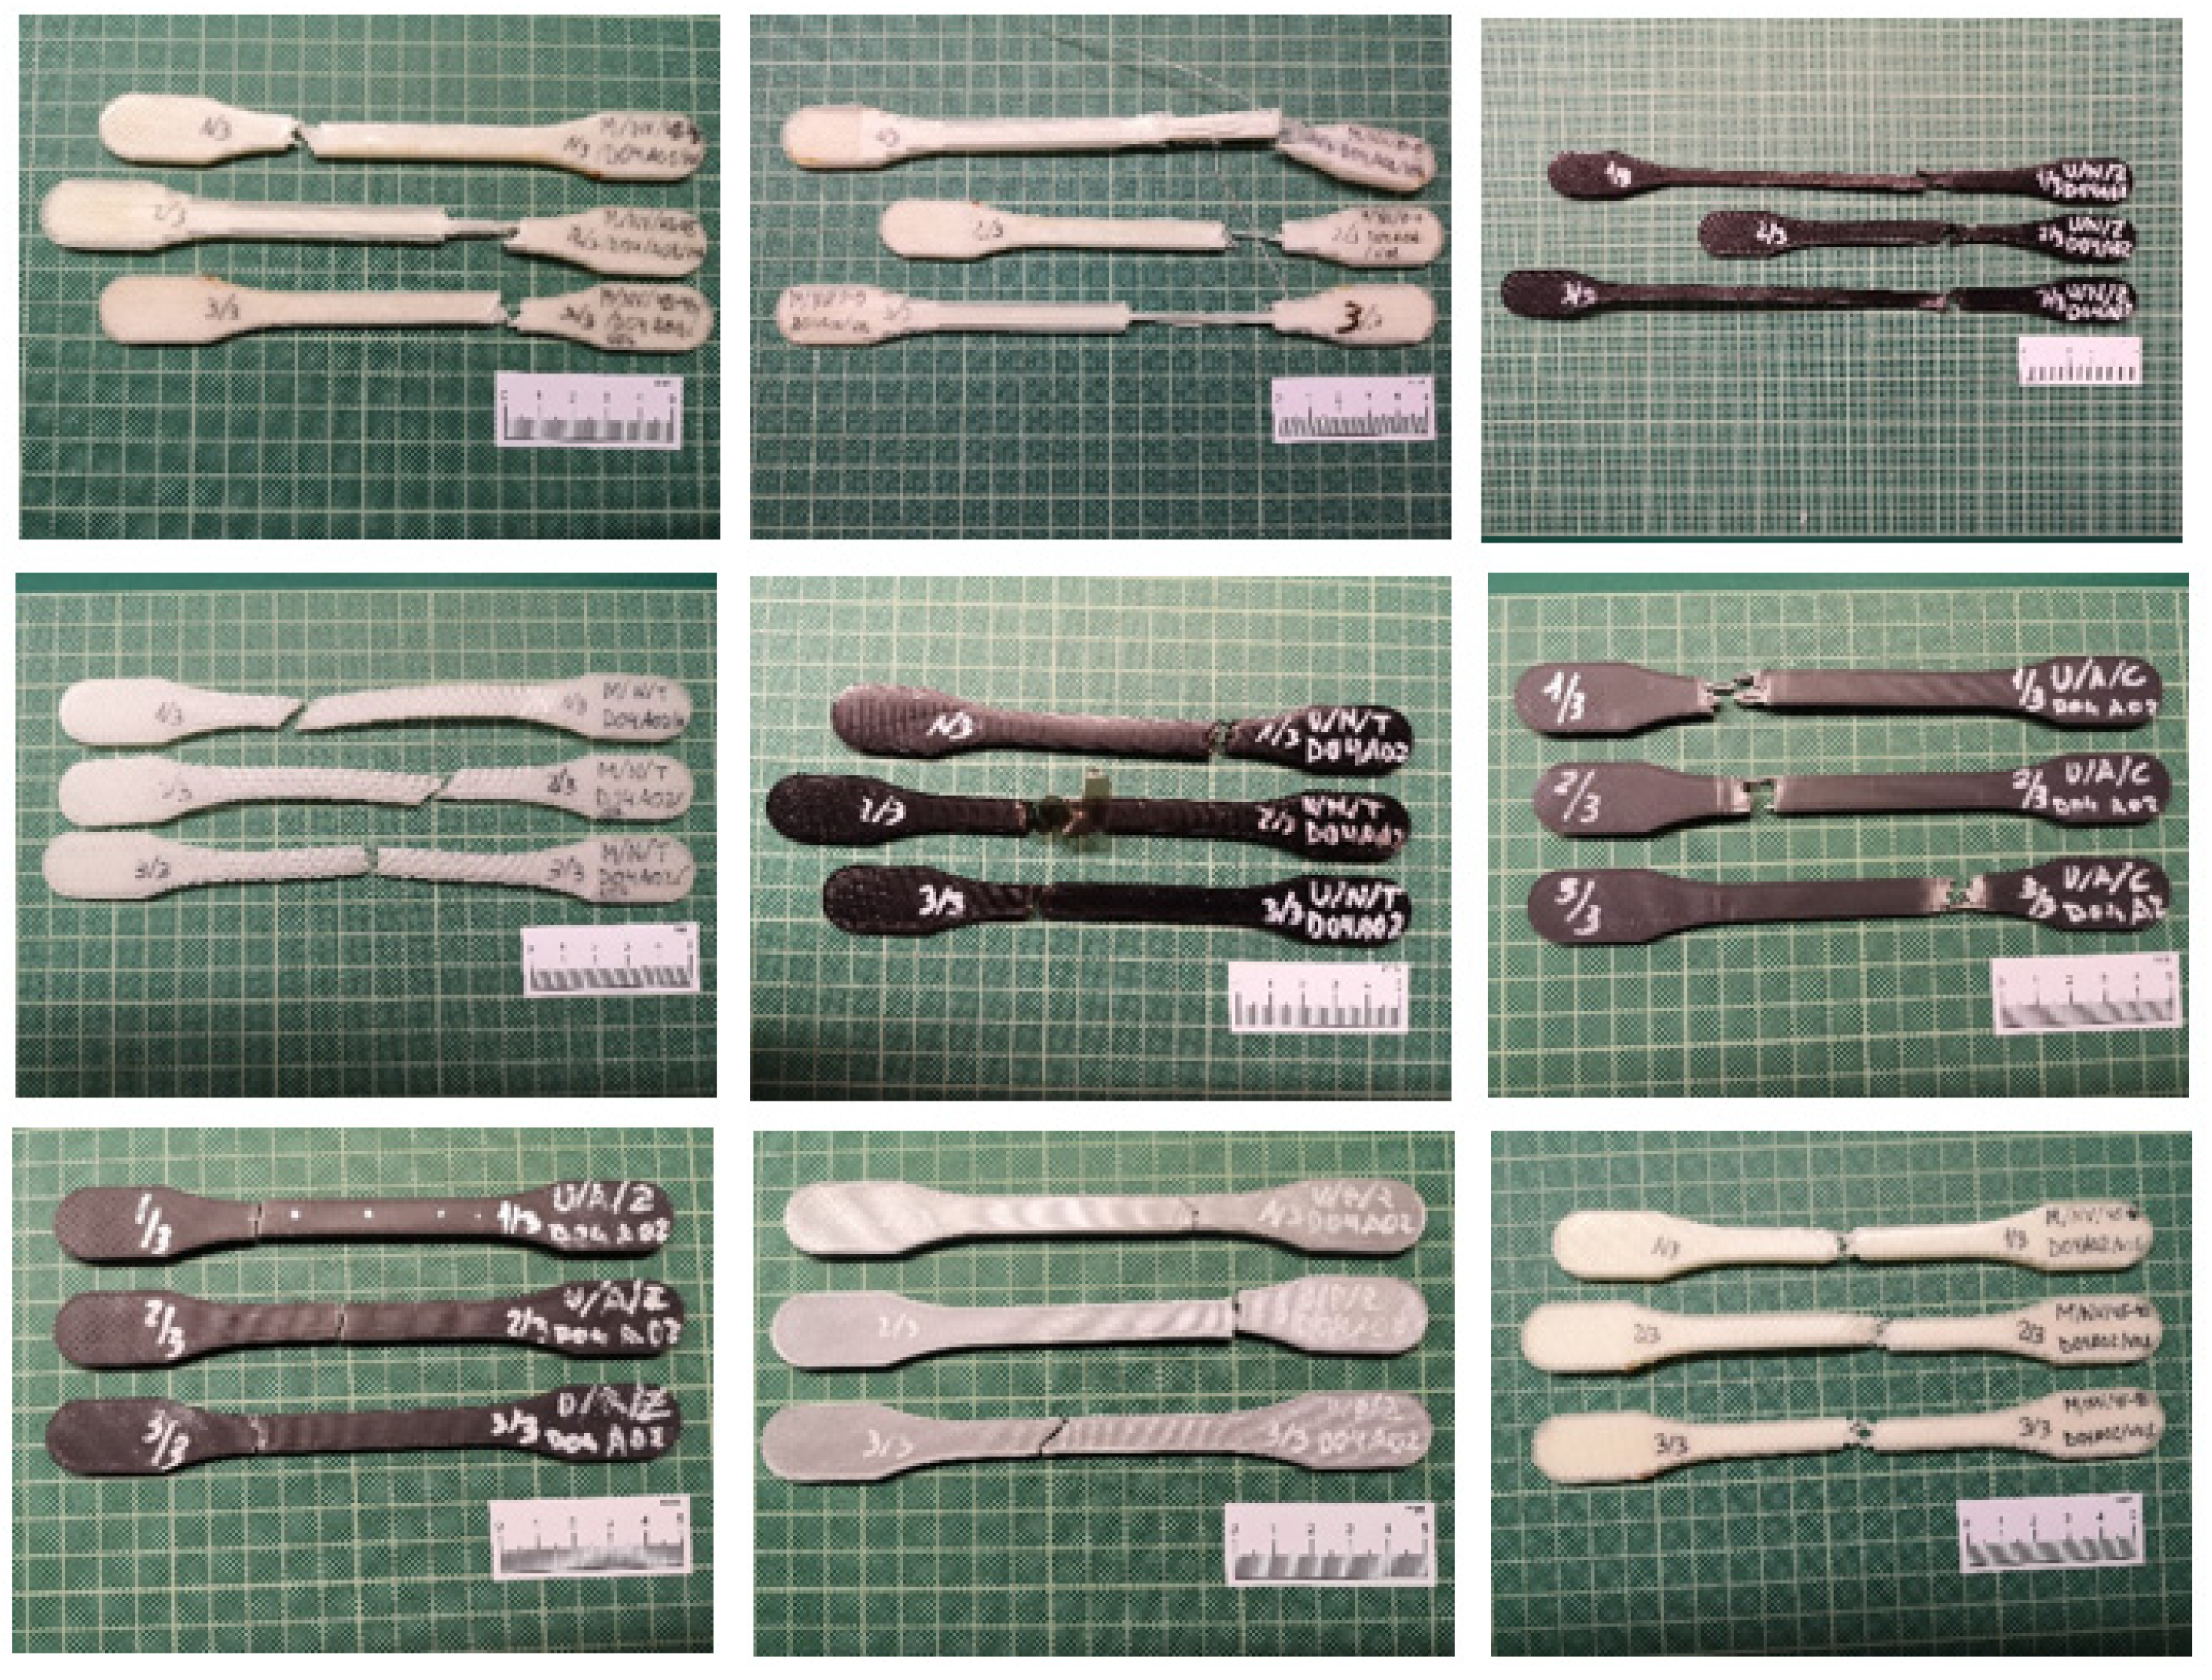
2.4. Sample Design
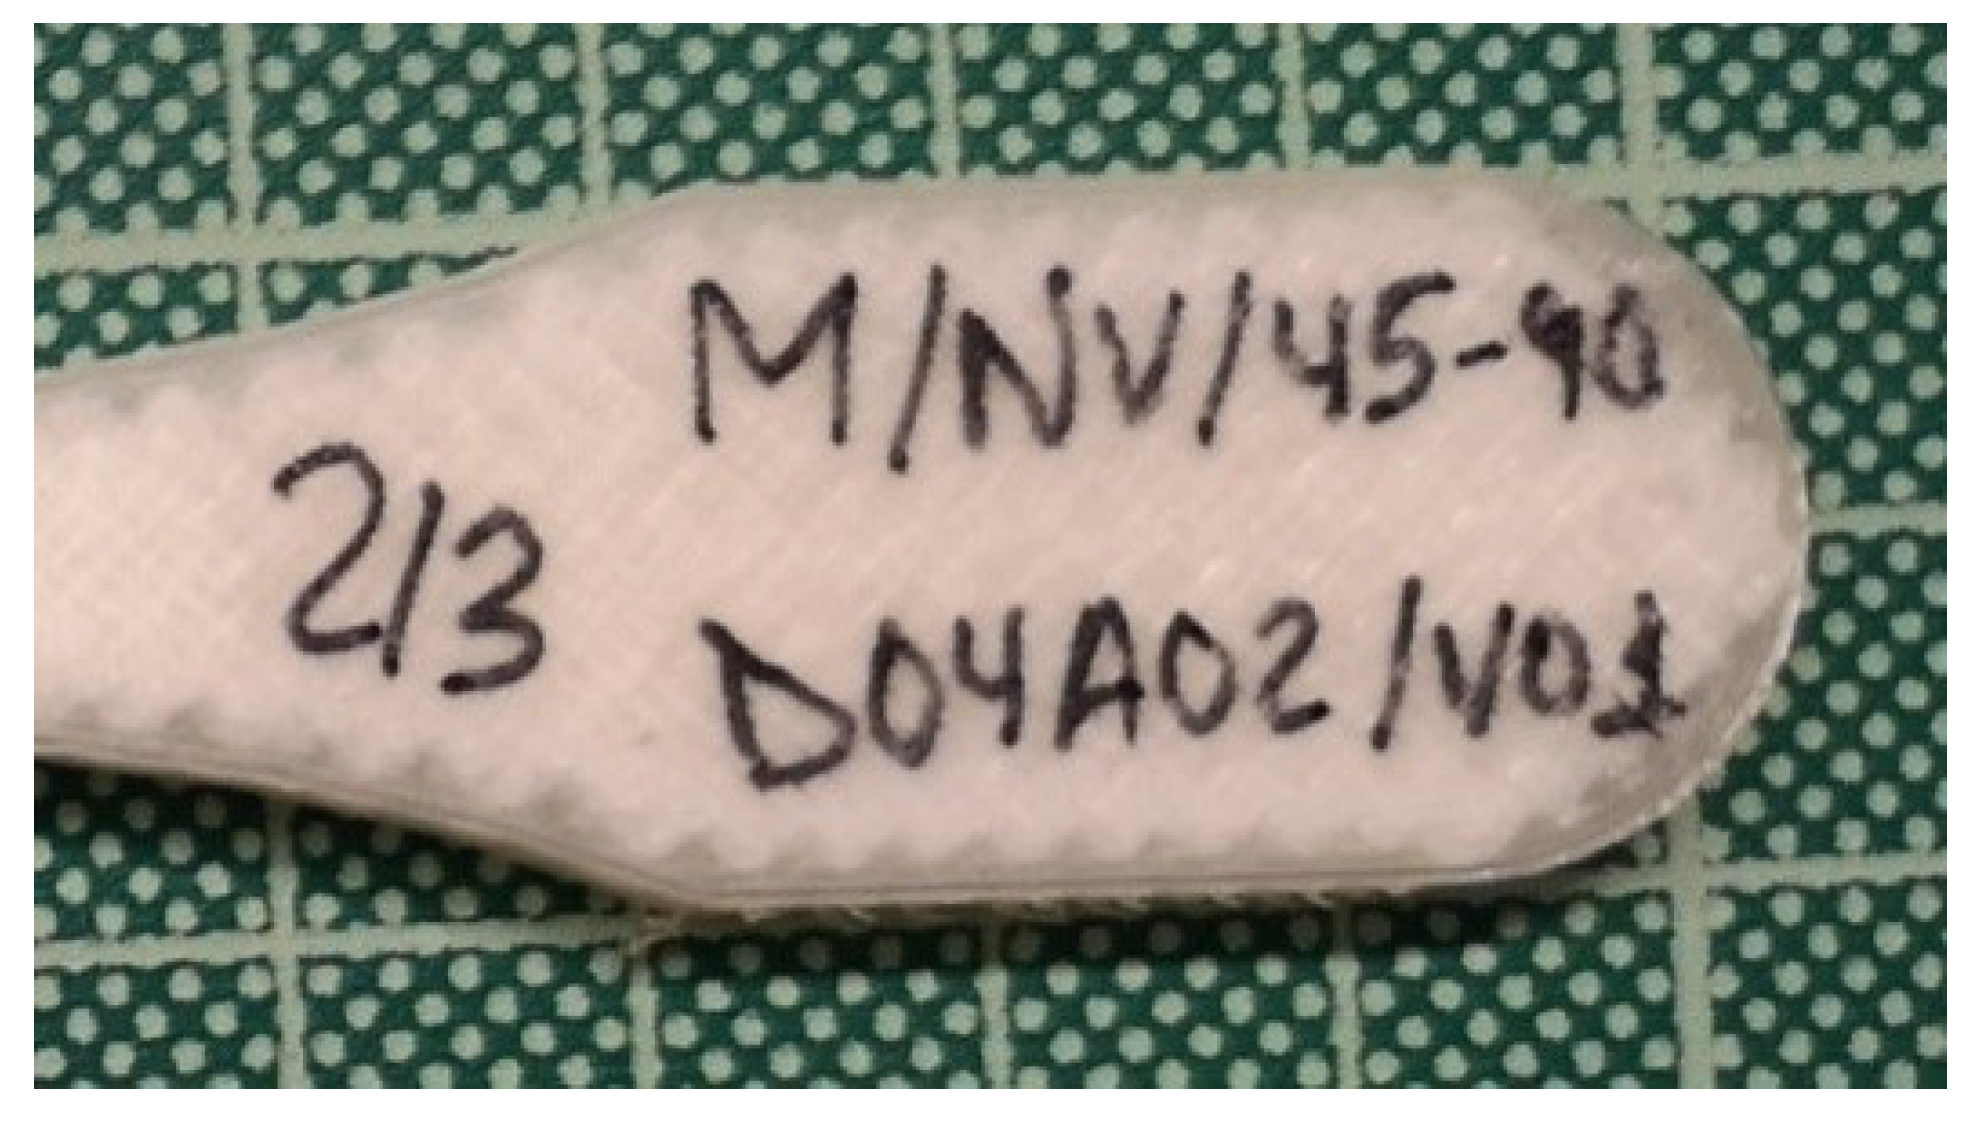
2.5. Reference Code
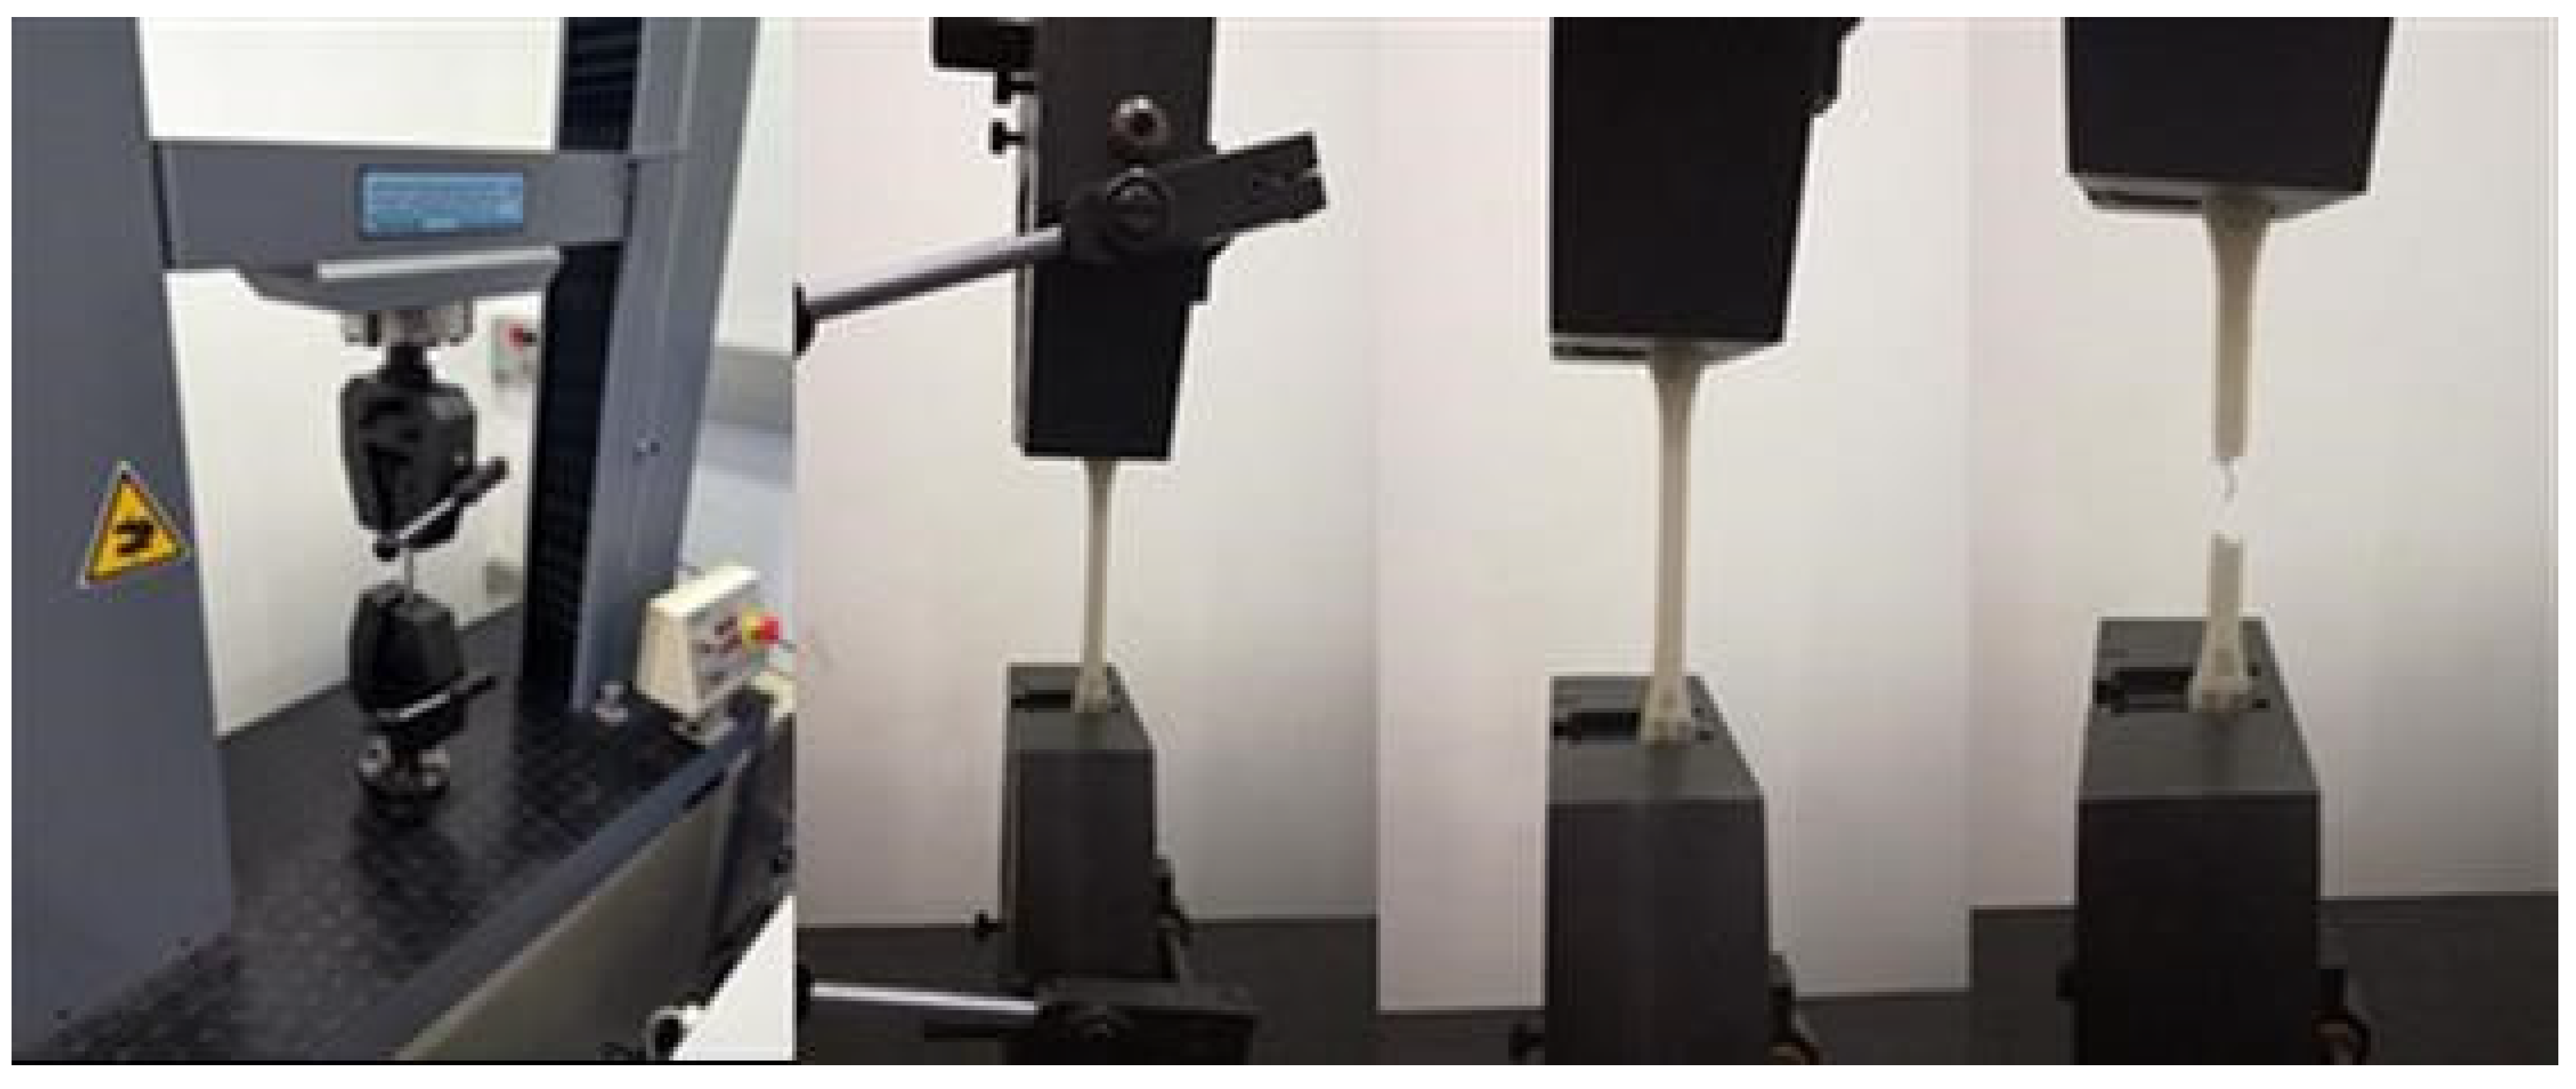
2.6. Tensile Test Machine
3. Results and Discussion
3.1. Results
3.2. Discussion
3.2.1. Infill Pattern Influence on PLA Parts Printed Using Ultimaker Printer (U/P/C vs. U/P/Z)
3.2.2. Infill Pattern Influence on ABS Samples Printed Using Ultimaker Printer (U/A/C vs. U/A/Z)
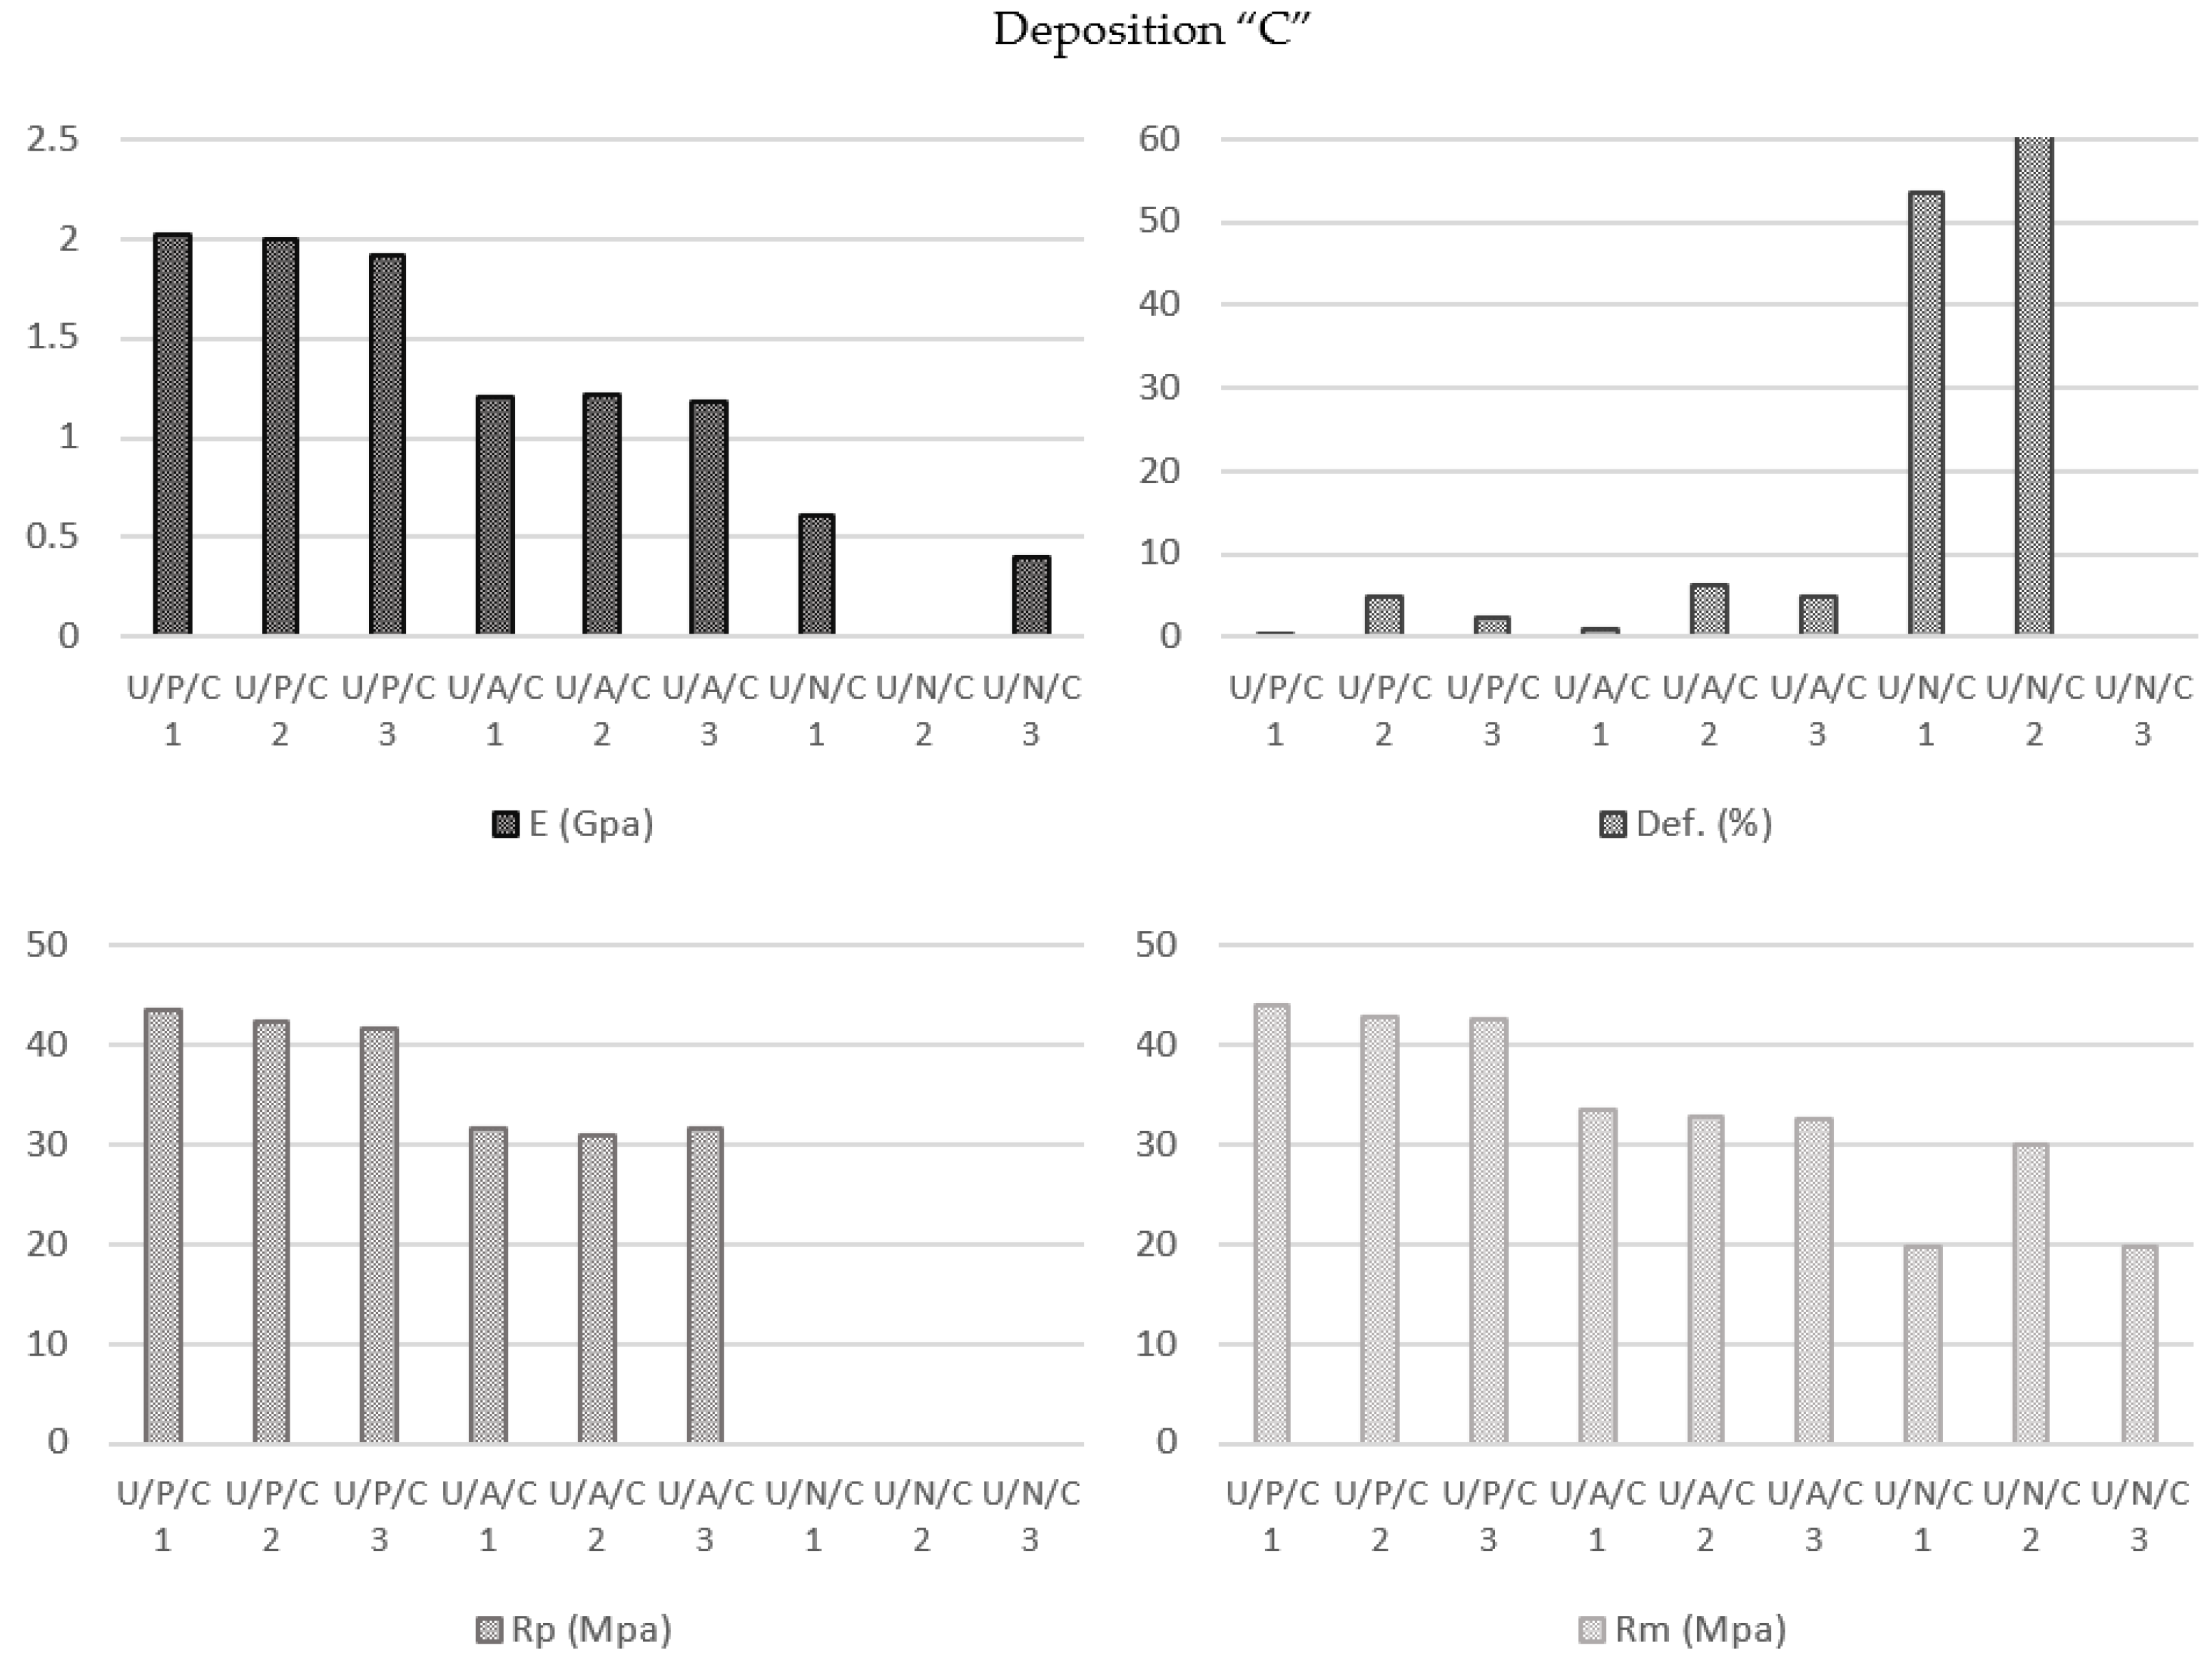
3.2.3. Material Influence on Specimens Manufactured by Ultimaker Printer with Concentric Deposition Pattern (U/P/C vs. U/A/C vs. U/N/C)
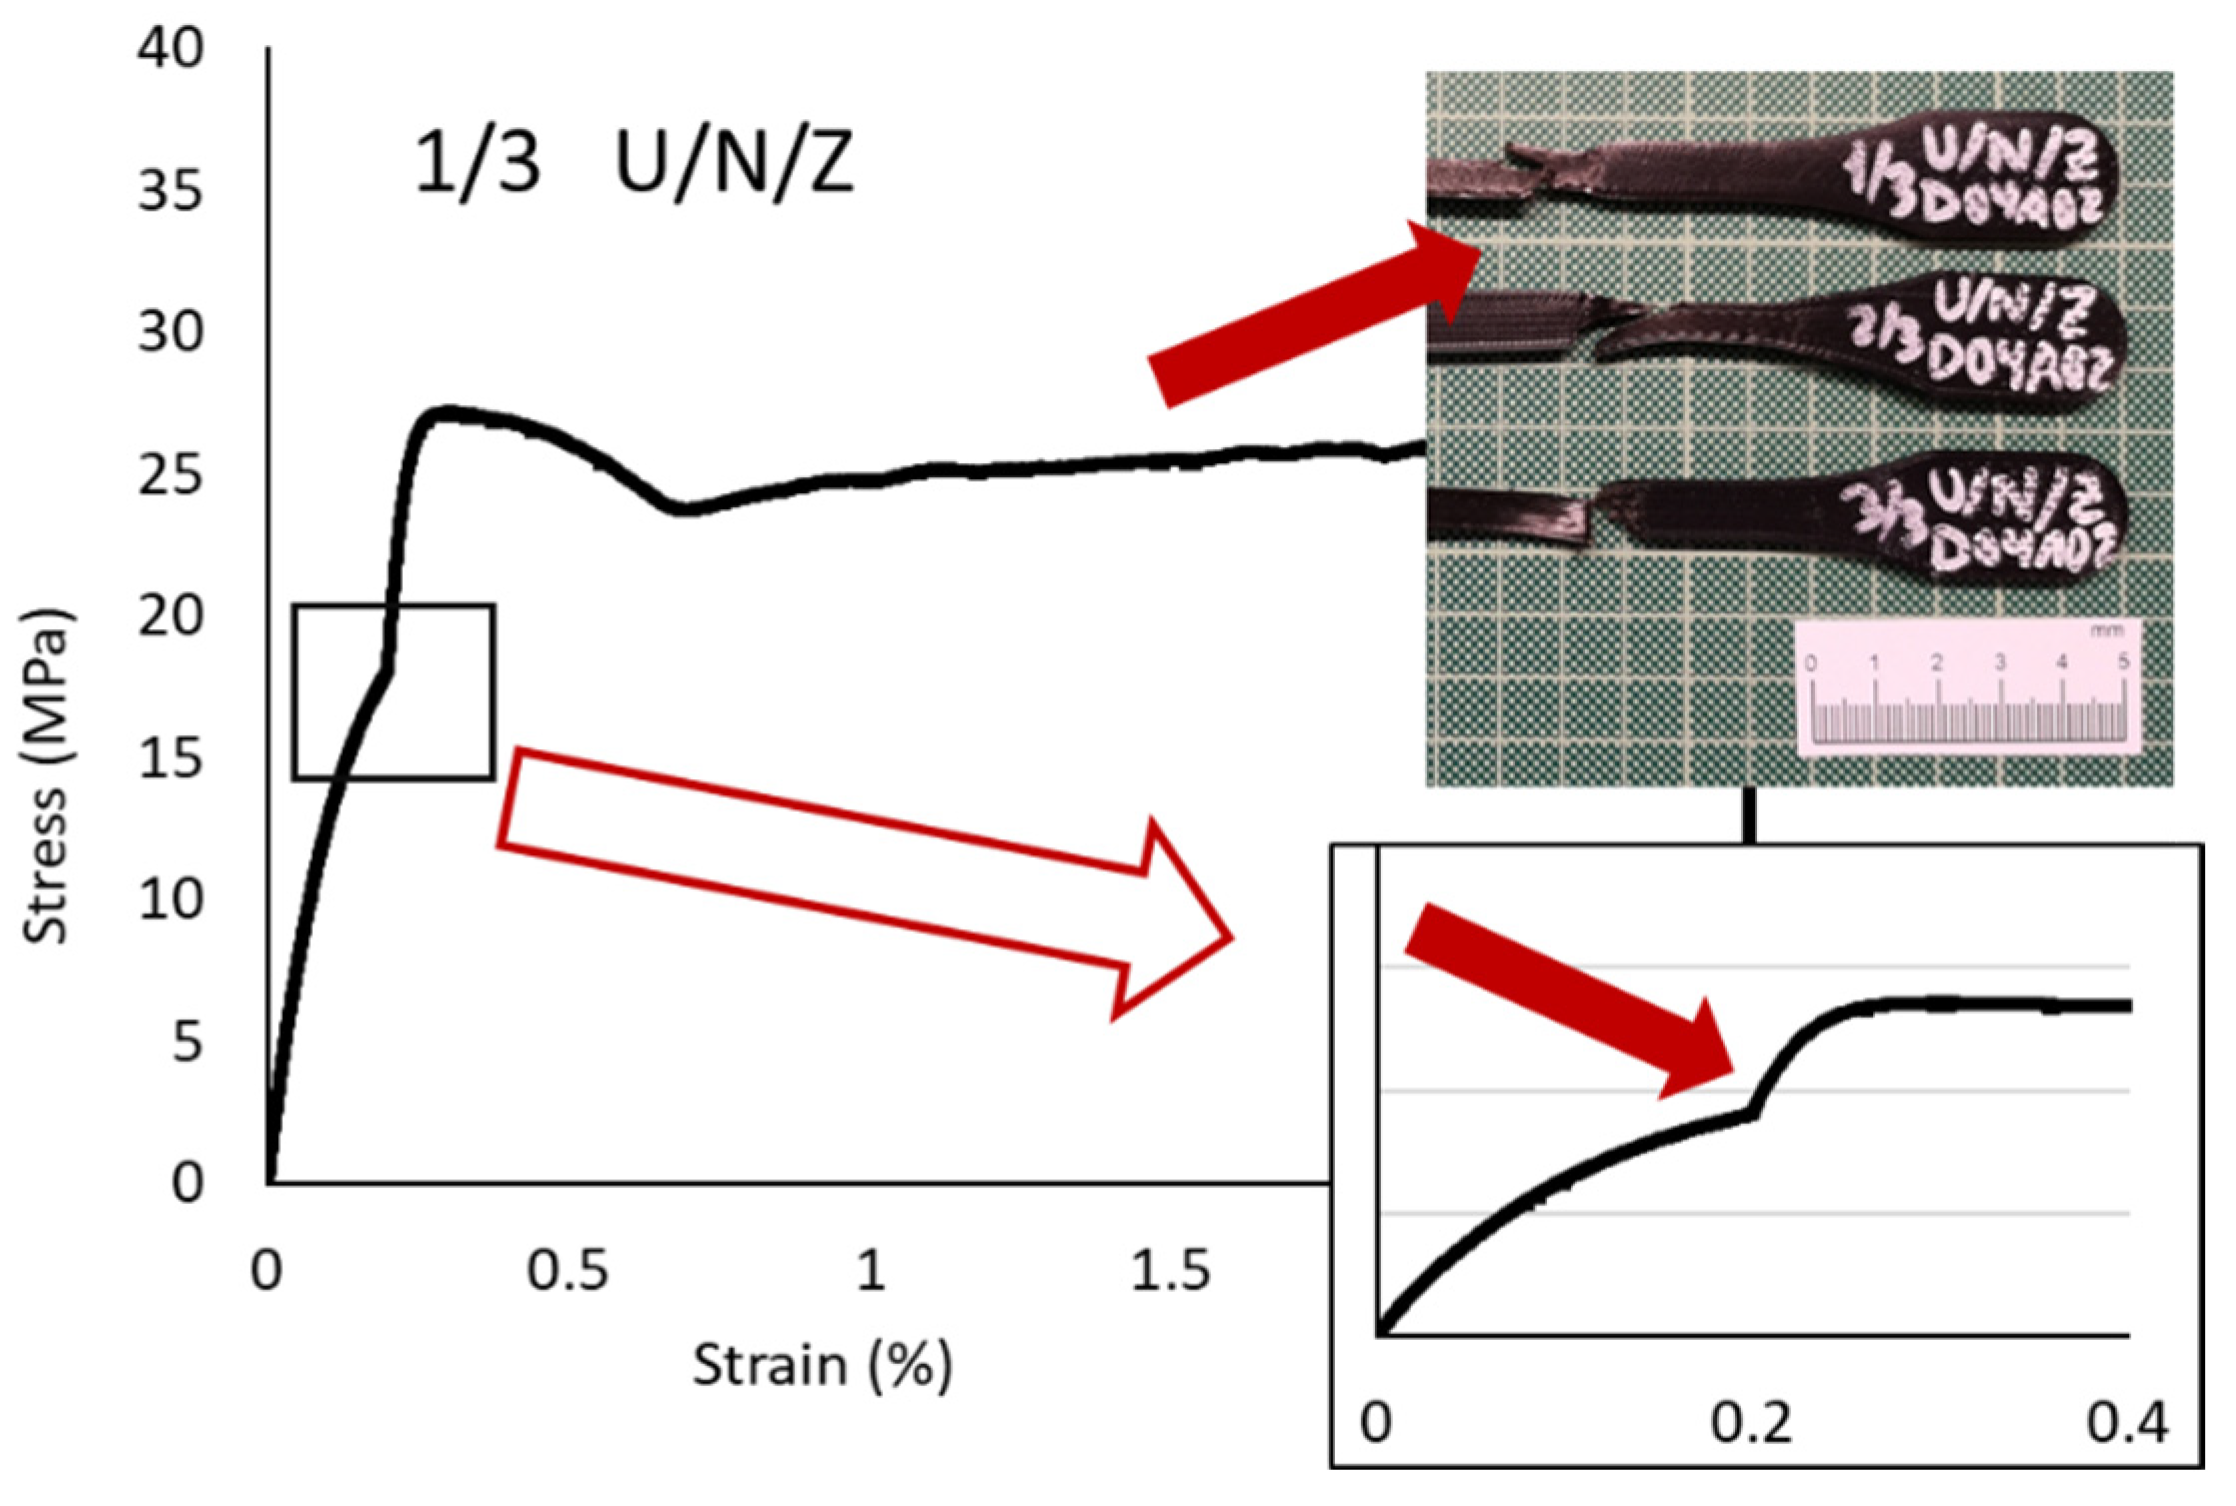
3.2.4. Material Influence on Specimens Manufactured by Ultimaker Printer with Zig-Zag Deposition Pattern (U/P/Z vs. U/A/Z vs. U/N/Z)
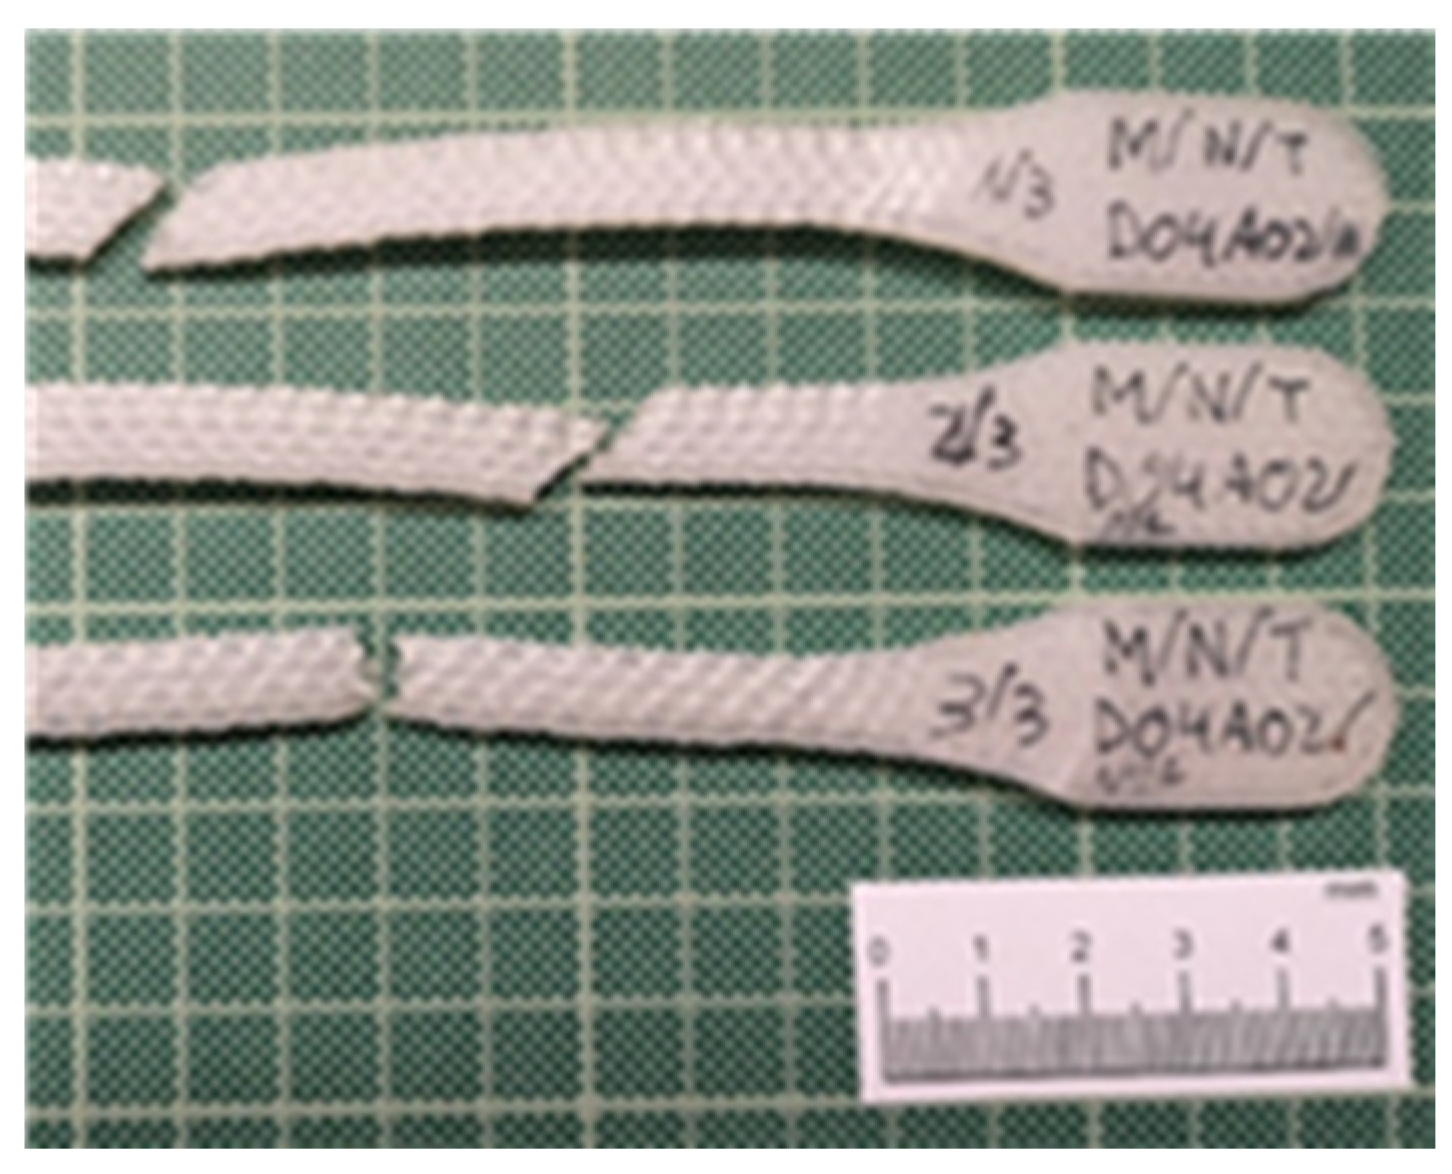
3.2.5. Infill Pattern and Printing Equipment Influences on Nylon Specimens ((U/N/C vs. U/N/Z vs. U/N/T vs. M/N/Z vs. M/N/T)
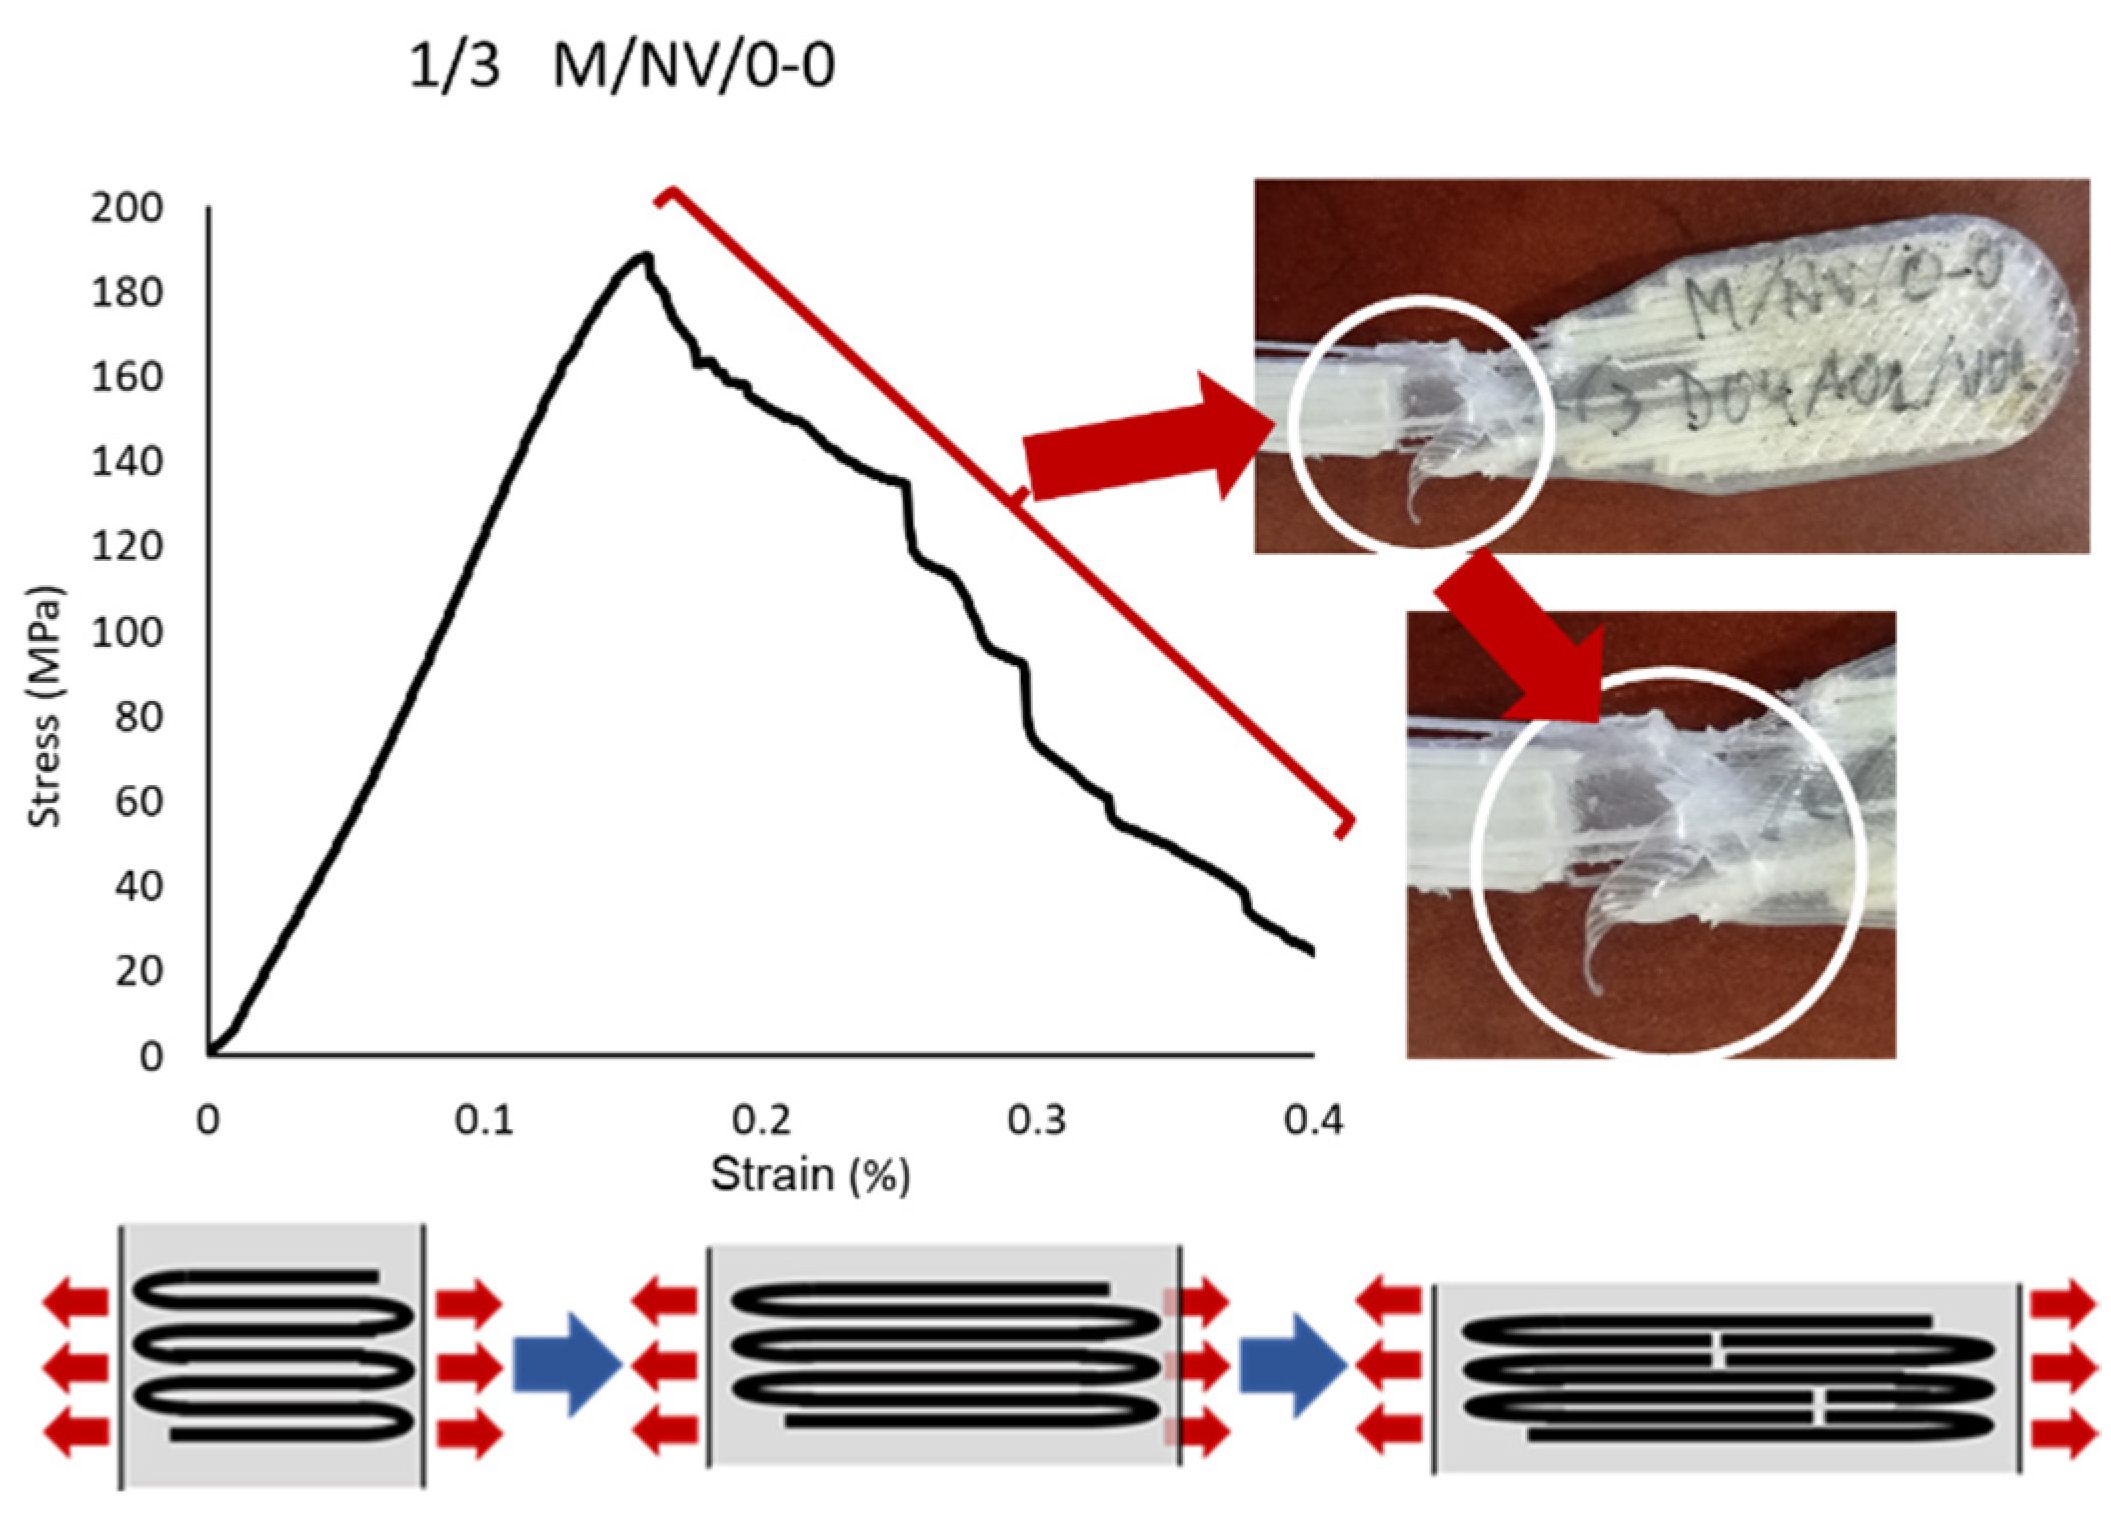
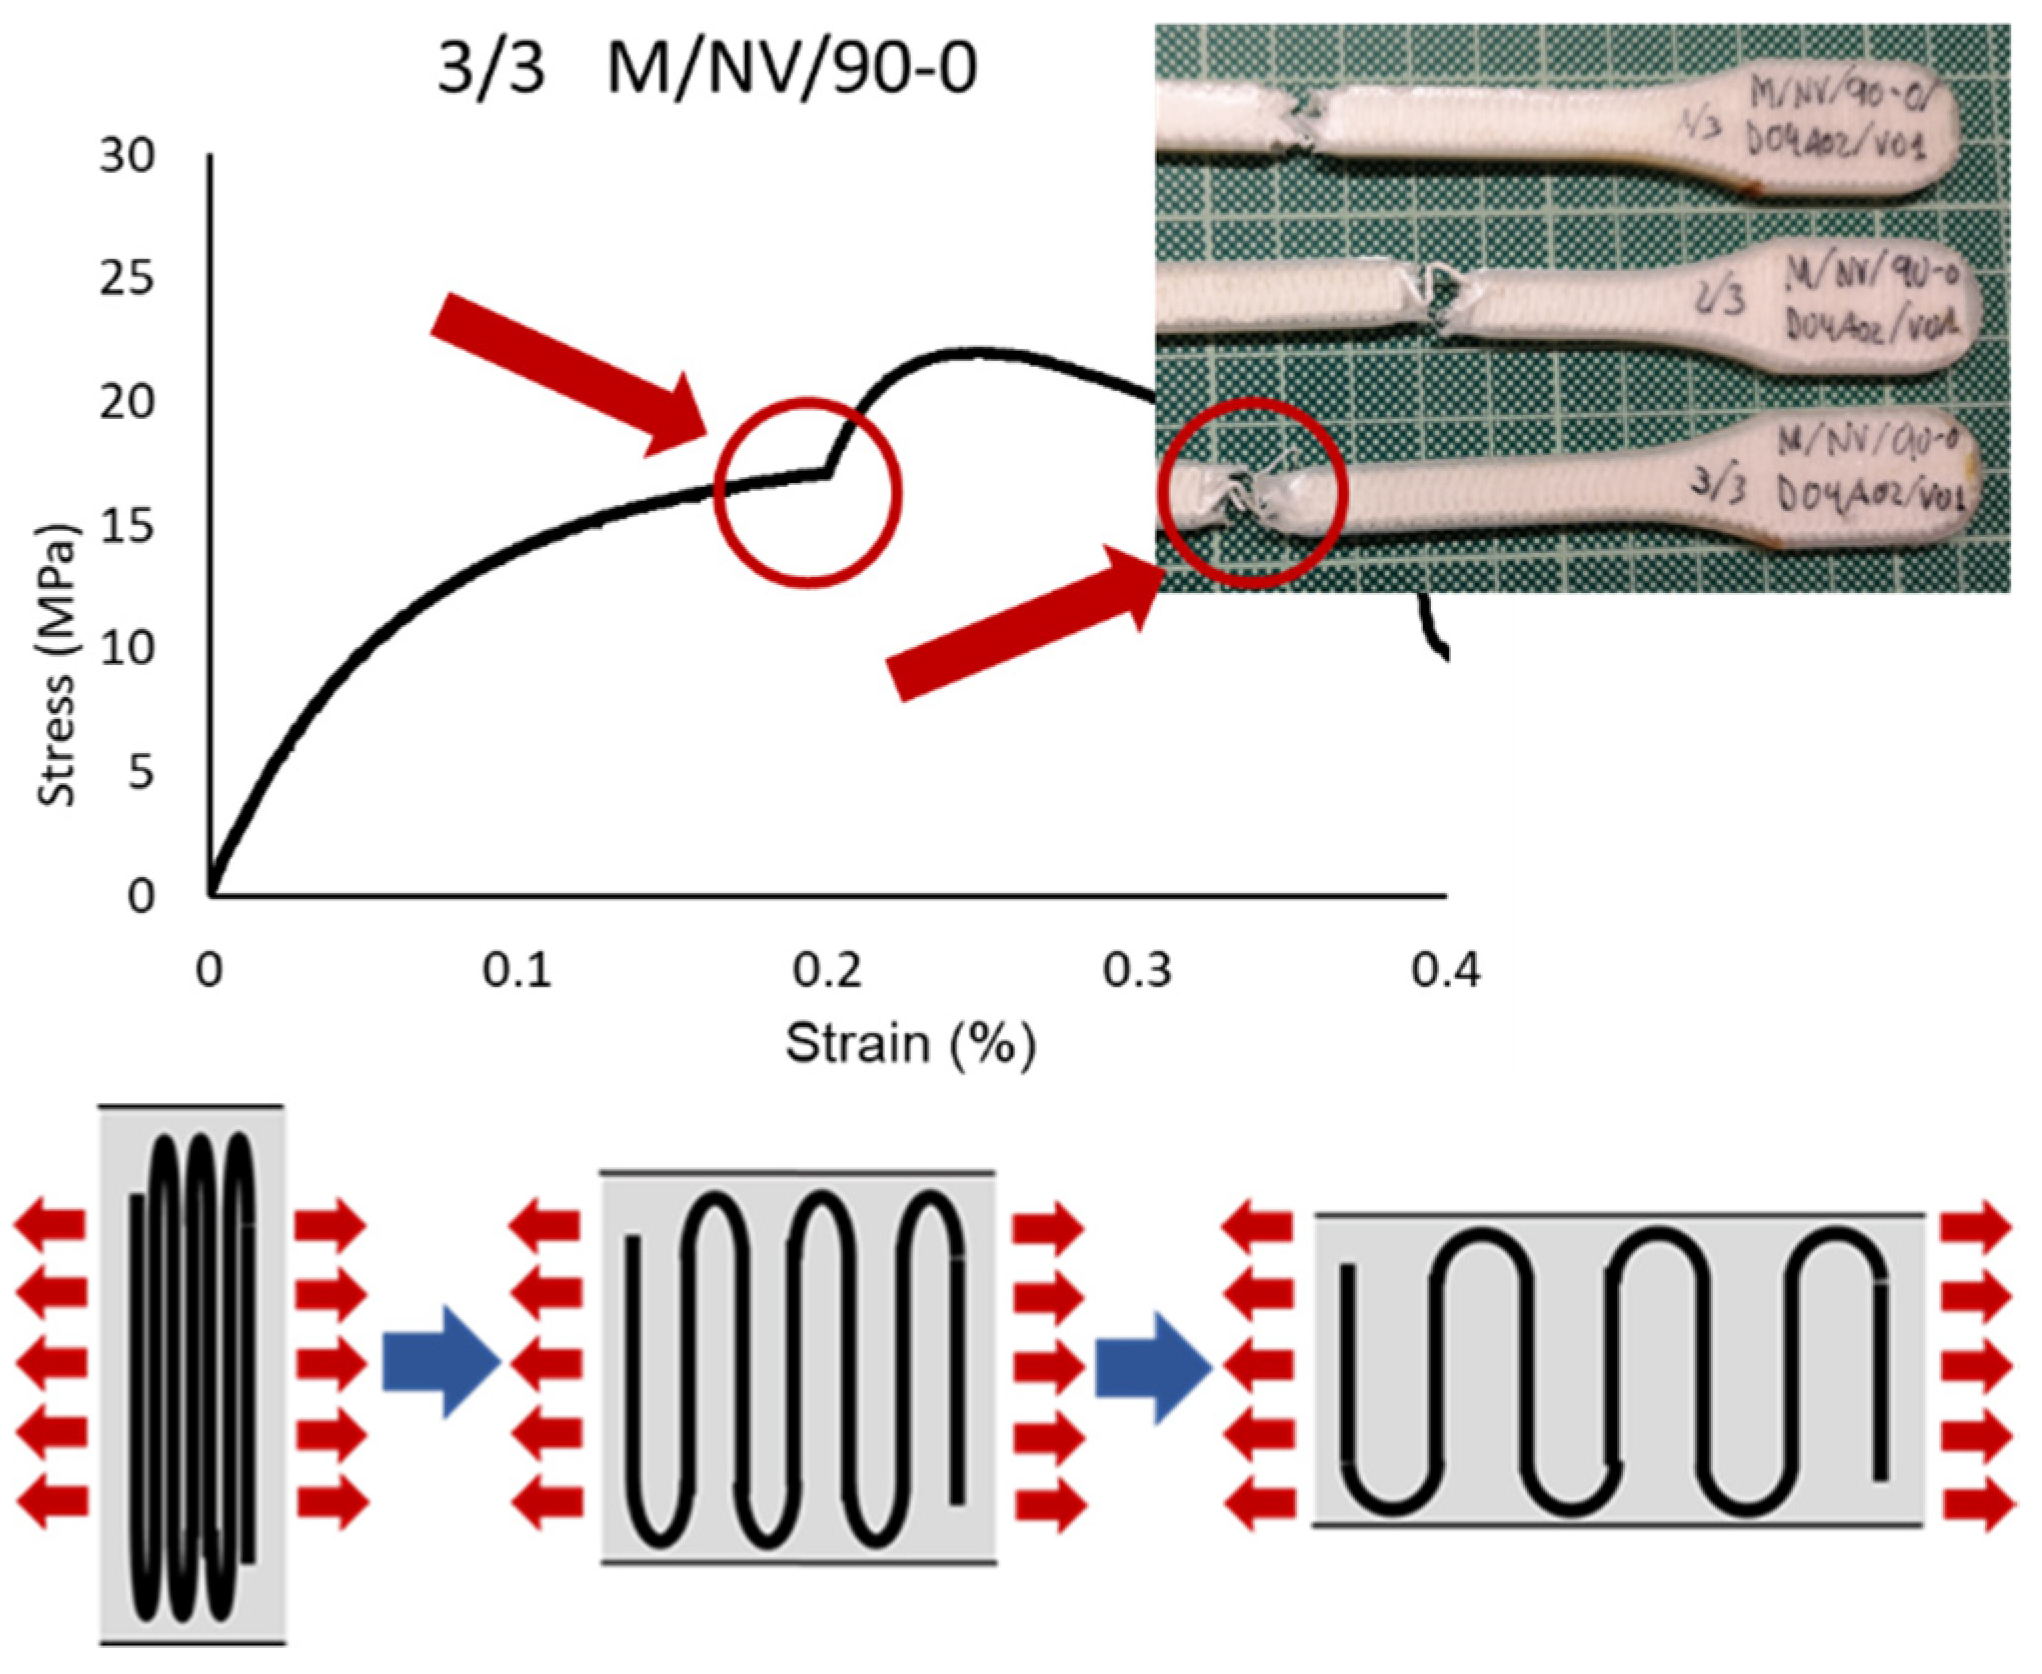
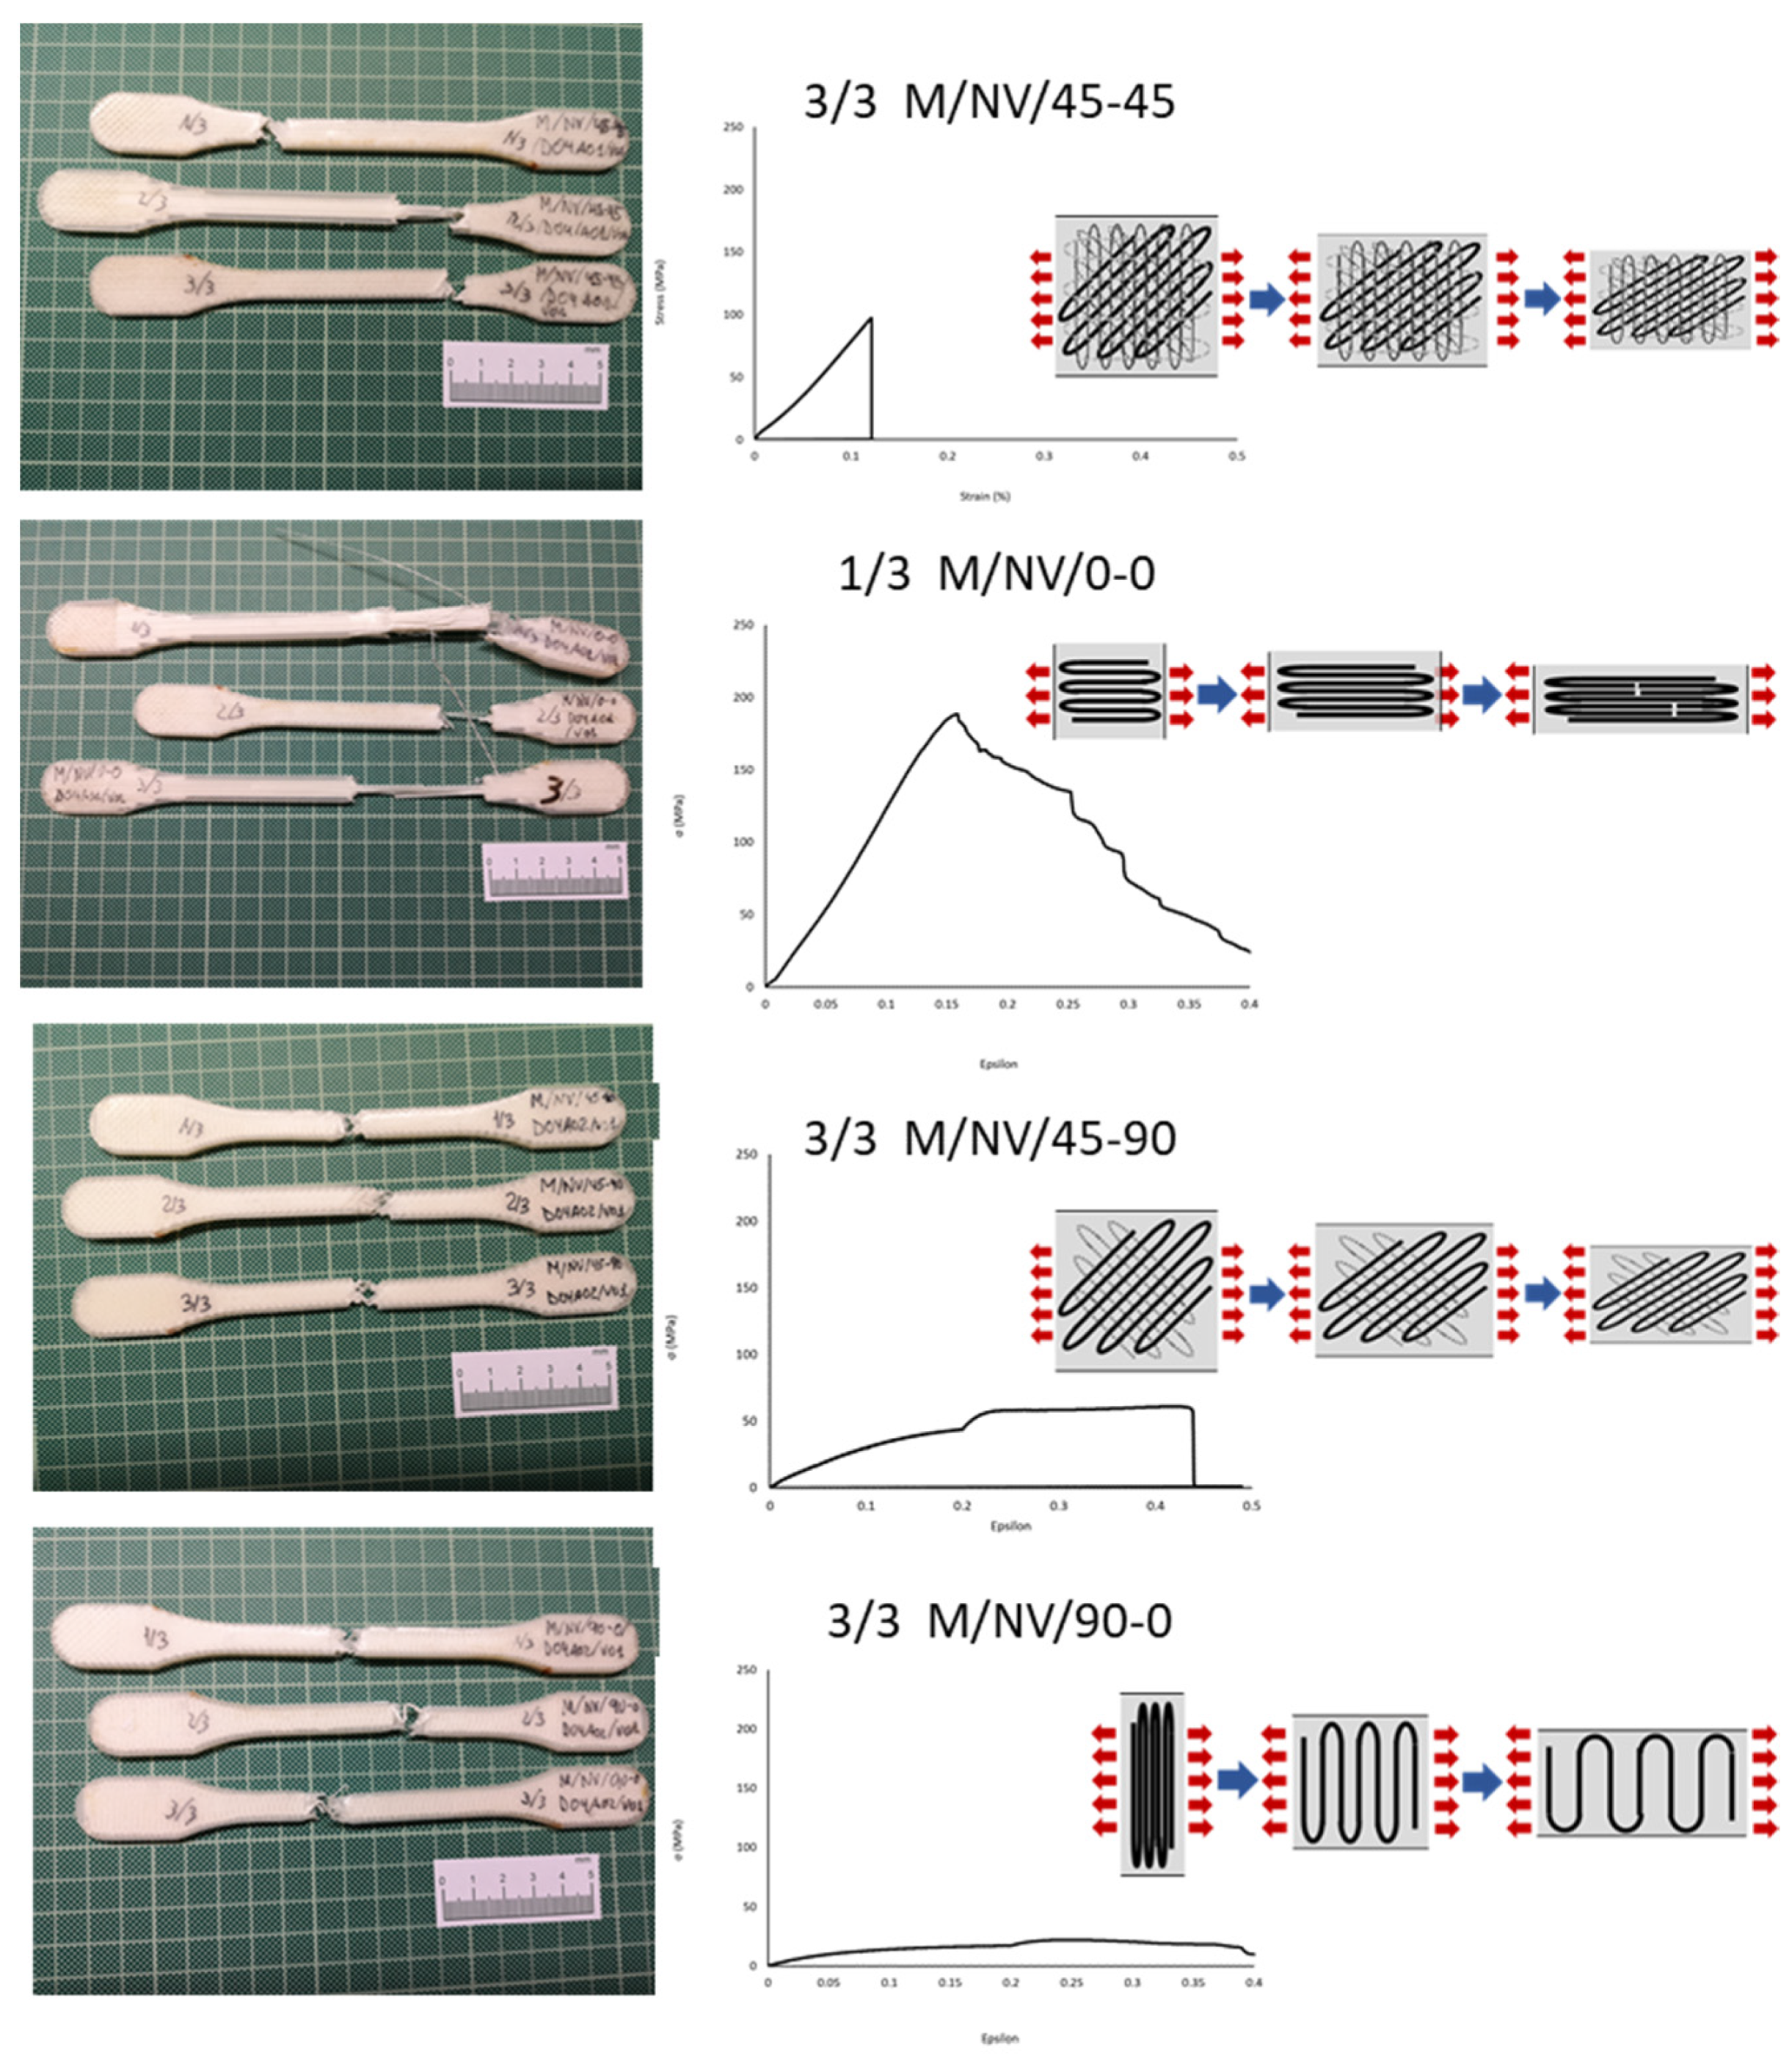
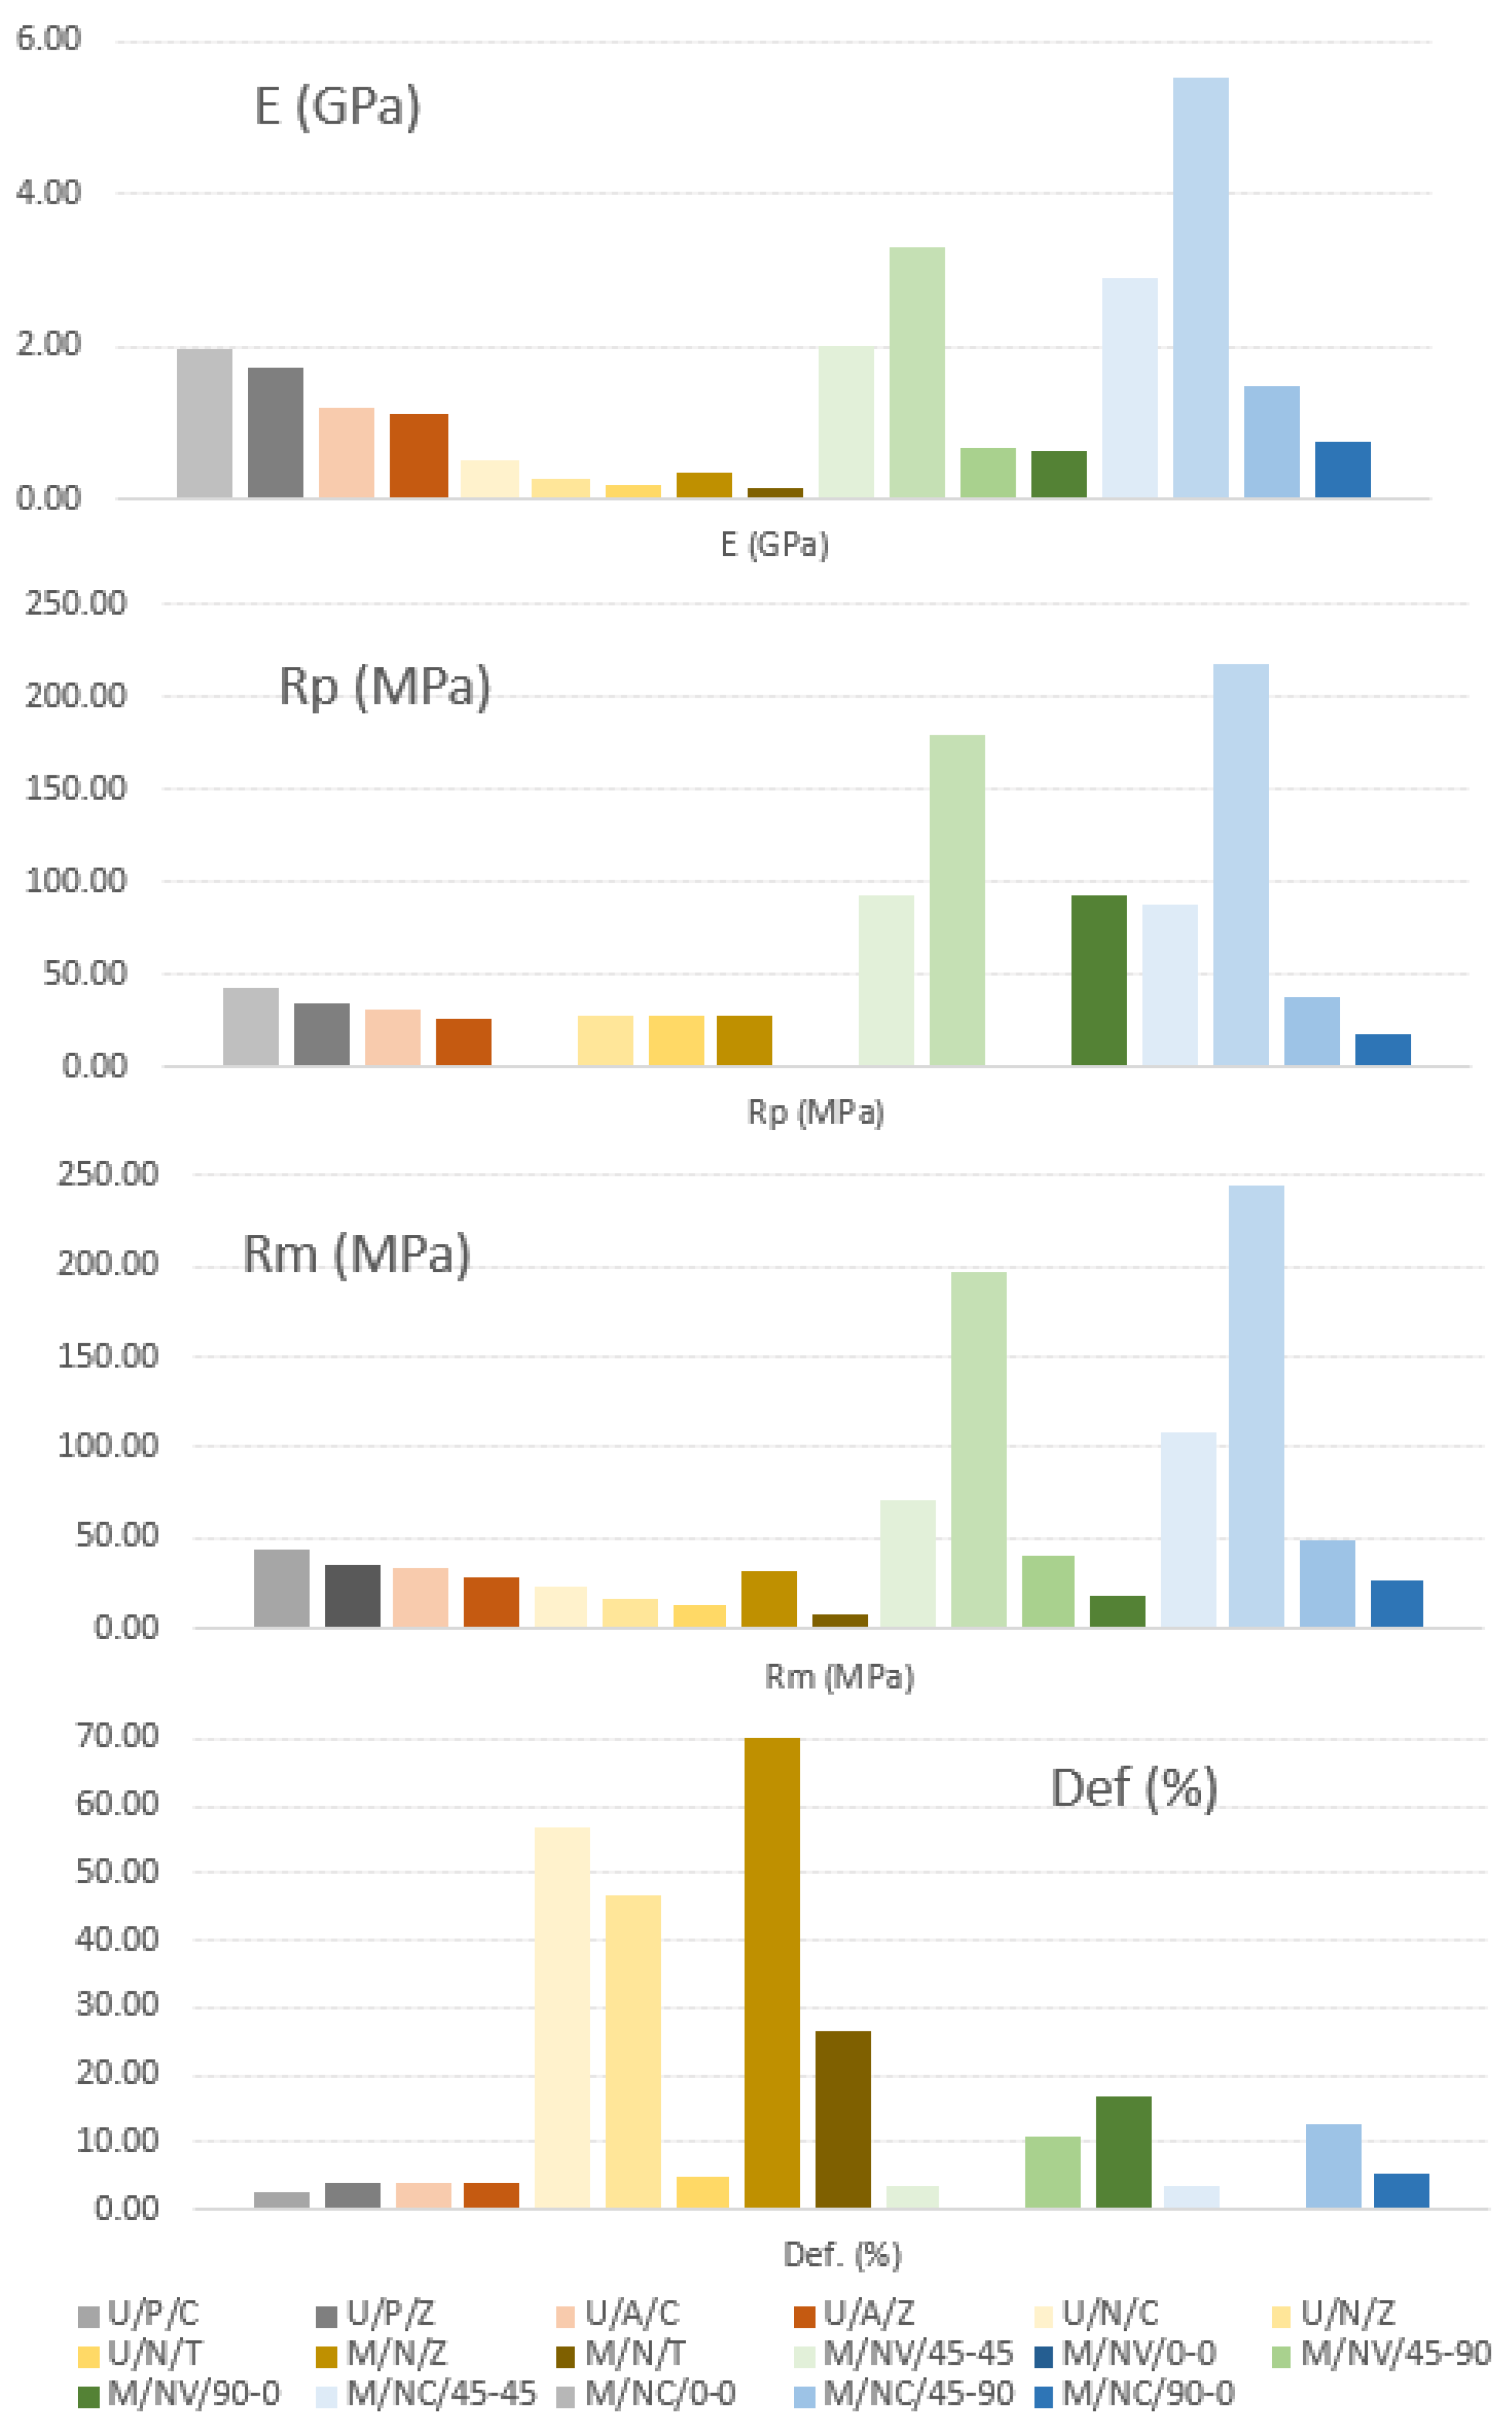
3.2.6. Infill Pattern Influence on Fiber Type (45-45 vs. 0-0 vs. 45-90 vs. 90-0)
Glass Fiber-Reinforced Nylon Polymer ((M/NV/45-45 vs. M/NV/0-0 vs. M/NV/45-90 vs. M/NV/90-0)
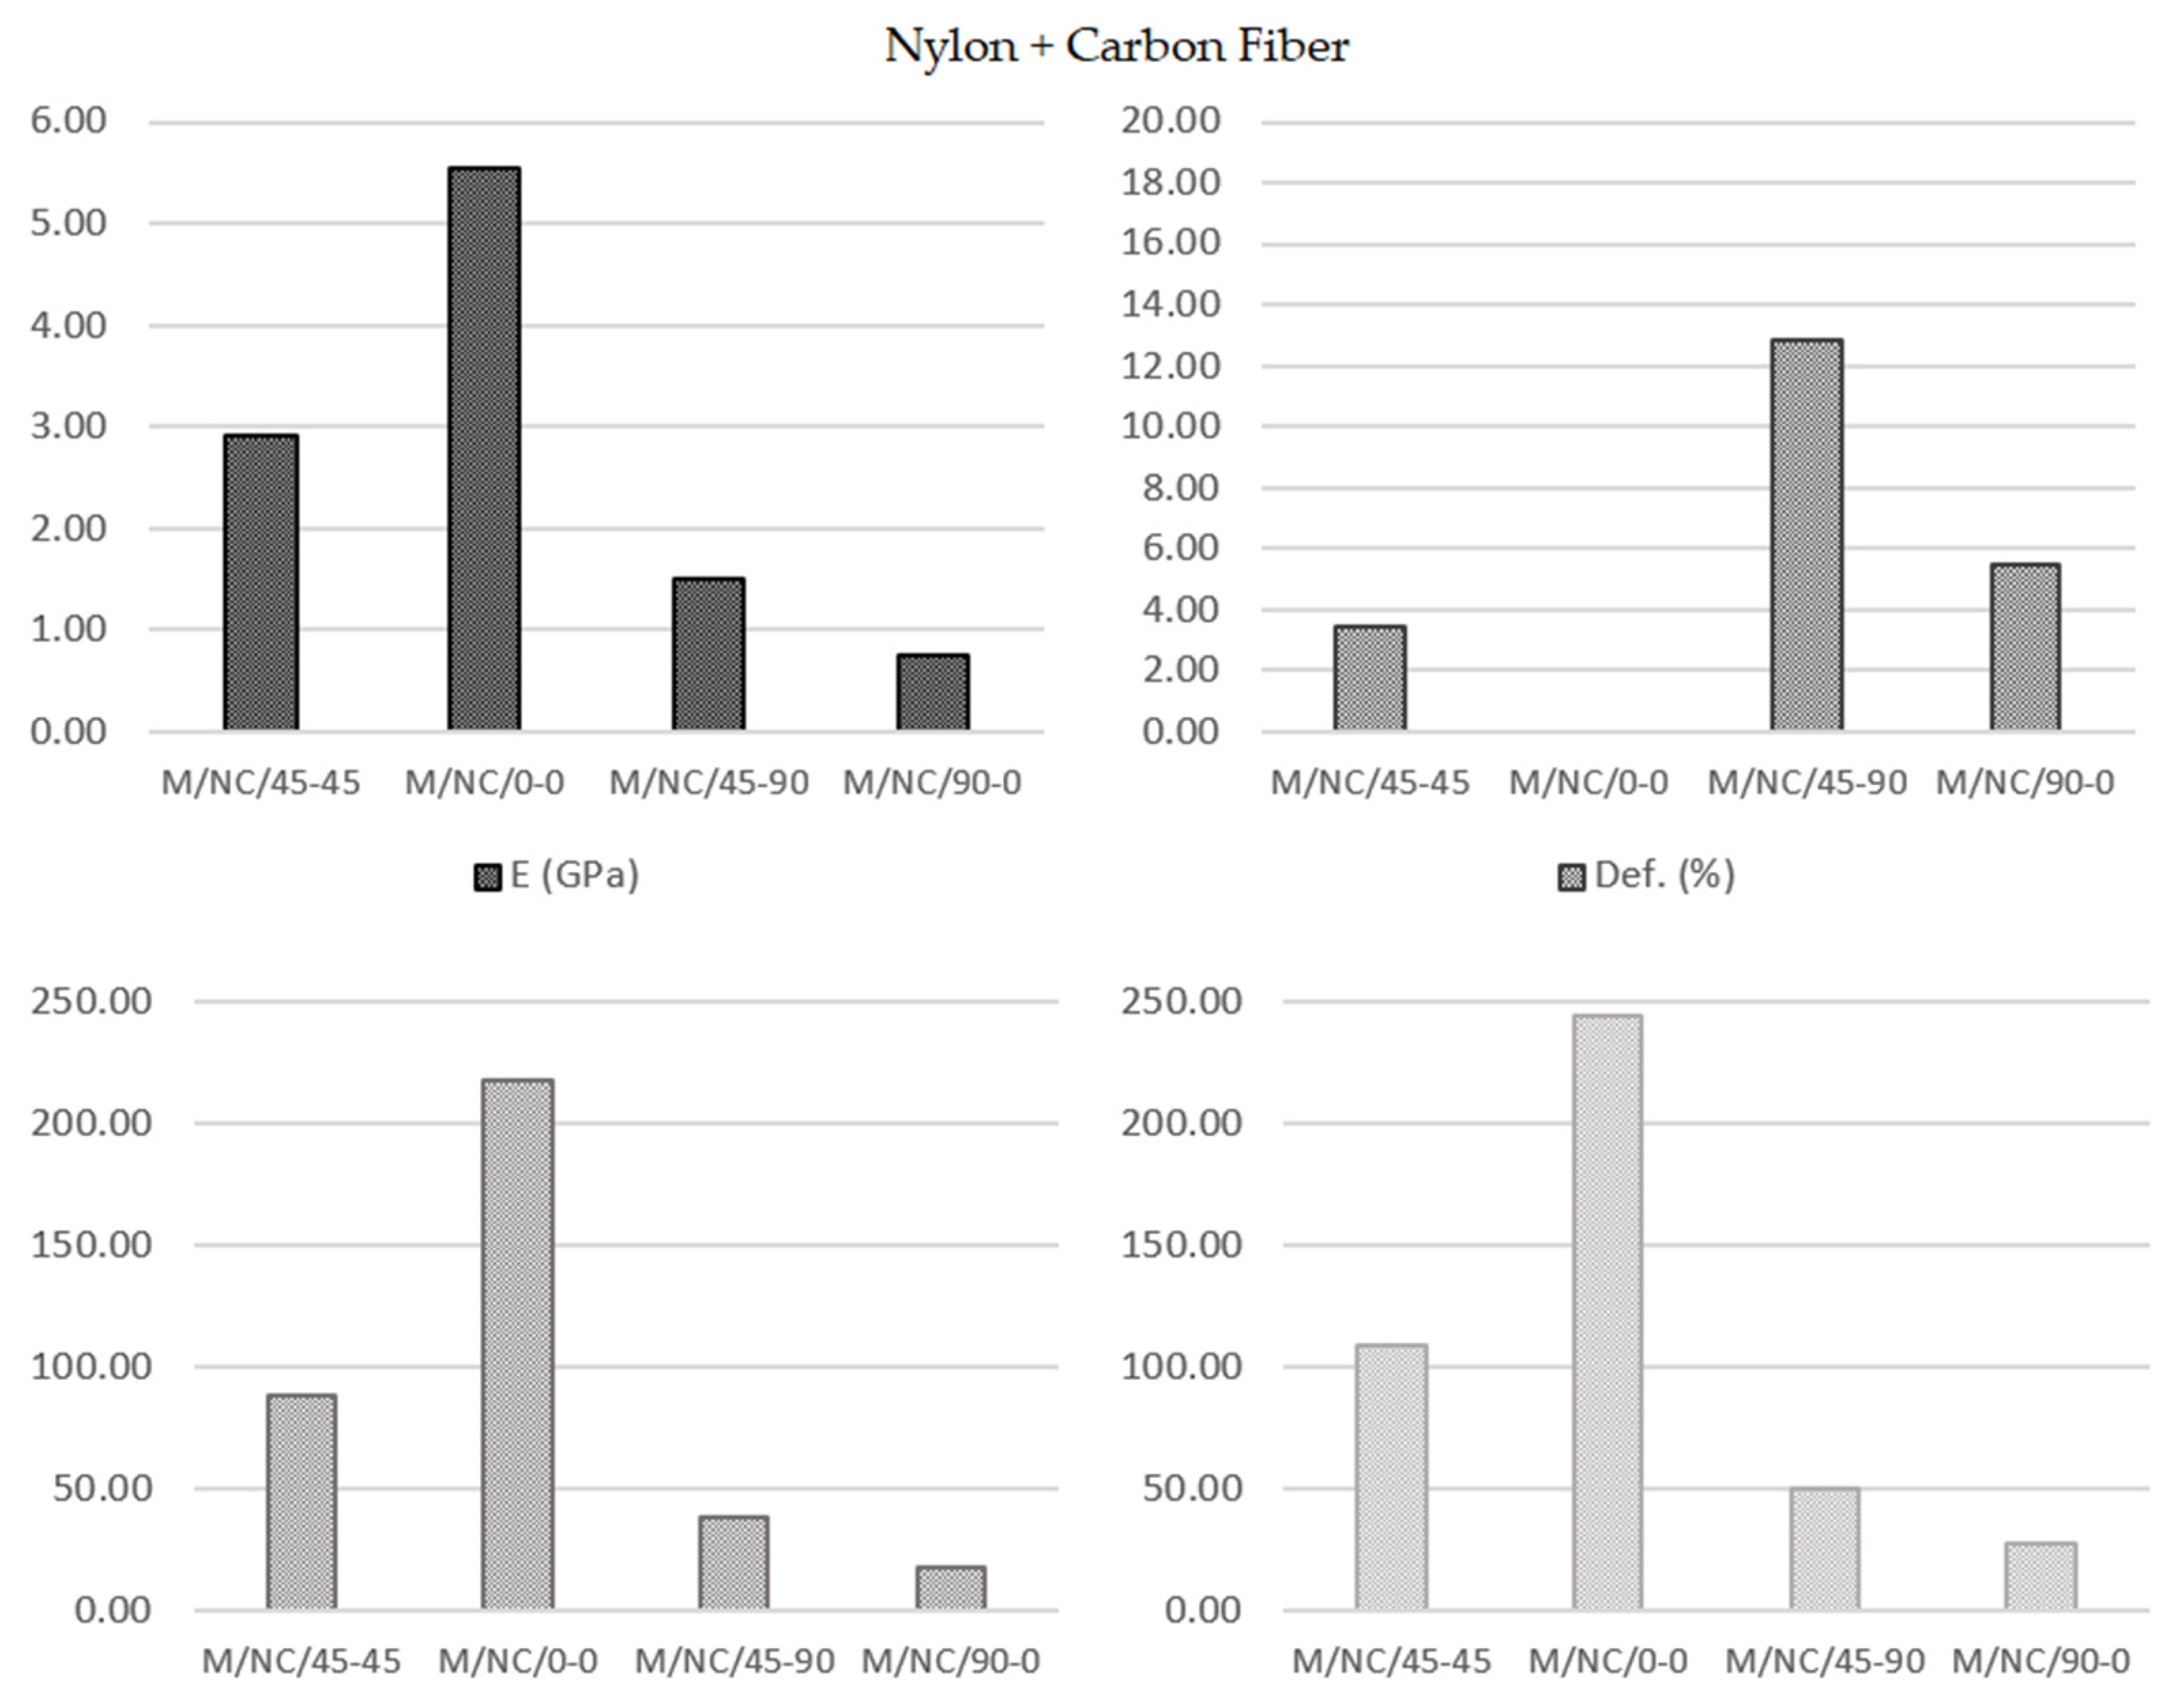
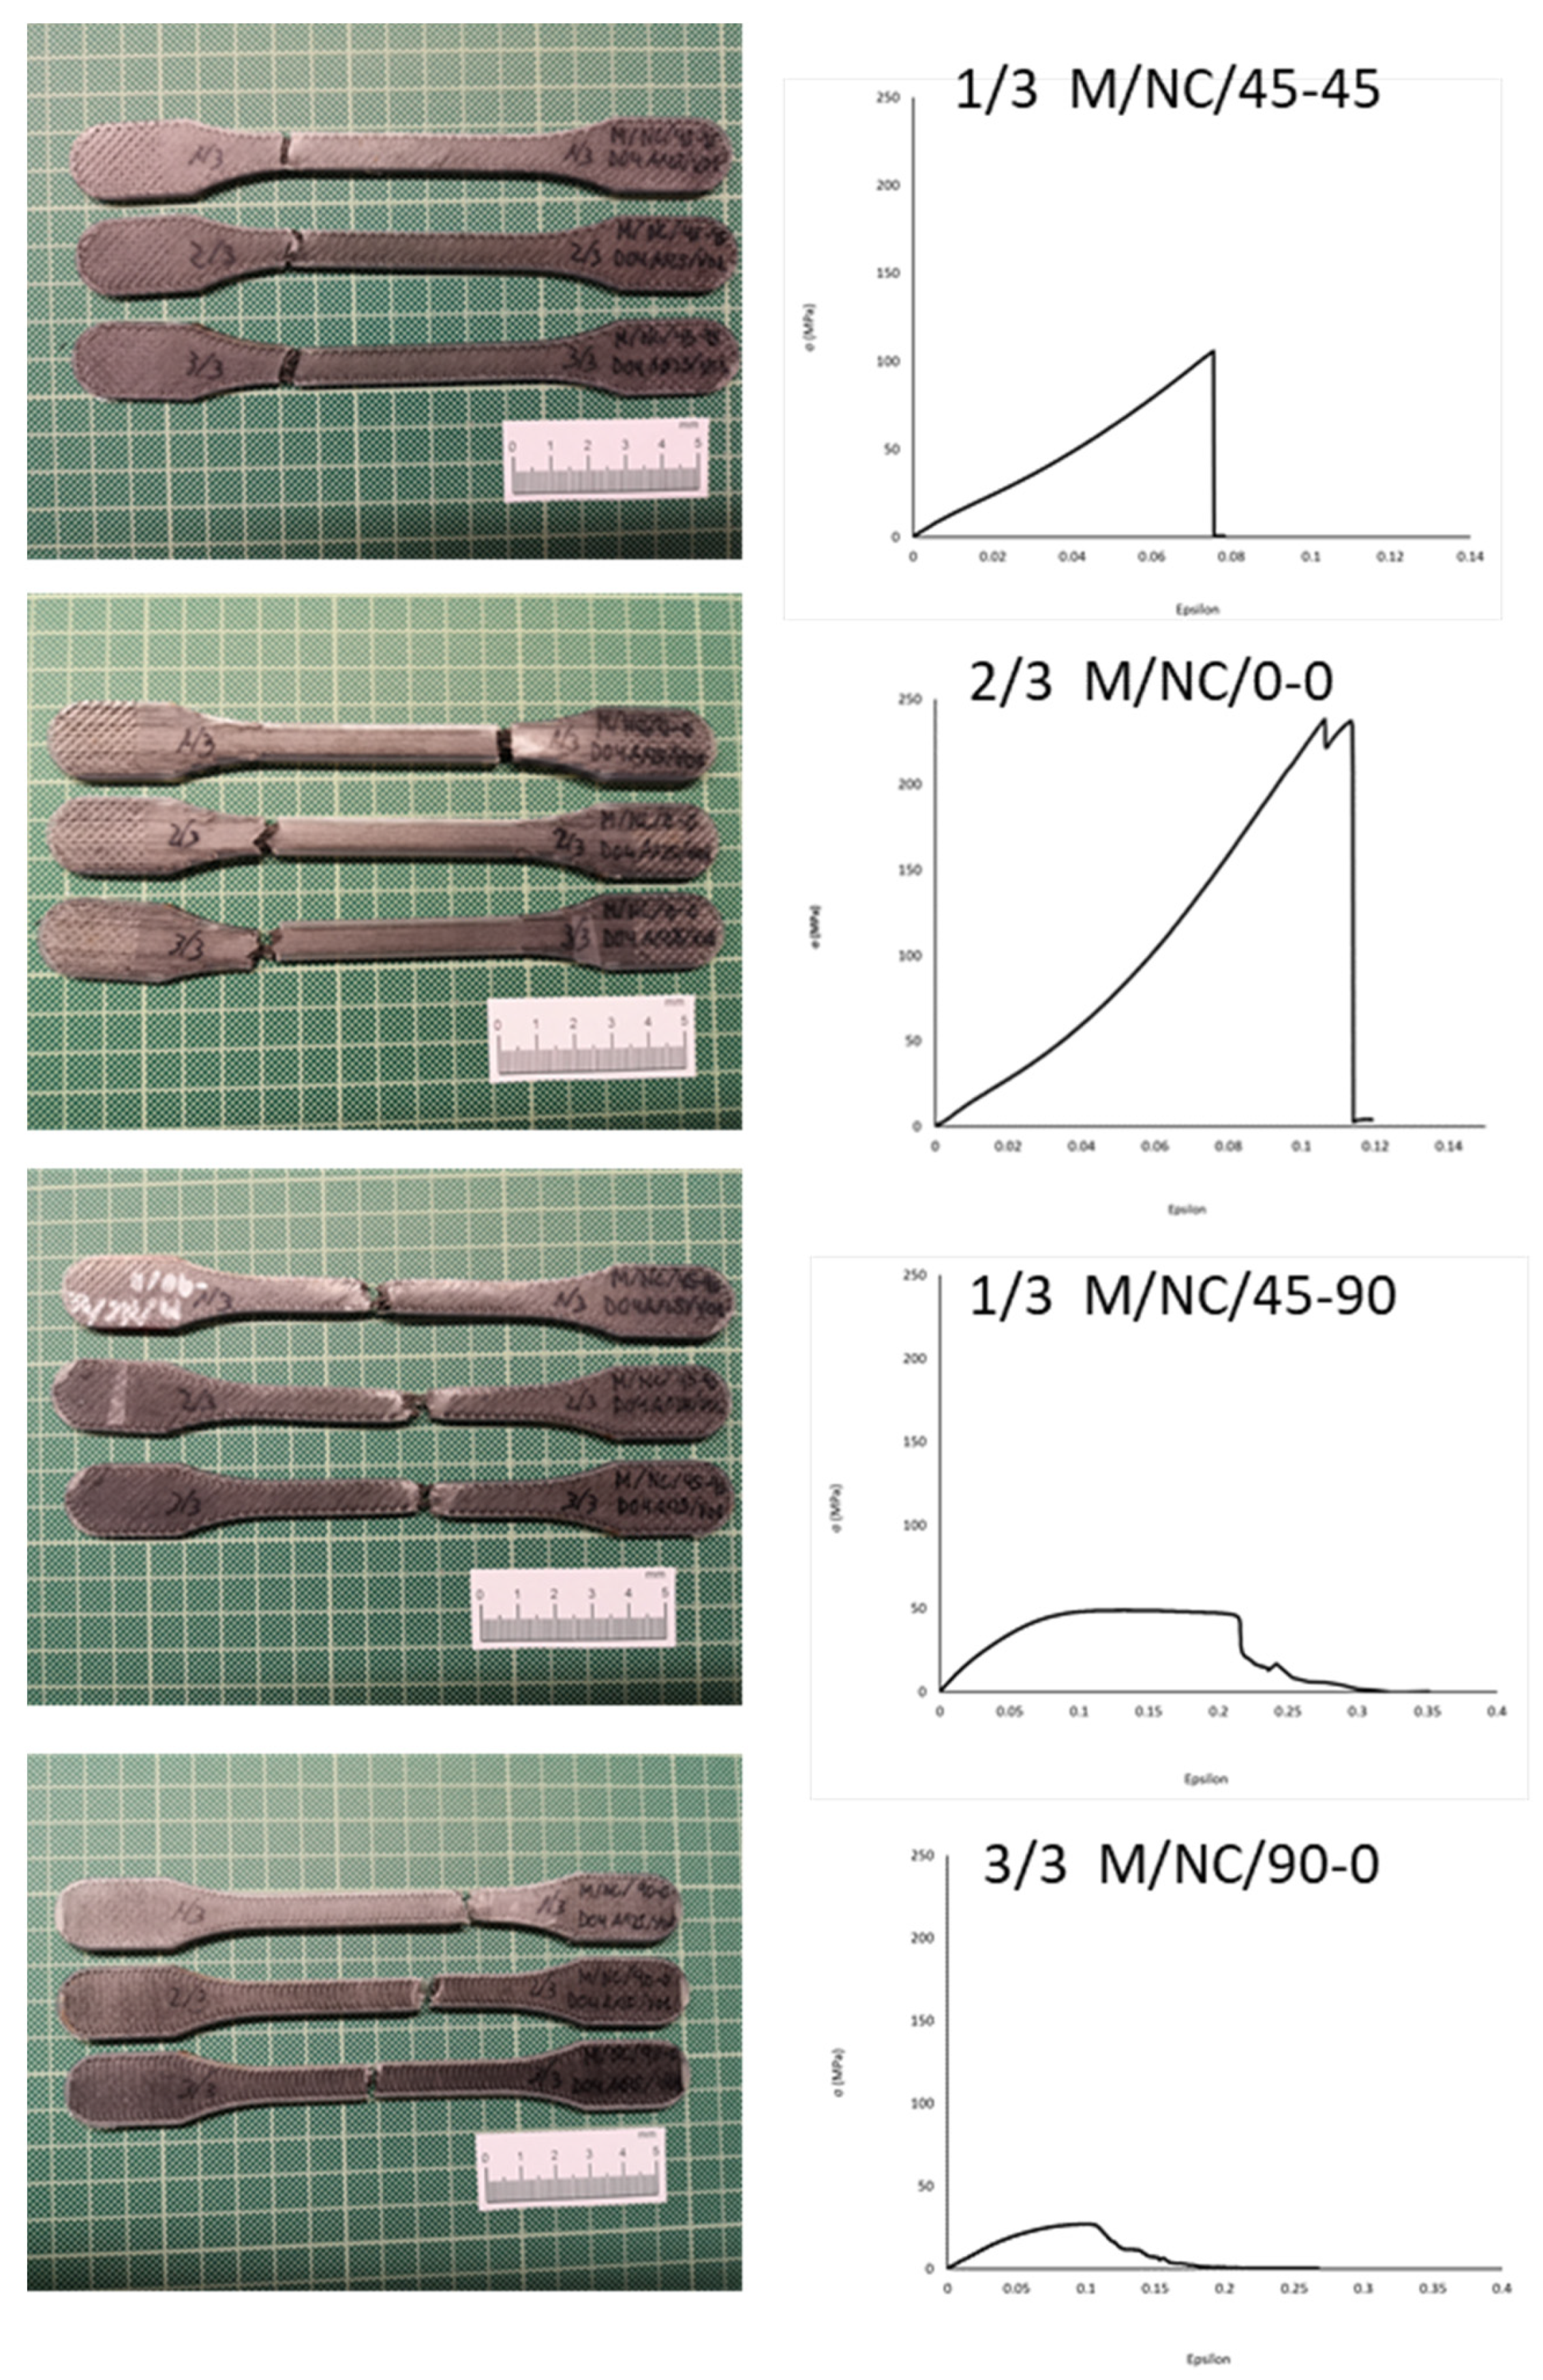
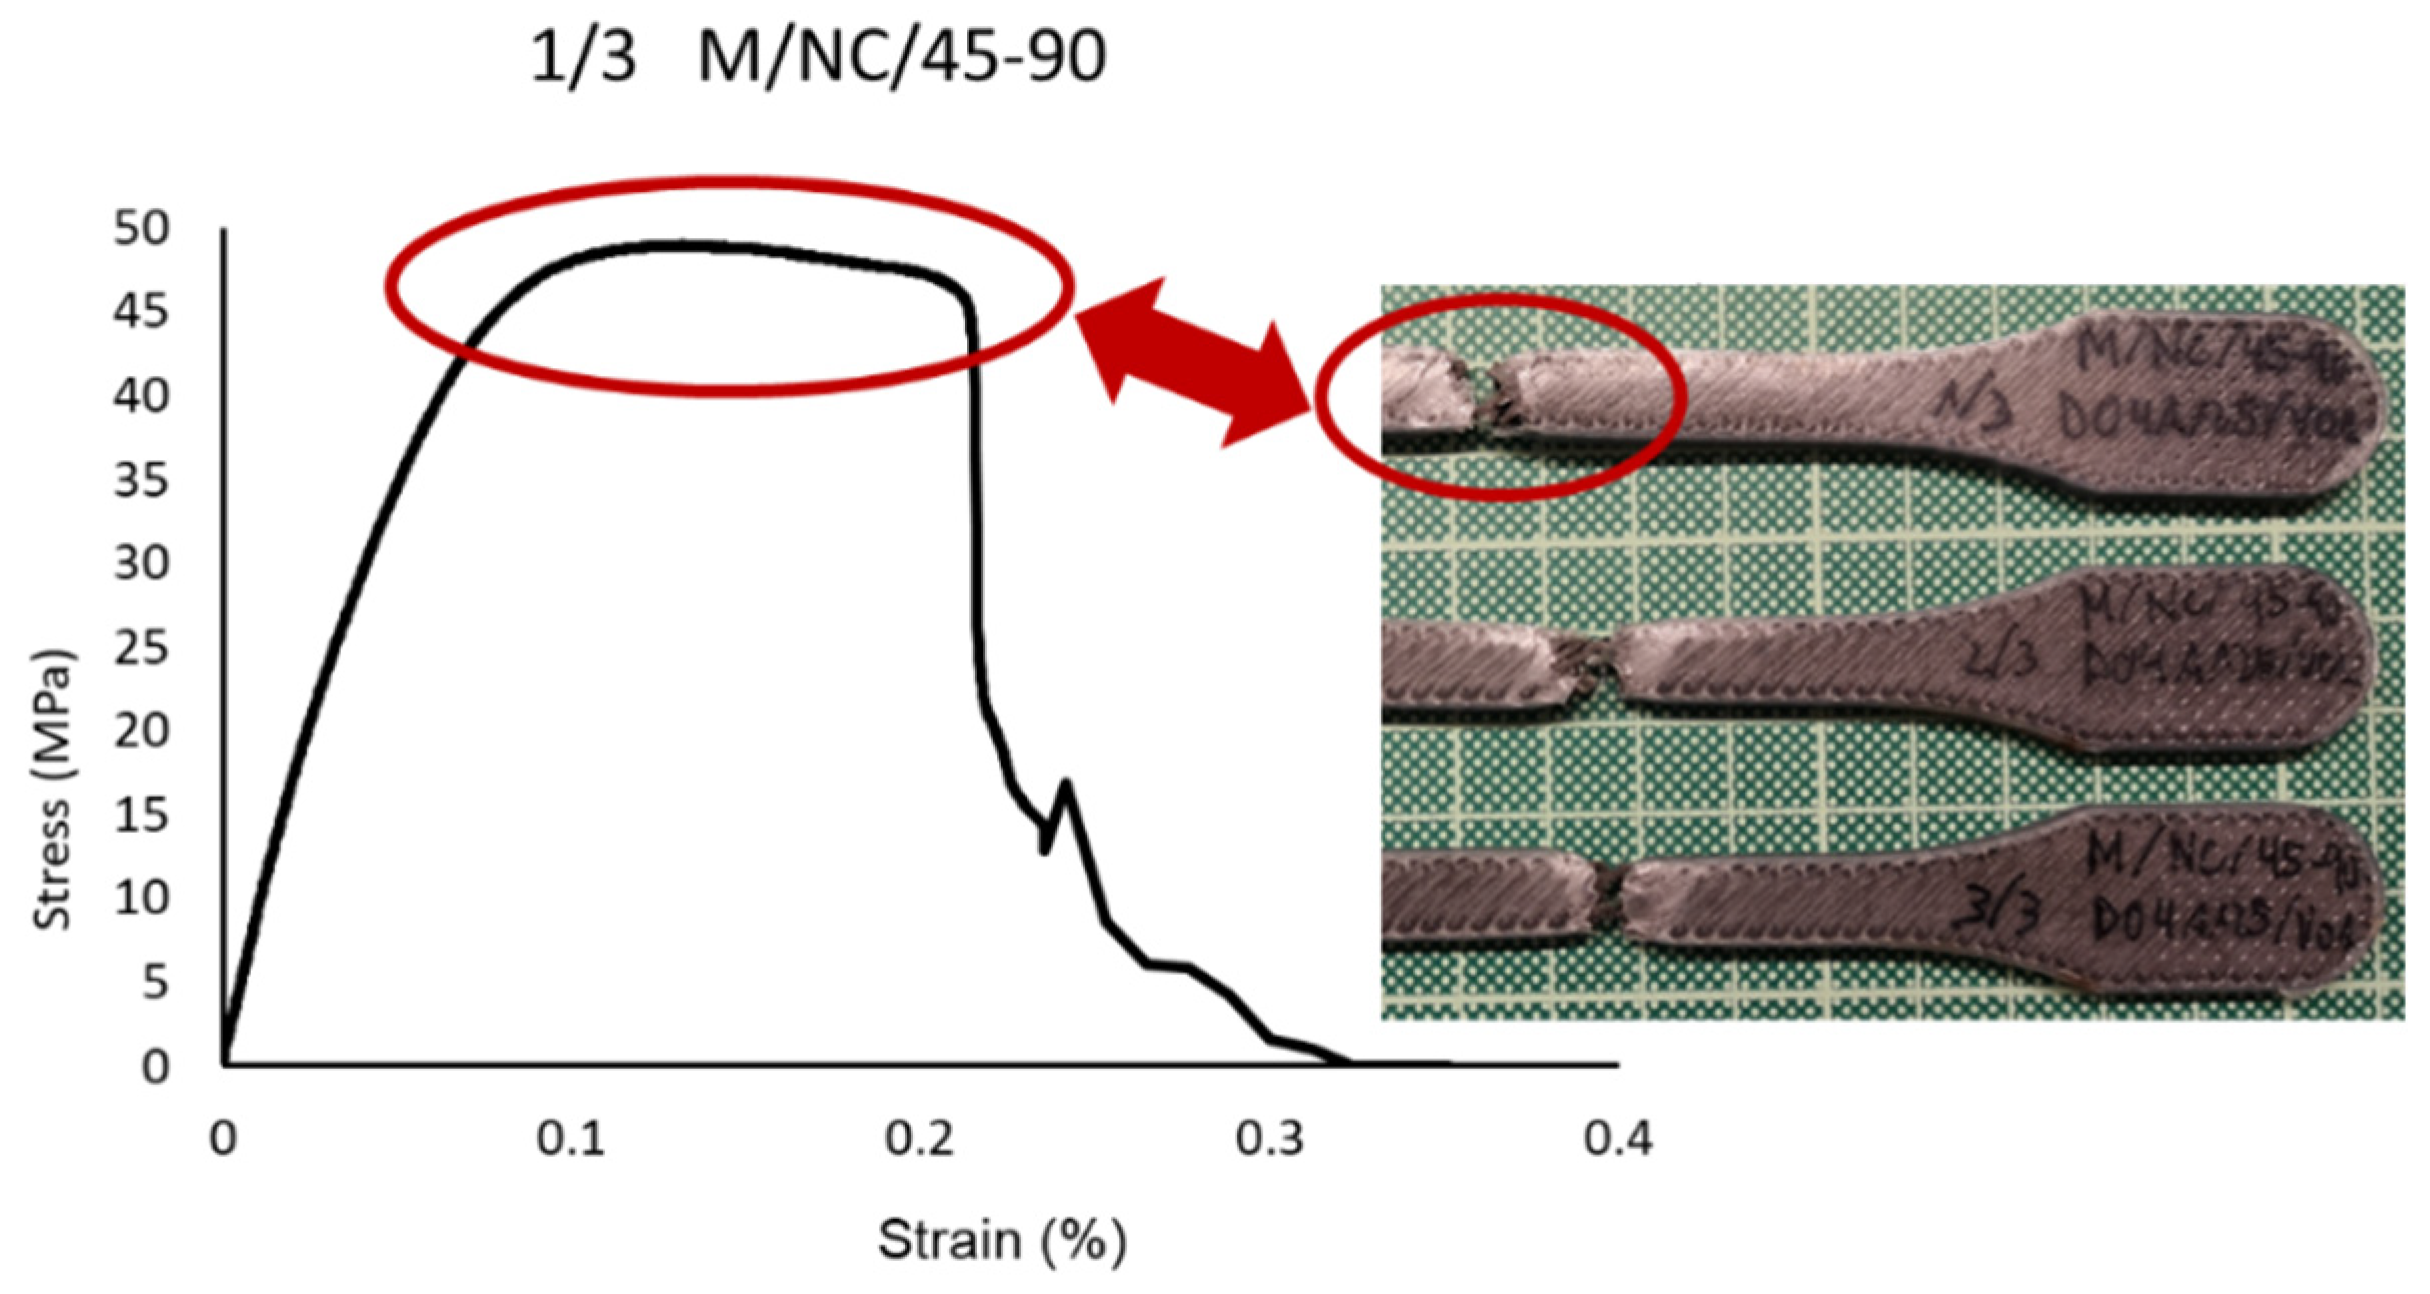
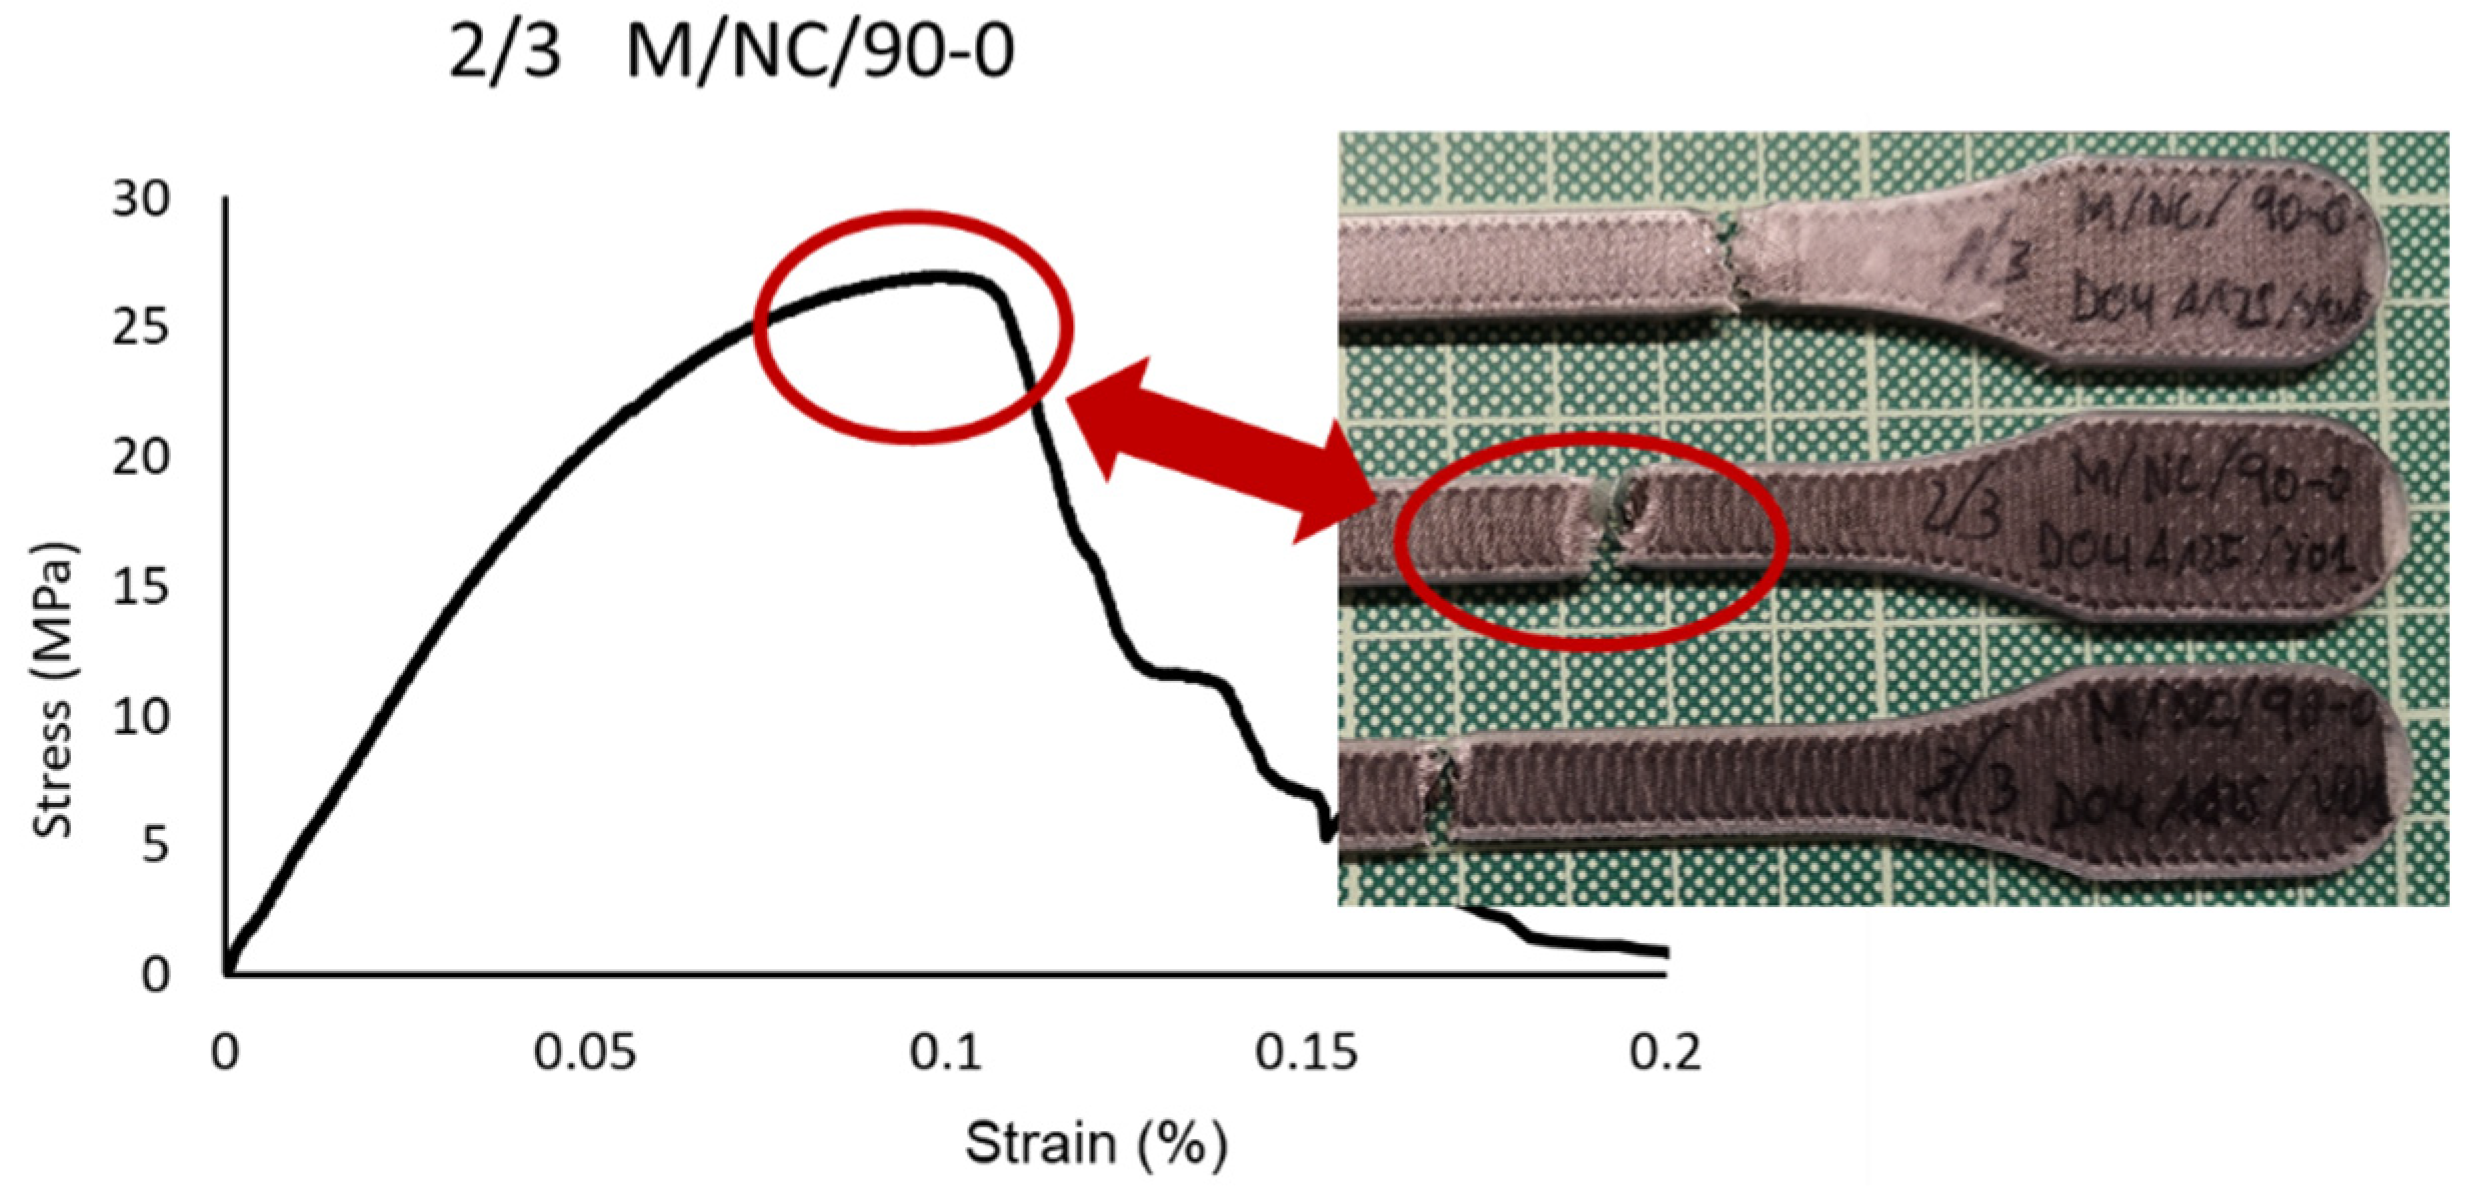
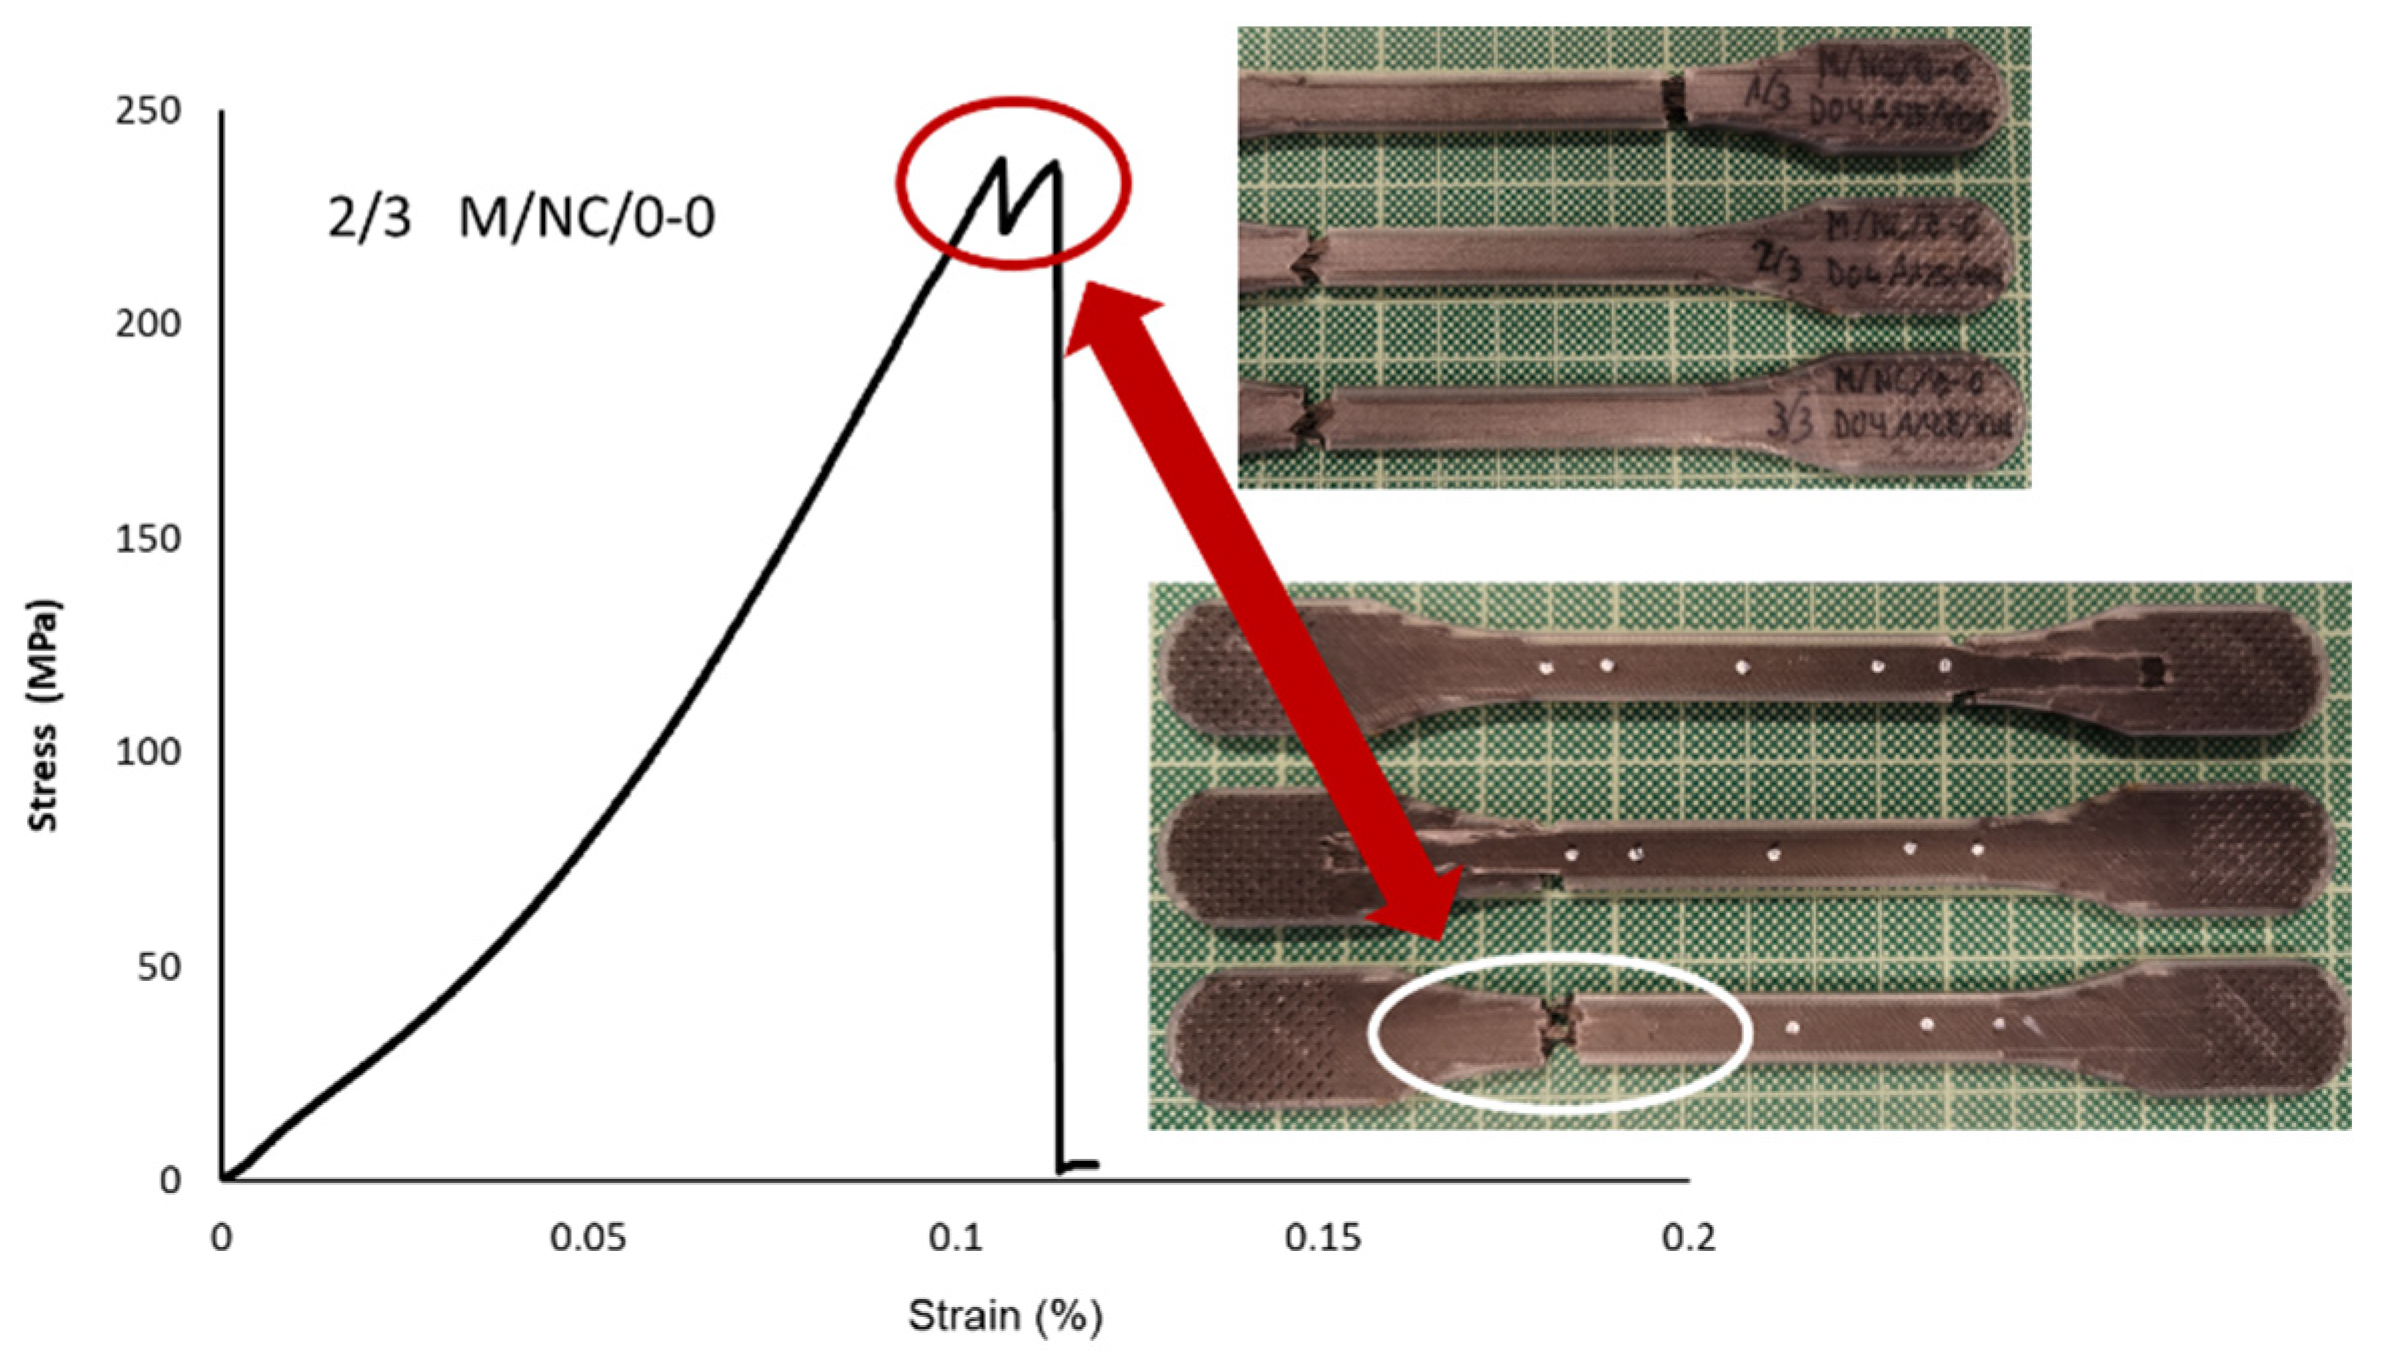
Carbon Fiber-Reinforced Nylon Polymer (M/NC/45-45 vs. M/NC/0-0 vs. M/NC/45-90 vs. M/NC/90-0)
4. Conclusions
- ❖
- Deposition pattern influence on polymeric specimens
- ❖
- Deposition pattern influence on reinforced polymer specimens.
Author Contributions
Funding
Institutional Review Board Statement
Informed Consent Statement
Data Availability Statement
Acknowledgments
Conflicts of Interest
References
- Yilmaz, O.; Ugla, A.A. Shaped metal deposition technique in additive manufacturing: A review. Proc. Inst. Mech. Eng. Part B J. Eng. Manuf. 2016, 230, 1781–1798. [Google Scholar] [CrossRef]
- De Toro, E.V.; Sobrino, J.C.; Martínez, A.M.; Eguía, V.M.; Pérez, J.A. Investigation of a short carbon fibre-reinforced polyamide and comparison of two manufacturing processes: Fused Deposition Modelling (FDM) and polymer injection moulding (PIM). Materials 2020, 13, 672. [Google Scholar] [CrossRef] [Green Version]
- Rodríguez-Prieto, A.; Camacho, A.M.; Aragon, A.M.; Sebastian, M.A.; Yanguas-Gil, A. Polymers Selection for Harsh Environments to be Processed using Additive Manufacturing Techniques. IEEE Access 2018, 6, 29899–29911. [Google Scholar] [CrossRef]
- Rosen, D.W. Research supporting principles for design for additive manufacturing: This paper provides a comprehensive review on current design principles and strategies for AM. Virtual Phys. Prototyp. 2014, 9, 225–232. [Google Scholar] [CrossRef]
- Popescu, D.; Zapciu, A.; Amza, C.; Baciu, F.; Marinescu, R. FDM process parameters influence over the mechanical properties of polymer specimens: A review. Polym. Test. 2018, 69, 157–166. [Google Scholar] [CrossRef]
- Munteanu, A.; Chitariu, D.F. The neural networks used in FDM printing study. MATEC Web Conf. 2018, 178, 02002. [Google Scholar] [CrossRef]
- Harris, M.; Potgieter, J.; Ray, S.; Archer, R.; Arif, K.M. Acrylonitrile butadiene styrene and polypropylene blend with enhanced thermal and mechanical properties for fused filament fabrication. Materials 2019, 12, 4167. [Google Scholar] [CrossRef] [Green Version]
- Samykano, M.; Selvamani, S.K.; Kadirgama, K.; Ngui, W.K.; Kanagaraj, G.; Sudhakar, K. Mechanical property of FDM printed ABS: Influence of printing parameters. Int. J. Adv. Manuf. Technol. 2019, 102, 2779–2796. [Google Scholar] [CrossRef]
- Bryll, K.; Piesowicz, E.; Szymański, P.; Slaczka, W.; Pijanowski, M. Polymer Composite Manufacturing by FDM 3D Printing Technology. MATEC Web Conf. 2018, 237. [Google Scholar] [CrossRef]
- Zhang, J.; Zhou, Z.; Zhang, F.; Tan, Y.; Tu, Y.; Yang, B. Performance of 3D-printed continuous-carbon-fiber-reinforced plastics with pressure. Materials 2020, 13, 471. [Google Scholar] [CrossRef] [Green Version]
- Prajapati, H.; Salvi, S.S.; Ravoori, D.; Jain, A. Measurement of the in-plane temperature field on the build plate during polymer extrusion additive manufacturing using infrared thermometry. Polym. Test. 2020, 92, 106866. [Google Scholar] [CrossRef]
- Zhang, S.K.M.; Choi, J.P. Effect of geometry on the mechanical response of additively manufactured polymer. Polym. Test. 2021, 100, 107245. [Google Scholar] [CrossRef]
- Shen, Z.; Hua, H.; Yang, S.; Zhang, Y. Effect of Fabrication Parameters and Material Features on Tensile Strength of FDM Built Parts. IOP Conf. Ser. Mater. Sci. Eng. 2018, 423, 012050. [Google Scholar] [CrossRef]
- Kuznetsov, V.E.; Tavitov, A.G.; Urzhumtsev, O.D.; Mikhalin, M.V.; Moiseev, A.I. Hardware factors influencing strength of parts obtained by fused filament fabrication. Polymers 2019, 11, 1870. [Google Scholar] [CrossRef] [PubMed] [Green Version]
- Rodríguez-Panes, A.; Claver, J.; Camacho, A.M. The influence of manufacturing parameters on the mechanical behaviour of PLA and ABS pieces manufactured by FDM: A comparative analysis. Materials 2018, 11, 1333. [Google Scholar] [CrossRef] [PubMed] [Green Version]
- Magdum, Y.; Pandey, D.; Bankar, A.; Harshe, S.; Parab, V.; Kadam, M. Process Parameter Optimization for FDM 3D Printer. Int. Res. J. Eng. Technol. 2008, 1, 1472–1477. [Google Scholar]
- Xiao, H.; Han, W.; Ming, Y.; Ding, Z.; Duan, Y. A sensitivity analysis-based parameter optimization framework for 3D printing of continuous carbon fiber/epoxy composites. Materials 2019, 12, 3961. [Google Scholar] [CrossRef] [Green Version]
- Hao, W.; Liu, Y.; Zhou, H.; Chen, H.; Fang, D. Preparation and characterization of 3D printed continuous carbon fiber reinforced thermosetting composites. Polym. Test. 2018, 65, 29–34. [Google Scholar] [CrossRef]
- Quiñones, D.R.; Ferragud-Agulló, J.; Pérez-Feito, R.; García-Manrique, J.A.; Canals, S.; Moratal, D. A tangible educative 3D printed atlas of the rat brain. Materials 2018, 11, 1531. [Google Scholar] [CrossRef] [Green Version]
- Quiñones, D.R.; Soler-Egea, D.; González-Pérez, V.; Reibke, J.; Simarro-Mondejar, E.; Pérez-Feito, R.; García-Manrique, J.A.; Crispín, V.; Moratal, D. Open source 3D printed lung tumor movement simulator for radiotherapy quality assurance. Materials 2018, 11, 1317. [Google Scholar] [CrossRef] [Green Version]
- Sodupe-Ortega, E.; Sanz-Garcia, A.; Pernia-Espinoza, A.; Escobedo-Lucea, C. Accurate calibration in multi-material 3D bioprinting for tissue engineering. Materials 2018, 11, 1402. [Google Scholar] [CrossRef] [Green Version]
- Camargo, J.C.; Machado, A.R.; Almeida, E.C.; Silva, E.F. Mechanical properties of PLA-graphene filament for FDM 3D printing. Int. J. Adv. Manuf. Technol. 2019, 103, 2423–2443. [Google Scholar] [CrossRef]
- Lepoivre, A.; Levy, A.; Boyard, N.; Gaudefroy, V.; Sobotka, V. Coalescence in fused filament fabrication process: Thermo-dependent characterization of high-performance polymer properties. Polym. Test. 2021, 98, 107096. [Google Scholar] [CrossRef]
- Luo, C.; Wang, X.; Migler, K.B.; Seppala, J.E. Upper bound of feed rates in thermoplastic material extrusion additive manufacturing. Addit. Manuf. 2019, 32, 101019. [Google Scholar] [CrossRef]
- Kim, J.; Kang, B.S. Enhancing structural performance of short fiber reinforced objects through customized tool-path. Appl. Sci. 2020, 10, 8168. [Google Scholar] [CrossRef]
- Luo, H.; Tan, Y.; Zhang, F.; Zhang, J.; Tu, Y.; Cui, K. Selectively enhanced 3D printing process and performance analysis of continuous carbon fiber composite material. Materials 2019, 12, 3529. [Google Scholar] [CrossRef] [Green Version]
- Baumann, F.; Scholz, J. Investigation of a New Approach for Additively Manufactured Continuous Fiber-reinforced Polymers. Procedia CIRP 2017, 66, 323–328. [Google Scholar] [CrossRef]
- Shanmugam, V.; Johnson, D.J.; Babu, K.; Rajendran, S.; Veerasimman, A.; Marimuthu, U.; Singh, S.; Das, O.; Neisiany, R.E.; Hedenqvist, M.S.; et al. The mechanical testing and performance analysis of polymer-fibre composites prepared through the additive manufacturing. Polym. Test. 2021, 93, 106925. [Google Scholar] [CrossRef]
- Galati, M.; Viccica, M.; Minetola, P. A finite element approach for the prediction of the mechanical behaviour of layered composites produced by Continuous Filament Fabrication (CFF). Polym. Test. 2021, 98, 107181. [Google Scholar] [CrossRef]
- Caminero, M.A.; Chacón, J.M.; García-Plaza, E.; Núñez, P.J.; Reverte, J.M.; Becar, J.P. Additive manufacturing of PLA-based composites using fused filament fabrication: Effect of graphene nanoplatelet reinforcement on mechanical properties, dimensional accuracy and texture. Polymers 2019, 11, 799. [Google Scholar] [CrossRef] [Green Version]
- Blok, L.G.; Longana, M.L.; Yu, H.; Woods, B.K.S. An investigation into 3D printing of fibre reinforced thermoplastic composites. Addit. Manuf. 2018, 22, 176–186. [Google Scholar] [CrossRef]
- Naveed, N. Investigating the material properties and microstructural changes of fused filament fabricated PLA and tough-PLA parts. Polymers 2021, 13, 1487. [Google Scholar] [CrossRef] [PubMed]
- García-Domínguez, A.; Claver, J.; Sebastián, M.A. Infill optimization for pieces obtained by 3D printing. Procedia Manuf. 2019, 41, 193–199. [Google Scholar] [CrossRef]
- Aloyaydi, B.; Sivasankaran, S.; Mustafa, A. Investigation of infill-patterns on mechanical response of 3D printed poly-lactic-acid. Polym. Test. 2020, 87, 106557. [Google Scholar] [CrossRef]
- Vidakis, N.; Vairis, A.; Petousis, M.; Savvakis, K.; Kechagias, J. Fused deposition modelling parts tensile strength characterization. Acad. J. Manuf. Eng. 2016, 14, 87–94. [Google Scholar]
- Galeja, M.; Hejna, A.; Kosmela, P.; Kulawik, A. Static and dynamic mechanical properties of 3D printed ABS as a function of raster angle. Materials 2020, 13, 297. [Google Scholar] [CrossRef] [Green Version]
- Al Rashid, A.; Koҫ, M. Creep and recovery behavior of continuous fiber-reinforced 3d composites. Polymers 2021, 13, 1644. [Google Scholar] [CrossRef]
- García-Domínguez, A.; Claver, J.; Camacho, A.M.; Sebastián, M.A. Considerations on the Applicability of Test Methods for Mechanical Characterization of Materials Manufactured by FDM. Materials 2019, 13, 28. [Google Scholar] [CrossRef] [Green Version]
- Griffiths, C.A.; Howarth, J.; De Almeida-Rowbotham, G.; Rees, A. A design of experiments approach to optimise tensile and notched bending properties of fused deposition modelling parts. Proc. Inst. Mech. Eng. Part B J. Eng. Manuf. 2016, 230, 1502–1512. [Google Scholar] [CrossRef]
- Elmrabet, N.; Siegkas, P. Dimensional considerations on the mechanical properties of 3D printed polymer parts. Polym. Test. 2020, 90, 106659. [Google Scholar] [CrossRef]
- Song, Y.; Li, Y.; Song, W.; Yee, K.; Lee, K.Y.; Tagarielli, V.L. Measurements of the mechanical response of unidirectional 3D-printed PLA. Mater. Des. 2017, 123, 154–164. [Google Scholar] [CrossRef]
- Lin, X.; Coates, P.; Hebda, M.; Wang, R.; Lu, Y.; Zhang, L. Experimental analysis of the tensile property of FFF-printed elastomers. Polym. Test. 2020, 90, 106687. [Google Scholar] [CrossRef]
- Pyl, L.; Kalteremidou, K.A.; Van Hemelrijck, D. Exploration of specimen geometry and tab configuration for tensile testing exploiting the potential of 3D printing freeform shape continuous carbon fibre-reinforced nylon matrix composites. Polym. Test. 2018, 71, 318–328. [Google Scholar] [CrossRef]
- Wang, S.; Ma, Y.; Deng, Z.; Zhang, S.; Cai, J. Effects of fused deposition modeling process parameters on tensile, dynamic mechanical properties of 3D printed polylactic acid materials. Polym. Test. 2020, 86, 106483. [Google Scholar] [CrossRef]
- Hsueh, M.H.; Lai, C.J.; Wang, S.H.; Zeng, Y.S.; Hsieh, C.H.; Pan, C.Y.; Huang, W.C. Effect of printing parameters on the thermal and mechanical properties of 3d-printed pla and petg, using fused deposition modeling. Polymers 2021, 13, 1758. [Google Scholar] [CrossRef]
- Buj-Corral, I.; Bagheri, A.; Petit-Rojo, O. 3D Printing of Porous Scaffolds with Controlled Porosity and Pore Size Values. Materials 2018, 11, 1532. [Google Scholar] [CrossRef]
- Ferretti, P.; Leon-Cardenas, C.; Santi, G.M.; Sali, M.; Ciotti, E.; Frizziero, L. Relationship between FDM 3D Printing Parameters Study: Parameter Optimization for Lower Defects. Polymers 2021, 13, 2190. [Google Scholar] [CrossRef]
- Beniak, J.; Križan, P.; Matuš, M. Research on Shape and Dimensional Accuracy of FDM Produced Parts. IOP Conf. Ser. Mater. Sci. Eng. 2019, 501, 012030. [Google Scholar] [CrossRef]
- Launhardt, M.; Wörz, A.; Loderer, A.; Laumer, T.; Drummer, D.; Hausotte, T.; Schmidt, M. Detecting surface roughness on SLS parts with various measuring techniques. Polym. Test. 2016, 53, 217–226. [Google Scholar] [CrossRef]
- Rupal, B.S.; Anwer, N.; Secanell, M.; Qureshi, A.J. Geometric tolerance and manufacturing assemblability estimation of metal additive manufacturing (AM) processes. Mater. Des. 2020, 194, 108842. [Google Scholar] [CrossRef]
- Shahriar, B.B.; France, C.; Valerie, N.; Arthur, C.; Christian, G. Toward improvement of the properties of parts manufactured by FFF (fused filament fabrication) through understanding the influence of temperature and rheological behaviour on the coalescence phenomenon. AIP Conf. Proc. 2017, 1896, 040008. [Google Scholar] [CrossRef] [Green Version]
- Barone, S.; Neri, P.; Orsi, S.; Paoli, A.; Razionale, V.; Tamburrino, F. Two coatings that enhance mechanical properties of fused filament-fabricated carbon-fiber reinforced composites. Addit. Manuf. 2020, 32, 101105. [Google Scholar] [CrossRef]
- Matsuzaki, R.; Ueda, M.; Namiki, M.; Jeong, T.K.; Asahara, H.; Horiguchi, K.; Nakamura, T.; Todoroki, A.; Hirano, Y. Three-dimensional printing of continuous-fiber composites by in-nozzle impregnation. Sci. Rep. 2016, 6, 23058. [Google Scholar] [CrossRef] [PubMed]
- Kuncius, T.; Rimašauskas, M.; Rimašauskienė, R. Interlayer adhesion analysis of 3d-printed continuous carbon fibre-reinforced composites. Polymers 2021, 13, 1653. [Google Scholar] [CrossRef]
- Denlinger, E.R.; Michaleris, P. Mitigation of distortion in large additive manufacturing parts. Proc. Inst. Mech. Eng. Part B J. Eng. Manuf. 2017, 231, 983–993. [Google Scholar] [CrossRef]
- Dilberoglu, U.M.; Simsek, S.; Yaman, U. Shrinkage compensation approach proposed for ABS material in FDM process. Mater. Manuf. Process. 2019, 34, 993–998. [Google Scholar] [CrossRef]
- Domingo-Espin, M.; Travieso-Rodriguez, J.A.; Jerez-Mesa, R.; Lluma-Fuentes, J. Fatigue performance of ABS specimens obtained by fused filament fabrication. Materials 2018, 10, 2521. [Google Scholar] [CrossRef] [Green Version]
- Li, C.; Xian, G.; Li, H. Tension-tension Fatigue Performance of a Large-Diameter Pultruded Carbon/Glass Hybrid Rod. Int. J. Fatigue 2019, 120, 141–149. [Google Scholar] [CrossRef]
- Bhalodi, D.V.; Zalavadiya, K.S.; Gurrala, P.K. Parametric Study to Predict the Bond Formation in FDM Process. Int. J. Mater. Mech. Manuf. 2018, 6, 313–316. [Google Scholar] [CrossRef]
- Caminero, M.A.; Chacón, J.M.; García-Moreno, I.; Reverte, J.M. Interlaminar bonding performance of 3D printed continuous fibre reinforced thermoplastic composites using fused deposition modelling. Polym. Test. 2018, 68, 415–423. [Google Scholar] [CrossRef]
- Valerga, A.; Batista, M.; Salguero, J.; Girot, F. Influence of PLA Filament Conditions on Characteristics of FDM Parts. Materials 2018, 11, 1322. [Google Scholar] [CrossRef] [Green Version]
- García, E.; Núñez, P.J.; Caminero, M.A.; Chacón, J.M. Analysis of PLA geometric properties processed by FFF additive manufacturing: Effects of process parameters and plate-extruder precision motion. Polymers 2019, 11, 1581. [Google Scholar] [CrossRef] [Green Version]
- Zhao, Y.; Chen, Y.; Zhou, Y. Novel mechanical models of tensile strength and elastic property of FDM AM PLA materials: Experimental and theoretical analyses. Mater. Des. 2019, 181, 108089. [Google Scholar] [CrossRef]
- Dezaki, M.L.; Mohd, M.K.A. The effects of combined infill patterns on mechanical properties in fdm process. Polymers 2020, 12, 2792. [Google Scholar] [CrossRef]
- Rivet, I.; Dialami, N.; Cervera, M.; Chiumenti, M.; Reyes, G.; Pérez, M.A. Experimental, computational, and dimensional analysis of the mechanical performance of fused filament fabrication parts. Polymers 2021, 13, 1766. [Google Scholar] [CrossRef]
- Hu, Y.; Ladani, R.B.; Brandt, M.; Li, Y.; Mouritz, A.P. Carbon fibre damage during 3D printing of polymer matrix laminates using the FDM process. Mater. Des. 2021, 205, 109679. [Google Scholar] [CrossRef]
- Yu, N.; Sun, X.; Wang, Z.; Zhang, D.; Li, J. Effects of auxiliary heat on warpage and mechanical properties in carbon fiber/ABS composite manufactured by fused deposition modeling. Mater. Des. 2020, 195, 108978. [Google Scholar] [CrossRef]
- Medina-Sanchez, G.; Dorado-Vicente, R.; Torres-Jiménez, E.; López-García, R. Build time estimation for fused filament fabrication via average printing speed. Materials 2019, 12, 3982. [Google Scholar] [CrossRef] [Green Version]
- Xia, L.; Lin, S.; Ma, G. Stress-based tool-path planning methodology for fused filament fabrication. Addit. Manuf. 2020, 32, 101020. [Google Scholar] [CrossRef]
- Zhang, H.; Yang, D.; Sheng, Y. Performance-driven 3D printing of continuous curved carbon fibre reinforced polymer composites: A preliminary numerical study. Compos. Part B Eng. 2018, 151, 256–264. [Google Scholar] [CrossRef]
- Zhu, Z.; Dhokia, V.; Newman, S.T. A new algorithm for build time estimation for fused filament fabrication technologies. Proc. Inst. Mech. Eng. Part B J. Eng. Manuf. 2016, 230, 2214–2228. [Google Scholar] [CrossRef] [Green Version]
- Zhang, H.; Liu, D.; Huang, T.; Hu, Q.; Lammer, H. Three-dimensional printing of continuous flax fiber-reinforced thermoplastic composites by five-axis machine. Materials 2020, 13, 1678. [Google Scholar] [CrossRef] [PubMed] [Green Version]
- Fox, B.; Subic, A. An Industry 4.0 Approach to the 3D Printing of Composite Materials. Engineering 2019, 5, 621–623. [Google Scholar] [CrossRef]
- Ligon, S.C.; Liska, R.; Stampfl, J.; Gurr, M.; Mülhaupt, R. Polymers for 3D Printing and Customized Additive Manufacturing. Chem. Rev. 2017, 117, 10212–10290. [Google Scholar] [CrossRef] [PubMed] [Green Version]
- Singh, R.; Kumar, R.; Farina, I.; Colangelo, F.; Feo, L.; Fraternali, F. Multi-material additive manufacturing of sustainable innovative materials and structures. Polymers 2019, 11, 62. [Google Scholar] [CrossRef] [PubMed] [Green Version]
- Li, C.; Yin, X.; Wang, Y.; Zhang, L.; Zhang, Z.; Liu, Y.; Xian, G. Mechanical property evolution and service life prediction of pultruded carbon/glass hybrid rod exposed in harsh oil-well condition. Compos. Struct. 2020, 246, 112418. [Google Scholar] [CrossRef]
- Li, C.; Xian, G. Novel wedge-shaped bond anchorage system for pultruded CFRP plates. Mater. Struct. 2018, 51, 162. [Google Scholar] [CrossRef]


| Equipment | Material | Tensile Modulus (GPa) | Tensile Stress at Yield (MPa) | Tensile Stress at Break (MPa) | Deformation (%) |
|---|---|---|---|---|---|
| Ultimaker | PLA | 2.35 | 49.5 | 45.6 | 5.2 |
| Ultimaker | ABS | 1.68 | 39 | 33.9 | 4.8 |
| Ultimaker | Nylon | 0.58 | 27.8 | 34.4 | 210 |
| Markforged | Nylon | 1.70 | 51 | 36 | 150 |
| Markforged | Glass Fiber | 21 | --- | 590 | 3.8 |
| Markforged | Carbon Fiber | 60 | --- | 800 | 1.5 |
| Ultimaker 2 Extended + | Markforged Mark Two | |
|---|---|---|
| Minimum layer height | 20 μm (0.02 mm) | 100 μm (0.1 mm) |
| Printing volume | 223 mm × 223 mm × 305 mm | 320 mm × 132 mm × 154 mm |
| Materials | PLA, ABS, Nylon | Nylon, Carbon Fiber, Glass Fiber |
| Technology | FFF | FFF |
| Coordinate system | Cartesian | Cartesian |
| Software | Cura | Eiger |
| Control of parameters | Yes | No |
| Advantages | Low surface roughness | High mechanical properties |
| Parameters | ABS/PLA/Nylon | Parameters | ABS/PLA/Nylon |
|---|---|---|---|
| Nozzle diameter (mm) | 0.4 | Adherence | No |
| Layer height (mm) | 0.2 | Thickness wall (mm) | 0.75 |
| Infill rate (%) | 90 | N°. lines/wall | 3 |
| Infill pattern | Concentric, Zig-zag | N°. lower and upper layers | 3 |
| Temp. extruder (°C) | 250/210/250 | Sup/Inf. Layers pattern | Linear |
| Temp. plate (°C) | 80 | Velocity (mm/s) | 45 |
| Support material | No | First layer speed (mm/s) | 15 |
| Codification | |
|---|---|
| Printer | Ultimaker (U); Markforged (M) |
| Matrix | PLA (P); ABS (A); Nylon (N) |
| Reinforcement (Nylon matrix) | Glass Fiber (V); Carbon Fiber (C) |
| Deposition pattern | Concentric (C); Zig-zag (Z); Triangular (T) |
| Nozzle diameter | D04 (0.4 mm) |
| Layer height | A02 (0.2 mm) |
| Version | V01 |
| Tensile Modulus (MPa) | Tensile Stress at Yield (MPa) | Tensile Stress at Break (MPa) | Def. 50 mm (%) | ||
|---|---|---|---|---|---|
| Ultimaker 2 Extended+ | U/P/C | 1975.67 | 42.58 | 43.2 | 2.41 |
| U/P/Z | 1714 | 34.16 | 35.18 | 3.92 | |
| U/A/C | 1204 | 31.42 | 33.01 | 3.95 | |
| U/A/Z | 1137 | 27.04 | 28.38 | 4 | |
| U/N/C | 505.5 | --- | 23.19 | 57.01 | |
| U/N/Z | 291.67 | 28 | 17.05 | 46.53 | |
| U/N/T | 189.33 | 28 | 12.73 | 5.01 | |
| M/N/Z | 359 | 28 | 31.57 | 72.04 | |
| Markforged Mark Two | M/N/T | 164.67 | --- | 8.65 | 26.48 |
| M/NV/45-45 | 1995.67 | 92.97 | 70.5 | 3.73 | |
| M/NV/0-0 | 3317 | 179.18 | 196.72 | 0 | |
| M/NV/45-90 | 684.33 | --- | 41.04 | 10.87 | |
| M/NV/90-0 | 659 | 92.97 | 18.4 | 16.8 | |
| M/NC/45-45 | 2913.33 | 88.09 | 108.43 | 3.47 | |
| M/NC/0-0 | 5545.33 | 217.34 | 243.64 | 0 | |
| M/NC/45-90 | 1490.33 | 37.92 | 49.81 | 12.82 | |
| M/NC/90-0 | 742.33 | 17.66 | 27.26 | 5.51 |
Publisher’s Note: MDPI stays neutral with regard to jurisdictional claims in published maps and institutional affiliations. |
© 2021 by the authors. Licensee MDPI, Basel, Switzerland. This article is an open access article distributed under the terms and conditions of the Creative Commons Attribution (CC BY) license (https://creativecommons.org/licenses/by/4.0/).
Share and Cite
Martín, M.J.; Auñón, J.A.; Martín, F. Influence of Infill Pattern on Mechanical Behavior of Polymeric and Composites Specimens Manufactured Using Fused Filament Fabrication Technology. Polymers 2021, 13, 2934. https://doi.org/10.3390/polym13172934
Martín MJ, Auñón JA, Martín F. Influence of Infill Pattern on Mechanical Behavior of Polymeric and Composites Specimens Manufactured Using Fused Filament Fabrication Technology. Polymers. 2021; 13(17):2934. https://doi.org/10.3390/polym13172934
Chicago/Turabian StyleMartín, María Jesús, Juan Antonio Auñón, and Francisco Martín. 2021. "Influence of Infill Pattern on Mechanical Behavior of Polymeric and Composites Specimens Manufactured Using Fused Filament Fabrication Technology" Polymers 13, no. 17: 2934. https://doi.org/10.3390/polym13172934