
Development of a Multi-Criteria Design Optimization Methodology for Automotive Plastics Parts


Abstract
:1. Introduction
- The methodology has the objective of plastic product and process design review and optimization at any product lifecycle milestone, from concept to end of life, in order to make it possible to apply in any company and lifecycle stage.
- It must be capable of capturing the business strategy, which could be different at each milestone, and must be translated into a set of improvement “target” and restrictions.
- It is focused on the “multi-criteria” evaluation of design alternatives, the detection of optimization strategies according to targets and restrictions, determining changing impacts and making objective and information-based design decisions.
- The methodology must be easily integrated as an additional “layer” that is compatible with any company size, organization, design strategy or knowledge management system, without required changes, simplifying its implementation and accelerating knowledge capture and application results.
- The methodology is expected to be applicable to “discrete events”, to simplify the early adoption of the methodology in any product lifecycle phase. It also facilitates the implementation of the methodology, as it does not require any change to the existing methodologies or organizations, in any company size or market setting.
- The methodology must support knowledge capture as a “Knowledge-Based Engineering” (KBE) tool, helping in “incremental” methodology development and a continuous improvement flow, and ensuring long-term utilization. It must be suitable for the future implementation of learning, artificial intelligence (AI) or data mining procedures.
2. First Application Scope of the Methodology: Automotive Plastic Materials
3. Methodology Development
- 1.
- Optimization team: The first step is to set up the team who will take part in the optimization process. The best strategy for this is defining a multi-disciplinary team representing all company departments and wide knowledge areas. In our application case, the stable collaboration team was 15 people with profiles covering the main company knowledge areas, cumulating near 300 years of experience; as shown in Table 1, 100% have a university degree and 33% hold a PhD. In addition, during the methodology development and application, occasionally, 12 additional people shared information or took part in decision making.
- 2.
- Knowledge “incremental” database: Once the optimization team has been identified, the first step of the methodology development was to request team members to collect related information, and disseminate it to the rest of the team, including design standards, plastic material information, process guidelines, or regulations to be respected. The “incremental” aim of the methodology enabled us to start applications in real cases, even with “partial” knowledge collection, helping to detect lacking areas and develop a comprehensive knowledge base. As an example, in the first application, we detected a lack of benchmark information, as an interesting optimization opportunity; then, an existing benchmark vehicle database [42] was included in the knowledge base.
- 3.
- Multi-criteria evaluation set: This is usually defined by the company directors, based on existing key performance indicators (KPIs), and is as complete and stable as possible to allow comprehensive and comparable evaluations. In our case, we used the QCDP set of KPIs (quality, cost, delivery delay, and performance), which is well known in the automotive and product development industries [43,44]. However, we detected that this set of criteria lacks an environmental impact evaluation [25,26,27], and as a consequence, the team developed a QCDP+E set (+E denotes environmental impact). In addition, the team detected the need for several “sub-criteria” for each main one, which would be useful for better impact evaluation, and would also enable the detailed definition of targets and restrictions, resulting in the criteria set shown in Table 2.
- The interaction matrix is the central tool of the methodology. It concentrates this information in a profitable format, organizing the following information in a matrix format:
- The multi-criteria evaluation set was placed in the columns, as described in the previous paragraph.
- A list of “potential design optimization” or “changes” was placed in rows, identified by the optimization team members, based on a related knowledge database and expertise, and ordered considering the origin of the opportunity (initially in three main categories: product design, process design, and market/benchmark).
- Step 1: Each team member could propose changes in their knowledge or expertise area, mainly based on their experience, obtaining qualitative information and considering the methodology as an effective “knowledge capture” system.
- Step 2: Every change was evaluated based on its positive or negative impact on every criterion of the multi-criteria evaluation set. The author proposing the change and the reference members had to discuss every impacted criterion to reach a base quantitative value or “score” according to an agreed classification, with values from −5 to +5 (unfavorable or favorable impact, respectively), according to Table 3. The value could be also discussed with all team members, in order to ensure objectivity.
- Step 3: Once the base value for the impacts had been defined, the entire interaction matrix was evaluated by the entire team, using a Delphi or ETE (Estimate-Talk-Estimate) methodology, and the group “one-voice” opinion output was set. The Delphi method [45,46] is well known and considered an appropriate system to refine the subjective or varied knowledge of an expert team (as in our case), using questionnaire iterations, converging to the most accurate answer or solution based on collaborative knowledge. According to the Delphi rules, at least two optimization rounds are required, each one using the entire interaction matrix as a questionnaire distributed to all members of the structured optimization team (as shown in Table 1), allowing experts to anonymously review and, in our case, correct any score that they consider incorrect, resulting in a corrected matrix. The answers were collected anonymously in a shared online spreadsheet, and then evaluated by one delegated member of the team (in our case, the DELPHI “facilitator” role was performed by one of the methodology authors). The answer matrix was evaluated to verify the convergence of collective and stable answer scores by calculating the following:
- Arithmetic means of the answered scores, to allow reference members to evaluate their previous scores and agree to set the answer mean as the resultant score for the impact.
- Detection of dispersions or lack of stability in answer scores based on normal distribution calculation. In this case, disperse values allowed the team to detect the need for the review of the scores and changes to clarify the origin of these dispersions (usually misunderstandings around changes or evaluation), better explain them to the team, and then re-review the scores to obtain the agreed resultant score for the dispersive values.
- 2.
- Business strategy definition: Once the interaction matrix had been defined, the next step of the methodology was the tool that allowed the target of the optimization to be fixed according to the company business strategy. This strategy is usually fixed by the company directors and is frequently different at every moment or project milestone. As an example, in the development phase, the key strategy target could be “respect planning and budget”, and in the serial production phase, the target could be “maximizing cost reduction actions, with as less investment as possible”. This strategy is usually fixed by “verbal” qualitative information, and the key is “translating” this verbal information into parametric and quantitative information.
- Verbal strategy: “During serial production phase, detect cost reduction actions, with no investment, with application delay less than 1 month, and not affecting negatively lifecycle CO2 emissions or waste volume”.
- Translation into quantitative “Target” and “Restrictions” to criteria set:
- →
- Target: Detect and order changes by favorable impact in the “Production and Manufacturing Cost Reduction” sub-criteria = (CP) ≤ 1
- →
- Restrictions:
- Applicable in serial phase = (DS) ≥ 1;
- Investment or entry ticket = (CI) ≤ 1;
- Impact on delivery time/planning = (DL) ≥ −1;
- Impact on lifecycle CO2 emissions = (EC) ≥ 0;
- Impact on waste volume = (EW) ≥ 0.
- →
- Result = [Interaction Matrix: 1→n]; #run through matrix lines
- IF: CP ≤ 1; AND → #verify accomplishment of target.
- IF: DS = 1; AND → #verify accomplishment of restriction 1.
- IF CI ≤ 0; AND → #verify accomplishment of restriction 2.
- IF DL ≥ −1; AND → #verify accomplishment of restriction 3.
- IF EC ≥ 0; AND → #verify accomplishment of restriction 4.
- IF EW ≥ 0; THEN → #verify accomplishment of restriction 5.
- SORT: CP (Max→min) → #classify result according to target.
- 3.
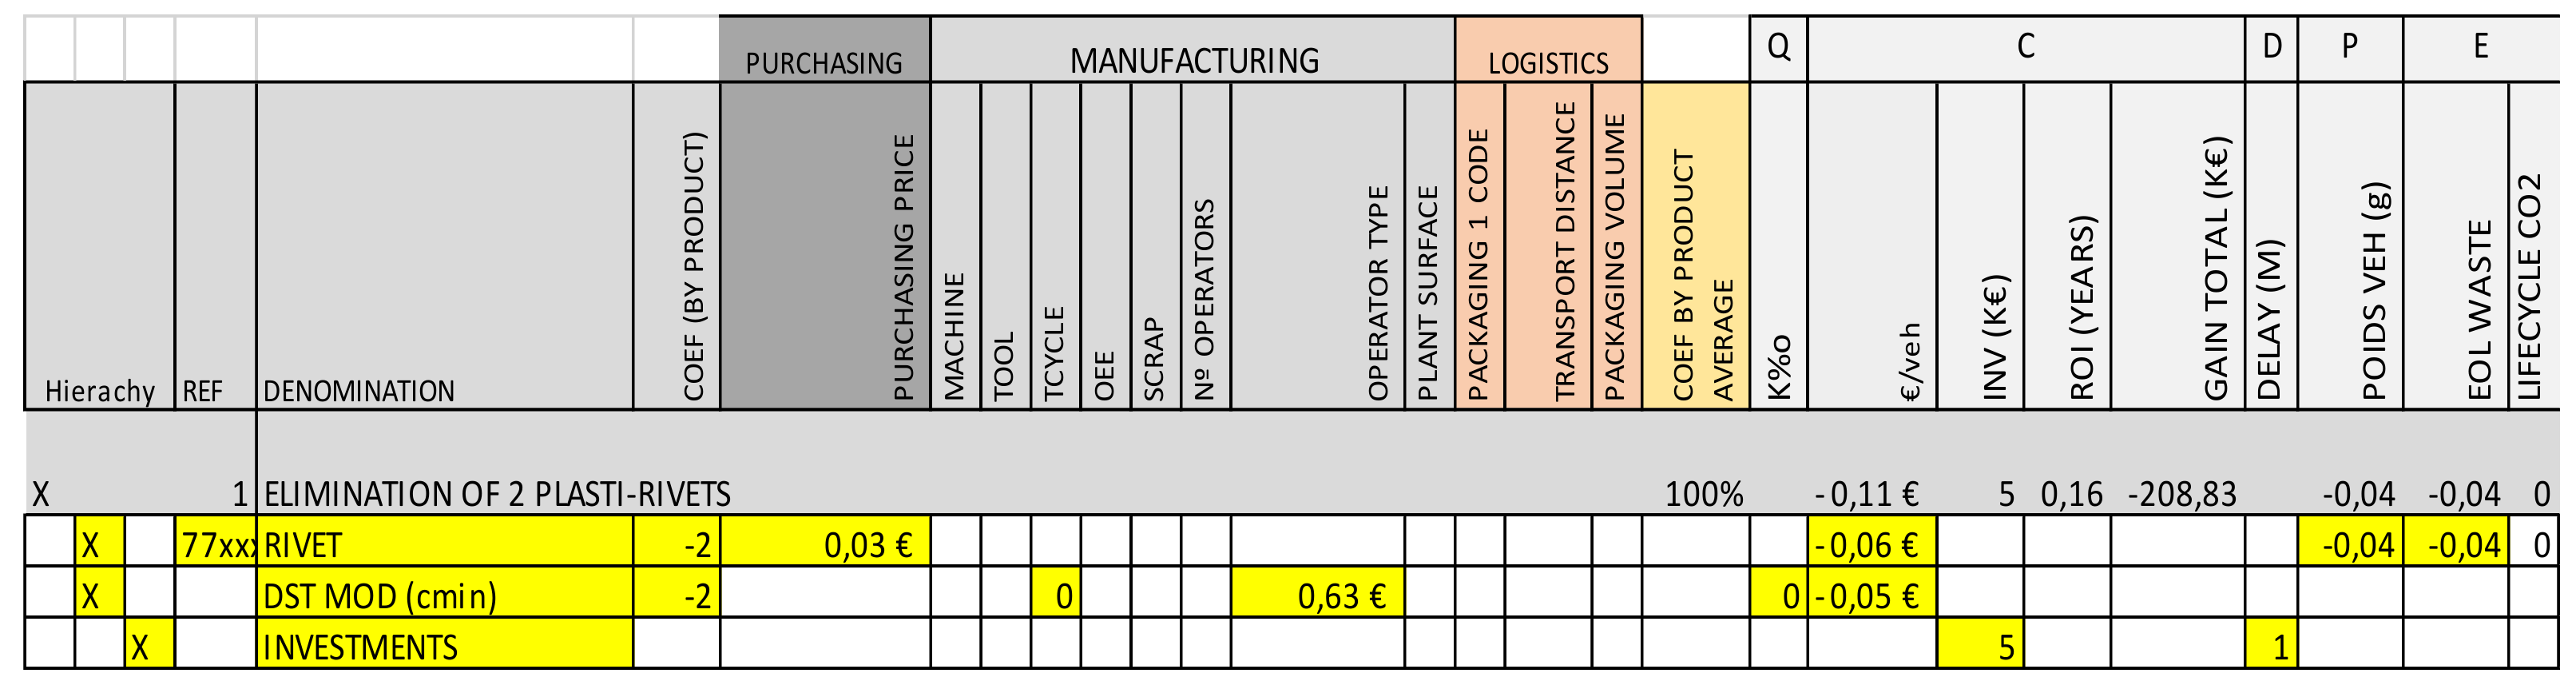
- Modeling matrix: Once the “POTENTIAL Optimizations” had been detected and listed according to the strategy, the next step was helping the team to verify if these changes were fully applicable to a real case and helping to perform the robust impact modeling and calculation of the “EXPECTED Impacts”, which enabled the team and management to make Go/No Go decisions around changes based on clear and robust information of the impact calculation in all multi-criteria sets, as shown in Figure 5. The structure of the modeling matrix helped the team to model every optimization impact considering all stages of the product lifecycle: design, manufacturing, product utilization, and end of life. In order to speed up the calculation, the impacts were modeled in a “variational” way, accurately modeling all changes from the baseline in an efficient manner, as shown in Figure 7.
- 4.
- Continuous improvement tool: The methodology has an “incremental” orientation, which allows it to be applied from the first stages of the knowledge capture process, but it also needs a tool to ensure continuous improvement. This tool performs the following tasks:
- Checks the verified impacts of every Go decision, in order to detect any deviations in previous stages (potential and expected impacts).
- Captures any subjective origin actions and checks real results in the same way.
- Collects and captures any new information used during the process: benchmark good practices, regulation changes, knowledge review proposals, etc.
- Builds an “Improvement Action List” based on this information.
- Periodically performs a methodology review with the optimization team to review listed actions and, in our case, correct scores of the Delphi validation, as previously described, and update the knowledge base and methodology tools.
- 5.
- Methodology application in discrete events: The steps of a typical application in a discrete optimization event, once the main tools of the methodology have been developed, as shown in Figure 4, are described in the following:
- Phase 1: What to do? Kick-off the event, define the team members, extend team collaborators, and optimize the scope. The company directors provide the business strategy for the event, usually in verbal format.
- Phase 2: How to do it? The team performs the translation into the quantitative “target” and “Restrictions”, applying it to the most updated interaction matrix, and obtaining the list of potential optimizations. The team adds any additional subjective-origin proposal. The resulting optimization list feeds into the modeling matrix for the event.
- Phase 3: Why do it? The team collects the information and runs calculations until the modeling matrix is complete with detailed calculations of the expected impacts of the optimization list, providing clear and robust information to help directors make decisions regarding the Go-NoGo of every change.
- Phase 4: How to do it better? The team tracks the application of Go decisions and calculates the verified impacts once changes are applied. The team compares verified impacts with previous phases of potential and expected impacts, and in the case of deviations, develops an improvement action list. If any other deviation or useful information is found during an event, the action list is also evaluated by the team after every optimization event.
4. Integration of Historical Database Information
4.1. Cost Optimization Modification Database
4.2. Quality Problem-Solving Actions and QRQC Database
5. Methodology Application in Real Cases and Results
- Higher successful proposal application ratio.
- More effective change detection member/workload ratio.
- Accurately estimated impact modeling, and precise information provided to support management decision making, thus reducing risks.
- Higher verified results and better workload/results ratio, including the workload for methodology development.
6. Conclusions
Author Contributions
Funding
Institutional Review Board Statement
Informed Consent Statement
Data Availability Statement
Acknowledgments
Conflicts of Interest
Appendix A
References
- Gheorghe, V.; Scutaru, M.L.; Ungureanu, V.B.; Chircan, E.; Ulea, M. New Design of Composite Structures Used in Automotive Engineering. Symmetry 2021, 13, 383. [Google Scholar] [CrossRef]
- Lyu, M.-Y.; Choi, T.G. Research trends in polymer materials for use in lightweight vehicles. Int. J. Precis. Eng. Manuf. 2015, 16, 213–220. [Google Scholar] [CrossRef]
- Kang, J.-H.; Lee, J.-W.; Kim, J.-H.; Ahn, T.-M.; Ko, D.-C. Design of Center Pillar with Composite Reinforcements Using Hybrid Molding Method. Materials 2021, 14, 2047. [Google Scholar] [CrossRef] [PubMed]
- Mitschang, P.; Hildebrandt, K. 8. Polymer and composite moulding technologies for automotive applications. In Advanced Materials in Automotive Engineering; Elsevier Woodhead Publishing: Amsterdam, The Netherlands, 2012; pp. 210–229. [Google Scholar] [CrossRef]
- Jung, S.; Laureijs, R.E.; Combemale, C.; Whitefoot, K.S. Design for Nonassembly: Current Status and Future Directions. J. Mech. Des. 2021, 143, 1–15. [Google Scholar] [CrossRef]
- Hull, C.W. Apparatus for Production of Three-Dimensional Objects by Stereolithography. U.S. Patent 4575330A, 19 December 1986. [Google Scholar]
- Wiese, M.; Thiede, S.; Herrmann, C. Rapid manufacturing of automotive polymer series parts: A systematic review of processes, materials and challenges. Addit. Manuf. 2020, 36, 101582. [Google Scholar] [CrossRef]
- Tulcan, A.; Vasilescu, M.; Tulcan, L. Comparative Study of the Influence of Bio-Resin Color on the Dimension, Flatness and Straightness of the Part in the 3D Printing Process. Polymers 2021, 13, 1412. [Google Scholar] [CrossRef]
- Thurston, D.L. A formal method for subjective design evaluation with multiple attributes. Res. Eng. Des. 1991, 3, 105–122. [Google Scholar] [CrossRef]
- Chen, L.; Ko, W. Fuzzy linear programming models for new product design using QFD with FMEA. Appl. Math. Model. 2009, 33, 633–647. [Google Scholar] [CrossRef]
- Renzi, C.; Leali, F.; Di Angelo, L. A review on decision-making methods in engineering design for the automotive industry. J. Eng. Des. 2017, 28, 118–143. [Google Scholar] [CrossRef]
- Sapuan, M.S.; Maleque, M.; Hameedullah, M.; Suddin, M.; Ismail, N. A note on the conceptual design of polymeric composite automotive bumper system. J. Mater. Process. Technol. 2005, 159, 145–151. [Google Scholar] [CrossRef]
- Bhargava, V. Robust Plastic Product Design: A Holistic Approach; Carl Hanser Verlag: München, Germany, 2018. [Google Scholar]
- Singh, G.; Verma, A. A Brief Review on injection moulding manufacturing process. Mater. Today Proc. 2017, 4, 1423–1433. [Google Scholar] [CrossRef]
- Sapuan, S.; Sapuan, M.S. Concurrent design and manufacturing process of automotive composite components. Assem. Autom. 2005, 25, 146–152. [Google Scholar] [CrossRef]
- Thompson, M.K.; Moroni, G.; Vaneker, T.; Fadel, G.; Campbell, R.I.; Gibson, I.; Bernard, A.; Schulz, J.; Graf, P.; Ahuja, B.; et al. Design for Additive Manufacturing: Trends, opportunities, considerations, and constraints. CIRP Ann. 2016, 65, 737–760. [Google Scholar] [CrossRef] [Green Version]
- Krawczak, P. Additive manufacturing of plastic and polymer composite parts: Promises and challenges of 3D-printing. Express Polym. Lett. 2015, 9, 959. [Google Scholar] [CrossRef]
- Krawczak, P.; Maffezzoli, A. Editorial: Advanced Thermoplastic Composites and Manufacturing Processes. Front. Mater. 2020, 7, 166. [Google Scholar] [CrossRef]
- Bere, P.; Dudescu, M.; Neamțu, C.; Cocian, C. Design, Manufacturing and Test of CFRP Front Hood Concepts for a Light-Weight Vehicle. Polymers 2021, 13, 1374. [Google Scholar] [CrossRef]
- Steadman, S.; Pell, K.M. Expert systems in engineering design: An application for injection molding of plastic parts. J. Intell. Manuf. 1995, 6, 347–353. [Google Scholar] [CrossRef]
- Bader, B.; Türck, E.; Vietor, T. Multi material design. A current overview of the used potential in automotive industries. In Technologies for Economical and Functional Lightweight Design; Springer: Berlin/Heidelberg, Germany, 2019. [Google Scholar]
- Graser, K.; Hoock, R. Material Choice and Design of Automotive Plastic Parts Under the Aspects of Recycling. SAE Tech. Paper Series 1995, 951847. [Google Scholar] [CrossRef]
- Rusu, D.; Boyer, S.A.; Lacrampe, M.-F.; Krawczak, P. Bioplastics and Vegetal Fiber Reinforced Bioplastics for Automotive Applications. In Handbook of Bioplastics and Biocomposites Engineering Applications; Wiley: Hoboken, NJ, USA, 2011; pp. 397–449. [Google Scholar]
- Sippach, T.; Dahy, H.; Uhlig, K.; Grisin, B.; Carosella, S.; Middendorf, P. Structural Optimization through Biomimetic-Inspired Material-Specific Application of Plant-Based Natural Fiber-Reinforced Polymer Composites (NFRP) for Future Sustainable Lightweight Architecture. Polymers 2020, 12, 3048. [Google Scholar] [CrossRef]
- Witik, R.A.; Payet, J.; Michaud, V.; Ludwig, C.; Månson, J.A.E. Assessing the life cycle costs and environmental performance of lightweight materials in automobile applications. Compos. Part A Appl. Sci. Manuf. 2001, 42, 1694–1709. [Google Scholar] [CrossRef]
- He, B.; Li, F.; Cao, X.; Li, T. Product Sustainable Design: A Review from the Environmental, Economic, and Social Aspects. J. Comput. Inf. Sci. Eng. 2020, 20, 1–75. [Google Scholar] [CrossRef]
- Anthony, C.; Cheung, W.M. Cost evaluation in design for end-of-Life of automotive components. J. Remanufacturing 2017, 7, 97–111. [Google Scholar] [CrossRef] [Green Version]
- Tian, J.; Chen, M. Sustainable design for automotive products: Dismantling and recycling of end-of-life vehicles. Waste Manag. 2014, 34, 458–467. [Google Scholar] [CrossRef]
- Taghizadegan, S. Design for Lean/Kaizen Six Sigma, Butterworth-Heinemann. In Essentials of Lean Six Sigma; Elsevier: Amsterdam, The Netherlands, 2006; pp. 59–101. [Google Scholar]
- Palange, A.; Dhatrak, P. Lean manufacturing a vital tool to enhance productivity in manufacturing. Mater. Today Proc. 2021, 46, 729–736. [Google Scholar] [CrossRef]
- Bhalaji, R.; Bathrinath, S.; Saravanasankar, S. A Fuzzy VIKOR method to analyze the risks in lean manufacturing implementation. Mater. Today Proc. 2021, 45, 1294–1299. [Google Scholar] [CrossRef]
- Patterson, A.E.; Lee, Y.H.; Allison, J.T. Generation and Enforcement of Process-Driven Manufacturability Constraints: A Survey of Methods and Perspectives for Product Design. J. Mech. Des. 2021, 143, 1–33. [Google Scholar] [CrossRef]
- Jiang, H.; Zeng, Q.; Xiong, G. Methodology and technology for design to cost. Tsinghua Sci. Technol. 2001, 6, 29–33. [Google Scholar]
- García-Dominguez, A.; Claver, J.; Sebastián, M.A. Integration of Additive Manufacturing, Parametric Design, and Optimization of Parts Obtained by Fused Deposition Modeling (FDM). A Methodological Approach. Polymers 2020, 12, 1993. [Google Scholar] [CrossRef]
- Hambali, A.; Sapuan, S.M.; Ismail, N.; Nukman, Y. Application of analytical hierarchy process in the design concept selection of automotive composite bumper beam during the conceptual design stage. Sci. Res. Essays 2009, 4, 198–211. [Google Scholar]
- Kumar, R.; Jagadish; Ray, A. Selection of Material for Optimal Design Using Multi-criteria Decision Making. Procedia Mater. Sci. 2014, 6, 590–596. [Google Scholar] [CrossRef] [Green Version]
- Wang, P.P.; Lai, F. Fuzzy methodology for taxonomy and knowledge base design. J. Syst. Eng. Electron. 1996, 7, 1–24. [Google Scholar]
- Zhaoling, L.; Qisheng, G.; Dongling, Z. Product design on the basis of fuzzy quality function deployment. J. Syst. Eng. Electron. 2008, 19, 1165–1170. [Google Scholar] [CrossRef]
- Jin, J.; Liu, Y.; Ji, P.; Kwong, C.K. Review on Recent Advances in Information Mining From Big Consumer Opinion Data for Product Design. J. Comput. Inf. Sci. Eng. 2019, 19, 010801. [Google Scholar] [CrossRef]
- Romero, V.; Sanchez, A. Methodology for multi-criteria design optimization of plastic products with a focus on highly competitive markets. Procedia Manuf. 2019, 41, 1087–1094. [Google Scholar] [CrossRef]
- Gavriluţă, A.C.; Niţu, E.L.; Gavriluţă, C.A. Algorithm to Use Some Specific Lean Manufacturing Methods: Application in an Industrial Production Process. Processes 2021, 9, 641. [Google Scholar] [CrossRef]
- Vehicle Benchmark Database Source. Available online: https://portal.a2mac1.com/ (accessed on 18 December 2021).
- Chung, K.S. A Comparative Study among KPI Developing Methods. J. Korean Soc. Qual. Manag. 2018, 46, 863–876. [Google Scholar]
- Asms, B.T. Le contrôle de démarrage de la fabrication d’un nouveau produit le cas exploratoire d’un constructeur automobile. La place de la dimension européenne dans la Comptabilité Contrôle Audit, Strasbourg, France, May, 2009. [Google Scholar]
- Dalkey, N.; Helmer, O. An Experimental Application of the DELPHI Method to the Use of Experts. Manag. Sci. 1963, 9, 458–467. [Google Scholar] [CrossRef]
- Brady, S.R. Utilizing and Adapting the Delphi Method for Use in Qualitative Research. Int. J. Qual. Methods 2015, 14, 1609406915621381. [Google Scholar] [CrossRef] [Green Version]


| Member | Expertise Area | Experience (Years) |
|---|---|---|
| 1, 2P | Plastic Product Design and Development | 18, 16 |
| 3, 4P | Product Management, Design, and Marketing | 22, 18 |
| 5, 6 | Injection Process Engineering and Quality | 16, 24 |
| 7, 8 | Paint and Assembly Engineering and Quality | 12, 16 |
| 9 | Tooling Engineering | 24 |
| 10, 11, 12 | Costing / Finance/Monozukuri Management | 30, 24, 18 |
| 13P, 14P | Materials Experts | 30, 8 |
| 15P | Environmental Impact Engineering | 12 |
| Main Criteria | Sub-Criteria | Code | Reference Members |
|---|---|---|---|
| Quality | Quality Defect Rate K ‰ (K/1000 parts) | QD | 5,6,7,8 |
| Geometry | QG | ||
| Perceived Quality | QP | ||
| Cost | Investment and Entry Ticket | CI | 9,10,11,2 |
| Production and Manufacturing Cost | CP | ||
| Flows and Transport Cost | CF | ||
| Delivery and Delay | Applicable in Design Phase | DD | 1,2 |
| Applicable in Prototype Phase | DP | ||
| Applicable in Serial Phase | DS | ||
| Impact in Delivery Time/Planning | DL | ||
| Product Performance | Product Customer Recognized Value | PV | 3,4 |
| Product Performances | PP | ||
| Product Weight | PW | ||
| Product Grade Walk/Personalization | PG | ||
| Product Durability | PD | ||
| Environmental Impact | Residual Value and Residual Recuperation | EV | 13,14,15 |
| Recyclability | ER | ||
| Lifecycle CO2 Emissions Balance | EC | ||
| Residual Waste Volume | EW |
| Impact | Favorable | Neutral | Unfavorable | ||||||||
| Value | 5 | 4 | 3 | 2 | 1 | 0 | −1 | −2 | −3 | −4 | −5 |
| Type Code | Optimization Source | Quantity |
|---|---|---|
| LS | Logistic flows | 27 |
| SR-DM | Materials | 199 |
| SR-DS | Product Diversity Reduction | 10 |
| SR-L | Packaging | 52 |
| SR-MB | Make-or-Buy/Production Relocation | 115 |
| SR-PL | Process Optimization | 45 |
| SR-R | Product Redesign | 199 |
| SR-RC | Product Right Content | 207 |
| SR-RS | Product Right Sizing | 214 |
| SR-SA | Negotiation | 12 |
| Cost Optimization Changes (1080) | SAVING (EUR/Veh) | APPLICATION DELAY (days) | TYPE (10) |
| Type Code | Qty. | Mean | Std. Dev. | 95% Conf. Interval |
|---|---|---|---|---|
| LS | 27 | −1.90 | 3.365 | (−2.541; −0.839) |
| SR-DM | 199 | −0.536 | 0.799 | (−0.849; −0.222) |
| SR-DS | 10 | −3.130 | 5.770 | (−4.530; −1.730) |
| SR-L | 52 | −0.733 | 1.522 | (−1.346; −0.120) |
| SR-MB | 115 | −1.940 | 3.623 | (−2.353; −1.528) |
| SR-PL | 45 | −0.601 | 1.283 | (−1.260; 0.058) |
| SR-R | 199 | −0.749 | 1.328 | (−1.063; −0.436) |
| SR-RC | 207 | −1.344 | 2.595 | (−1.651; −1.037) |
| SR-RS | 214 | −0.986 | 2.429 | (−1.288; −0.683) |
| SR-SA | 12 | −1.663 | 1.717 | (−2.939; −0.387) |
| Std. Dev. Grouped = 2.253; F Value = 5.550; p Value ≤ 0.001 | ||||
95% of sample confidence intervals and residuals. 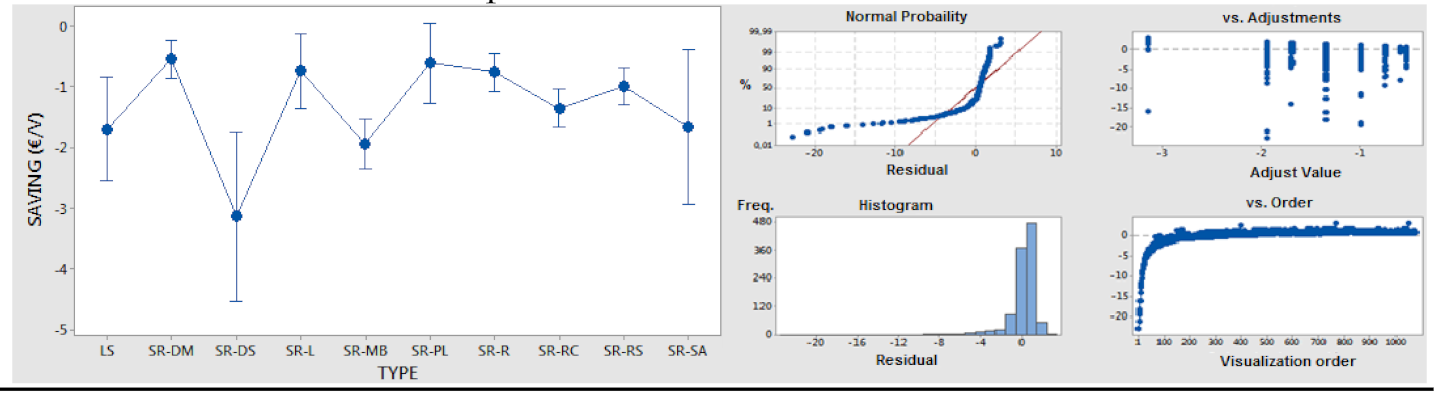 | ||||
| Type Code | Qty. | Mean | Std. Dev. | 95% Conf. Interval |
|---|---|---|---|---|
| LS | 27 | 279.0 | 193.0 | (201.3; 356,8) |
| SR-DM | 199 | 241.7 | 244.7 | (213.1; 270.4) |
| SR-DS | 10 | 197.5 | 122.7 | (69.7; 325.3) |
| SR-L | 52 | 103.0 | 125.8 | (47.0; 159.1) |
| SR-MB | 115 | 391.9 | 251.6 | (354.2; 429.6) |
| SR-PL | 45 | 105.8 | 153.2 | (45.6; 166.0) |
| SR-R | 199 | 244.1 | 192.6 | (215.4; 272.7) |
| SR-RC | 207 | 265.4 | 198.8 | (237.3; 293.5) |
| SR-RS | 214 | 241.3 | 185.7 | (213.7; 269.0) |
| SR-SA | 12 | 244.0 | 219.7 | (127.3; 360.7) |
| Std. Dev. Grouped = 205.950; F Value = 11.820; p Value ≤ 0.001 | ||||
95% of sample confidence intervals and residuals.  | ||||
| Defect Type | Description | Quantity |
|---|---|---|
| CC | Conception/Clippings | 96 |
| CG | Conception/Geometry | 24 |
| CP | Conception/Performances | 5 |
| CR | Conception/Noise | 14 |
| EC | Electric Connectors failure | 31 |
| EE | Electric Equipment failure | 34 |
| PA | Process/Aggression | 94 |
| PF | Process/Manufacturing defect | 37 |
| PI | Process/Injection defects | 15 |
| PM | Process/Assembly defects | 133 |
| PY | Process/PokaYoke error | 107 |
| QP | Quality/Perception | 100 |
| QA | Quality/Aspect | 4 |
| TOTAL | 694 |
| Quality Actions (694) | SOLVING DELAY (days) | DEFECT TYPE (13) |
| Defect Type | Qty. | Mean | Std. Dev. | CI 95% |
|---|---|---|---|---|
| CC | 96 | 125.3 | 91.2 | (106.5; 144.0) |
| CG | 24 | 154.5 | 125.8 | (112.1; 196.9) |
| CP | 5 | 87.7 | 95.4 | (5.2; 170.4) |
| CR | 14 | 94.9 | 89.6 | (45.5; 144.2) |
| EC | 31 | 105.6 | 85.0 | (72.5; 138.8) |
| EE | 34 | 108.3 | 87.0 | (76.1; 140.5) |
| PA | 94 | 124.0 | 89.6 | (105.0; 142.95) |
| PF | 37 | 171.4 | 117.4 | (141.0; 201.7) |
| PI | 15 | 83.9 | 57.6 | (36.2; 131.6) |
| PM | 133 | 110.6 | 102.2 | (94.5; 126.6) |
| PY | 107 | 124.9 | 88.7 | (107.0; 142.8) |
| QP | 100 | 112.8 | 86.5 | (94.2; 131.3) |
| QA | 4 | 90.8 | 51.9 | (−1.7; 183.2) |
| Std. Dev. Grouped = 94.120; F Value= 1.80; p Value= 0.044 95% of sample confidence intervals and residuals. | ||||
 | ||||
| Hierarchy 1 | Hierarchy 2 | Quantity |
|---|---|---|
| Product Design | Functional Design Topological Design Material Selection | 58 |
| Process Design | Tooling Design Process Design Flows Design | 37 |
| Market Analysis | Supply Chain Analysis Benchmark Analysis | 28 |
| Event | Phase | “Verbal“ Strategy | Results |
|---|---|---|---|
| 1 | Serial | “Cost reduction, minimum Investment, less than 3-month Application Delay” | 21 Actions proposed 14 Changes applied −16.5% Cost reduction |
| 2 | Design | Design Phase. “Design to Cost reduction target, ROI less 6 months. Respect project Planning” | 14 Actions proposed 11 Changes applied −16.2% Cost reduction |
| 3 | Design | “Design for Quality: Detect Quality potential risks, propose alternatives, respect project planning” | 31 Actions proposed 28 Changes applied −47% Potential Defect rate (K‰) |
| 4 | Industrialization | “Right Content Benchmark analysis, detect cost and product diversity optimization opportunities” | 16 Actions proposed 12 Changes applied −10.5% Cost reduction |
| Result | Expert Team Subjective Optimization Research | Optimization Methodology Application |
|---|---|---|
| Proposal success ratio (%) | 48/124 = 39% | 65/82 = 79% (+102%) |
| Success proposals/member (Qty.) | 19 | 65 (+242%) |
| Cost saving/member (EUR) | EUR 28.65 | EUR 49.4 (+72%) |
| Workload/success proposal (h) | 23.6 h | 13.6 h (−42%) (Including methodology development) |
Publisher’s Note: MDPI stays neutral with regard to jurisdictional claims in published maps and institutional affiliations. |
© 2021 by the authors. Licensee MDPI, Basel, Switzerland. This article is an open access article distributed under the terms and conditions of the Creative Commons Attribution (CC BY) license (https://creativecommons.org/licenses/by/4.0/).
Share and Cite
Romero, V.J.; Sanchez-Lite, A.; Liraut, G. Development of a Multi-Criteria Design Optimization Methodology for Automotive Plastics Parts. Polymers 2022, 14, 156. https://doi.org/10.3390/polym14010156
Romero VJ, Sanchez-Lite A, Liraut G. Development of a Multi-Criteria Design Optimization Methodology for Automotive Plastics Parts. Polymers. 2022; 14(1):156. https://doi.org/10.3390/polym14010156
Chicago/Turabian StyleRomero, Victor J., Alberto Sanchez-Lite, and Gerard Liraut. 2022. "Development of a Multi-Criteria Design Optimization Methodology for Automotive Plastics Parts" Polymers 14, no. 1: 156. https://doi.org/10.3390/polym14010156
APA StyleRomero, V. J., Sanchez-Lite, A., & Liraut, G. (2022). Development of a Multi-Criteria Design Optimization Methodology for Automotive Plastics Parts. Polymers, 14(1), 156. https://doi.org/10.3390/polym14010156