Article

Anisotropic Tensile Characterisation of Eucalyptus nitens Timber above Its Fibre Saturation Point, and Its Application

1
School of Civil Engineering, Suzhou University of Science and Technology, Suzhou 215011, China
2
School of Engineering, College of Sciences and Engineering, University of Tasmania, Hobart, TAS 7001, Australia
3
Australian Research Council, Centre for Forest Value, University of Tasmania, Hobart, TAS 7001, Australia
4
Centre for Sustainable Architecture with Wood (CSAW), University of Tasmania, Launceston, TAS 7250, Australia
*
Author to whom correspondence should be addressed.
Polymers 2022, 14(12), 2390; https://doi.org/10.3390/polym14122390
Submission received: 7 May 2022 / Revised: 6 June 2022 / Accepted: 9 June 2022 / Published: 13 June 2022
(This article belongs to the Special Issue Wood Polymer Composites: Processing, Properties, and Applications)

Abstract

:
Plantation-grown Eucalyptus nitens (E. nitens) has been grown predominantly for the pulp and paper industry. In this study, the suitability of E. nitens as a structural material is examined using static tensile tests in a universal testing machine. The anisotropic tensile behaviour of 240 Eucalyptus nitens small clear wood samples with a diversity of grain angles was examined in both dry and wet conditions. The samples had a highly anisotropic tensile characterisation in the context of both a low moisture content (MC = 12%) and a high moisture content (MC > its fibre saturation point, FSP). The results showed that, in a high moisture content condition, the wood showed a lower failure strength and more ductility at all grain angles than in a low moisture content condition. The underlying failure mechanism of Eucalyptus nitens timber in tension was determined in detail from the perspective of the microstructure of wood cellulose polymer composites. The mean tensile failure strengths perpendicular and parallel to the fibre direction were, respectively, 5.6 and 91.6 MPa for the low MC and 3.8 and 62.1 MPa for the high MC condition. This research provides a basis for using E. nitens as a potential structural tensile member. The moisture modification factors of Eucalyptus timber at a mean level are higher than those of the traditional construction material, Pinus radiata, implying that E. nitens is promising as a material to be used for tensile members in water saturated conditions.

Graphical Abstract

1. Introduction

Timber remains the dominant building material in some countries because of its cost effectiveness and high energy efficiency compared to steel and concrete [1,2,3]. However, this has led to shortages in plantation softwood and hardwood from native forests [4,5]. Consequently, fast-growing plantation hardwoods such as Eucalyptus nitens have attracted increasing interest because of their sustainable supply [6,7,8]. To use this resource for structural applications, the mechanical properties of E. nitens must be known in order to establish design codes.
Much attention is currently paid to the safety reassessment of timber structures in the context of high moisture content (MC) [5,9,10]. Wood is a hygroscopic material, and its strength decreases significantly as the MC increases until reaching a moisture content above the fibre saturation point (FSP) [9,11]. The decrease in strength can be up to 50% for both hardwood and softwood species, for example, American Beech and P. radiata [11]. During the past decade, research has been undertaken on changes in strength below about 30% MC [12,13]. A few studies [9,14] have covered the whole wood MC range up to the FSP. These studies have mainly focused on coniferous species, and there is still a substantial lack of quantitative information on the properties of E. nitens timber with a high MC; most of the available studies characterise its flexural and compressive properties [5,10].
Previous studies have found that timber members can reach an average MC above 70% after exposure outdoors for 2 months [15]. Moisture contents of 30–70% are associated with decay, which causes degradation and a reduction in the durability of timber structures [16,17]. This reduction in the mechanical properties of wood results from the change in wood cellulose polymers, where hydrogen bonding between the cellulose polymers is reduced because of the bound water in the cell wall [18,19]. The risk of damage in E. nitens timber is therefore expected to increase at a high MC, and design values for engineered tensile E. nitens elements with a low and high MC are required. The design values for tensile members are usually evaluated parallel to the grain and determined by small clear specimen testing according to current standards [20].
There are many mechanical failure modes in wood: flexural failure, compressive and tensile failure both perpendicular and parallel to the grain, and shear failure [11,21]. In tensile and bending members such as trusses and beams, tensile failure is the paramount failure pattern [11,20,22]. Tensile strength, evaluated both parallel and perpendicular to the grain direction, is significantly affected by the loading direction and hence the anisotropic tensile characterisation needs to be considered when the load-to-grain angle changes [11]. This paper investigates the influence of a high MC on the anisotropic tensile characterisation of E. nitens. The underlying failure mechanism due to the cellular nature of E. nitens wood will be explored. Design values for E. nitens timber in tension parallel to the grain (TPA) were developed at both low and high MCs, with the goal of using plantation E. nitens in structural engineering as a new building material. As a comparison, the tensile strength for a grain angle of 0° at both low (12%) and high (>FSP) MCs of the commercial construction timber species, P. radiata, was also obtained.
The specific objectives of this study, for both low and high MC samples, are listed as follows:
  • Obtain the stress–strain curves of E. nitens samples in tension at grain angles of 0°, 10°, 45°, and 90°;
  • Obtain the design characteristic values for E. nitens timber in tension parallel to the grain;
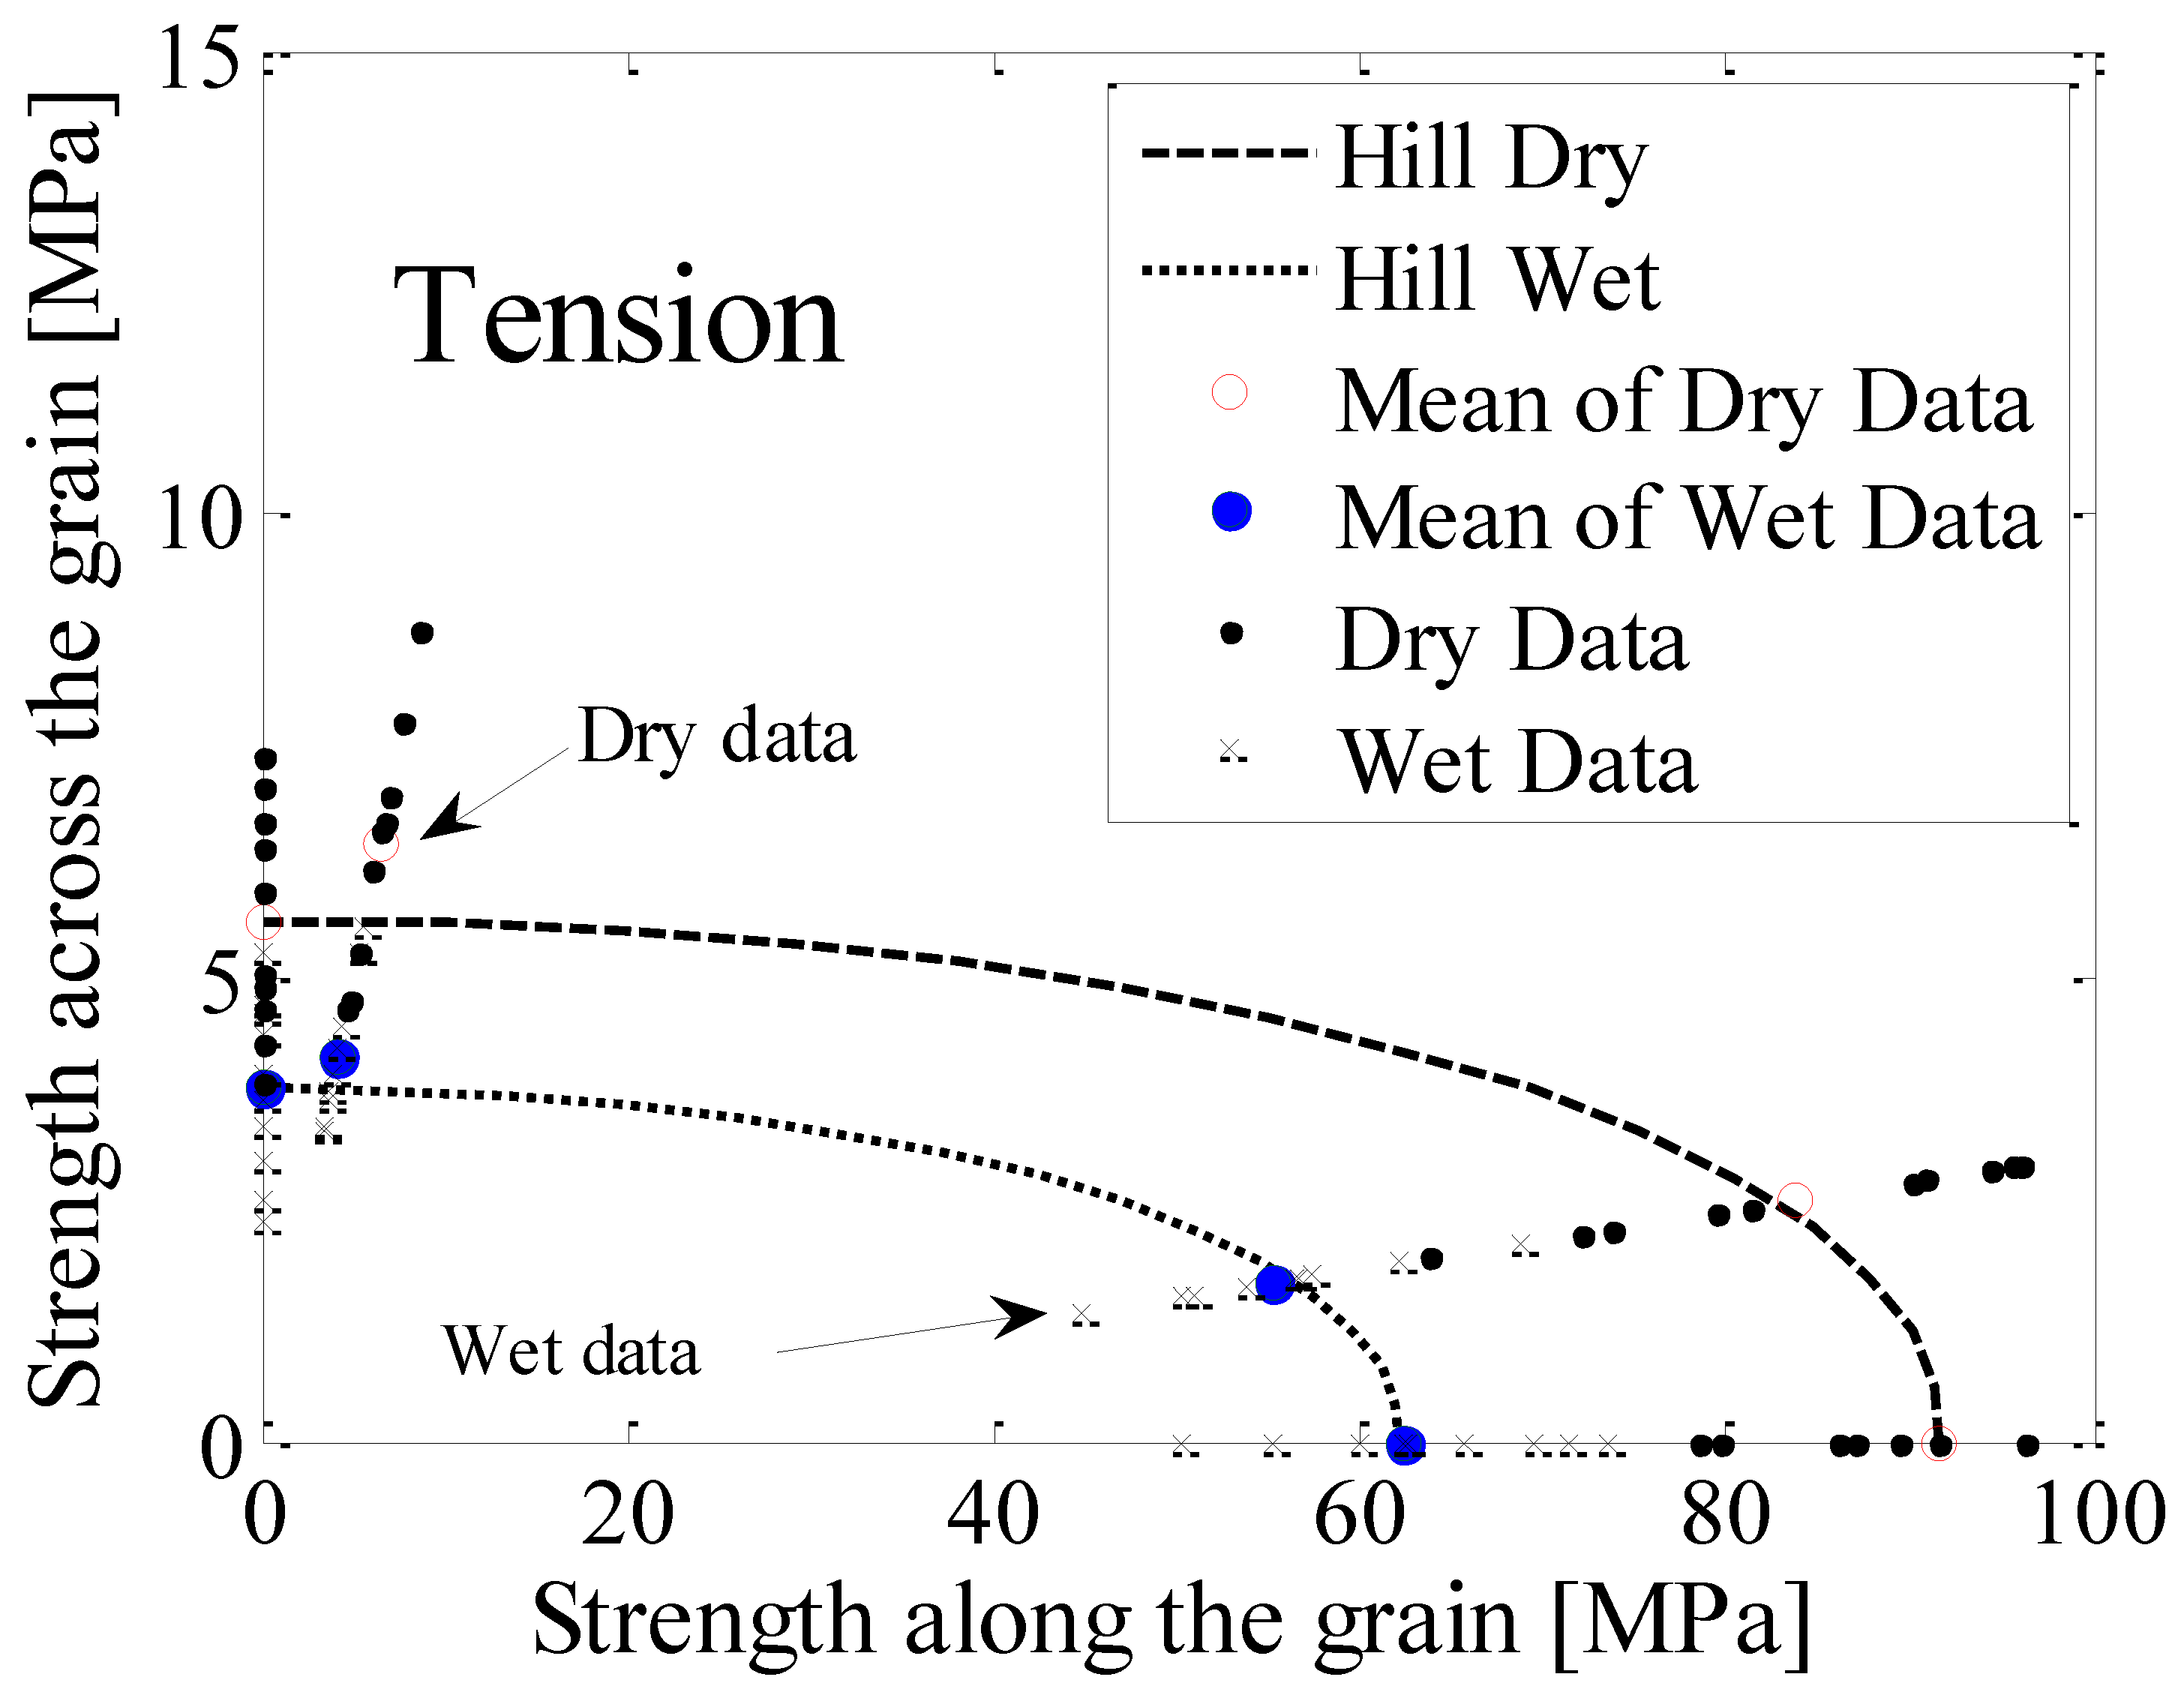
  • Determine the anisotropic tensile characterisation (failure strengths) of E. nitens wood samples at different load-to-grain angles;
  • Investigate the impact of high MC and grain angle on the tensile behaviours of E. nitens wood.

2. Materials and Methods

For the first stage of studying this problem, the experiment focused on ideal (i.e., defect-free) examples of E. nitens wood. Stress–strain curves were obtained in tensile testing on small clear P. radiata and E. nitens samples, with both low and high MCs. This is because P. radiata is a traditional structural material and is widely used in the construction industry. In order to examine the suitability of Eucalyptus nitens as a structural material, the tensile performance of Eucalyptus nitens timber for a grain angle of 0° was compared with P. radiata as a comparison. In this paper, a low moisture content or dry condition means that the MC is roughly 12%, whilst a high moisture content or wet condition means that MC > FSP (30%) with an assumption that the FSP of E. nitens is 30% [23] and that of P. radiata is in the range of 21–30% [11]. The tensile failure strengths for both low and high MCs were determined from the stress–strain curves.

2.1. Sample Preparation

The two timber species (P. radiata and E. nitens) were examined, and a summary of the experiments is provided in Table 1. Two groups of samples were used in this study: Group I was employed for determining the design characteristic values, and Group II characterised the anisotropic tensile behaviours of E. nitens wood at both high and low MCs.
The samples of P. radiata were obtained from a local trader with dimensions of 600 × 50 × 10 mm, while the E. nitens samples were cut from E. nitens boards with dimensions of 1500 × 50 × 30 mm for Group I, and 700 × 600 × 50 mm for Group II. An industrial hardwood kiln was used to dry the boards [10]. The dry samples were stored indoors for three months where the relative humidity and temperature were 60% and 20–30 °C. The wet samples were prepared using the same method described in a previous study [5]; they were simply soaked in water for six weeks.
For Group I, 160 small clear P. radiata samples and 160 E. nitens samples were used (Table 1); half of each species was tested in a dry condition (i.e., 80 and 80 low MC samples for P. radiata and E. nitens, respectively) and the rest of the samples were measured in a wet condition. Both the P. radiata and E. nitens samples were straight-grain and defect-free, and the tension parallel to the grain was tested. Samples were cut to the dimensions: 600 mm (length) × 50 mm (width) × 10 mm (thickness) with a narrow part with a cross-sectional area of 10 × 10 mm2 and a length of 100 mm (Figure 1a). The length and the width of the Group I samples were in the grain direction and the radial direction, respectively.
For Group II, a total of 80 E. nitens samples were used to explore the anisotropic tensile behaviours of E. nitens timber. The cut method of Group II samples is provided in Figure 2. The grain angles of 0°, 10°, 45°, and 90°, respectively, were represented. To ensure that they have similar properties, each pair of the Group II samples (one for 0°, one for 10°, one for 45°, and one for 90°) was cut from the same board. Ten tensile samples for the grain angle of 0° in Group II were prepared in order to match the number of samples with grain angles of 10° and 45°, which were cut with the angle between the wood fibres and the longitudinal axis of the sample (Figure 2). Ten low MC (dry) and ten high MC (wet) samples were tested for each grain angle. The grain angle was measured following the direction of the fibre in the longitude of the centre part of the sample and checked after failure. Two sets of dimensions for the samples were used: the first was as for the Group I samples (Figure 1a), while the second was 600 mm (length) × 50 mm (width) × 10 mm (thickness) (Figure 1b). The first sample dimension type was waisted to ensure that failure occurred within the central part for grain angles of 0°, 10°, or 45°, while the second sample dimension type was used for testing in tension at a grain angle of 90° (i.e., perpendicular to the grain), as it is hard to manufacture waisted tensile samples at a grain angle of 90° (Figure 1b).
For Group III, the untreated E. nitens samples (UT-E-T0) had the same dimensions and the similar properties as the Group I dry samples. The heat-treated E. nitens samples (HT-E-T0) had the same dimensions as the Group I samples but were treated using the industrial thermal modification process at a maximum temperature of 220 °C for 4 h.
Just after testing, small pieces cut from the measured samples were used to determine the MCs and basic densities according to the work of Cheng et al. [5].

2.2. Testing Method and Method of Data Analysis

The tests were implemented on a universal testing machine (Zwick Roell-Z100, ZwickRoell LP, Kennesaw, GA, USA, capacity 100 kN) according to ASTM D143–09 [24] with relative humidity and temperatures in the range of 55–70% and 15–25 °C, respectively. The samples were carefully clamped at either end (Figure 3). Tensile testing was performed at a constant loading rate using displacement-control and discontinued when rupture failure was observed in the load-deflection curves. An increase in length over the entire sample was measured via the testing machine control signal data. Deformations were measured from the point at which tensile stress first appeared. The distance between the two grips when tension first developed was also measured as the original distance. A computer connected to a data acquisition board was used to store and analyse the data.
The tensile strain was calculated from the relative position in relation to the original distance between the two clamps. The forces were measured directly, and the stresses ( σ f ) were calculated from the forces and the working areas (A) of the samples.
The tensile failure strength ( σ α , ten ) was calculated as:
σ α , ten = f ult A
in which f ult is defined as the ultimate loading force (N), and the working area A (mm2) is the area of the failure section in the sample.
According to the stress vector relationship loaded in different grain directions, tensile strengths in L–R plane (i.e., in the plane parallel to the fibres and perpendicular to the growth rings) were calculated as:
σ l l = cos 2 α · σ f ,   σ r r = sin 2 α · σ f ,   τ l r = cos α · sin α · σ f
where σ l l and σ r r are the absolute values of the longitudinal and radial normal stresses (MPa), respectively. τ l r is the absolute value of the shear stress (MPa) along the grain direction in the L–R plane. α is the grain angle, and σ f is the absolute value of the stress (MPa) in the load direction.
In this study, the moisture content (MC) and basic density were calculated based on AS/NZS 1080.1 [25] and the work of Cheng et al. [5], respectively. Tensile failure modes were determined directly during the test from the failed samples. The effect of a high MC on the failure strength of the samples was quantified by a failure strength reduction factor [5]. A failure strength reduction above the FSP is defined as a moisture reduction factor (G) to show the relative influence of moisture on failure strength above the FSP ( σ α , t e n , M C ) compared with that at a reference MC of 12% ( σ α , t e n , 12 ), and is given by:
G = σ α , t e n ,   M C σ α , t e n , 12   ( M C > F S P )
where G is the constant depending on σ α , t e n , M C and σ α , t e n , 12 . The FSP of E. nitens is assumed at 30% [23].
Matlab (version R2021a, Natick, MA, USA: The MathWorks Inc.) was used to statistically analyse the experimental data. Both K–S and A–D testing [5] were used to evaluate the normal distribution of the testing data.

3. Results and Discussions

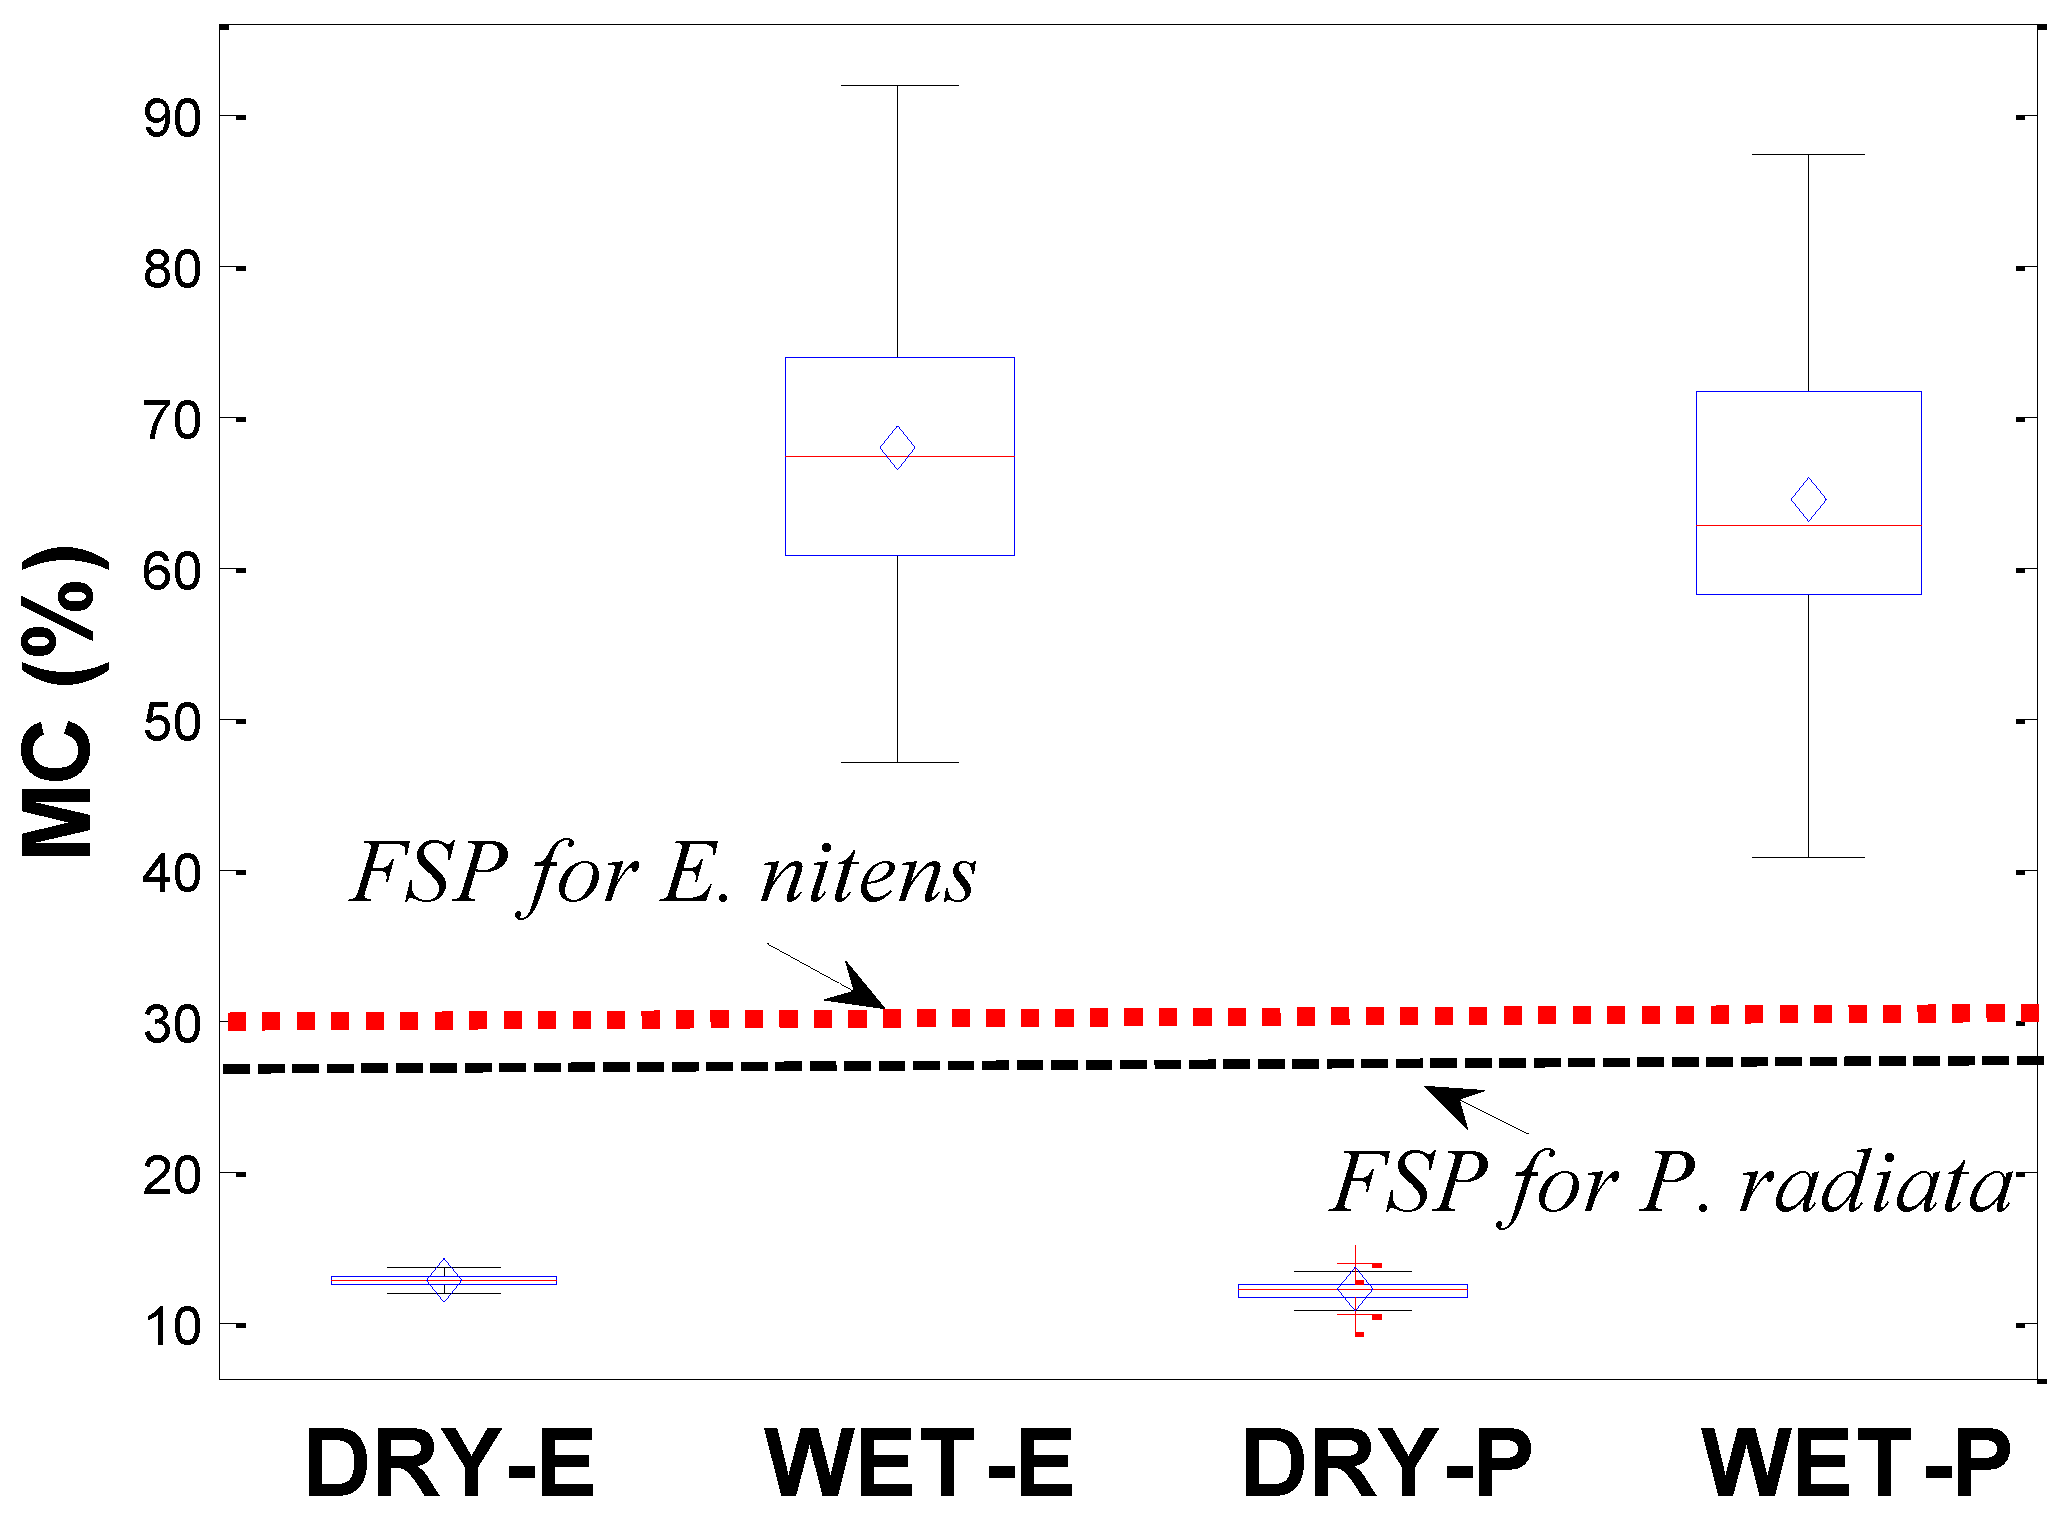
3.1. Moisture Content and Basic Densites

The basic density values of 240 E. nitens samples varied between 423.2 and 662.1 kg/m3, with a mean density value of 515.9 kg/m3. The basic densities of E. nitens in this study lie in the range of those obtained by Cheng et al. [5,10] and Derikvand et al. [7] for E. nitens samples, respectively, showing that the data for E. nitens is repeatable.
Figure 4 shows a boxplot of MCs for E. nitens samples in the present study compared with the data from the corresponding P. radiata samples. In the present study for E. nitens, the MC varied between 11.7% and 13.5% for low MC samples and between 46.9% and 91.7% for high MC samples, with mean (COV) values of 12.7% (2.8%) and 67.7% (13.6%), respectively. P. radiata had a similar MC range to E. nitens samples, with the mean MC value of wet P. radiata samples being 4.8% lower than the corresponding wet E. nitens timber (Figure 4).
Both the mean moisture contents of this research are far above the FSP. The Wood Handbook and previous studies have found that there are no fundamental changes in failure strength for an MC above the FSP [9,11,14]. Therefore, the 4.8% difference in MC does not significantly influence the values of the failure strengths studied. This indicates that the measured failure strengths from both P. radiata and E. nitens samples are comparable. Wet P. radiata samples were lower in failure strength compared to the corresponding E. nitens samples (Figure 5). This does not mean that the moisture content does not affect the failure strength of E. nitens. It simply means that the tensile strength of E. nitens is less sensitive to moisture content than that of P. radiata.

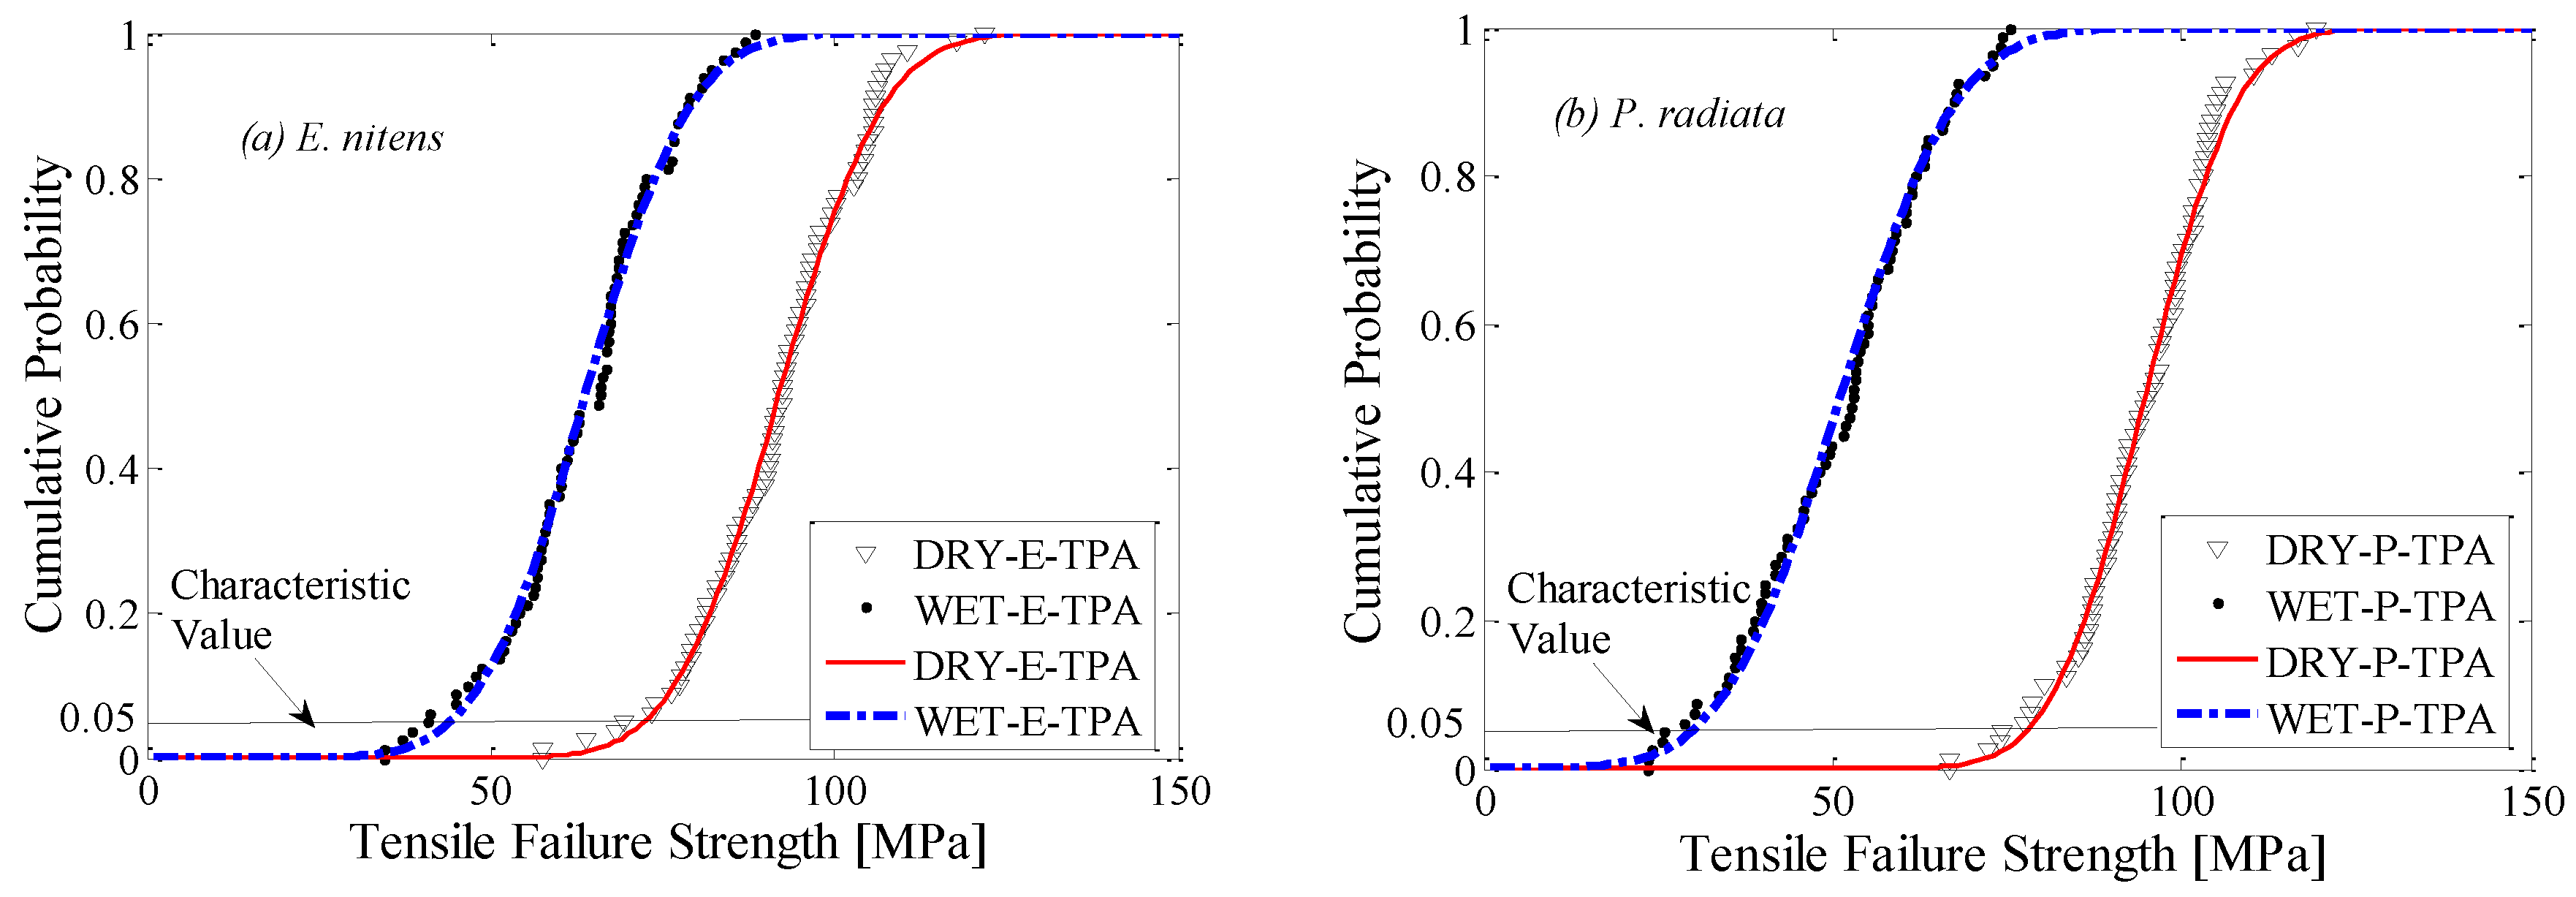
3.2. Statistical Distributions of Tensile Failure Strength Parallel to the Grain

In this section, the merit of the application of E. nitens is explored and compared with the traditional construction material, P. radiata, based on the Group I tests. Figure 6 shows the empirical probability distributions of the tensile failure strengths parallel to the grain (TPA) with the fitted theoretical normal distributions. The distribution of TPA strength at a low MC was narrow compared to the high MC cases due to the high MC samples covering a broader MC range. Compared with P. radiata, the probability distribution of the wet E. nitens samples lay in a higher value range, implying that the design value of E. nitens was higher than P. radiata with a high MC.
Table 2 contains a statistical evaluation of the tensile failure strengths parallel to the grain (TPA) for the Group I samples. The normal probability distribution was a good fit for all data sets, which was confirmed by both Kolmogorov–Smirnov (K–S) [5,26] and Anderson–Darling (A–D) [5,27] tests (Table 2).
Table 3 presents a statistical summary of the tensile failure strength parallel to the grain for Group I samples. The basic fitted parameters for normal distributions and the characteristic values are also provided. The results revealed that the dry samples had closed mean values of failure strengths, while the mean TPA value of P. radiata was lower than E. nitens in wet conditions. Compared with E. nitens, the high moisture content produced a greater decline in tensile failure strength for P. radiata. This finding was consistent with previous research into the flexural characteristics of E. nitens compared with P. radiata [5]. This is because bending strength is related to tensile strength as the samples finally fail in tension. The 5%-quantile values of the normal distribution of E. nitens for low and high MCs were 72.4 MPa and 44.1 MPa (Table 3), respectively, which were the basis for using E. nitens as a potential structural tensile member. The moisture reduction factor (G) for the TPA strength of E. nitens was 0.69 at the mean level, which was relatively higher than those which have been used for construction timbers, for example P. radiata (0.53 at the mean level in this study).
This demonstrated that plantation E. nitens shows a great potential for use as a tensile member when exposed to water because of the lower strength reduction when the moisture content exceeds the fibre saturation point. In the following sections, further understanding of the tensile mechanical performance of plantation E. nitens timber with low and high MCs from a fibre-managed plantation resource will be discussed, based on the Group II tests.

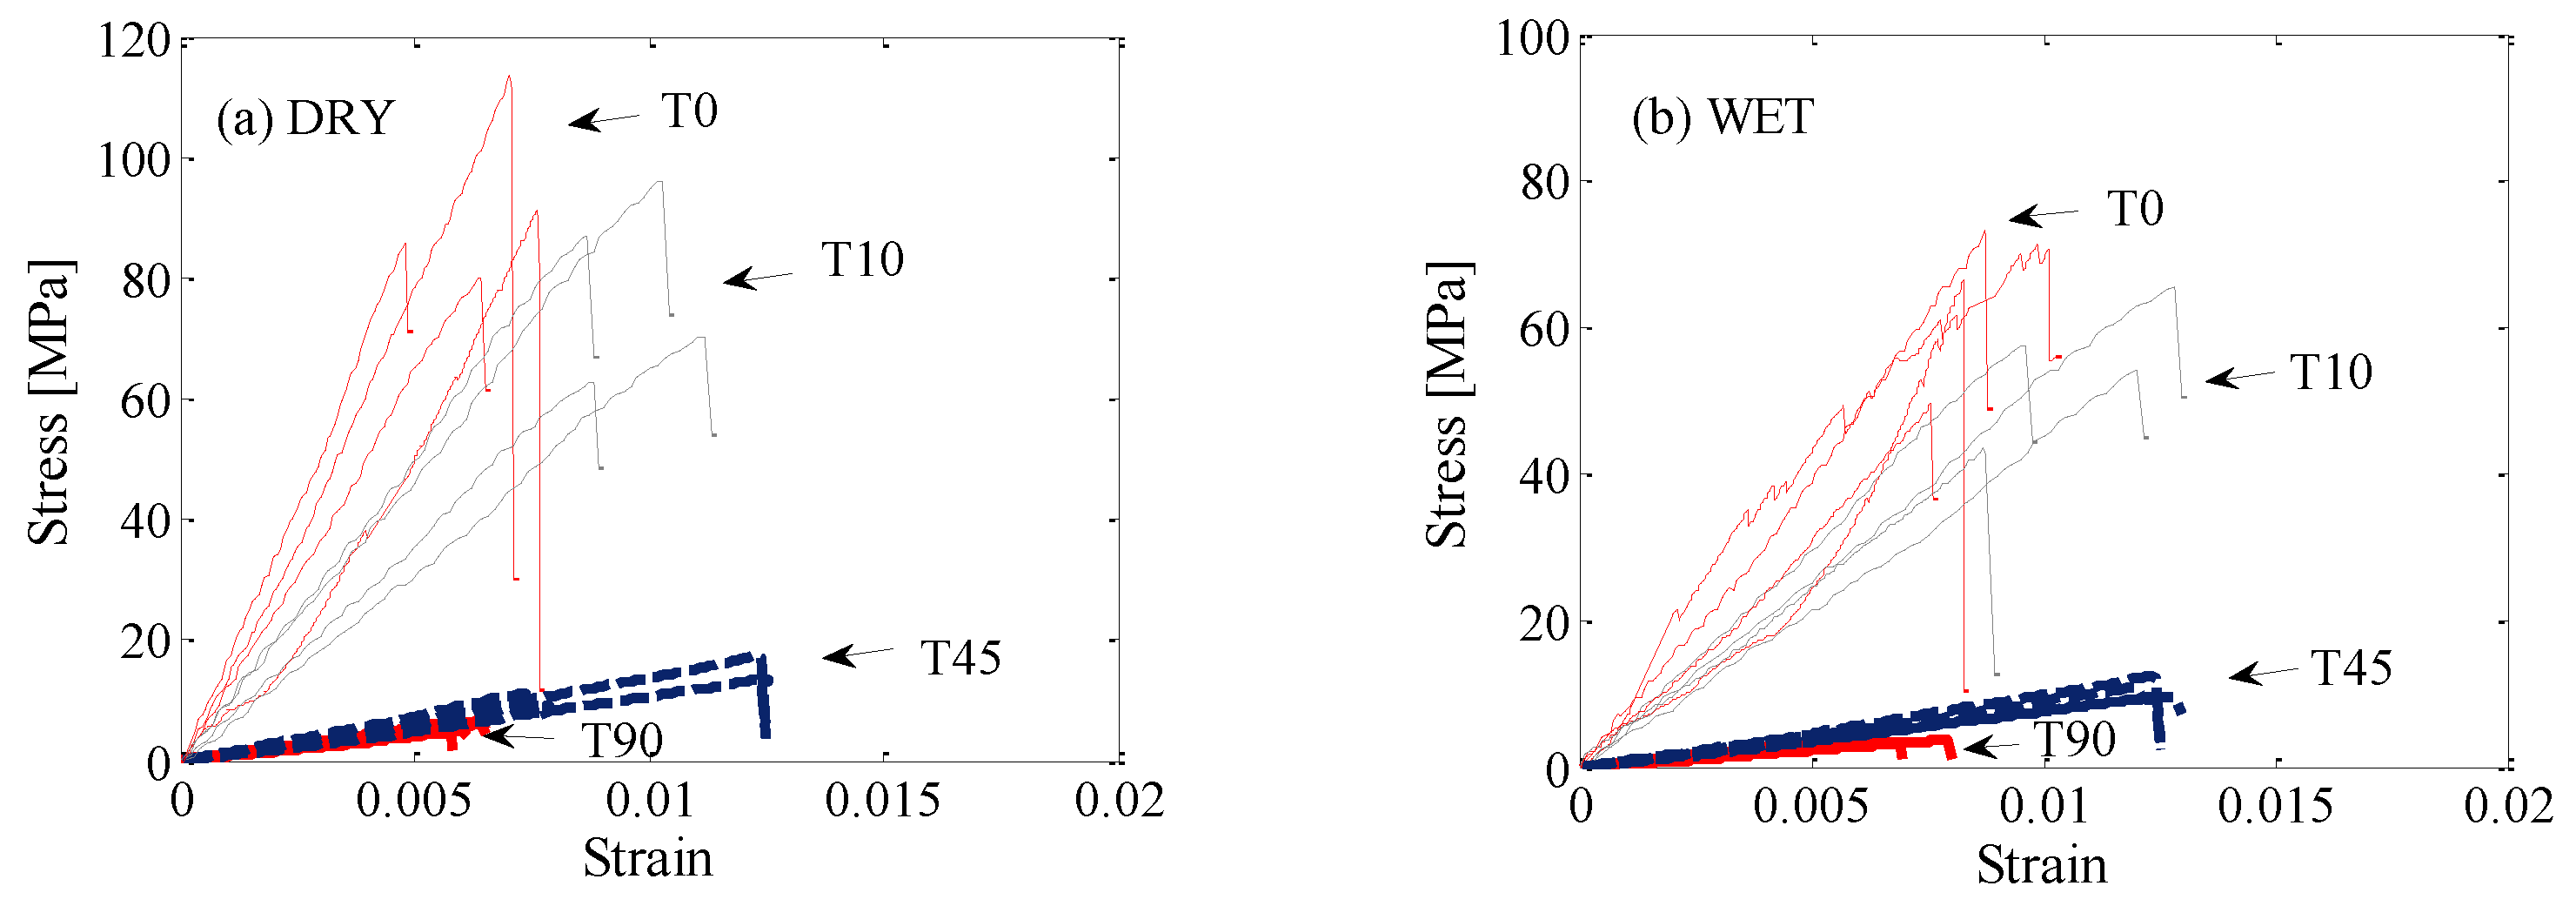
3.3. Stress–Strain Curves
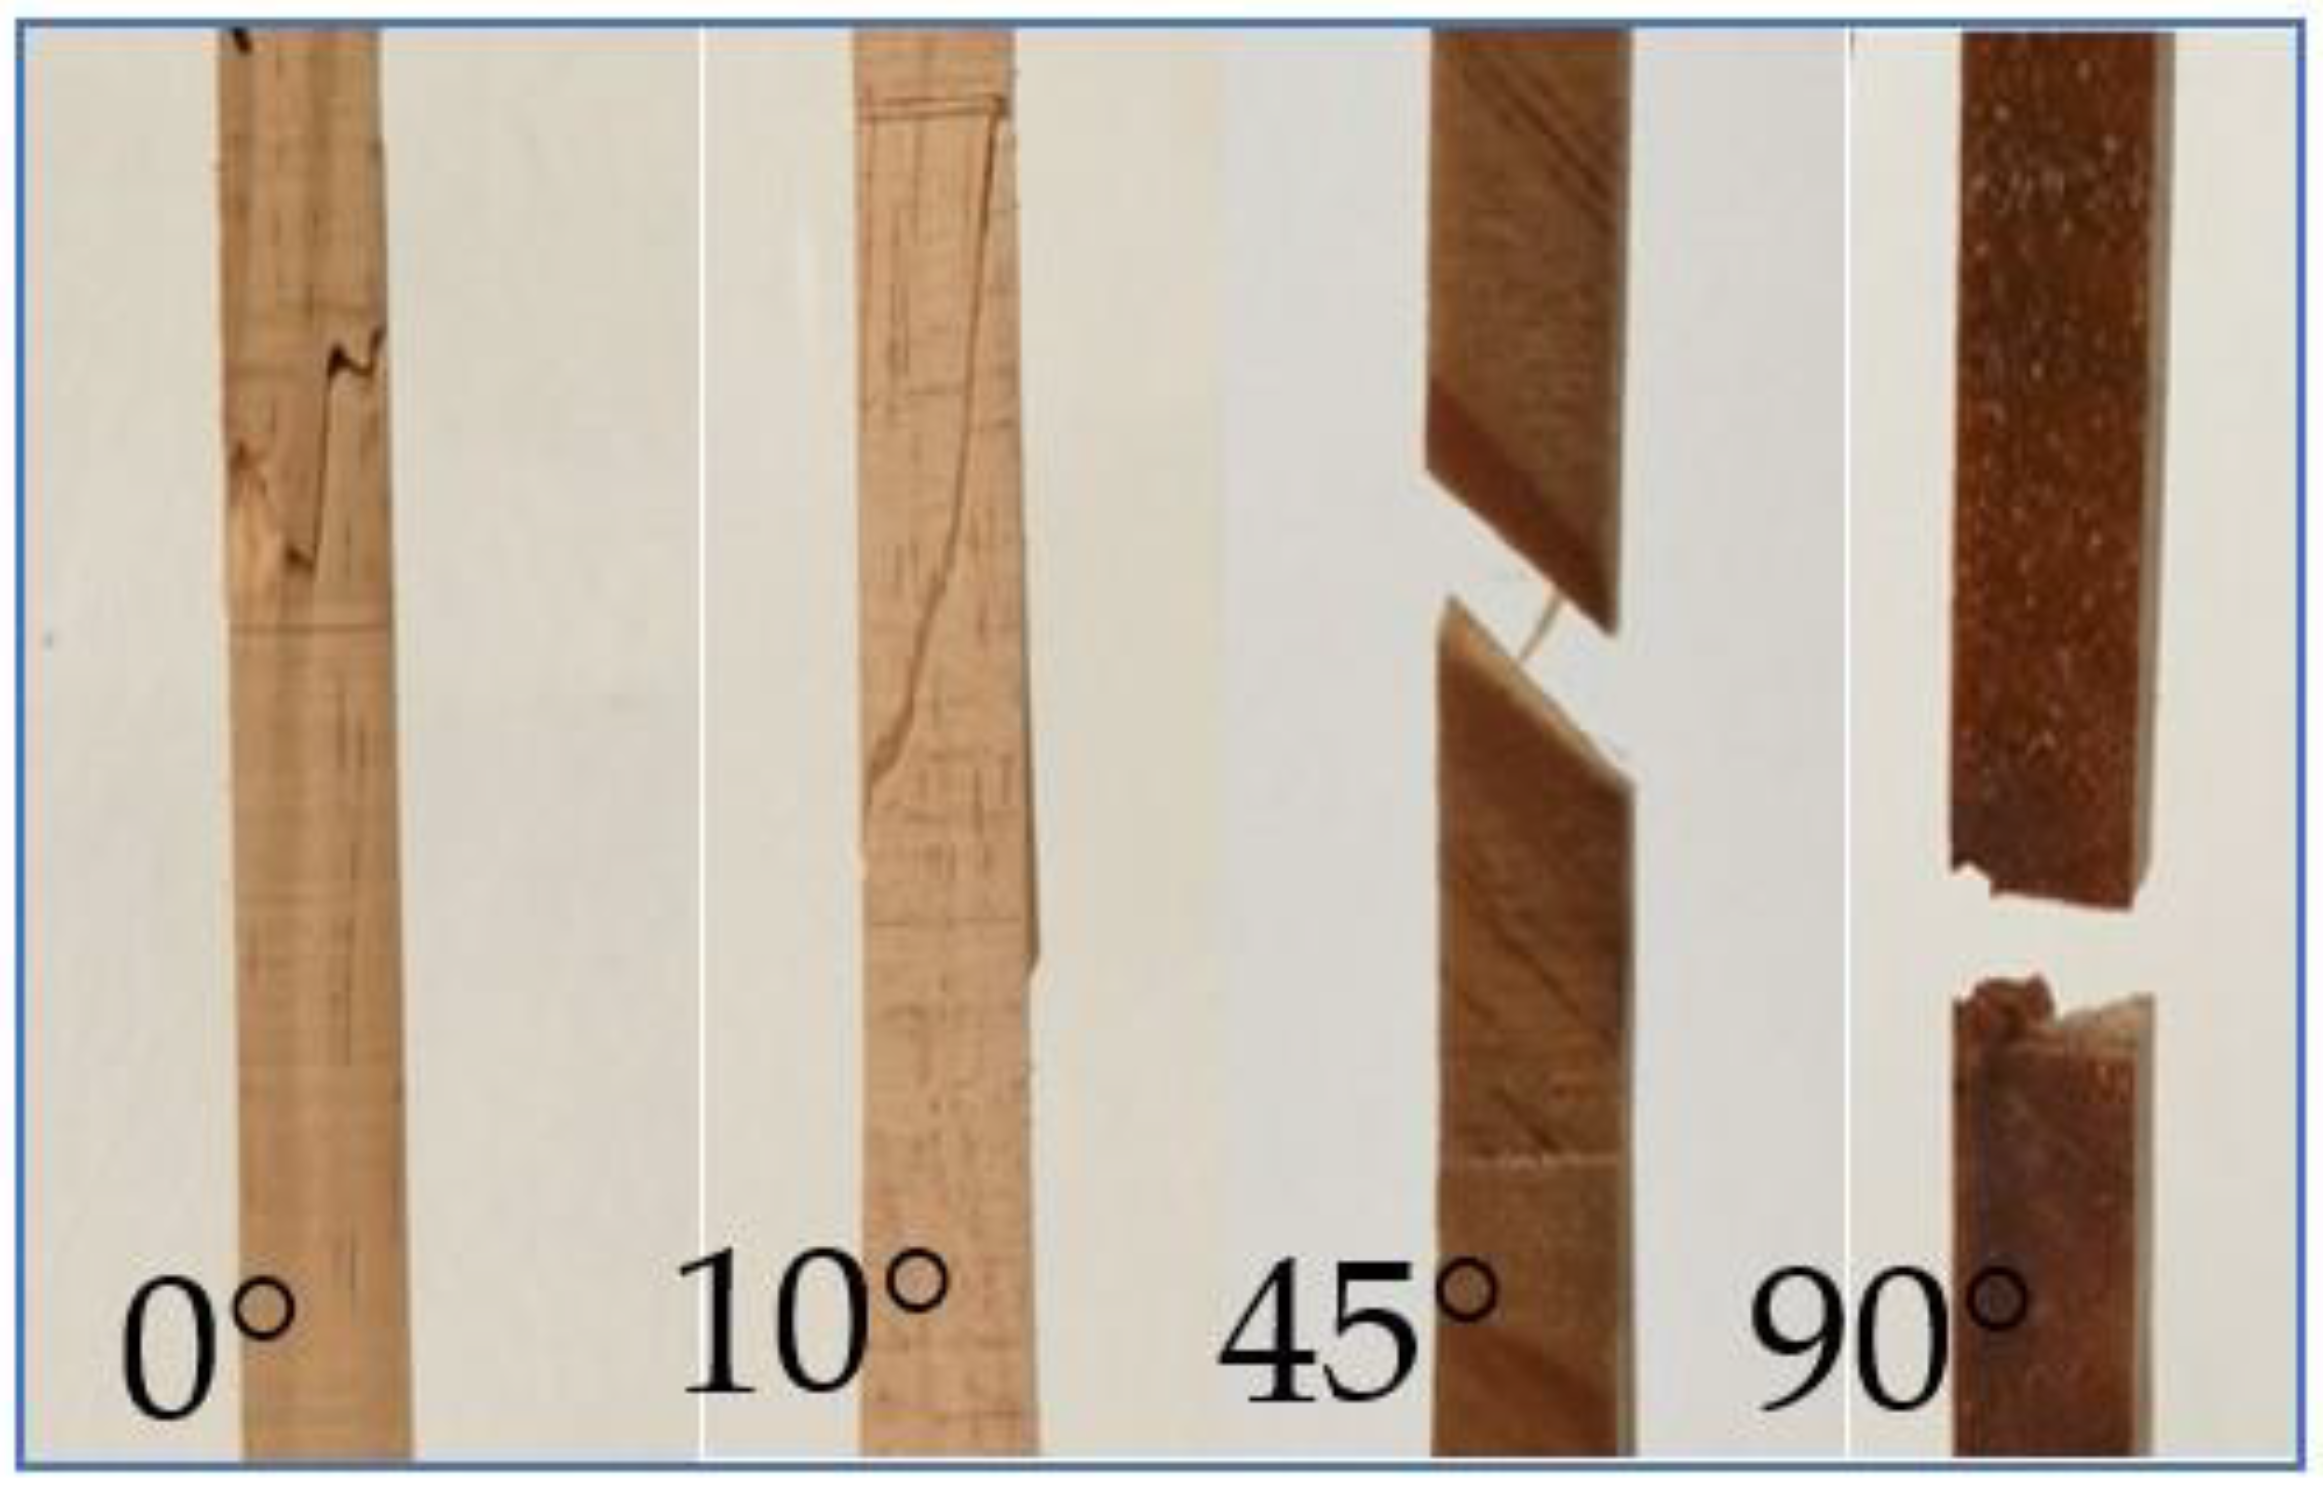
Figure 7 represents the tensile stress–strain curves of E. nitens samples in both dry and wet conditions at grain angles of 0°, 10°, 45°, and 90°. Generally, for both low (dry) and high (wet) moisture contents, the stress increased when the strain increased, and an approximately linear relationship between stress and strain was observed until the peak stress was reached. The measured stress dropped suddenly following its peak value. The peak stress was equal to the failure strength of the testing sample (Figure 7). During testing, no obvious elasticity or proportionality limit was observed; hence, the sample was failed while in the elastic range. As the grain angle increased, the slope of the stress–strain curve decreased, which demonstrated that the tensile stiffness decreased with an increase in grain angle. Not surprisingly, samples were stiffer in tension parallel to the grain than for the other grain angle loading cases, and the lowest stiffness and lowest failure strength were observed for loads perpendicular to the grain (grain angle 90°).
The linear range of stress–strain curves for the wet samples ended at somewhat lower stress values compared to the linear range of the corresponding dry samples. More ductility in the tensile behaviour was found in the wet samples (Figure 7), since moisture makes the wood fibres’ ductility increase [28]. The experimental data in the research showed that the high moisture content (wet) samples exhibited a considerably larger strain at a lower failure strength, and plus, the grain angle had a greater influence on the tensile behaviour of E. nitens than the moisture content.

3.4. Failure Modes

The fibre-directed tensile failure mode was classified according to its shape [29]. The failure mode linked strongly with its grain angle, as shown in Figure 8.
A localised brittle fracture of E. nitens timber was found under tensile loading at a grain angle of 0° for both dry and wet conditions. For grain angles of 10° and 45°, cross-grain tensile failures in the narrow part of the samples were identified, with visible cracks extending along the grain. All the samples, both dry and wet, at a grain angle of 90° showed a clean tensile failure along the grain direction. This is because the tensile failure mode perpendicular to the grain differs from that parallel to the grain due to the wood’s microstructure [21]: cells are arranged along the wood fibre with hemicellulose connecting the fibre. This structure results in failure behaviour in tension from the fracture of the wood fibre or the breakage of the bonds between the fibres, respectively, for tension along the grain or tension perpendicular to the grain. It was found that the tensile failure mode of E. nitens timber depends mainly on the grain angle.

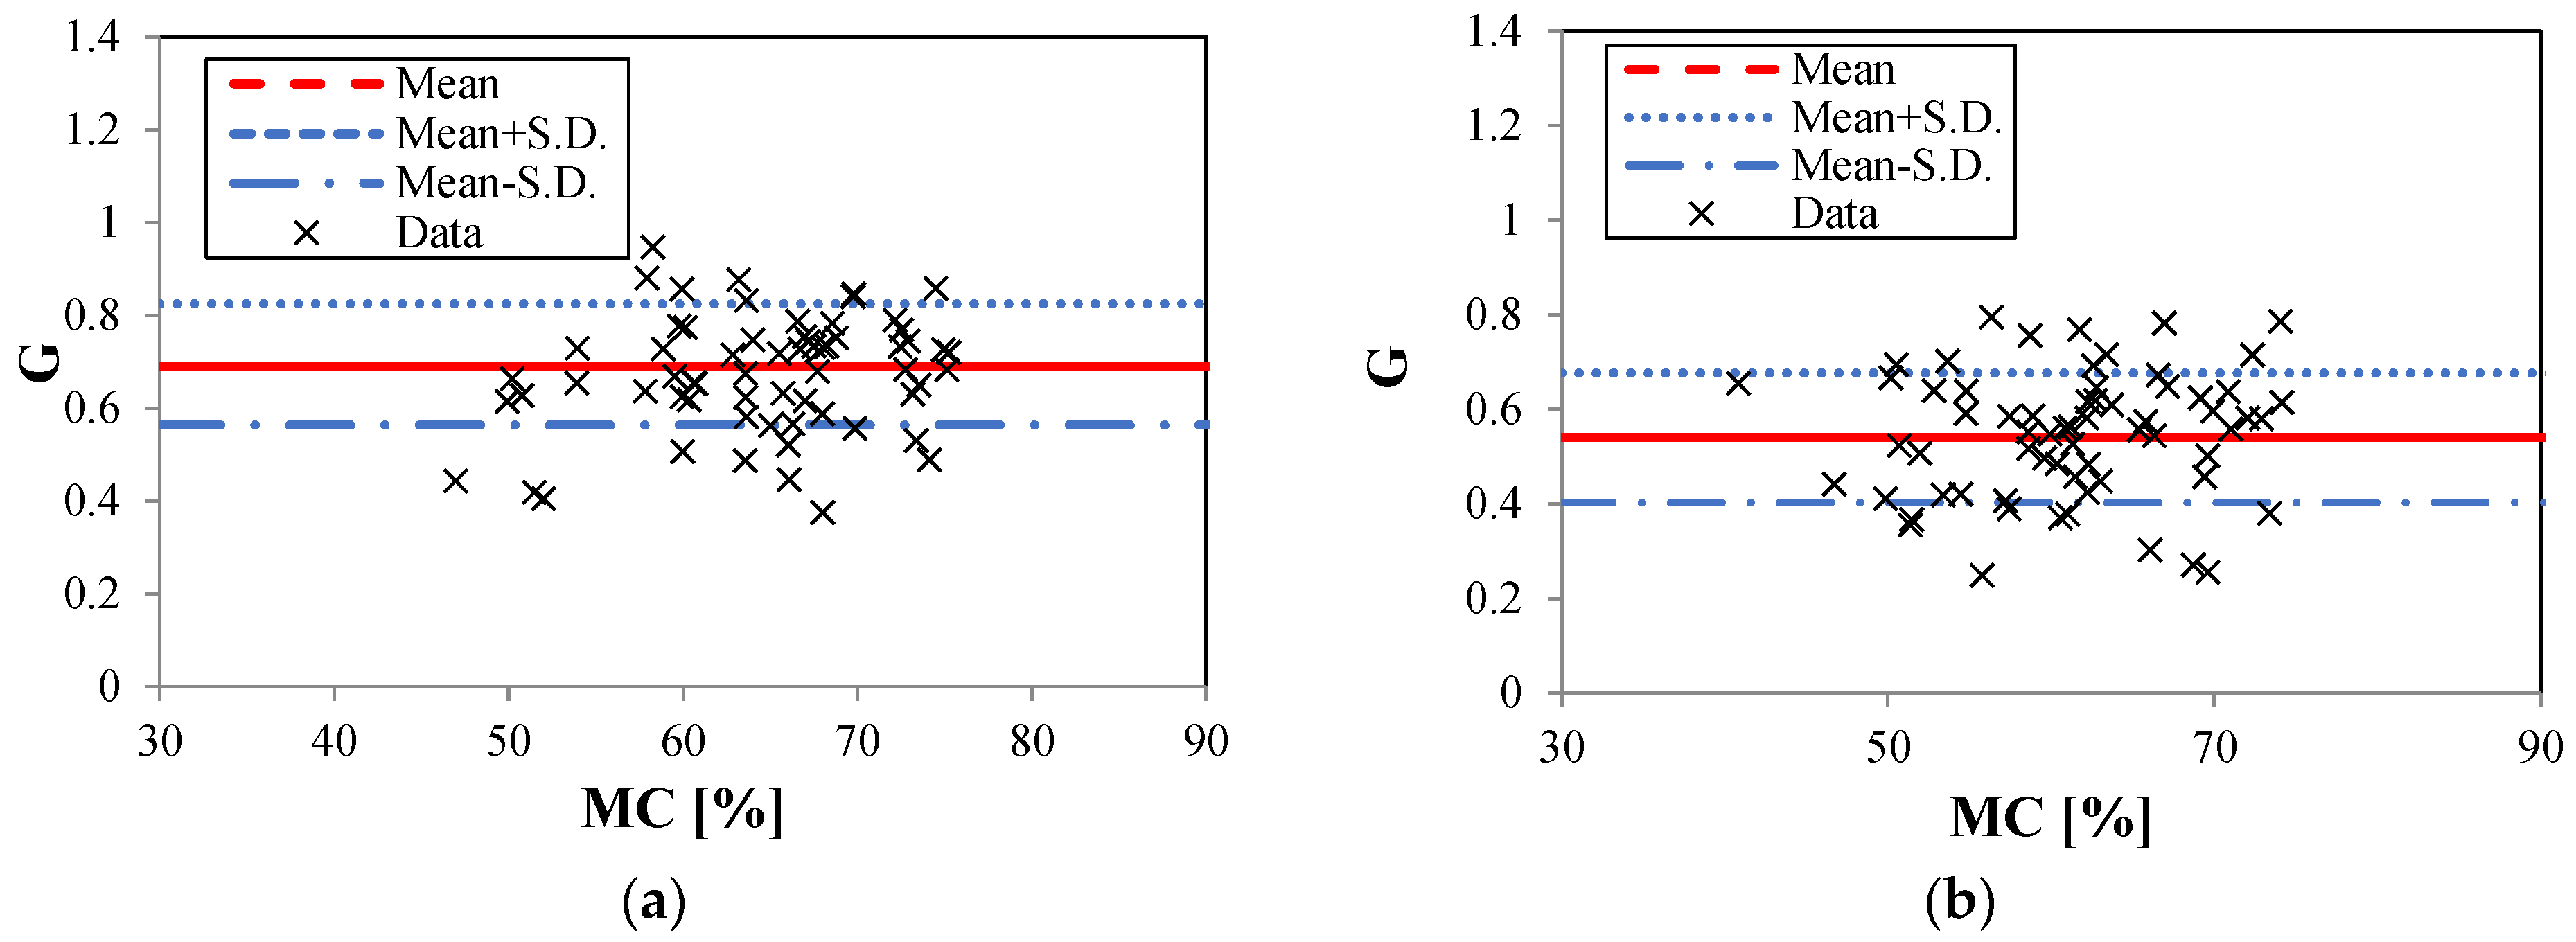
3.5. The Effect of Internal Stresses versus the Grain Angle

The above experiments examined the tensile performance of E. nitens with loading to different grain angles. The components of the stress variables versus the grain angle were then examined to explore the internal stress state within the E. nitens samples. The stress components calculated from Equation (2) at a tensile loading of 1 kN are presented in Figure 9. The tensile load value chosen here is within the capacity of wet samples loaded perpendicular to the grain. The shear stress component increased following the grain angle from 0° to 45°; then, after the shear stress component reached its peak at a grain angle of 45°, it decreased with a further increase in the grain angle. The normal stress component along the grain decreased as the grain angle increased, while the normal stress component across the grain increased as the grain angle increased. At a grain angle of 0°, the normal stress component along the grain was dominant, compared with the corresponding shear stress component and the normal stress component across the grain, which led to a localised brittle fracture of the E. nitens timber. At loading directions of 10° and 45°, shear stress existed and therefore, the failure mode of E. nitens timber was cross-grain tension failure. For a grain angle of 90°, the effect of normal stress across the grain was significant, correlating with a clean tensile failure along the grain direction due to a breakage of the bonds between fibres. Thus, the internal stress state within E. nitens timber links strongly with its failure mode. This is why the tensile failure of E. nitens timber is significantly influenced by the grain angle compared with moisture content.

3.6. Failure Envelopes and Failure Strengths

The failure envelopes are examined here for the further study of establishing stress limits for structural sizing based on the envelope failure curves [30]. The Hill failure criterion [30] was adopted as it is widely used in timber engineering [30,31]. For both low (dry) and high (wet) MCs, the failure envelopes of E. nitens in tension, calculated according to the equations given in Table 4, were 1/4 elliptical arcs which expanded as the moisture content decreased (Figure 10).
Since the failure strength perpendicular to the grain was much lower than that parallel to the grain, the long axis of the elliptical arc coincided with the grain direction. This implied that the tensile strength of E. nitens timber was obviously dependent on the grain angle, and the anisotropic tensile behaviour of E. nitens timber both below and above the FSP was proved. The correlation between the experimental results and the Hill criteria confirmed this finding.
Next, the tensile failure strengths in this study were compared with the findings from compression testing of E. nitens samples with low and high MCs [10]. The compressive result was obtained from a previous study on E. nitens samples [10]. Table 5 shows the mean failure strengths of E. nitens timber at grain angles of 0°, 45°, and 90° with both low (dry) and high (wet) MCs. For both tension and compression, as the grain angle increased, the failure strength decreased. Compared with the dry samples, lower failure strengths were found for wet samples for the three grain angle situations (0°, 45°, and 90°), implying an increase in the risk of E. nitens failure with an increase in MC.
A significant difference in the value of failure strengths of E. nitens in tension and compression was found (Table 5). Consistent with previous findings on other species [11], along the grain, a higher tensile failure strength was found than that under compression both above and below the FSP, i.e., the compressive strength of the wood was almost two times lower than the tensile strength. This agreed with previous studies on dry wood, which showed that wood is an anisotropic material with different strengths in tension and compression [29,32]. This anisotropy is due to the cellular nature of wood and its growth. The wood cell wall contains cellulose, hemicelluloses, and lignin, which interact to form a natural composite material [21]. Because long and narrow cells act as columns of wood fibres in the grain direction and the hemicellulose bonds the wood fibres as fibril networks, wood has different post-failure mechanisms for tension and compression and loads parallel to the grain or perpendicular to the grain [32]. Tension strength parallel to the grain (TPA) is suggested for use with E. nitens timber of low and high MCs in practical applications, as this exploits the highest strength.
The present work extends this research to wet (MC > FSP) samples and considers the failure strength with loading to different grain directions. The present study found that the failure strengths and the mechanical behaviour of E. nitens timber in tension and compression were also different above the FSP. Compared with the data from the testing of thermally-modified E. nitens timber, a similar reduction in the mean strength level was found (0.75 for heat-treated/untreated Group III samples, and 0.69 for wet/dry Group I E nitens samples). This is because a high moisture affects the wood cellulose polymers and reduces hydrogen bonding between the polymers [18]. The effect of the high moisture content on the tensile characterisation of E. nitens timber is reversible. However, the degradation of thermally-modified E. nitens timber is irreversible due to the thermal modification process which contributes to the degradation of hemicellulose [33,34] and changes the components of the wood natural composite [11,18,35].

4. Conclusions

This study characterised the anisotropic tensile preformation of Eucalyptus nitens (E. nitens) timber above the FSP, which had not previously been studied and quantified. This was also the first study to examine the suitability of Eucalyptus nitens timber, both below and above the FSP, as a structural material loaded in tension. Tensile experiments were carried out on 240 E. nitens samples using a universal testing machine. The anisotropic behaviour of E. nitens was tested at various load-to-grain angles, as well as at low and high MCs.
The findings can be summarised as follows:
  • When MC > FSP, the traditional structural timber, P. radiata, showed a greater decrease in longitudinal tensile failure strength than was found for E. nitens. The mean strength reduction of E. nitens was less than that of traditional construction timber, for example P. radiata, indicating the E. nitens shows promise for use in the building industry, especially when exposed to water. The design characteristic values of E. nitens timber were 72.4 MPa and 44.1 Mpa, respectively.
  • Samples with both low and high MCs failed by brittle fracture, while the high MC samples achieved lower values of tensile strength. The tensile failure strengths were demonstrated to be moisture content sensitive. The different failure strengths of E. nitens wood in tension and compression were also found both below and above the FSP. A similar reduction in the strength was found for high moisture content samples compared with thermally-modified E. nitens timber, indicating that moisture content affects E. nitens wood cellulose polymers.
  • Plantation E. nitens timber in tension was highly anisotropic with respect to grain angle, and its ductility increased as MC increased. Compared with moisture content, the grain angle had a stronger effect on the tensile failure of E. nitens timber due to the micro-structure of E. nitens timber and differences in the internal stress state. At grain angles of 0°, the normal stress along the grain was dominant compared with the corresponding shear stress and normal stress across the grain, leading to simple tensile failure. At a loading direction of 45°, shear stresses played an important role, resulting in cross-grain tensile failure. For a grain angle of 90°, the effect of normal stress across the grain was significant, and therefore bonds between fibres in the micro-structure broke and clean tensile failure along the grain direction was observed.
This study could provide a basis for future research to assess the vulnerability of E. nitens tensile members for structural applications.

Author Contributions

Conceptualization, Y.C.; methodology, X.C., Y.C., G.N., D.H. and A.C.; formal analysis, X.C. and Y.C.; investigation, X.C. and Y.C.; resources, X.C.; writing—original draft preparation, X.C. and Y.C.; writing—review and editing, X.C., Y.C., G.N., D.H. and A.C.; supervision, G.N., D.H. and A.C. All authors have read and agreed to the published version of the manuscript.

Funding

This research was funded by the Qinglan Project of Jiangsu Province of China and the Tasmania Graduate Research Scholarship, University of Tasmania, Australia, withadditional support was received from the Australian Research Council, Centre for Forest Value, University of Tasmania, TAS, Australia: grant number IC150100004.

Institutional Review Board Statement

Not applicable.

Informed Consent Statement

Not applicable.

Data Availability Statement

Not applicable.

Acknowledgments

The authors would like to thank all the persons who kindly helped in the preparation of this paper. Special gratitude also goes to Barbara Meyer and Chris Beadle for fruitful discussions.

Conflicts of Interest

The authors declare no conflict of interest.

References

  1. Ghanbari Ghazijahani, T.; Jiao, H.; Holloway, D. Composite Timber Beams Strengthened by Steel and CFRP. J. Compos. Constr. 2017, 21, 04016059. [Google Scholar] [CrossRef]
  2. Šubic, B.; Fajdiga, G.; Lopatič, J. Bending Stiffness, Load-Bearing Capacity and Flexural Rigidity of Slender Hybrid Wood-Based Beams. Forests 2018, 9, 703. [Google Scholar] [CrossRef] [Green Version]
  3. Way, D.; Sinha, A.; Kamke, F.; Fujii, J. Evaluation of a Wood-Strand Molded Core Sandwich Panel. J. Mater. Civ. Eng. 2016, 28, 04016074. [Google Scholar] [CrossRef]
  4. Derikvand, M.; Nolan, G.; Jiao, H.; Kotlarewski, N. What to Do with Structurally Low-Grade Wood from Australia’s Plantation Eucalyptus; Building Application? BioResources 2016, 12, 4–7. [Google Scholar] [CrossRef] [Green Version]
  5. Cheng, Y.; Nolan, G.; Holloway, D.; Kaur, J.; Lee, M.; Chan, A. Flexural characteristics of Eucalyptus nitens timber with high moisture content. BioResources 2021, 16, 2921–2936. [Google Scholar] [CrossRef]
  6. Derikvand, M.; Kotlarewski, N.; Lee, M.; Jiao, H.; Chan, A.; Nolan, G. Short-term and long-term bending properties of nail-laminated timber constructed of fast-grown plantation eucalypt. Constr. Build. Mater. 2019, 211, 952–964. [Google Scholar] [CrossRef]
  7. Derikvand, M.; Kotlarewski, N.; Lee, M.; Jiao, H.; Nolan, G. Characterisation of Physical and Mechanical Properties of Unthinned and Unpruned Plantation-Grown Eucalyptus nitens H.Deane & Maiden Lumber. Forests 2019, 10, 194. [Google Scholar] [CrossRef] [Green Version]
  8. Pagel, C.L.; Lenner, R.; Wessels, C.B. Investigation into material resistance factors and properties of young, engineered Eucalyptus grandis timber. Constr. Build. Mater. 2020, 230, 117059. [Google Scholar] [CrossRef]
  9. Aicher, S.; Stapf, G. Compressive strength parallel to the fiber of spruce with high moisture content. Eur. J. Wood Wood Prod. 2016, 74, 527–542. [Google Scholar] [CrossRef] [Green Version]
  10. Cheng, Y.; Chan, A.H.C.; Holloway, D.; Nolan, G. Anisotropic material behaviour under compression of Eucalyptus nitens with high moisture content. Constr. Build. Mater. 2022, 314, 124788. [Google Scholar] [CrossRef]
  11. Ross, R.J. Wood handbook: Wood as an Engineering Material; United States Department of Agriculture Forest Service, Forest Products Laboratory: Madison, WI, USA, 2010; Volume 190. [Google Scholar]
  12. Barrett, J.D.; Hong, J.-P. Moisture content adjustments for dynamic modulus of elasticity of wood members. Wood Sci. Technol. 2009, 44, 485–495. [Google Scholar] [CrossRef]
  13. Green, D.W.; Evans, J.W. Evolution of Standardized Procedures for Adjusting Lumber Properties for Change in Moisture Content; US Department of Agriculture, Forest Service, Forest Products Laboratory: Madison, WI, USA, 2001. [Google Scholar]
  14. Nocetti, M.; Brunetti, M.; Bacher, M. Effect of moisture content on the flexural properties and dynamic modulus of elasticity of dimension chestnut timber. Eur. J. Wood Wood Prod. 2014, 73, 51–60. [Google Scholar] [CrossRef]
  15. Wang, J. Drying performance of experimental wood roof assemblies. In Report to the Canadian Forest Service, Natural Resources Canada; FPInnovations: Vancouver, BC, Canada, 2014. [Google Scholar]
  16. Brites, R.D.; Neves, L.C.; Saporiti Machado, J.; Lourenço, P.B.; Sousa, H.S. Reliability analysis of a timber truss system subjected to decay. Eng. Struct. 2013, 46, 184–192. [Google Scholar] [CrossRef] [Green Version]
  17. Niklewski, J.; van Niekerk, P.B.; Brischke, C.; Frühwald Hansson, E. Evaluation of Moisture and Decay Models for a New Design Framework for Decay Prediction of Wood. Forests 2021, 12, 721. [Google Scholar] [CrossRef]
  18. Arnold, M. Effect of moisture on the bending properties of thermally modified beech and spruce. J. Mater. Sci. 2009, 45, 669. [Google Scholar] [CrossRef] [Green Version]
  19. Bergander, A.; Salmén, L. Cell wall properties and their effects on the mechanical properties of fibers. J. Mater. Sci. 2002, 37, 151–156. [Google Scholar] [CrossRef]
  20. ASTMD2899; Standard Practice for Establishing Allowable Stresses for Round Timber Piles. ASTM International: West Conshohocken, PA, USA, 2012.
  21. Polyanin, A.D.; Manzhirov, A.D. Timber: Its Nature and Behaviour; CRC Press: Boca Raton, FL, USA, 2000. [Google Scholar]
  22. Kramer, A.; Barbosa, A.R.; Sinha, A. Performance of Steel Energy Dissipators Connected to Cross-Laminated Timber Wall Panels Subjected to Tension and Cyclic Loading. J. Struct. Eng. 2016, 142. [Google Scholar] [CrossRef]
  23. Dawson, B.S.W.; Pearson, H.; Kimberley, M.O.; Davy, B.; Dickson, A.R. Effect of supercritical CO2 treatment and kiln drying on collapse in Eucalyptus nitens wood. Eur. J. Wood Wood Prod. 2020, 78, 209–217. [Google Scholar] [CrossRef] [Green Version]
  24. ASTMD143–09; Standard Test Methods for Small Clear Specimens of Timber. ASTM International: West Conshohocken, PA, USA, 2009.
  25. AS/NZS1080.1; Timber—Methods of Test—Moisture Content. Standards Australia: Sydney, Australia, 2012.
  26. Bryc, W. The Normal Distribution: Characterizations with Applications; Springer Science & Business Media: Berlin/Heidelberg, Germany, 2012; Volume 100. [Google Scholar]
  27. Anderson, T.W.; Darling, D.A. A Test of Goodness of Fit. J. Am. Stat. Assoc. 1954, 49, 765–769. [Google Scholar] [CrossRef]
  28. Báder, M.; Németh, R. Moisture-dependent mechanical properties of longitudinally compressed wood. Eur. J. Wood Wood Prod. 2019, 77, 1009–1019. [Google Scholar] [CrossRef] [Green Version]
  29. Crespo, J.; Majano-Majano, A.; Lara-Bocanegra, A.J.; Guaita, M. Mechanical Properties of Small Clear Specimens of Eucalyptus globulus Labill. Materials 2020, 13, 906. [Google Scholar] [CrossRef] [PubMed] [Green Version]
  30. Mascia, N.T.; Simoni, R.A. Analysis of failure criteria applied to wood. Eng. Fail. Anal. 2013, 35, 703–712. [Google Scholar] [CrossRef]
  31. Milch, J.; Tippner, J.; Sebera, V.; Brabec, M. Determination of the elasto-plastic material characteristics of Norway spruce and European beech wood by experimental and numerical analyses. Holzforschung 2016, 70, 1081–1092. [Google Scholar] [CrossRef]
  32. Clouston, P.L.; Lam, F. A stochastic plasticity approach to strength modeling of strand-based wood composites. Compos. Sci. Technol. 2002, 62, 1381–1395. [Google Scholar] [CrossRef]
  33. Yuan, T.; Wang, Z.; Han, X.; Yuan, Z.; Wang, X.; Li, Y. Multi-scale evaluation of the effect of saturated steam on the micromechanical properties of Moso bamboo. Holzforschung 2021, 75, 1052–1060. [Google Scholar] [CrossRef]
  34. Wang, Q.; Wu, X.; Yuan, C.; Lou, Z.; Li, Y. Effect of Saturated Steam Heat Treatment on Physical and Chemical Properties of Bamboo. Molecules 2020, 25, 1999. [Google Scholar] [CrossRef] [PubMed]
  35. Hill, C.A.S. Wood Modification: Chemical, Thermal and Other Processes; John Wiley & Sons, Ltd.: Bangor, UK, 2006. [Google Scholar]
Figure 1. Dimensions of the samples: (a) sample dimension type for grain angles of 0°, 10°, or 45°; (b) sample dimension type for a grain angle of 90°.
Polymers 14 02390 g001
Figure 2. Cut method for Group II samples with grain angles of 10° and 45°.
Polymers 14 02390 g002
Figure 3. Test photo of tensile testing.
Polymers 14 02390 g003
Figure 4. Boxplot of MC for E. nitens samples compared with the corresponding P. radiata samples.
Polymers 14 02390 g004
Figure 5. Moisture reduction factor (G) versus MC for Group I samples: (a) E. nitens; (b) P. radiata. S.D. denotes standard deviations.
Polymers 14 02390 g005
Figure 6. Cumulative probability distributions of experimental tensile failure strength (points) for low and high MC samples: (a) E. nitens; (b) P. radiata. The lines are the fitted theoretical normal distributions.
Polymers 14 02390 g006
Figure 7. Stress–strain curves of E. nitens tensile samples with both low (dry) and high (wet) moisture contents for four angles α = 0°, 10°, 45°, and 90°; Left plot (a), dry samples; right plot (b), wet samples; T0, α = 0°; T10, α = 10°; T45, α = 45°; T90, α = 90°. The different lines in the same colour in each figure represent four representative replicate tests.
Polymers 14 02390 g007
Figure 8. Typical failure modes of the tensile samples for four grain directions; the photo for a grain angle of 90° is from a side view.
Polymers 14 02390 g008
Figure 9. The effect of stress component ( σ i j / σ f ) versus grain angle. σ i j (i, j = L, R) is the stress component, and σ f is the stress in the load direction at a tensile loading of 1 kN; symbols L and R represent the principal anatomical directions: i.e., longitudinal direction and radial direction.
Polymers 14 02390 g009
Figure 10. The tensile failure envelopes in the longitudinal and radial planes for E. nitens timber in dry (MC = 12%) and wet (MC > FSP) states compared with the mean values of experimental data (the circles). The failure envelopes were determined based on Hill criteria [30] using the values of the parameters presented in Table 4.
Polymers 14 02390 g010
Table 1. Summary of experiments.
SpeciesMoisture Content (MC)CodeNumber of Replicated SamplesGrain Angle
GROUP IE. nitens12%DRY-E-TPA80
>30%WET-E-TPA80
P. radiata12%DRY-P-TPA80
>30%WET-P-TPA80
GROUP IIE. nitens12%DRY-E-T010
DRY-E-T101010°
DRY-E-T451045°
DRY-E-T901090°
>30%WET-E-T010
WET-E-T101010°
WET-E-T451045°
WET-E-T901090°
GROUP IIIUntreated E. nitens (kiln dried)12%UT-E-T010
Heat-treated E. nitensHT-E-T010
Table 2. Goodness-of-fit for normal distribution of the longitudinal tensile failure strength.
Kolmogorov–Smirnov (K–S) TestAnderson–Darling (A–D) Test
Maximum Absolute DifferenceCritical ValueAcceptanceSquared DistanceCritical ValueAcceptance
E. nitensDRY-E-TPA0.07160.1496Yes0.310.54Yes
WET-E-TPA0.08970.1496Yes0.340.47Yes
P. radiataDRY-P-TPA0.06050.1496Yes0.340.49Yes
WET-P-TPA0.07920.1496Yes0.350.44Yes
Table 3. Tensile failure strength parallel to the grain (TPA).
Tensile Failure StrengthE. nitensP. radiata
MC = 12%MC > FSPMC = 12% MC > FSP
Mean (Mpa)91.963.894.751.1
Coefficients of variations13.0%18.8%11.0%25.4%
Characteristic value, fn (Mpa)72.444.177.629.8
Table 4. Hill criteria showing in Figure 10 below.
CodeFormulaeNotes
Hill Dry σ l 2 91.6 2 + σ r 2 5.6 2 σ l · σ r 91.6 2 + τ l r 2 12.9 2 = 1Hill criterion for dry samples
in tension
Hill Wet σ l 2 62.1 2 + σ r 2 3.8 2 σ l · σ r 62.1 2 + τ l r 2 8.3 2 = 1Hill criterion for wet samples
in tension
Table 5. The failure strengths of E. nitens timber in both dry (MC = 12%) and wet (MC = 66% > FSP) conditions at grain angles of 0°, 45°, and 90°.
Grain Angle (°) Compression [10]Tension
0459004590
Failure strength (MPa)DRY (MC = 12%)Mean43.218.08.391.612.95.6
S.D.*5.52.42.010.92.41.2
N **101010101010
WET (MC > FSP)Mean23.99.64.662.18.33.8
S.D. *3.11.81.07.91.40.9
N **101010101010
* S.D. denotes standard deviations; ** N is the number of the replicate tests.
Publisher’s Note: MDPI stays neutral with regard to jurisdictional claims in published maps and institutional affiliations.

