
Determination of the Influence of Multiple Closed Recycling Loops on the Property Profile of Different Polyolefins

 , , and
Abstract
:1. Introduction
2. Materials and Methods
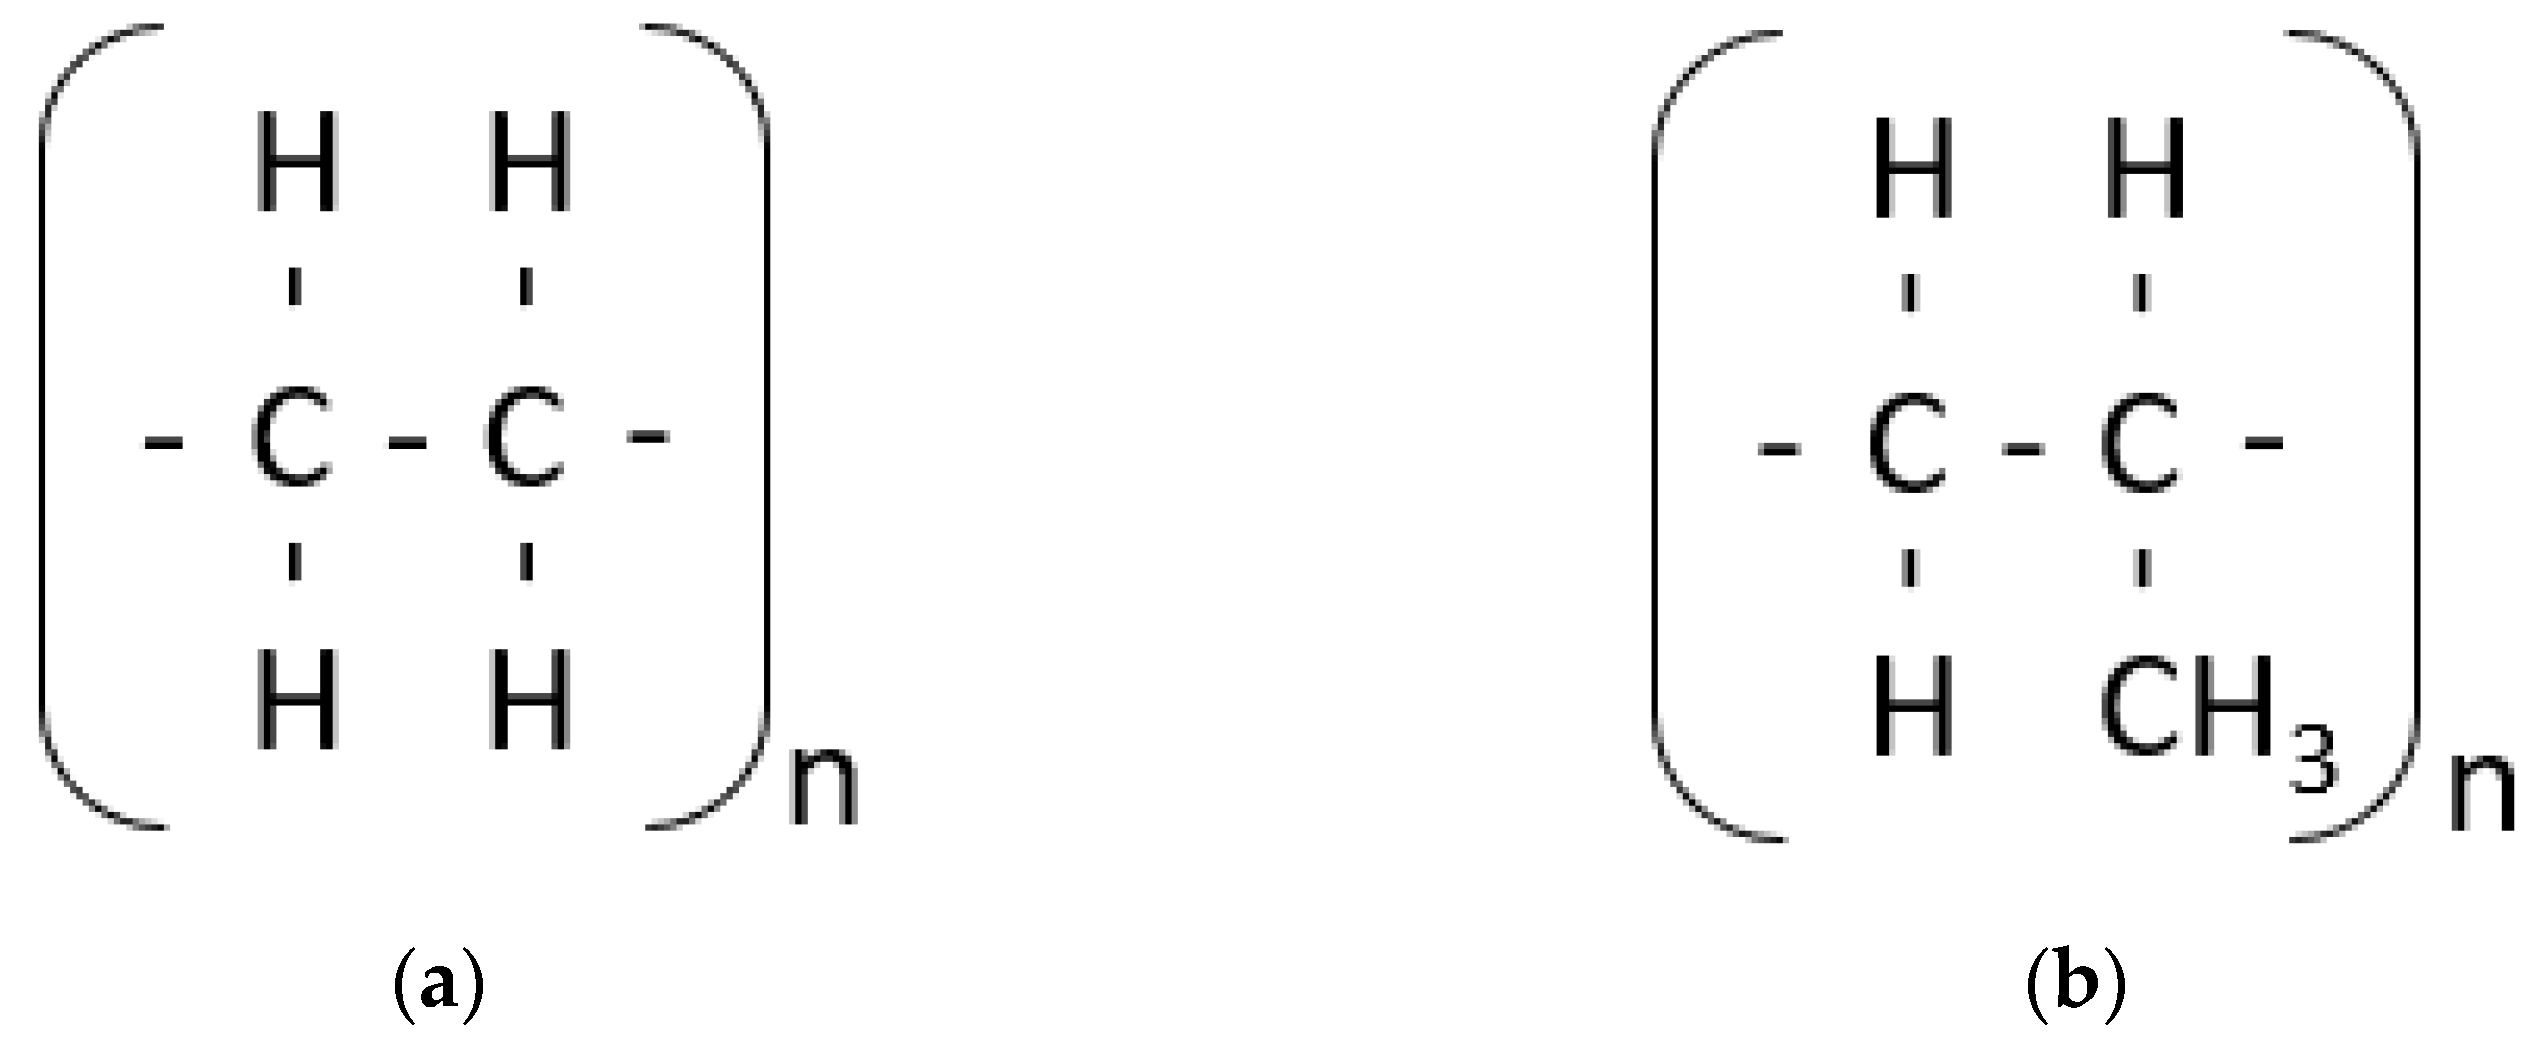
2.1. Materials
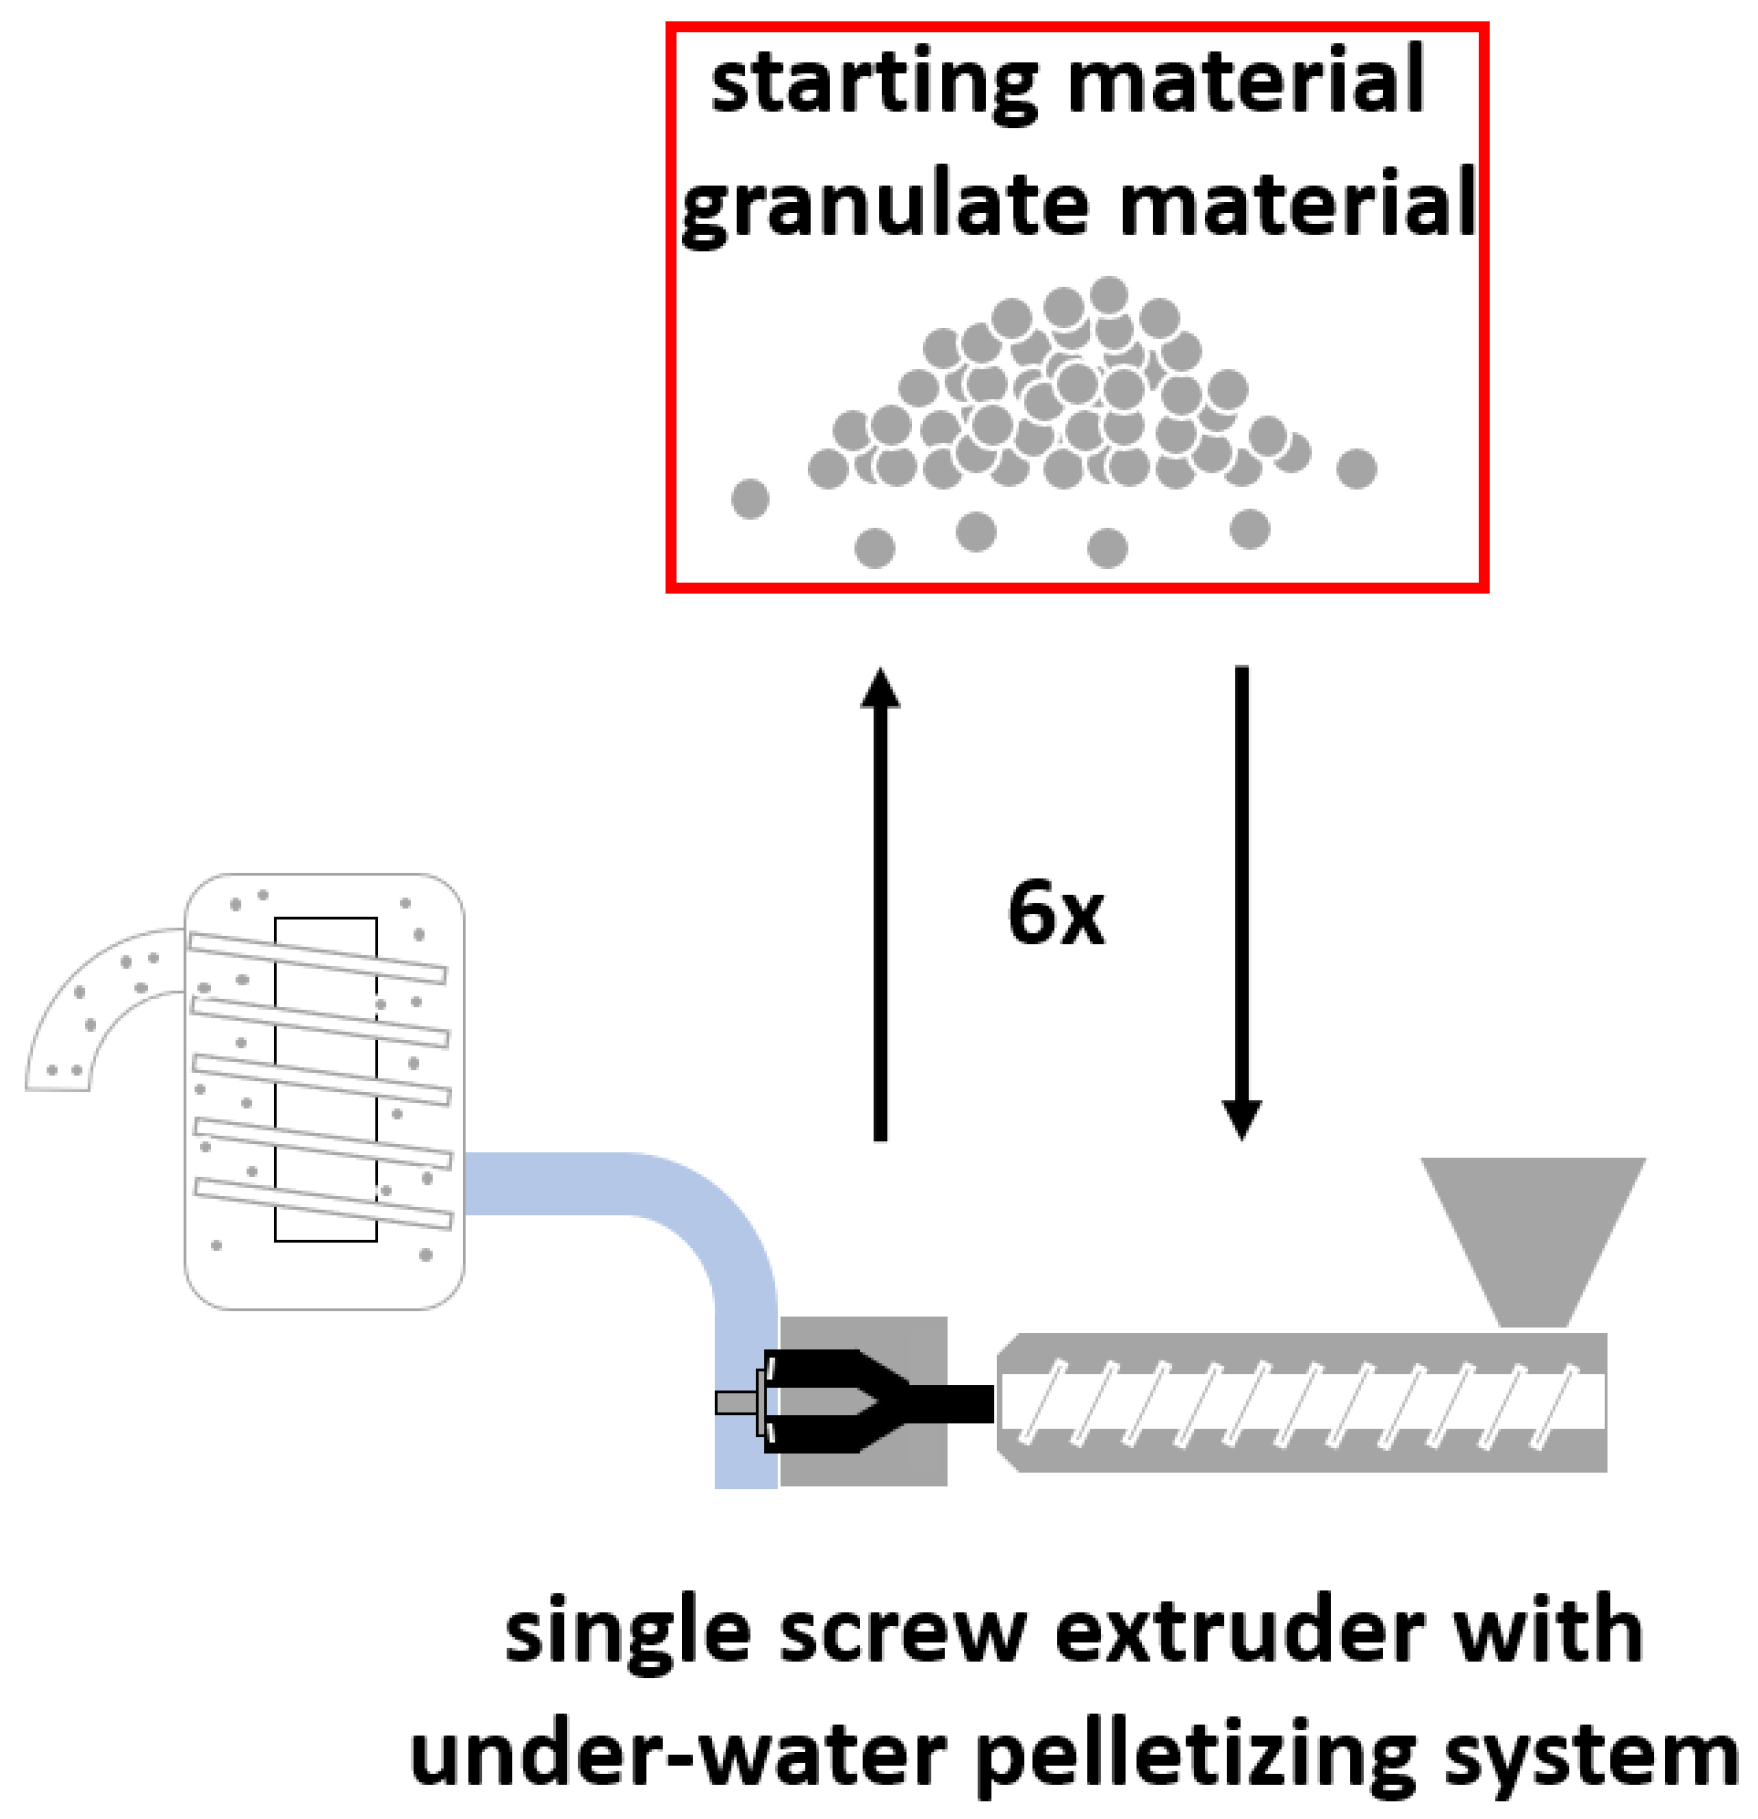
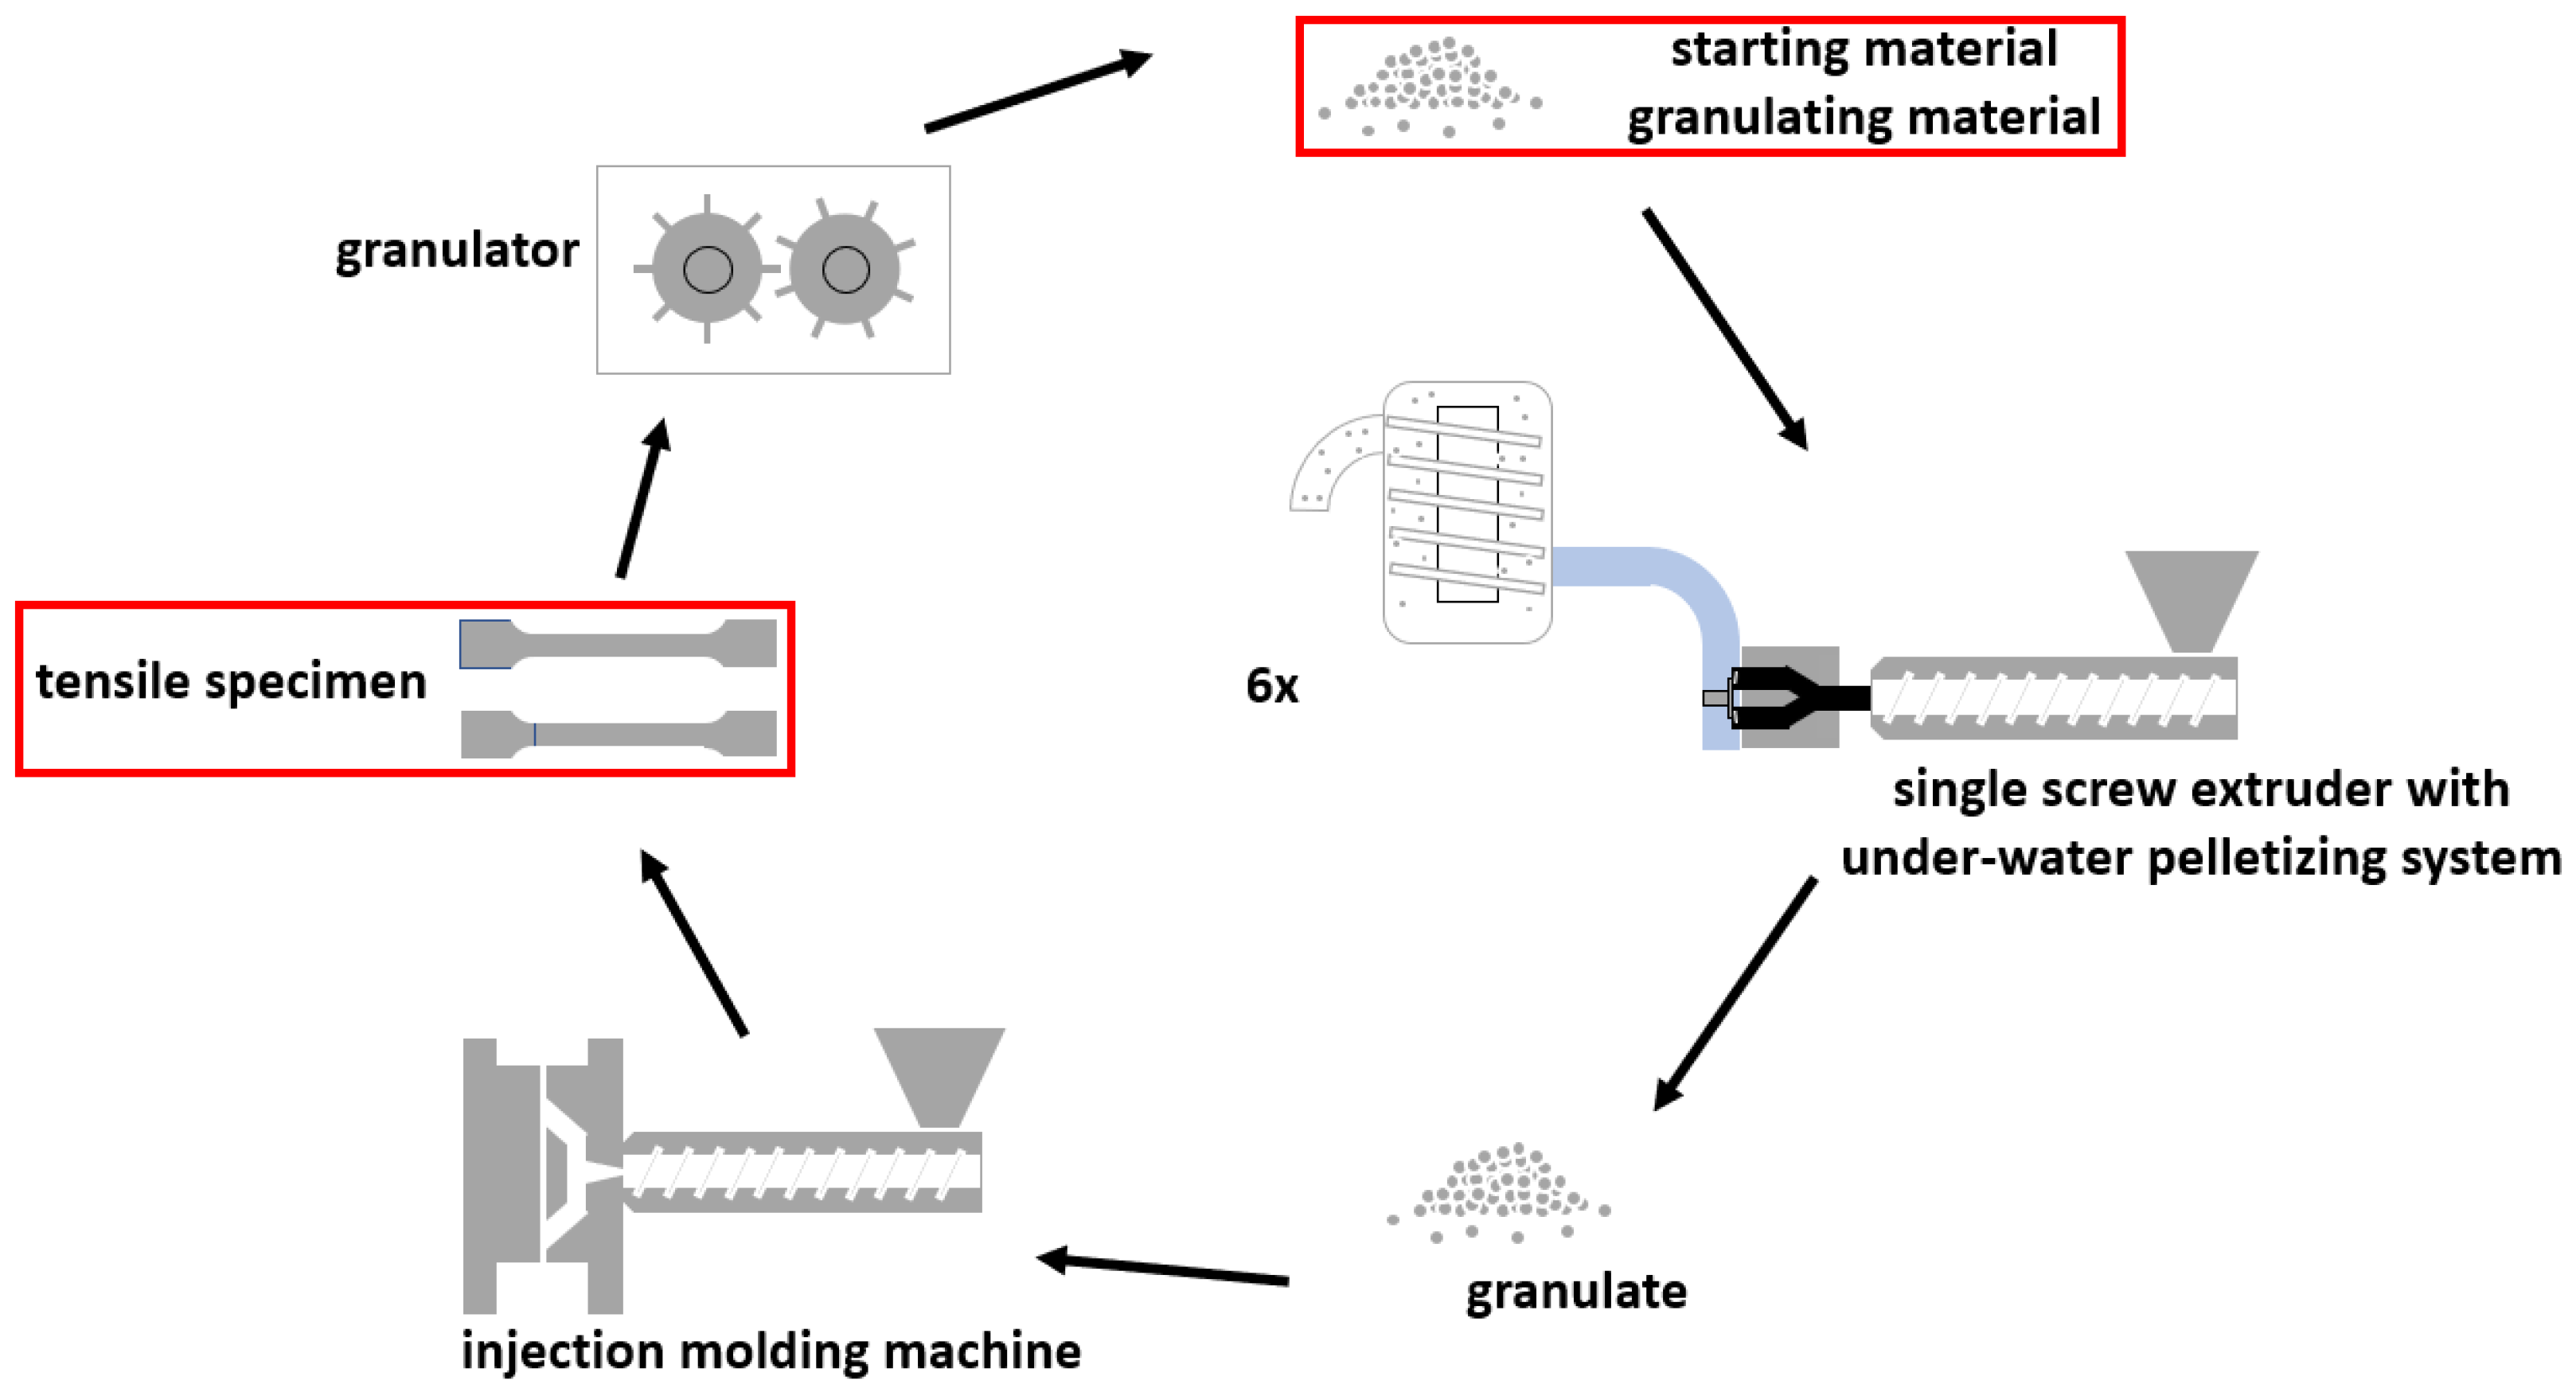
2.2. Closed-Loop Recycling Cycles
2.3. Characterization Methods
2.3.1. High-Pressure Liquid Chromatography (HPLC)
2.3.2. Gel Permeation Chromatography (GPC)
2.3.3. Melt Flow Rate (MFR)
2.3.4. Infrared Spectroscopy (IR Spectroscopy)
2.3.5. Differential Thermal Analysis (DTA)
2.3.6. Tensile Test
3. Results
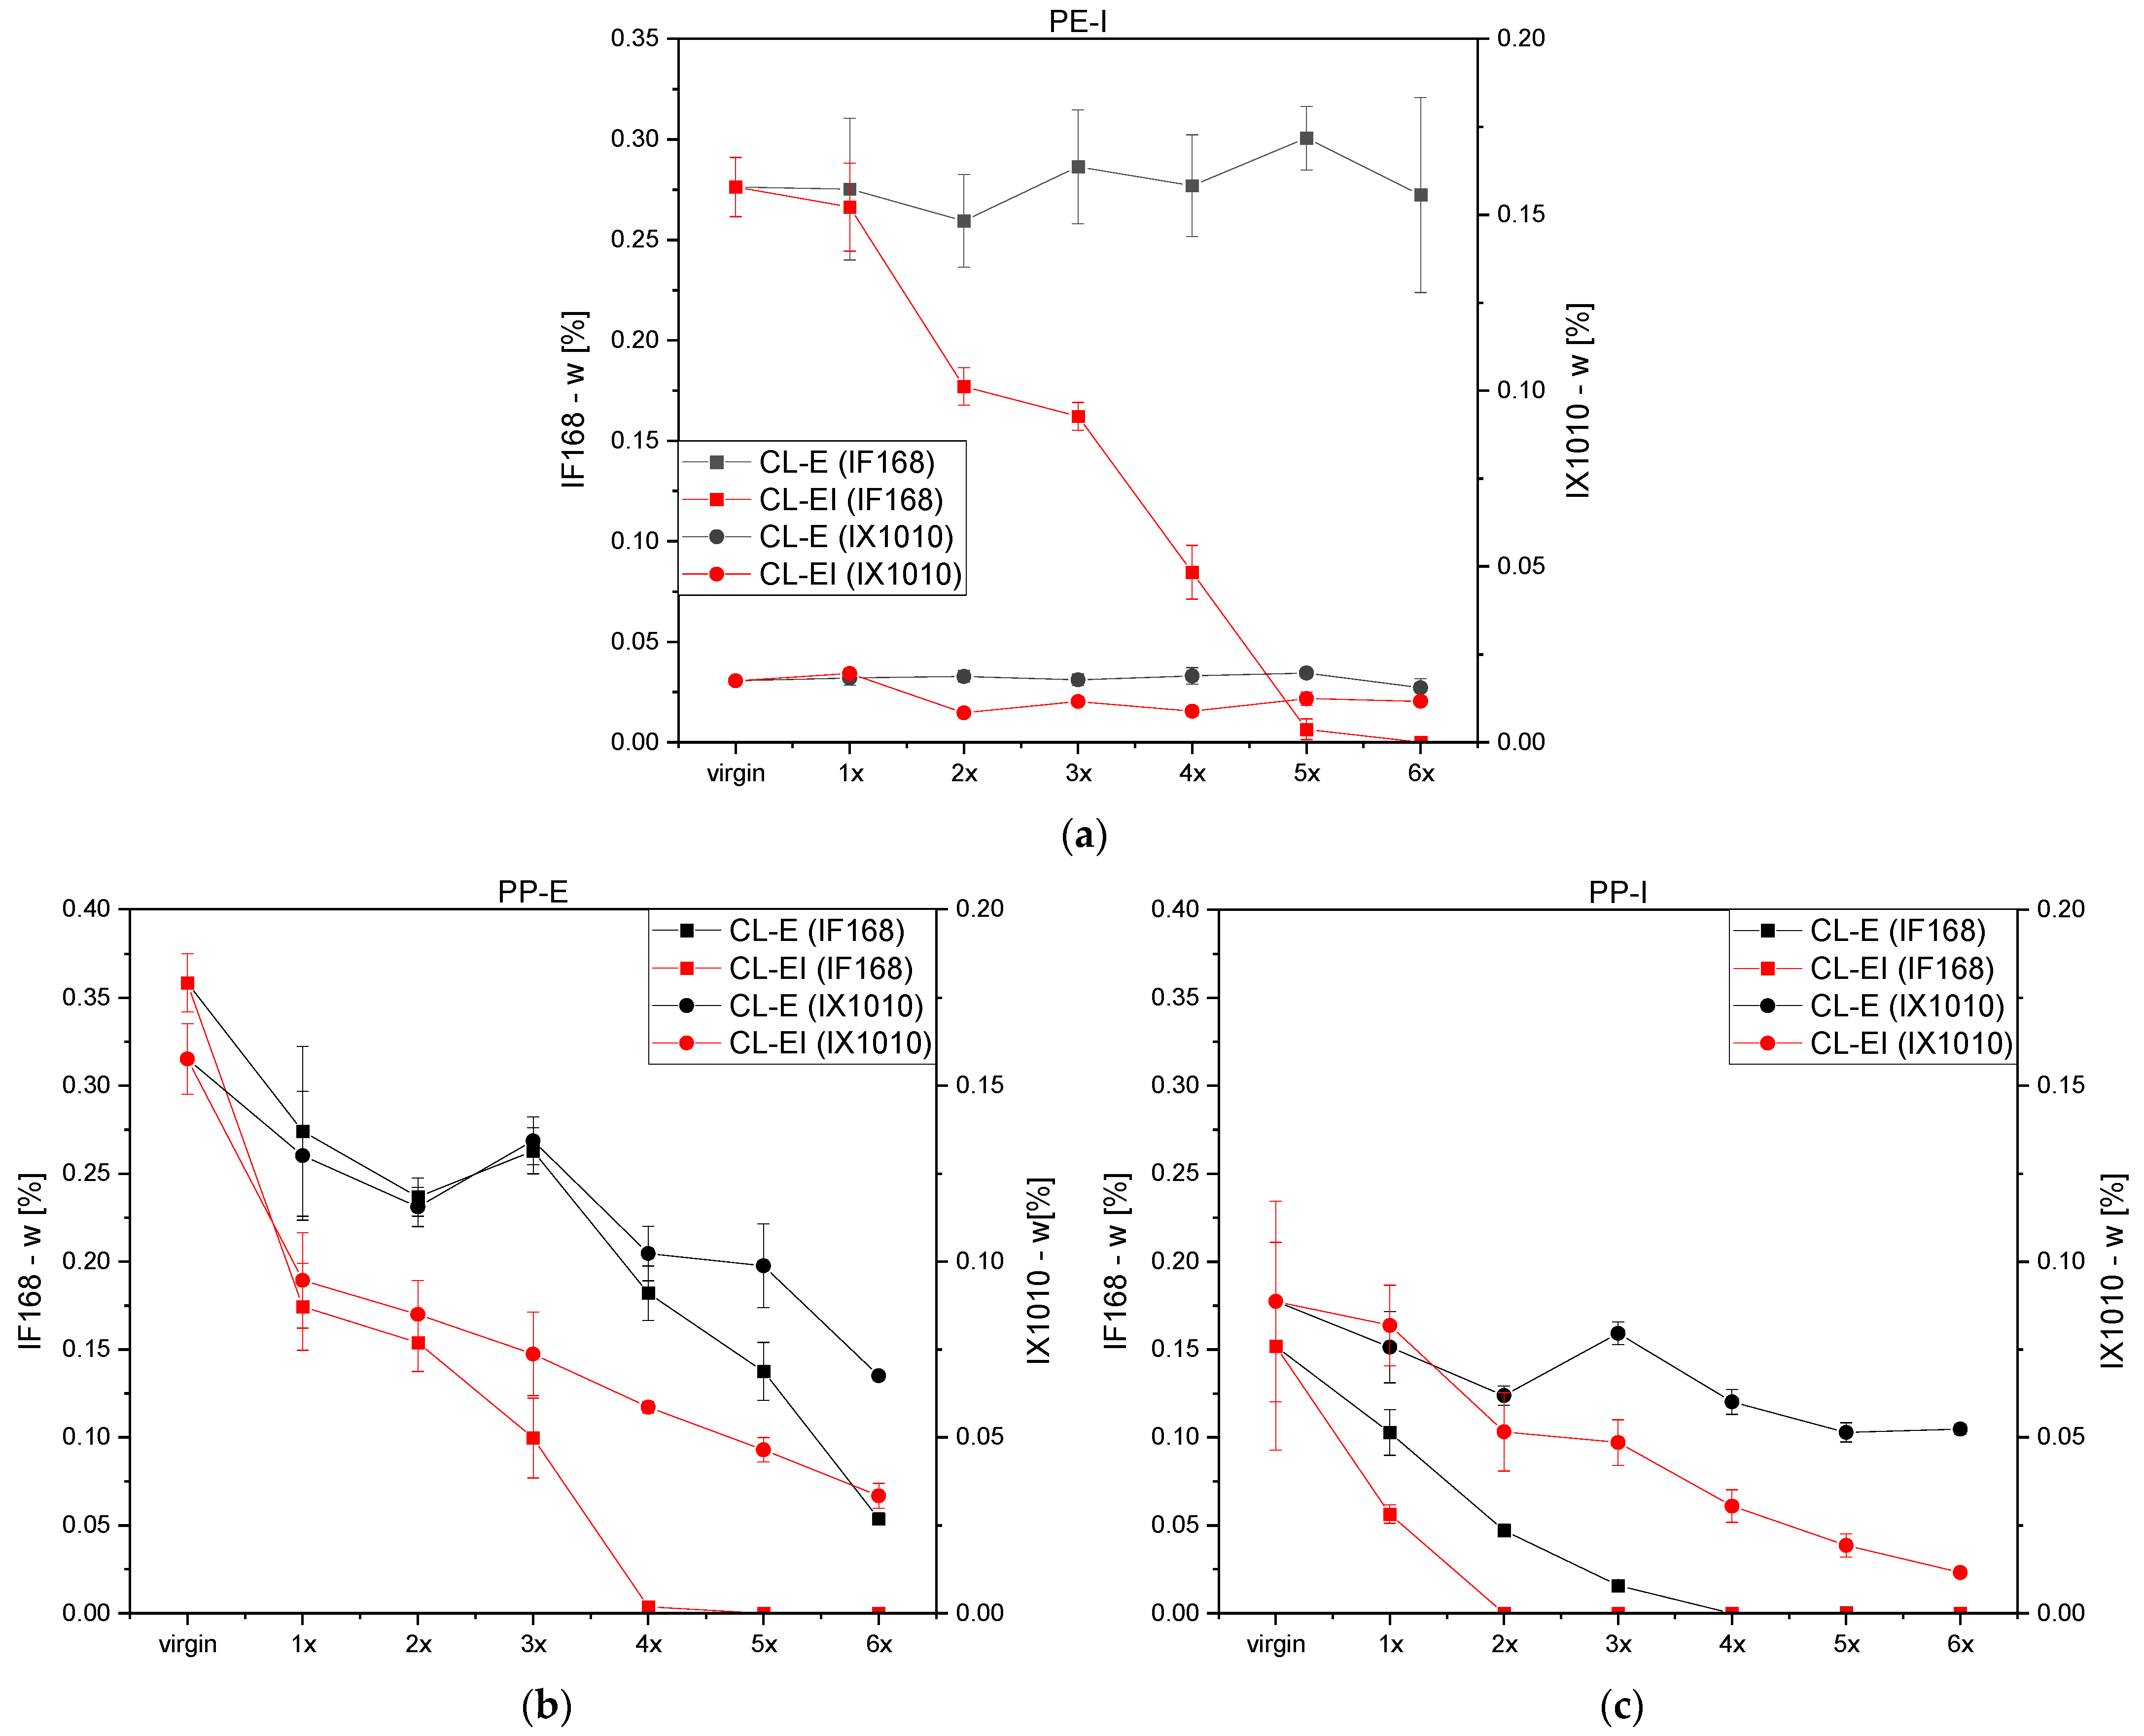
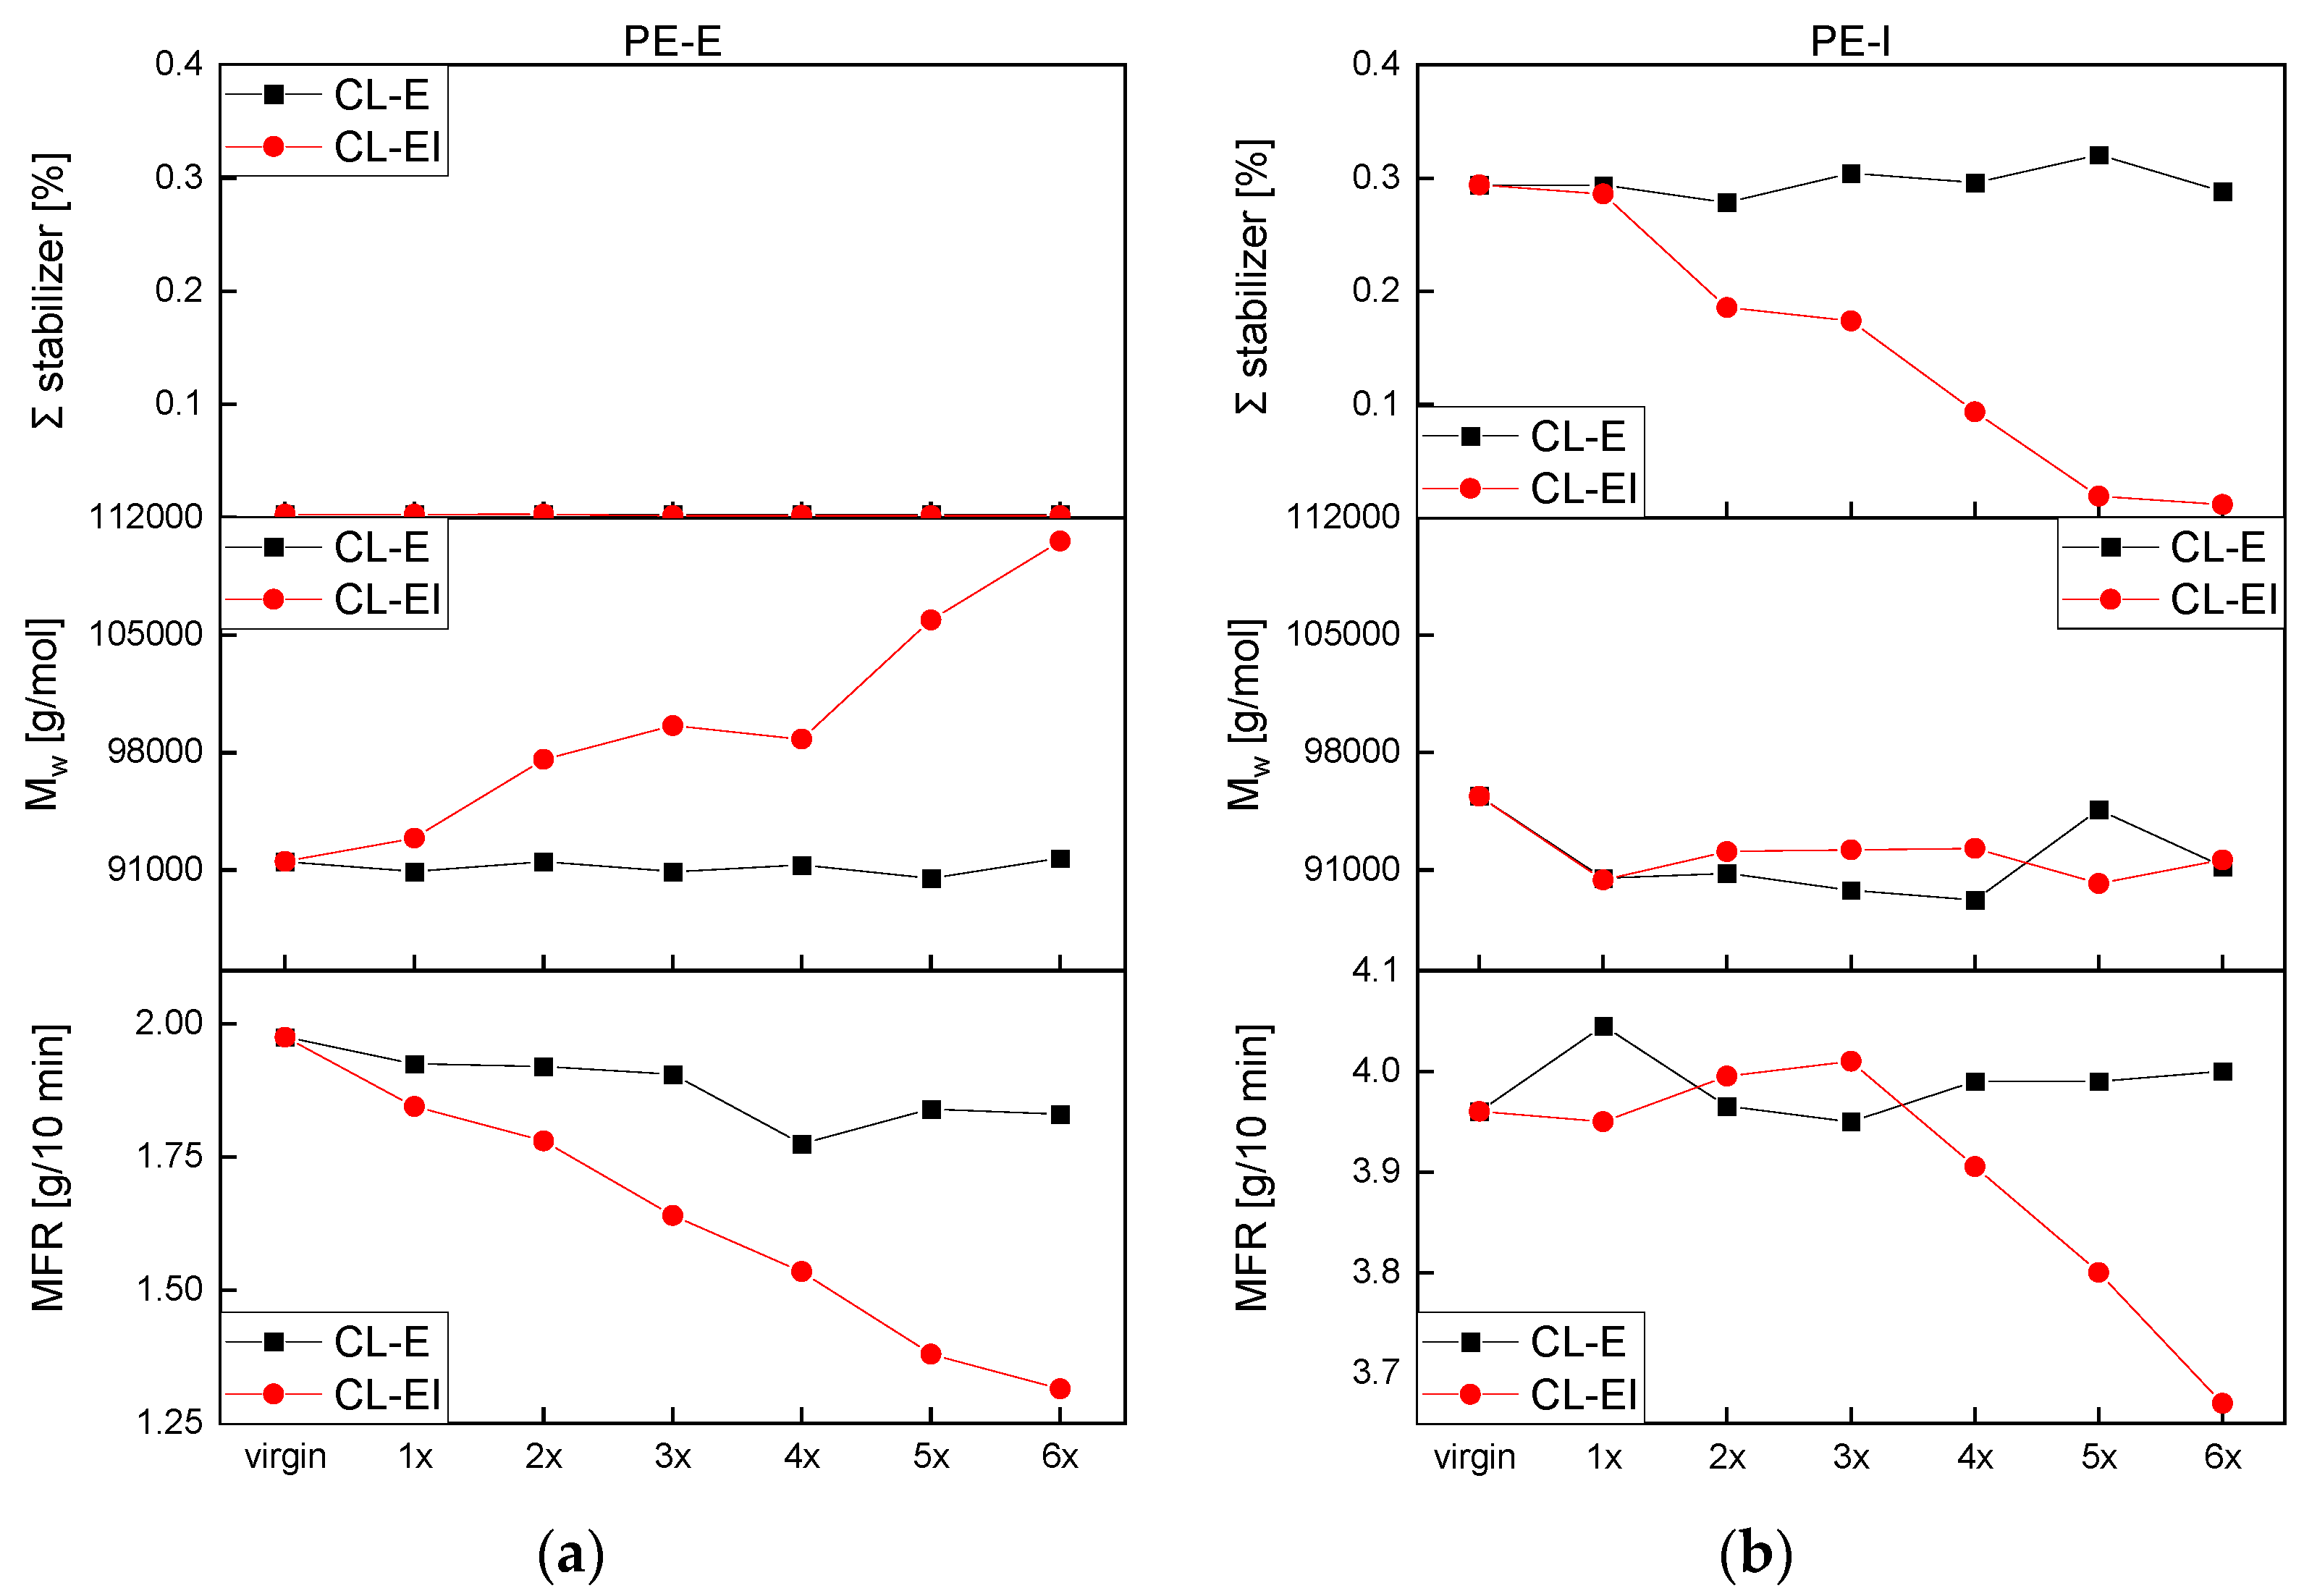
3.1. Consumption of Stabilizers
3.2. Molar Mass Distributions (MMD) and Weight Average Molar Mass (Mw)
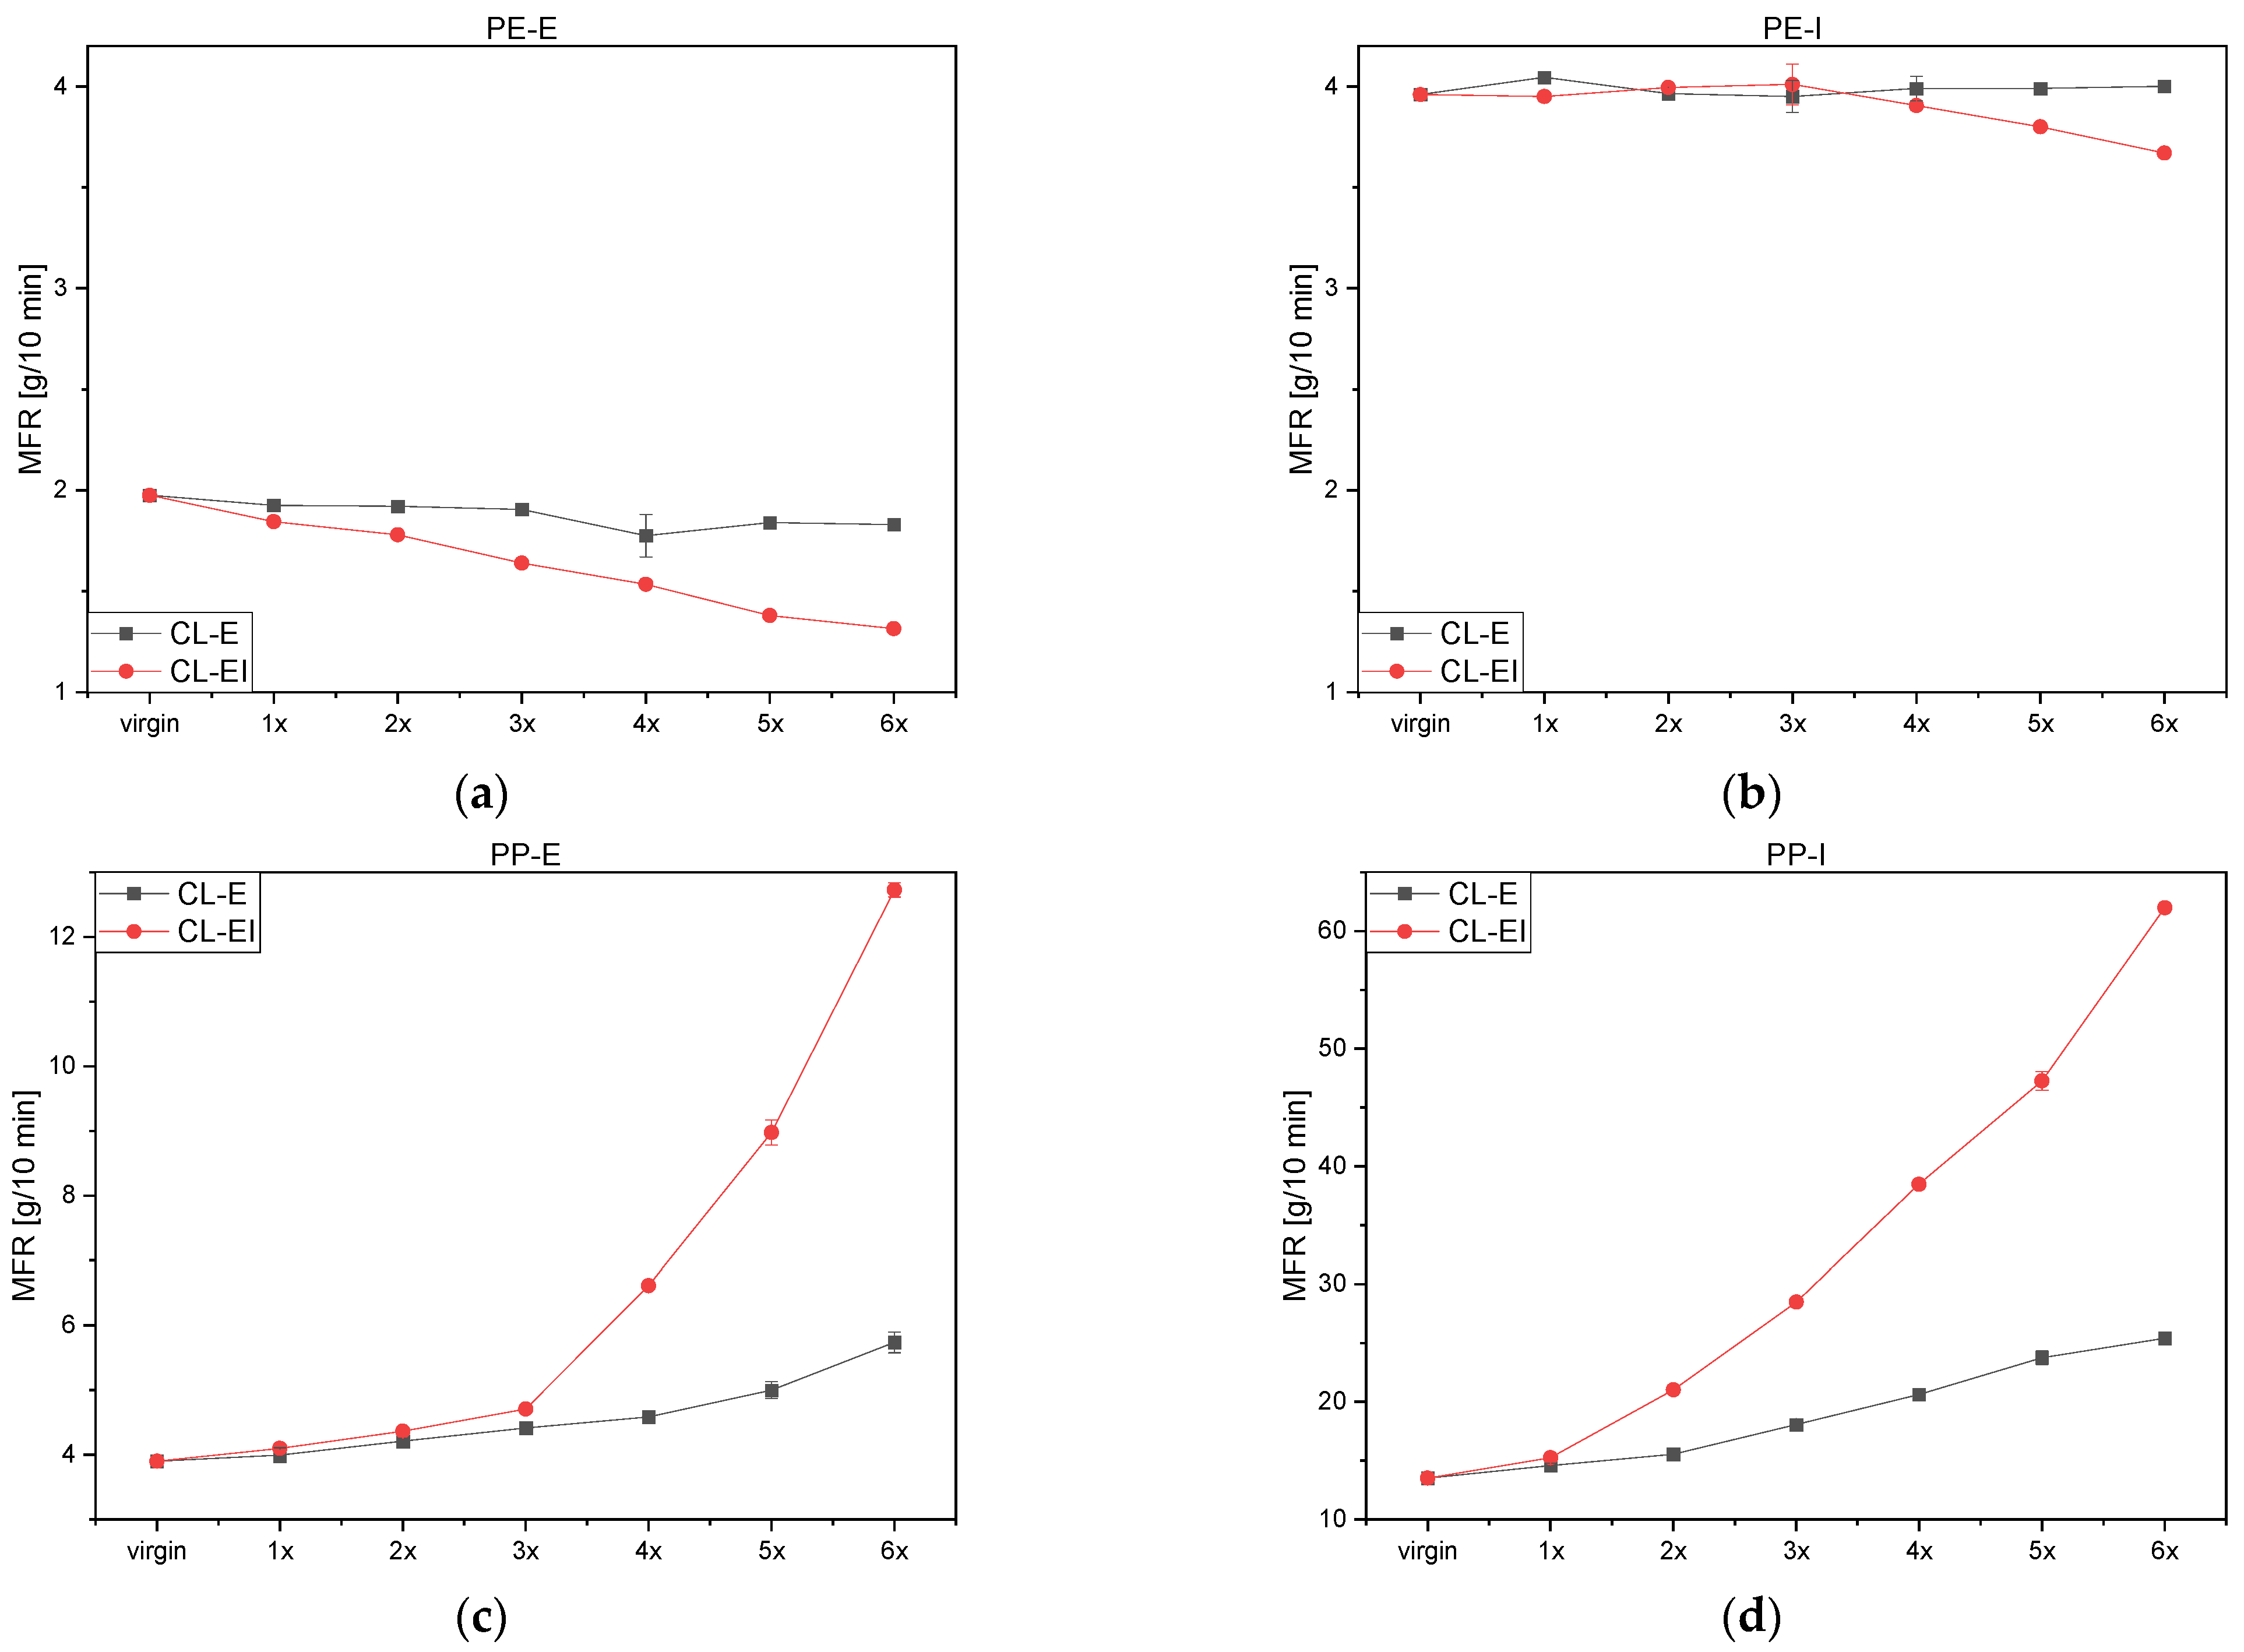
3.3. Melt Flow Rate (MFR)
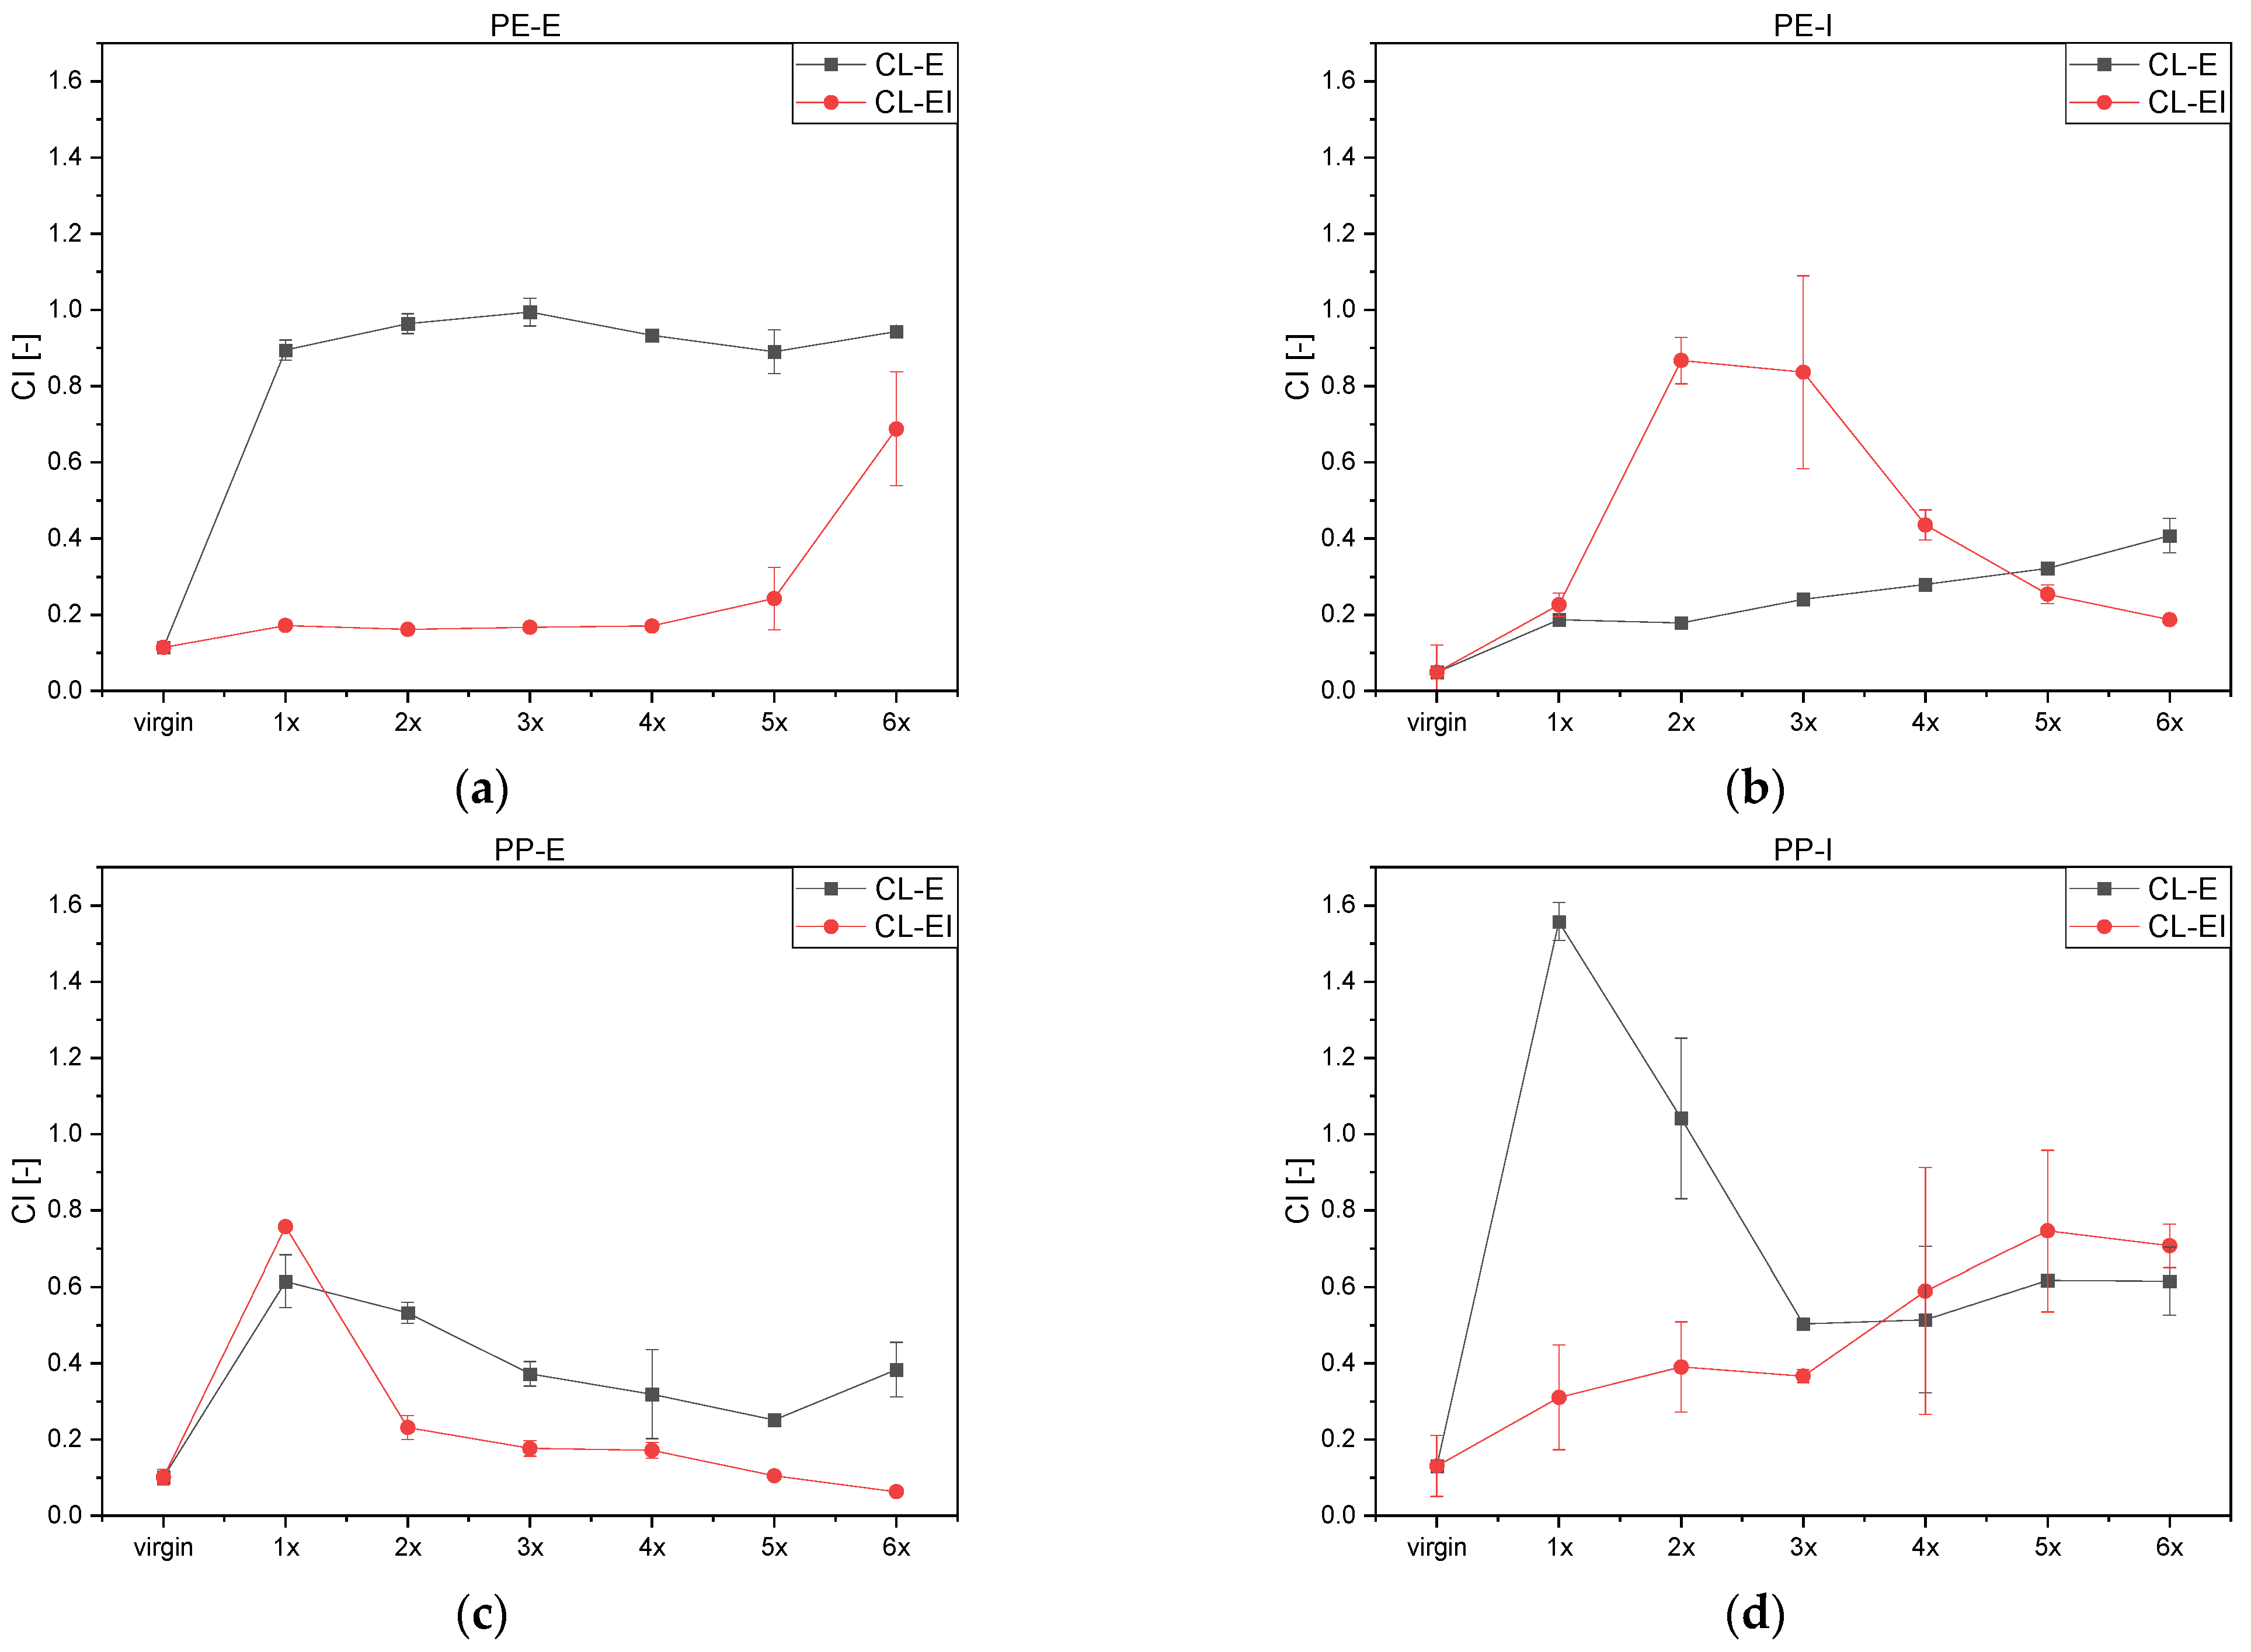
3.4. Infrared Spectra (IR Spectra)
- 3000 and 2840 cm−1: symmetric and antisymmetric stretching vibrations of CH2 groups and
- 1463 cm−1: scissoring vibrations of CH2 groups.
- 3000 to 2840 cm−1: symmetric and antisymmetric stretching vibrations of CH2 and CH3 groups and
- 1459 cm−1 and 1376 cm−1: bending vibrations of CH2 and CH3 groups.
3.5. Melting Behavior and Degree of Crystallinity
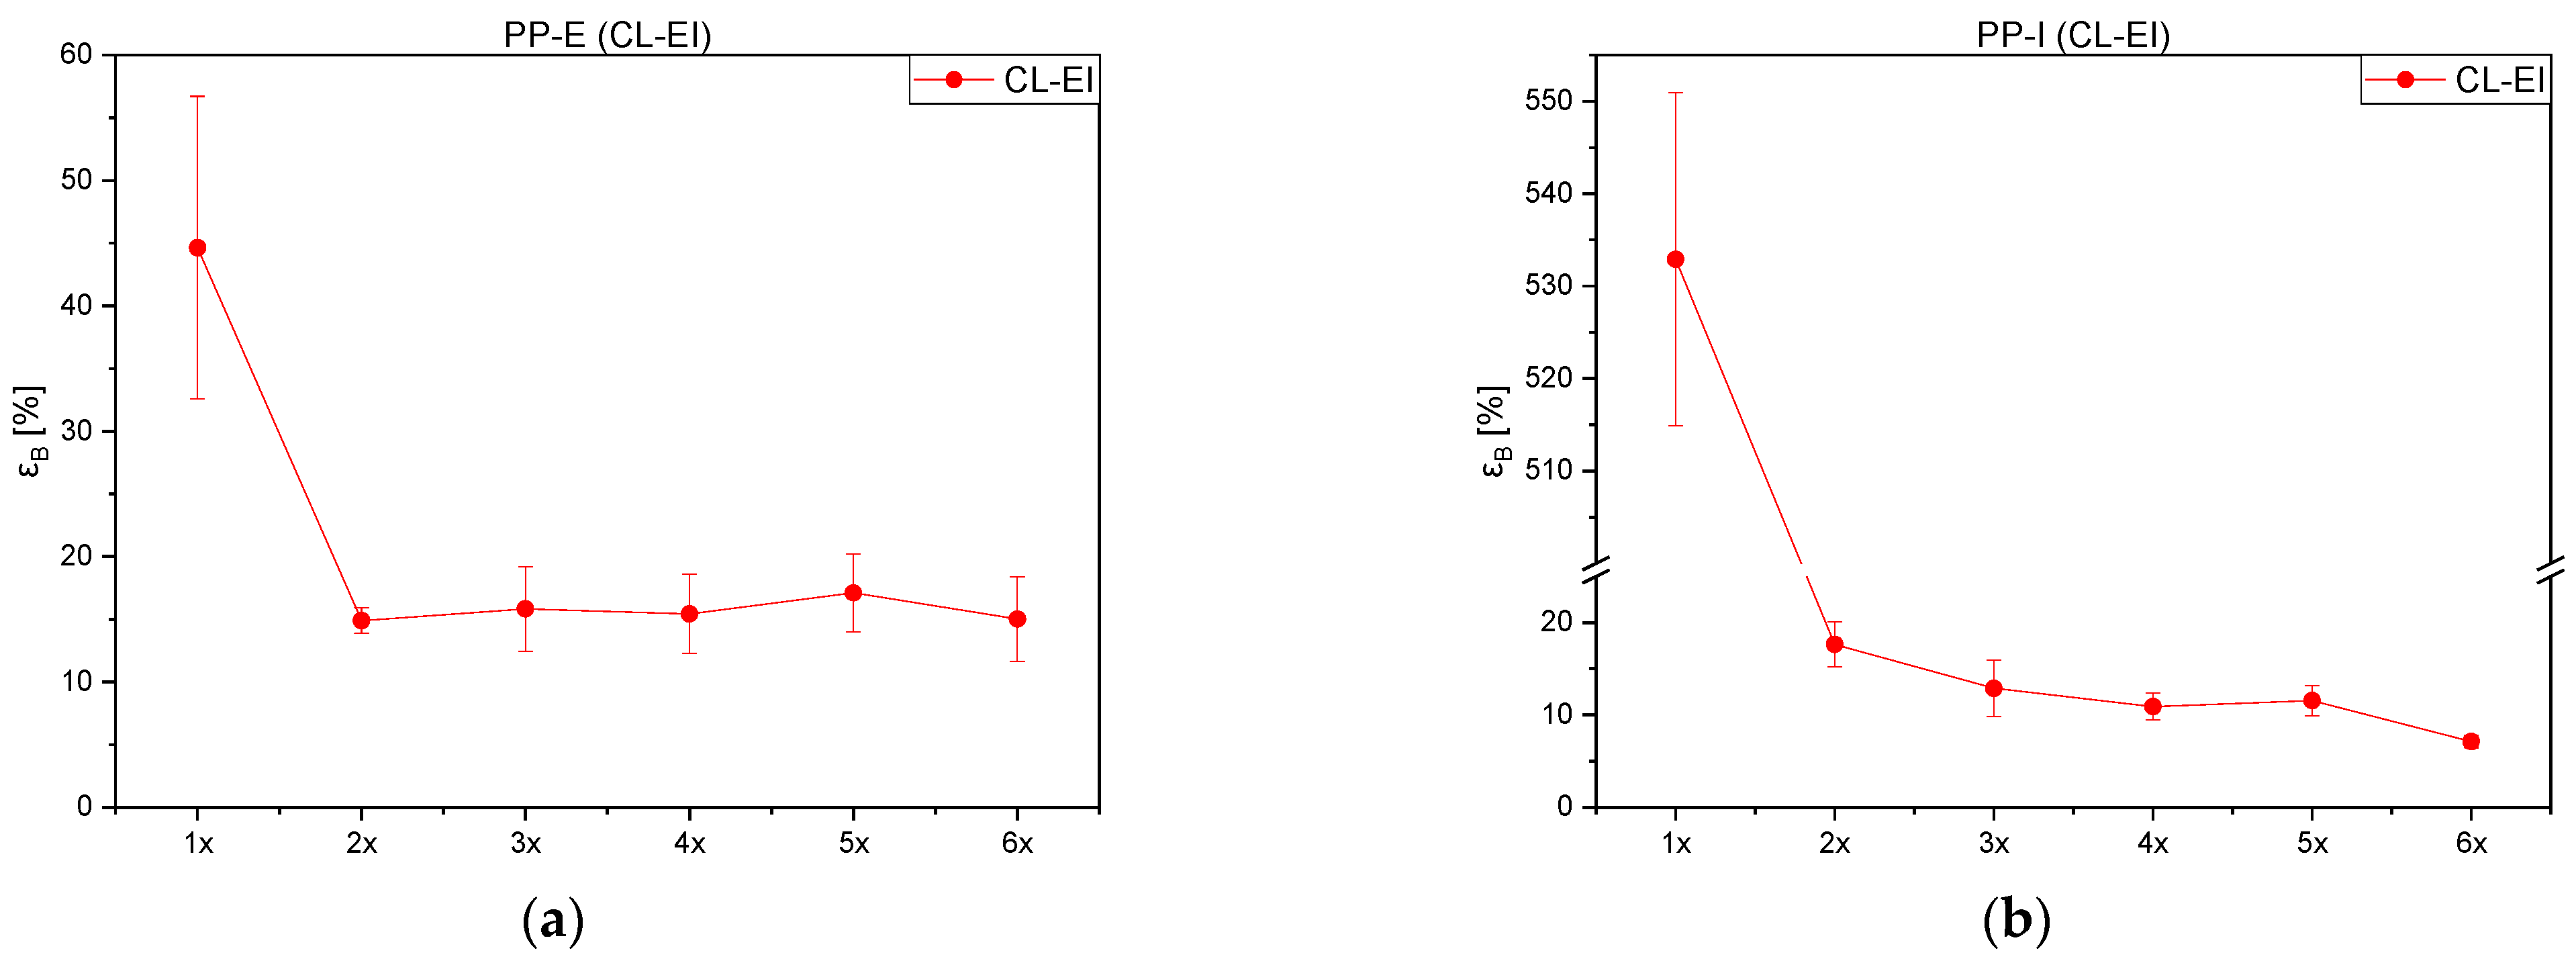
3.6. Mechanical Properties of the CL-EI
4. Discussion
5. Conclusions
Supplementary Materials
Author Contributions
Funding
Institutional Review Board Statement
Informed Consent Statement
Data Availability Statement
Acknowledgments
Conflicts of Interest
References
- Plastics Europe. Plastics-the Facts 2020; Plastics Europe: Brussels, Belgium, 2020. [Google Scholar]
- Statista Research Department. Recycling Rate of Plastic Packaging Waste in the European Union (EU-28) from 2010 to 2018. 5 July 2021. Available online: https://www.statista.com/statistics/881967/plastic-packaging-waste-recycling-eu/ (accessed on 15 November 2021).
- Eurostat. More than 40% of EU Plastic Packaging Waste Recycled. 13 January 2021. Available online: https://ec.europa.eu/eurostat/web/products-eurostat-news/-/ddn-20210113-1 (accessed on 15 November 2021).
- Plastics Recyclers Europe. Report on Platics Recycling Statistics 2020; Plastics Recyclers Europe: Brussels, Belgium, 2020. [Google Scholar]
- Plastics Recyclers Europe. HDPE & PP Market in Europe—State of Play; Plastics Recyclers Europe: Brussels, Belgium, 2020. [Google Scholar]
- United Nations—Department of Economic and Social Affairs. 20 October 2021. Available online: https://sdgs.un.org/#goal_section (accessed on 8 May 2022).
- Rudolph, N.; Kiesel, R.; Aumnate, C. Understanding Plastics Recycling; Carl Hanser Verlag: Munich, Germany, 2017. [Google Scholar]
- Schyns, Z.; Shaver, M. Mechanical recycling of packaging plastics: A review. Macromelcular Rapid Commun. 2021, 42, 2000415. [Google Scholar] [CrossRef] [PubMed]
- Hamad, K.; Kaseem, M.; Deri, F. Recycling of waste from polymer materials: An overview of the recent works. Polym. Degrad. Stabil. 2013, 98, 2801–2812. [Google Scholar] [CrossRef]
- Yin, S.; Tuladhar, R.; Shi, F.; Shanks, R.A.; Combe, M.; Collister, T. Mechanical reprocessing of polyolefin waste: A review. Polym. Eng. Sci. 2015, 55, 2899–2909. [Google Scholar] [CrossRef] [Green Version]
- Soto, J.M.; Blazquez, G.; Calero, M.; Quesada, L.; Godoy, V.; Martin-Lara, M.A. A real case study of mechanical recycling as an alternative for managing of polyethylene plastic film presented in mixed municipal solid waste. J. Clean. Prod. 2018, 203, 777–787. [Google Scholar] [CrossRef]
- Shah, A.A.; Hasan, F.; Hameed, A.; Ahmed, S. Biological degradation of plastics: A comprehensive review. Biotechnol. Adv. 2008, 26, 246–265. [Google Scholar] [CrossRef] [PubMed]
- Domininghaus, H.; Eyerer, P.; Elsner, P.; Hirth, T. Die Kunststoffe und ihre Eigenschaften; Springer: Berlin/Heidelberg, Germany, 2005. [Google Scholar]
- Pinheiro, L.A.; Chinelatto, M.A.; Canevarolo, S.V. The role of chain scission and chain branching in high density polyehtylene dring thermo-mechanical degradation. Polym. Degrad. Stabil. 2004, 86, 445–453. [Google Scholar] [CrossRef]
- Canevarolo, S.V. Chain scission distribution function for polypropylene degradation during multiple extrusions. Polym. Degrad. Stabil. 2000, 70, 71–76. [Google Scholar] [CrossRef]
- Bernardo, C.A.; Cunha, A.M.; Mendes, A.A. Study of the degradation mechanisms of polyethylene during reprocessing. Polym. Degrad. Stabil. 2011, 98, 1125–1133. [Google Scholar]
- La Mantia, F.P. Closed-loop recycling. A case study of films for greenhouses. Polym. Degrad. Stabil. 2010, 95, 285–288. [Google Scholar] [CrossRef]
- Tapper, R.J.; Longana, M.L.; Yu, H.; Hamerton, I.; Potter, K.D. Development of a closed-loop recycling process for discontinuous carbon fibre polypropylene composites. Composites B 2018, 146, 222–231. [Google Scholar] [CrossRef] [Green Version]
- Häußler, M.; Eck, M.; Rothauer, D.; Mecking, S. Closed-loop recycling of polyethylene-like materials. Nature 2021, 590, 423–427. [Google Scholar] [CrossRef] [PubMed]
- Jansson, A.; Möller, K.; Gevert, T. Degradation of post-consumer polypropylene materials exposed to simulated recycling—Mechanical properties. Polym. Degrad. Stabil. 2003, 82, 37–46. [Google Scholar] [CrossRef]
- Oblak, P.; Gonzalez-Gutierrez, J.; Zupancic, B.; Aulova, A.; Emri, I. Mechanical properties of extensively recycled high density polyehtylene (HDPE). Mater. Today Proc. 2016, 3, 1097–1102. [Google Scholar] [CrossRef]
- Jin, H.; Gonzalez-Gutierrez, J.; Oblak, P.; Zupancic, B.; Emri, I. The effect of extensive mechanical recycling on the properties of ow density polyethylene. Polym. Degrad. Stabil. 2012, 97, 2262–2272. [Google Scholar] [CrossRef]
- Schweighuber, A.; Felgel-Farnholz, A.; Bögl, T.; Fischer, J.; Buchberger, W. Investigations on the influence of multiple extrusion on the degradation of polyolefins. Polym. Degrad. Stabil. 2021, 192, 109689. [Google Scholar] [CrossRef]
- ISO 17855-2:2016; ISO/TC 61/SC 9 Thermoplastic Materials. Plastics—Polyethylene (PE) Moulding and Extrusion Materials—Part 2: Preparation of Test Specimens and Determination of Properties. ISO: Geneva, Switzerland, 2016.
- ISO 1133-1:2011; ISO/TC 61/SC 5 Physical-Chemical. Plastics—Determination of The Melt Mass-Flow Rate (MFR) and Melt Volume-Flow Rate (MVR) of Thermoplastics—Part 1: Standard Method. ISO: Geneva, Switzerland, 2011.
- Almond, J.; Sugumaar, P.; Wenzel, M.; Hill, G.; Wallis, C. Determination of the carbonyl index of polyehtylene and polypropylene using specified area under band methodology with ATR-FTIR spectroscopy. E-Polymers 2020, 20, 369–381. [Google Scholar] [CrossRef]
- Ehrenstein, G.W.; Riedel, G.; Trawiel, P. Thermal Analysis of Plastics; Carl Hanser Verlag: Munich, Germany, 2004. [Google Scholar]
- ISO 527-2:2012; ISO/TC 61/SC 2 Mechanical Behavior. Plastics—Determination of Tensile Properties—Part 2: Test Conditions for Moulding and Extrusion Plastics. ISO: Geneva, Switzerland, 2012.
- BASF Schweiz AG. Technical Information—Irgafos 168; BASF Schweiz AG: Basel, Switzerland, 2010. [Google Scholar]
- BASF Corporation. Technical Data Sheet—Irganox 1010; BASF Corporation: Charlotte, NC, USA, 2019. [Google Scholar]
- Baur, E.; Harsch, G.; Moneke, M. Werkstoff-Führer Kunststoffe; Carl Hanser Verlag: München, Germany, 2019. [Google Scholar]
- Verleye, G.A.L.; Roeges, N.P.G.; De Moor, M.O. Easy Identification of Plastics and Rubbers; Rapra Technology Limited: Shropshire, UK, 2001. [Google Scholar]
- Zweifel, H.; Maier, R.D.; Schiller, M. Plastics Additives Handbook; Carl Hanser Verlag: Munich, Germany, 2009. [Google Scholar]
- Fischer, J.; Lang, R.W.; Bradler, P.R.; Freudenthaler, P.J.; Buchberger, W.; Mantell, S.C. Global and local aging and differently stabilized polypropylenes exposed to hot chlorinated water without and with superimposed mechanical environmental loads. Polymers 2019, 11, 1165. [Google Scholar] [CrossRef] [PubMed] [Green Version]


| Characteristic | PE-I | PE-E | PP-I | PP-E |
|---|---|---|---|---|
| Type | Polyethylene high-density Injection molding | Polyethylene low-density Extrusion | Polypropylene homopolymer Injection molding | Polypropylene homopolymer Extrusion |
| MFR|g/10 min | 4 | 1.9 | 12 | 4 |
| Solid density|kg/m3 | 954 | 924 | 905 | n.s. |
| Application | Industrial food transport packaging | Bags, films, flexible packaging, food packaging, liners, pouches | House ware thin wall packaging | Thermoforming packaging |
| Material | FO | Z1 | Z2 | Z3 | AD1 | AD2 |
|---|---|---|---|---|---|---|
| PE-I | 45 °C | 190 °C | 200 °C | 200 °C | 200 °C | 200 °C |
| PE-E | 45 °C | 190 °C | 200 °C | 200 °C | 200 °C | 200 °C |
| PP-I | 45 °C | 190 °C | 220 °C | 220 °C | 220 °C | 220 °C |
| PP-E | 45 °C | 190 °C | 220 °C | 220 °C | 220 °C | 220 °C |
| Material | Die | Z1 | Z2 | Z3 | Z4 | Feed |
|---|---|---|---|---|---|---|
| PE-I | 220 °C | 220 °C | 210 °C | 205 °C | 200 °C | 50 °C |
| PE-E | 220 °C | 220 °C | 210 °C | 205 °C | 200 °C | 50 °C |
| PP-I | 230 °C | 230 °C | 225 °C | 220 °C | 210 °C | 50 °C |
| PP-E | 230 °C | 230 °C | 225 °C | 220 °C | 210 °C | 50 °C |
| Parameter | Nominal-Values |
|---|---|
| Clamp force|kN | 500 |
| Back pressure|bar | 450 |
| Dosage volume|cm3 | 55 |
| Cycle time|s | 100 |
| Cooling time|s | 20 |
| Back pressure time|s | 15 |
Publisher’s Note: MDPI stays neutral with regard to jurisdictional claims in published maps and institutional affiliations. |
© 2022 by the authors. Licensee MDPI, Basel, Switzerland. This article is an open access article distributed under the terms and conditions of the Creative Commons Attribution (CC BY) license (https://creativecommons.org/licenses/by/4.0/).
Share and Cite
Langwieser, J.; Schweighuber, A.; Felgel-Farnholz, A.; Marschik, C.; Buchberger, W.; Fischer, J. Determination of the Influence of Multiple Closed Recycling Loops on the Property Profile of Different Polyolefins. Polymers 2022, 14, 2429. https://doi.org/10.3390/polym14122429
Langwieser J, Schweighuber A, Felgel-Farnholz A, Marschik C, Buchberger W, Fischer J. Determination of the Influence of Multiple Closed Recycling Loops on the Property Profile of Different Polyolefins. Polymers. 2022; 14(12):2429. https://doi.org/10.3390/polym14122429
Chicago/Turabian StyleLangwieser, Johanna, Andrea Schweighuber, Alexander Felgel-Farnholz, Christian Marschik, Wolfgang Buchberger, and Joerg Fischer. 2022. "Determination of the Influence of Multiple Closed Recycling Loops on the Property Profile of Different Polyolefins" Polymers 14, no. 12: 2429. https://doi.org/10.3390/polym14122429