
Partial Replacement of Municipal Incinerated Bottom Ash and PET Pellets as Fine Aggregate in Cement Mortars

Abstract
:1. Introduction
2. Materials and Methods
2.1. Raw Materials
2.2. Production of Mortar Specimens
3. Results and Discussion
3.1. Raw Materials
3.1.1. Fine Aggregate Properties
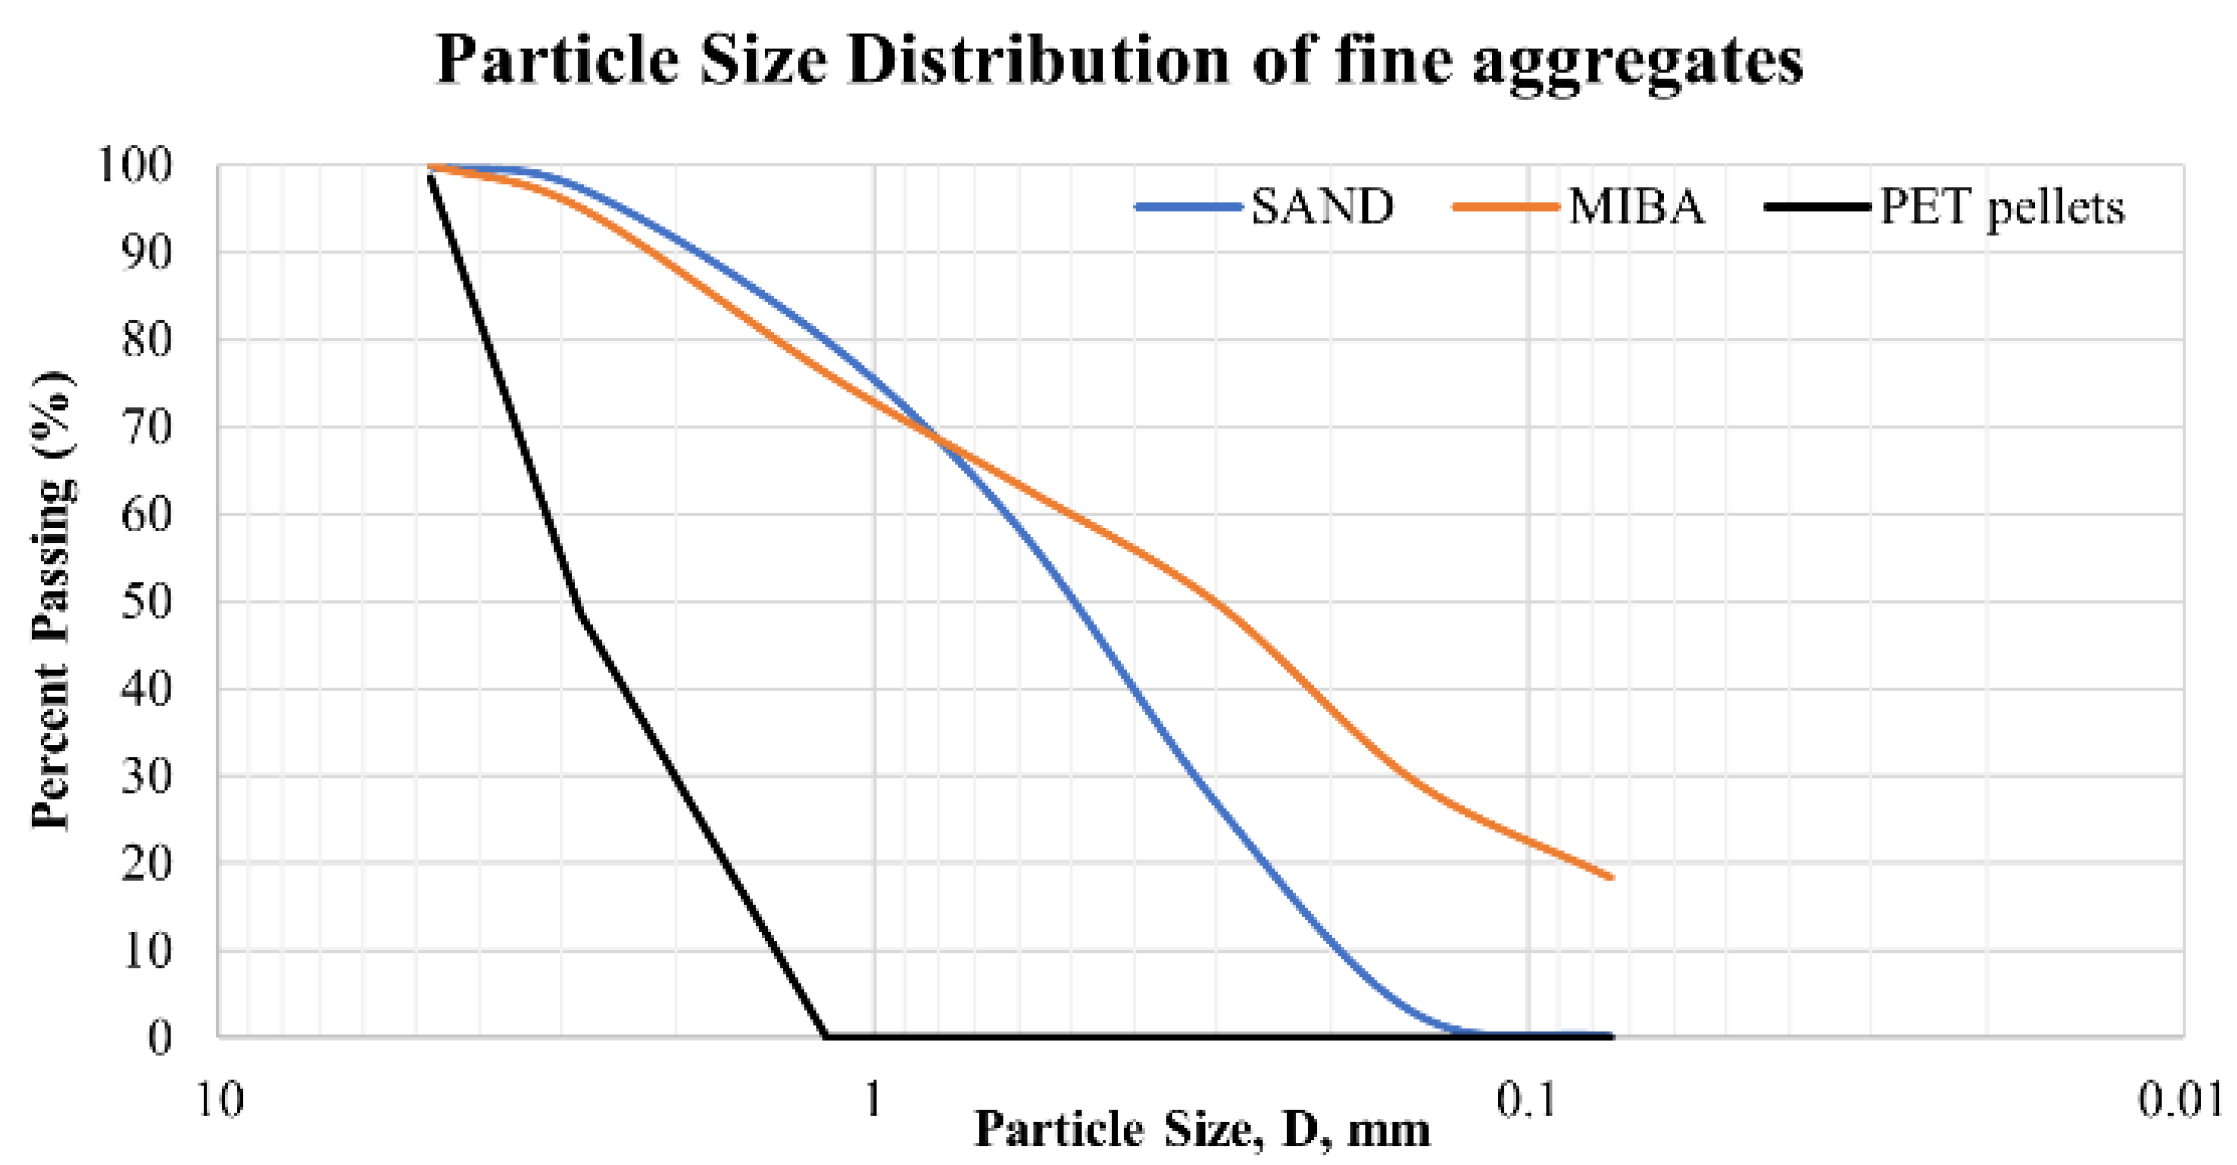
- Particle Size Distribution
- 2.
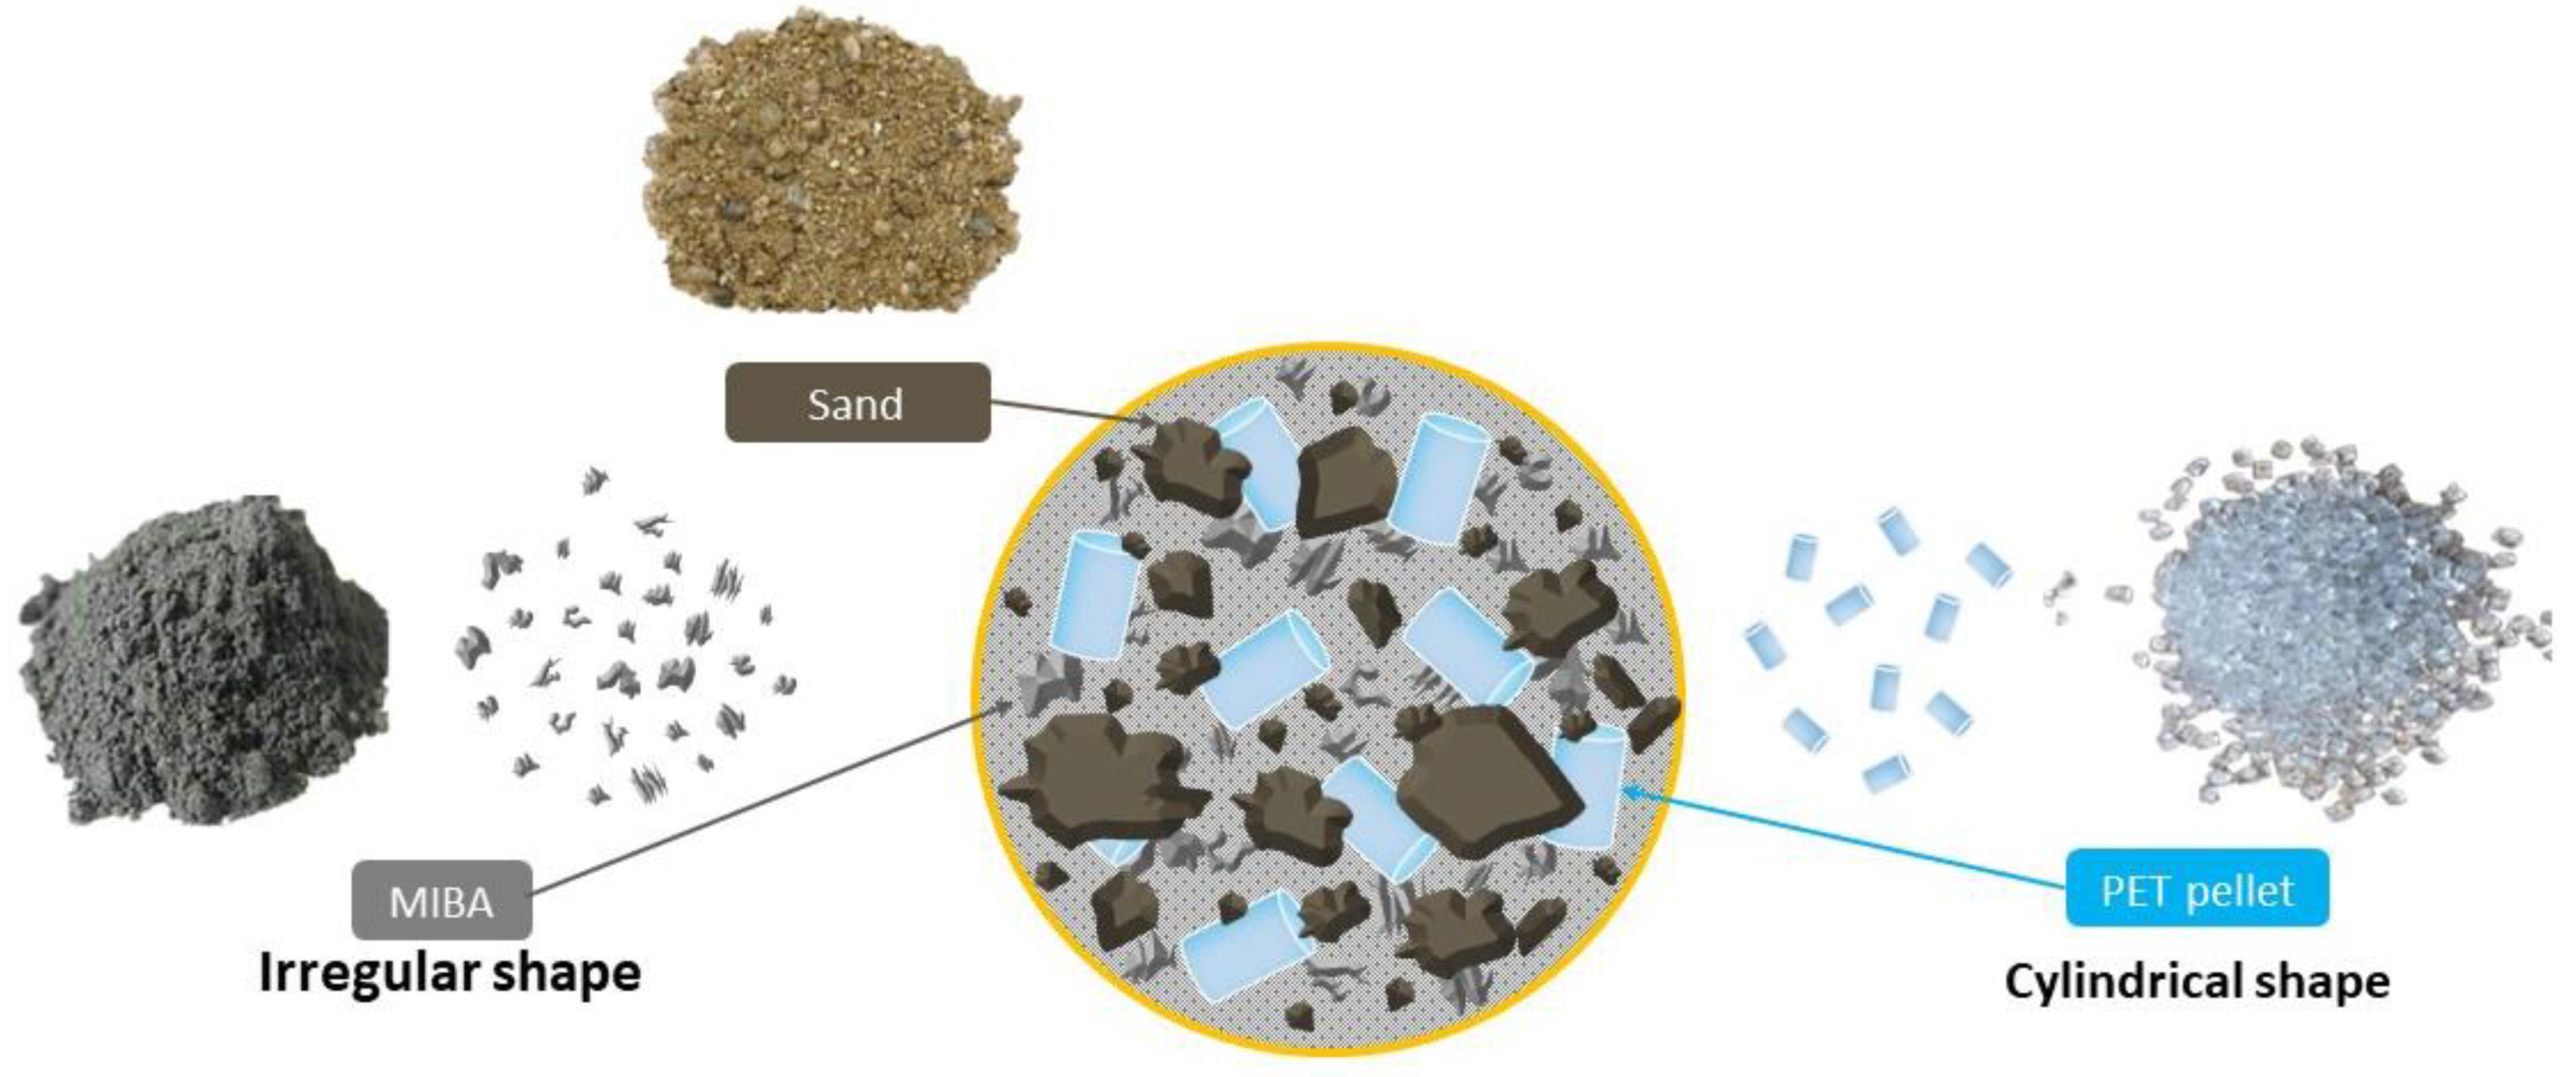
- Shape and Surface Texture
- 3.
- Fineness Modulus
- 4.
- Characteristics of Fine Aggregates
3.1.2. Chemical Composition
- 5.
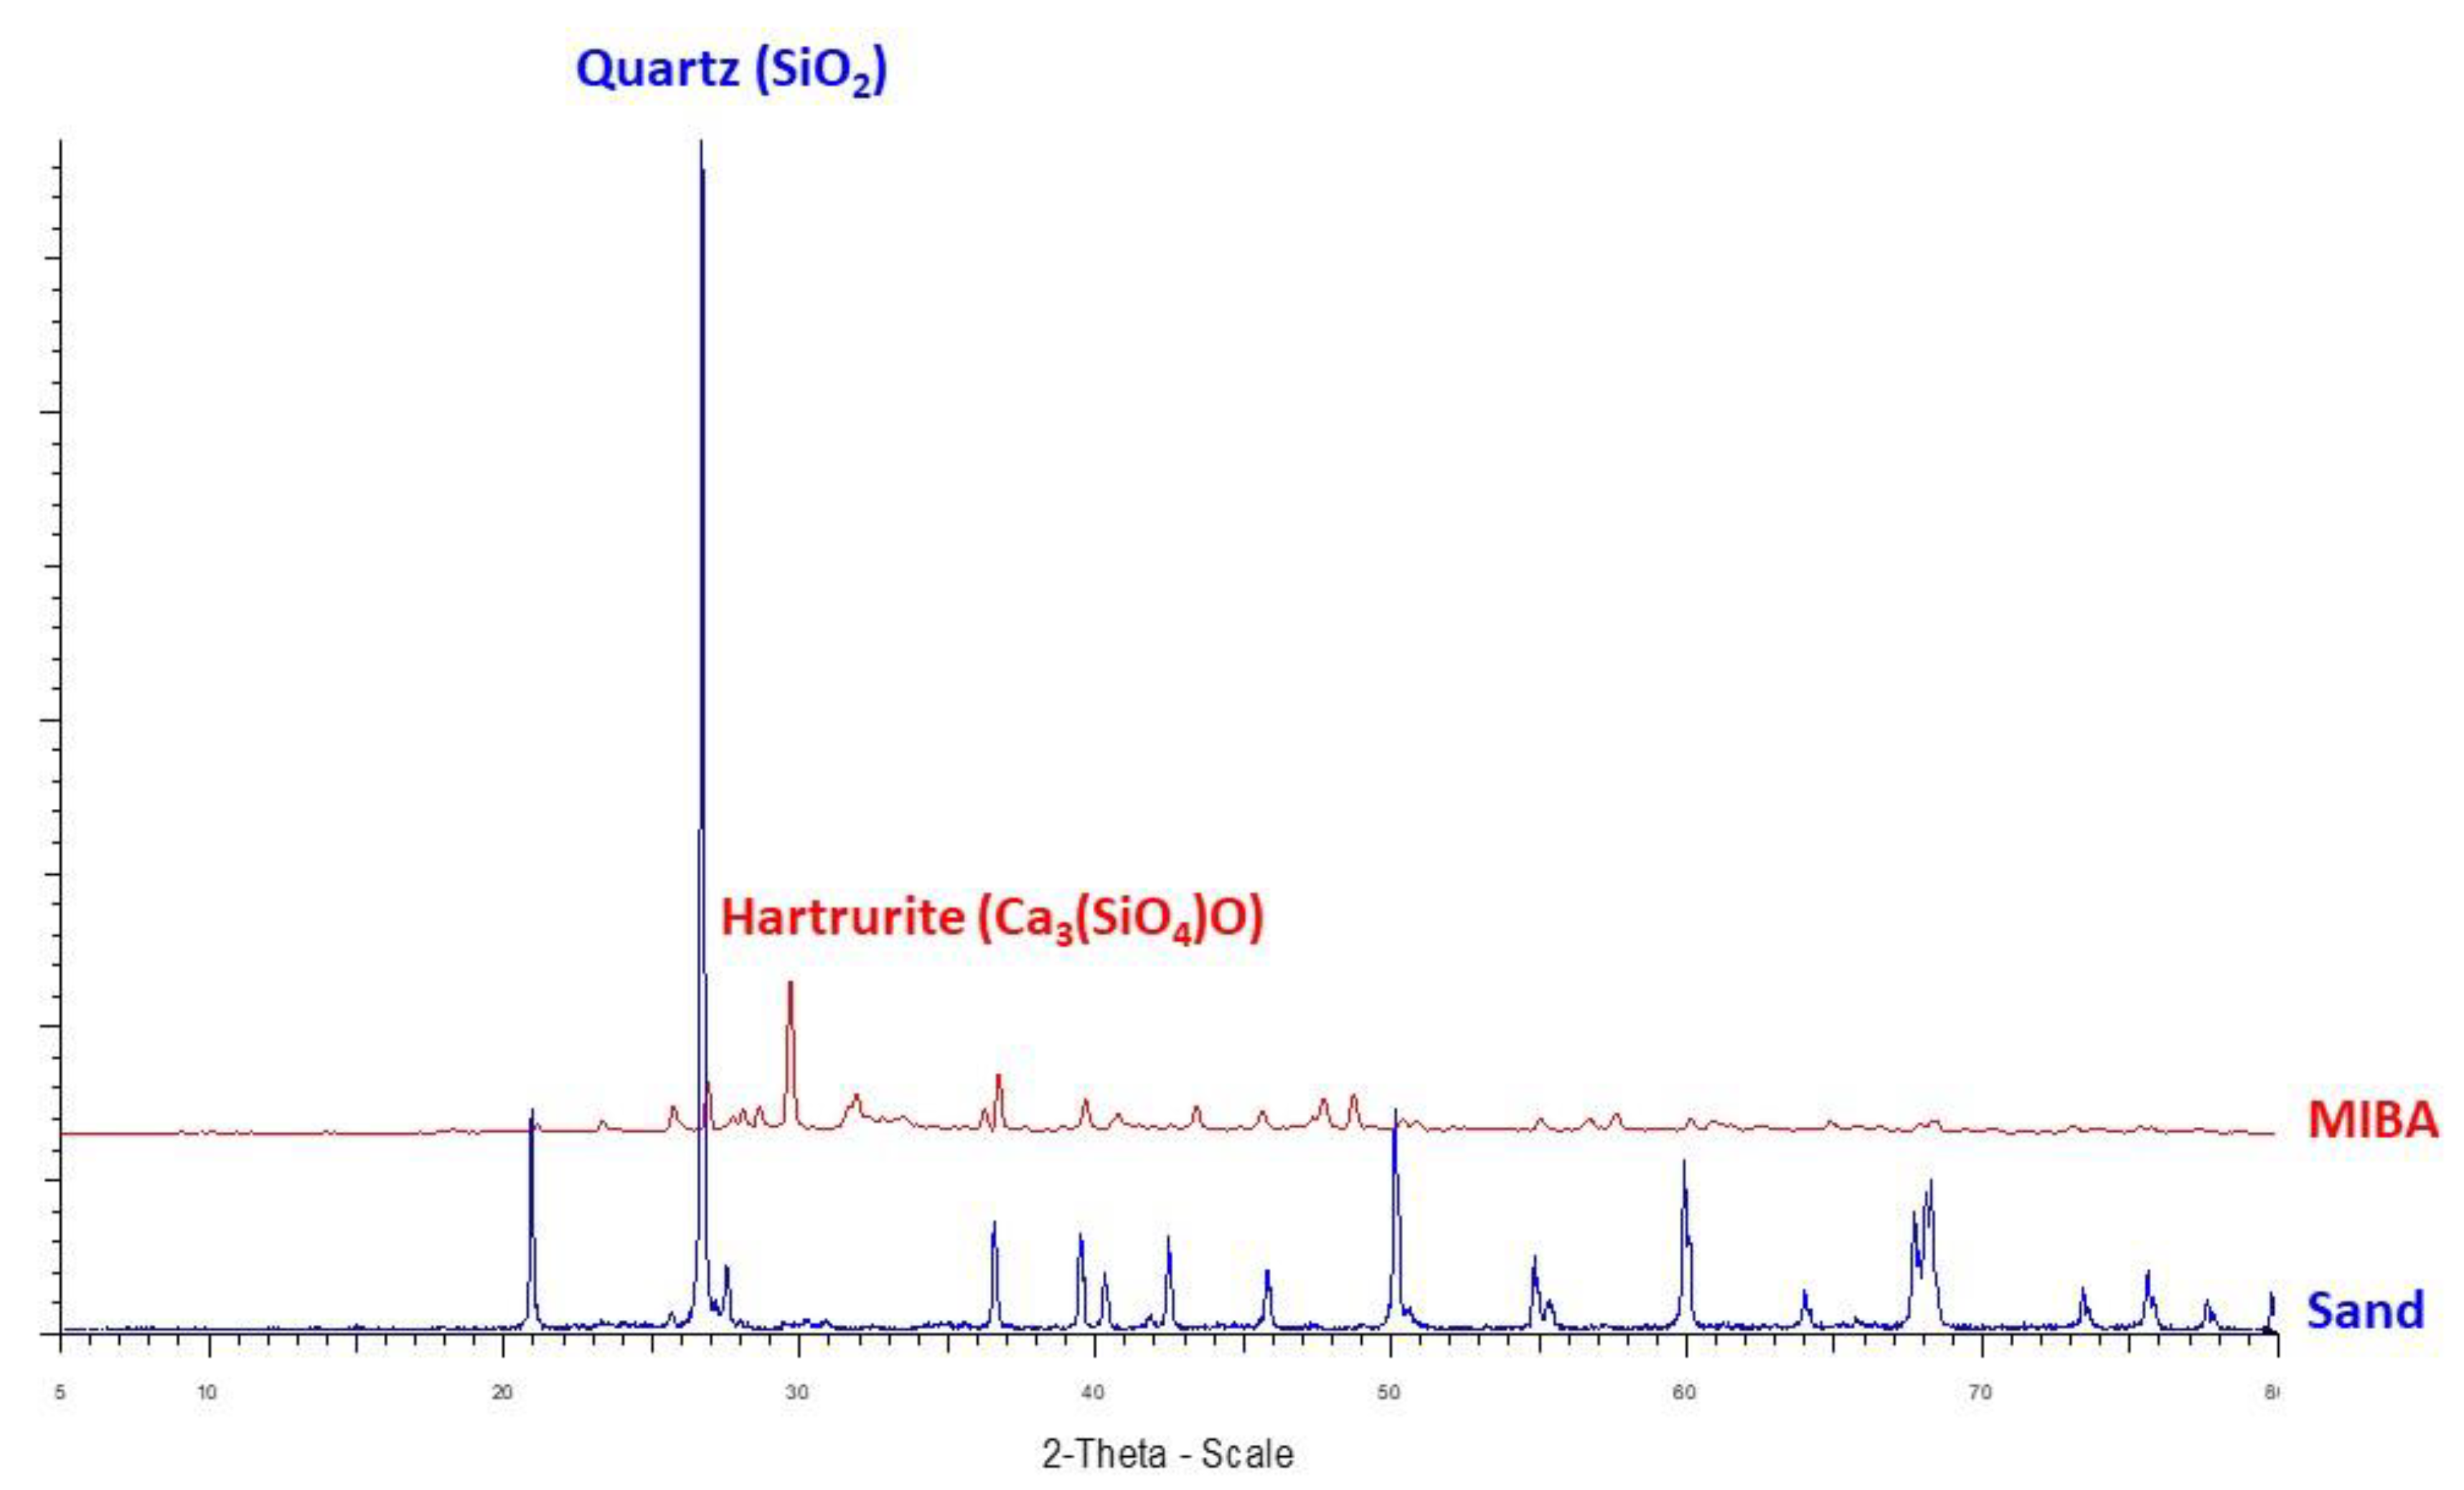
- Mineral Phases
- 6.
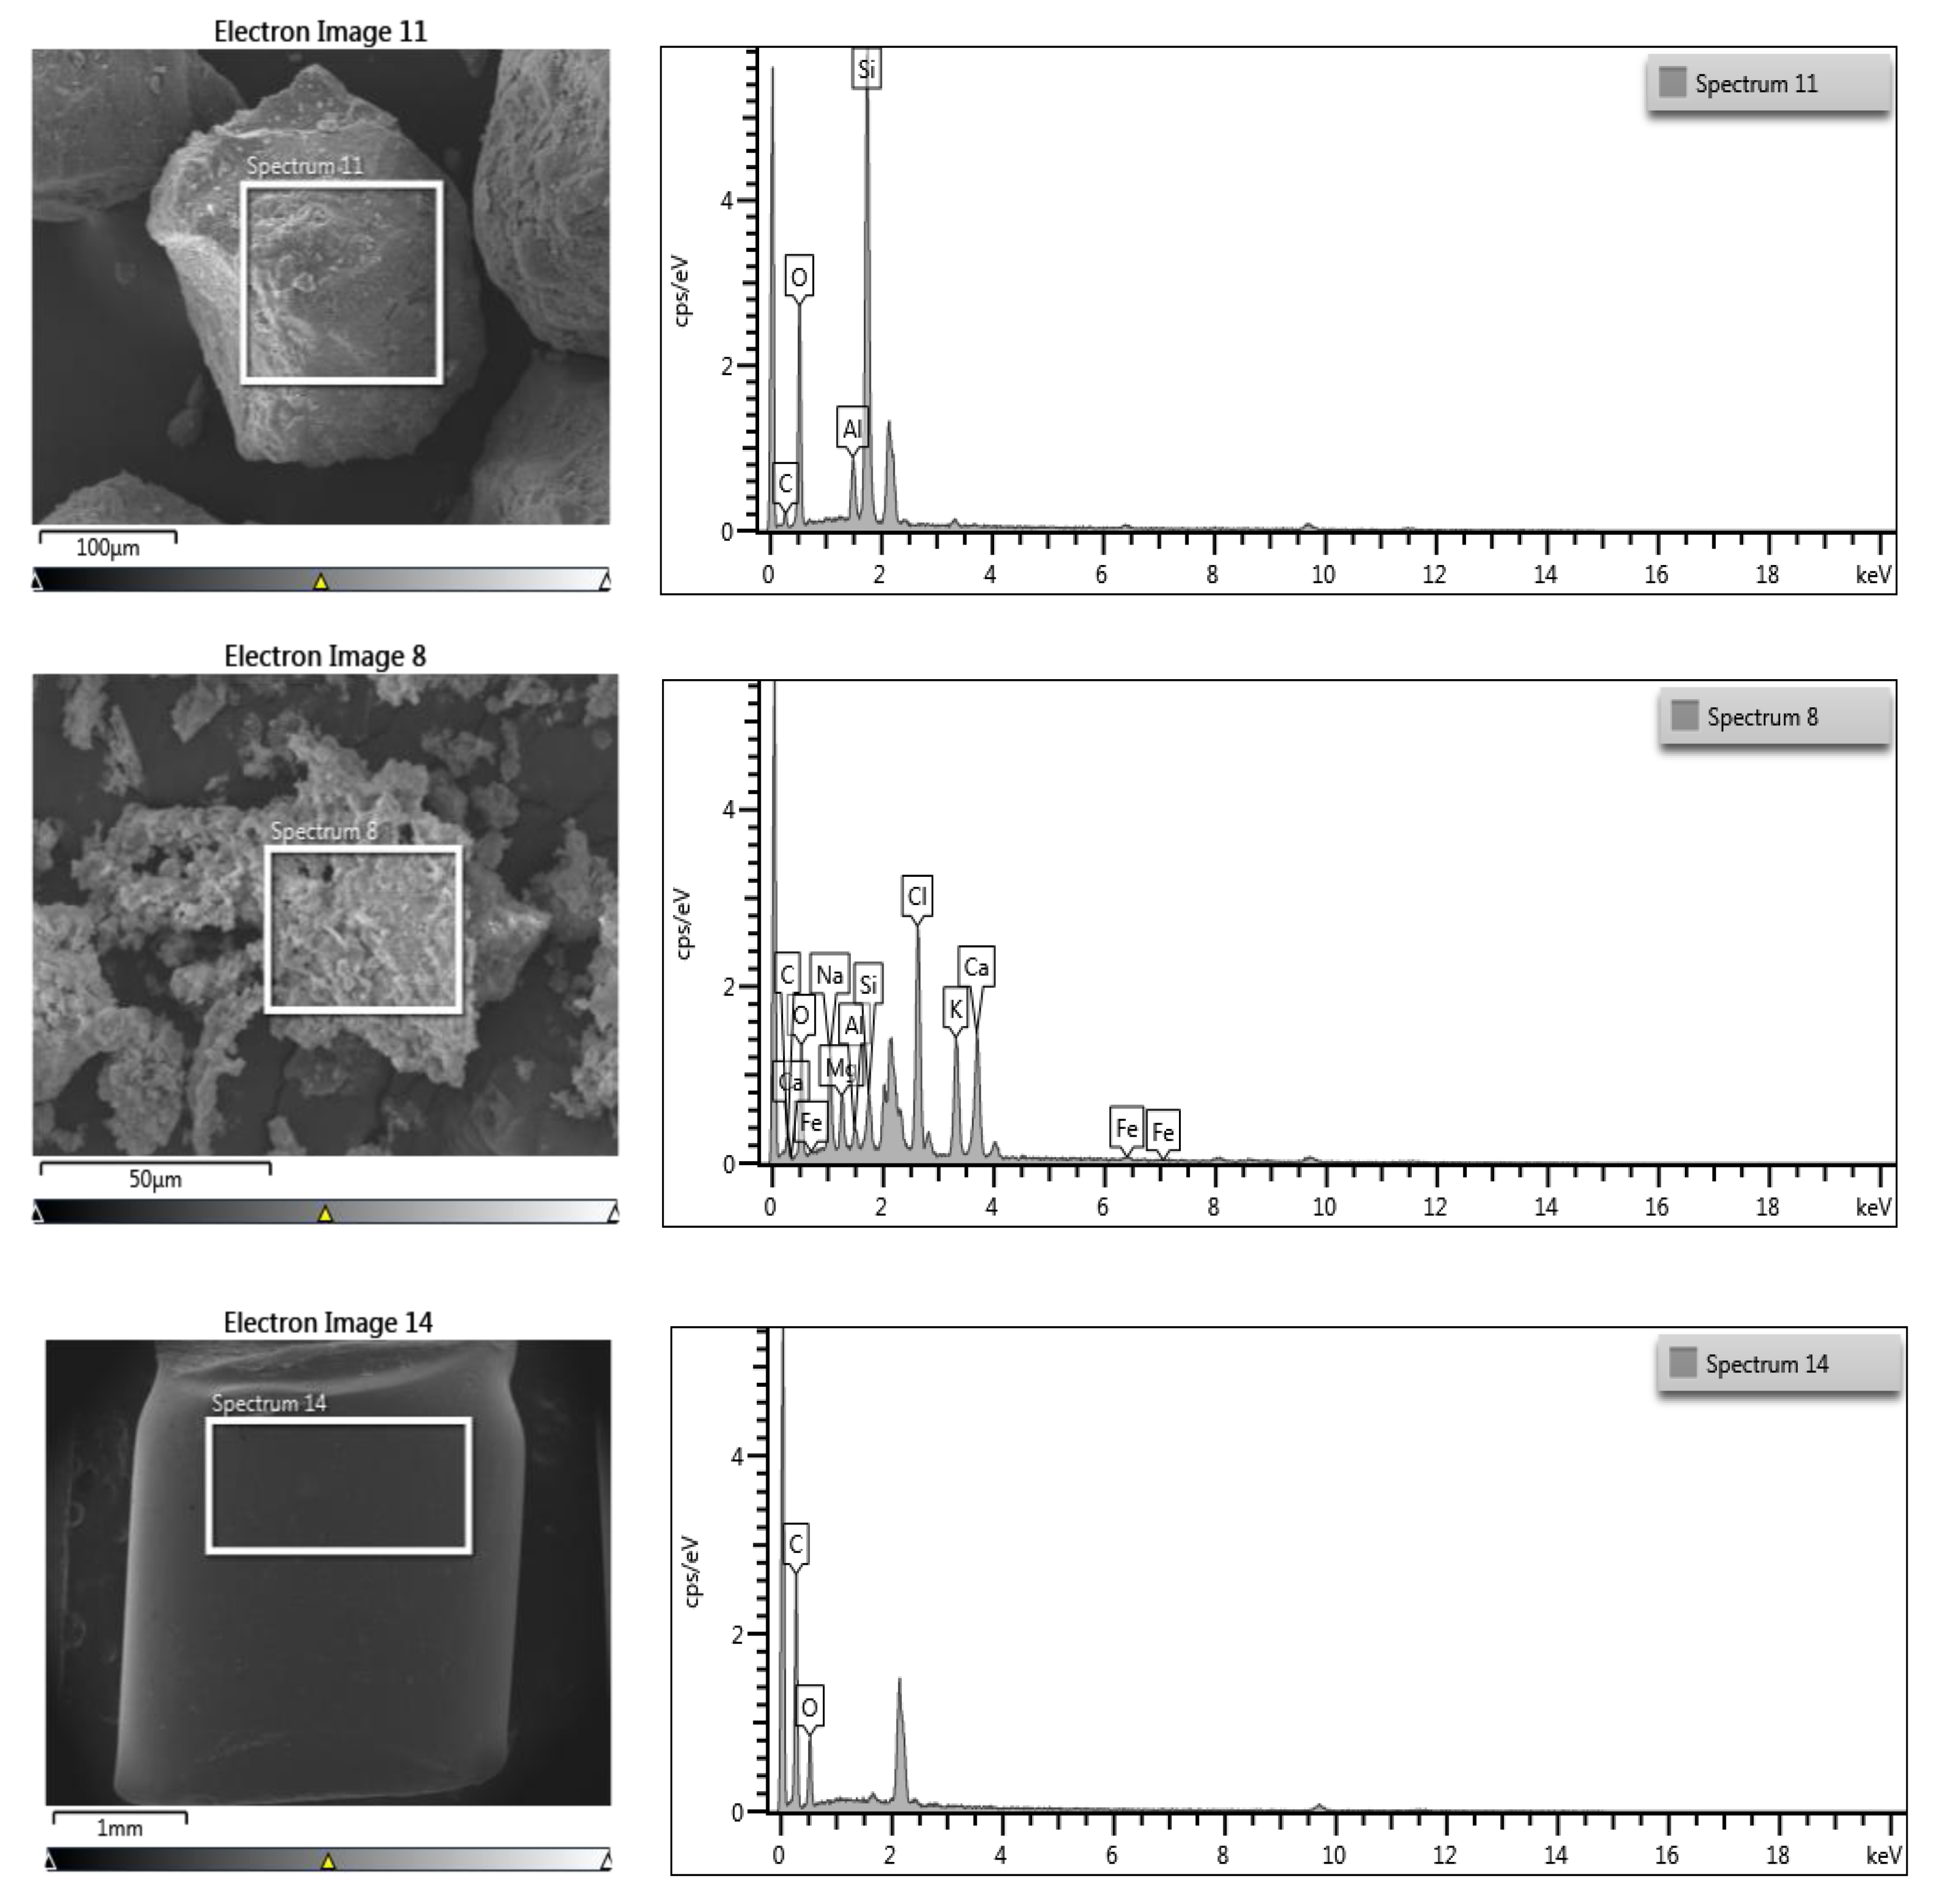
- Microstructure and Elemental Composition of Raw Materials
- 7.
- Leaching of Heavy Metals from MIBA
3.2. Mortar Specimens
Physical Properties of Mortar Specimens
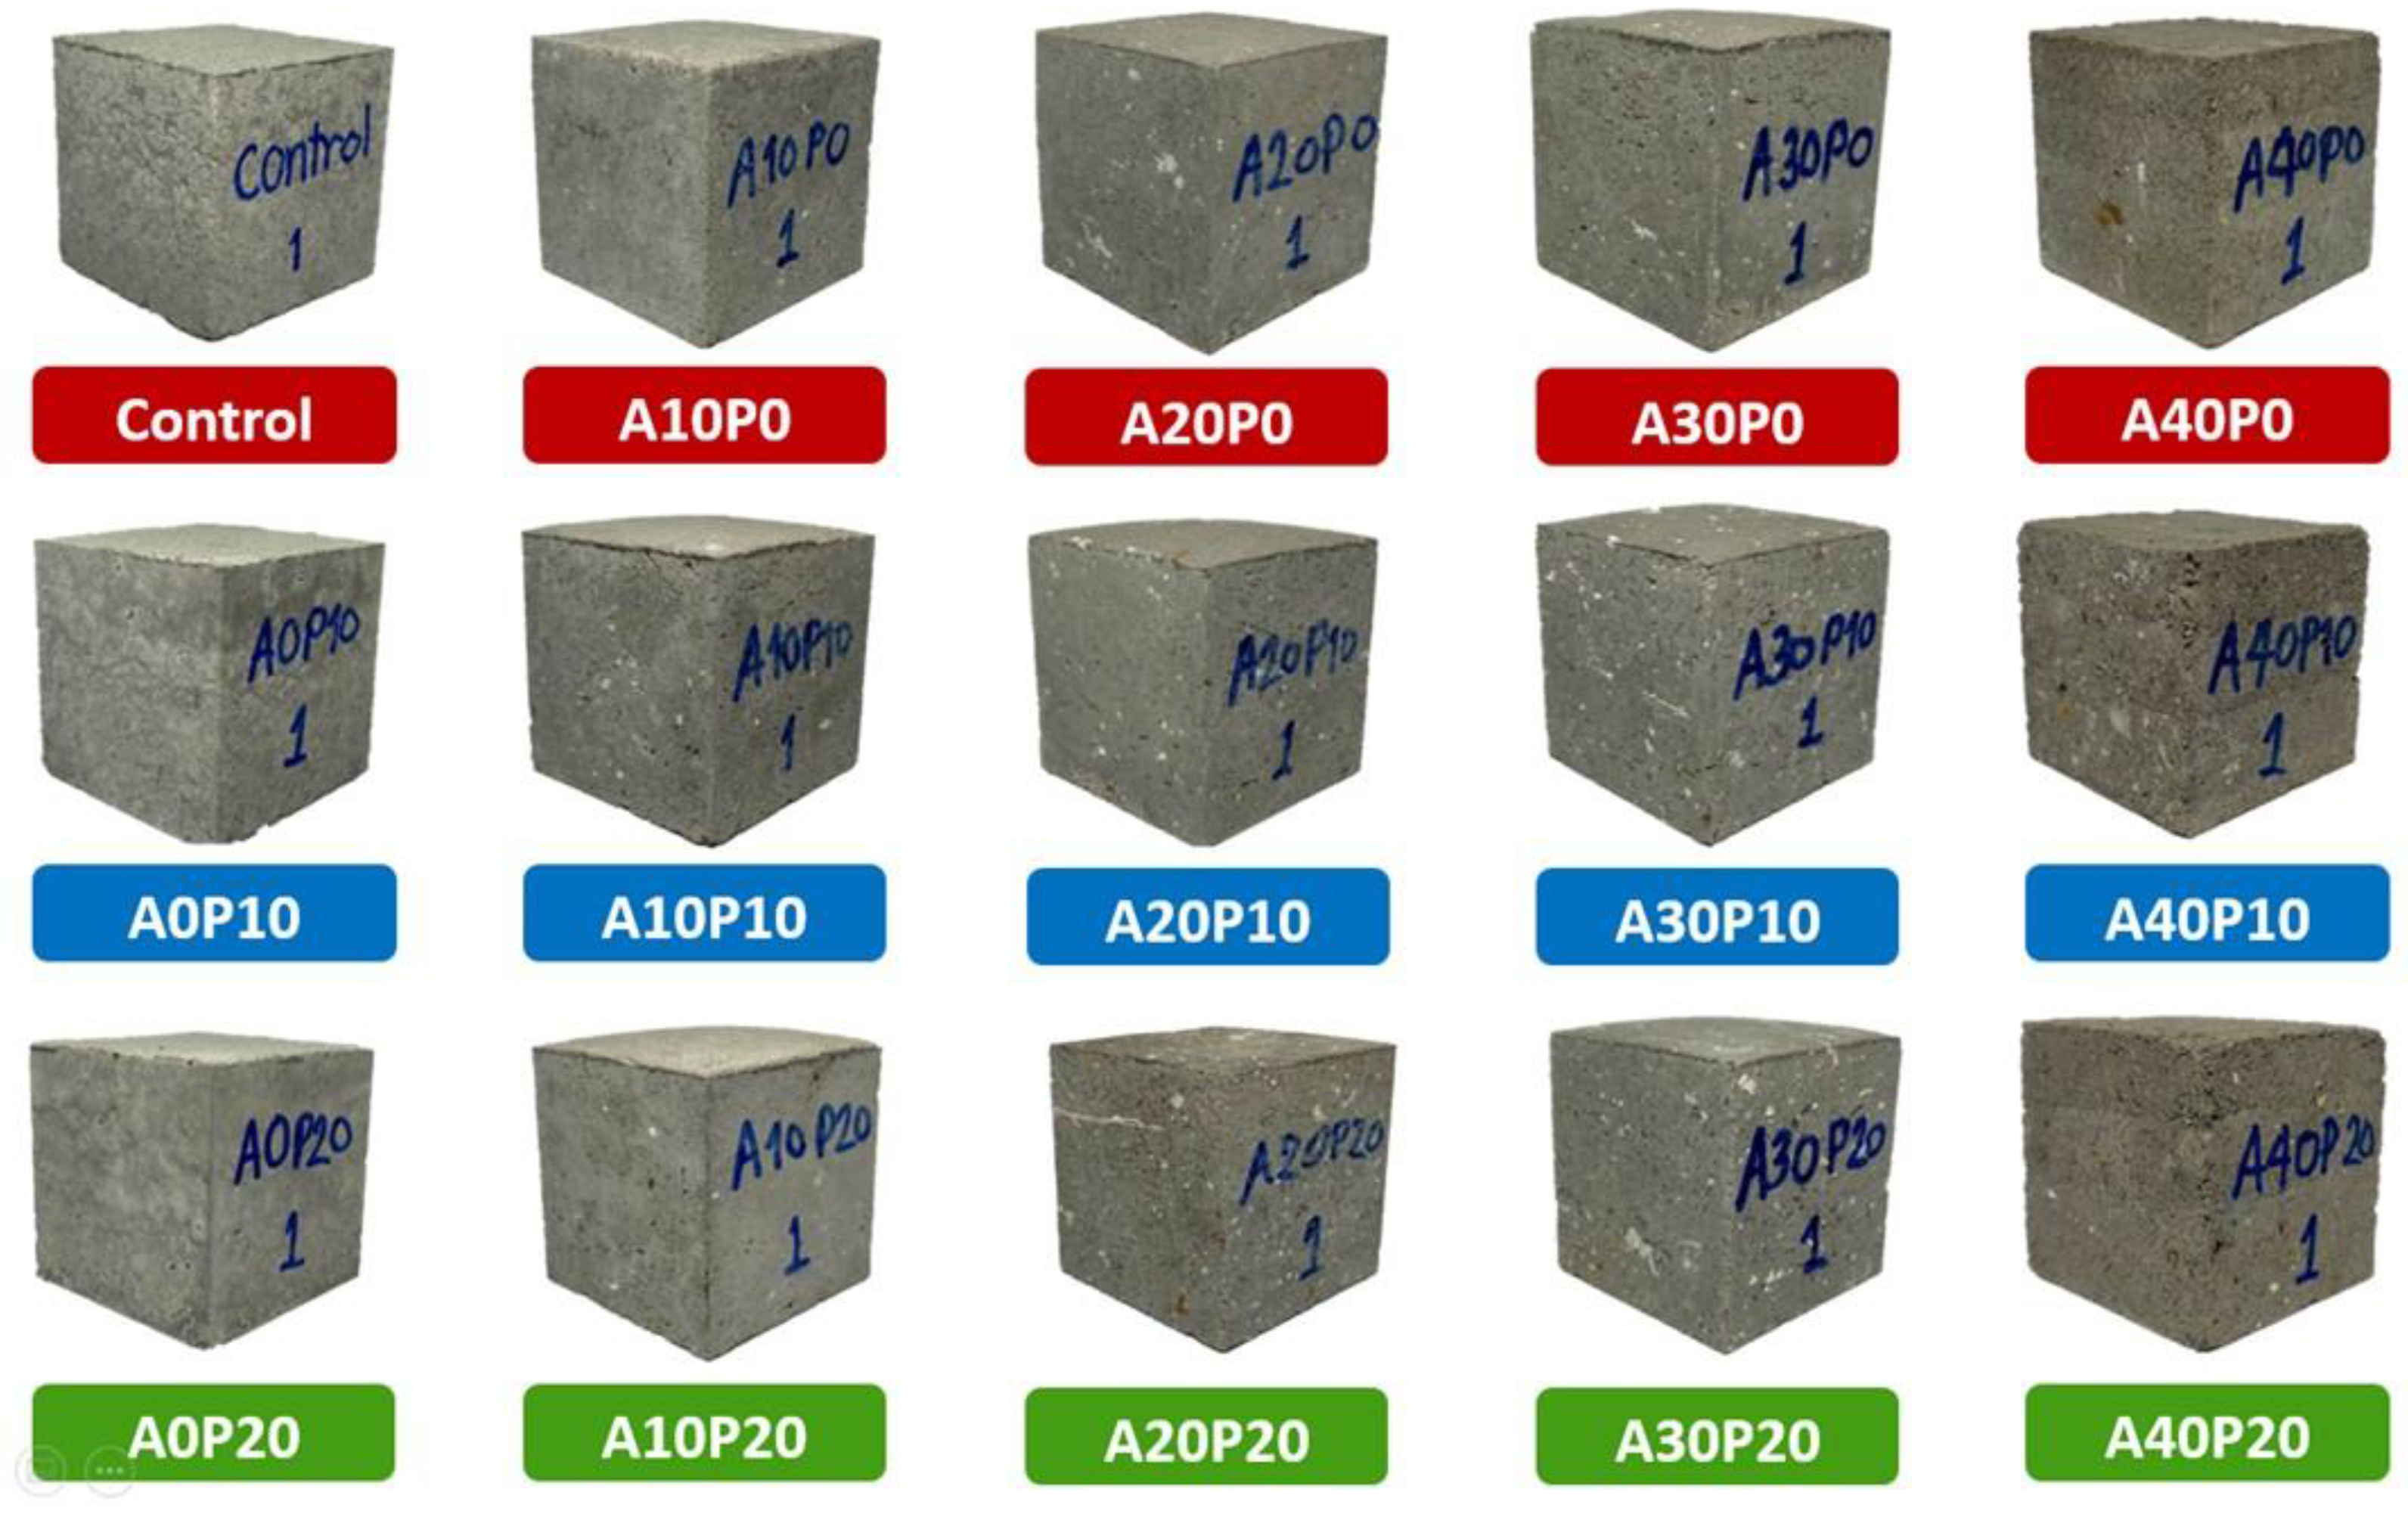
- General Appearance
- 2.
- Compressive Strength
- 3.
- Water Absorption
- 4.
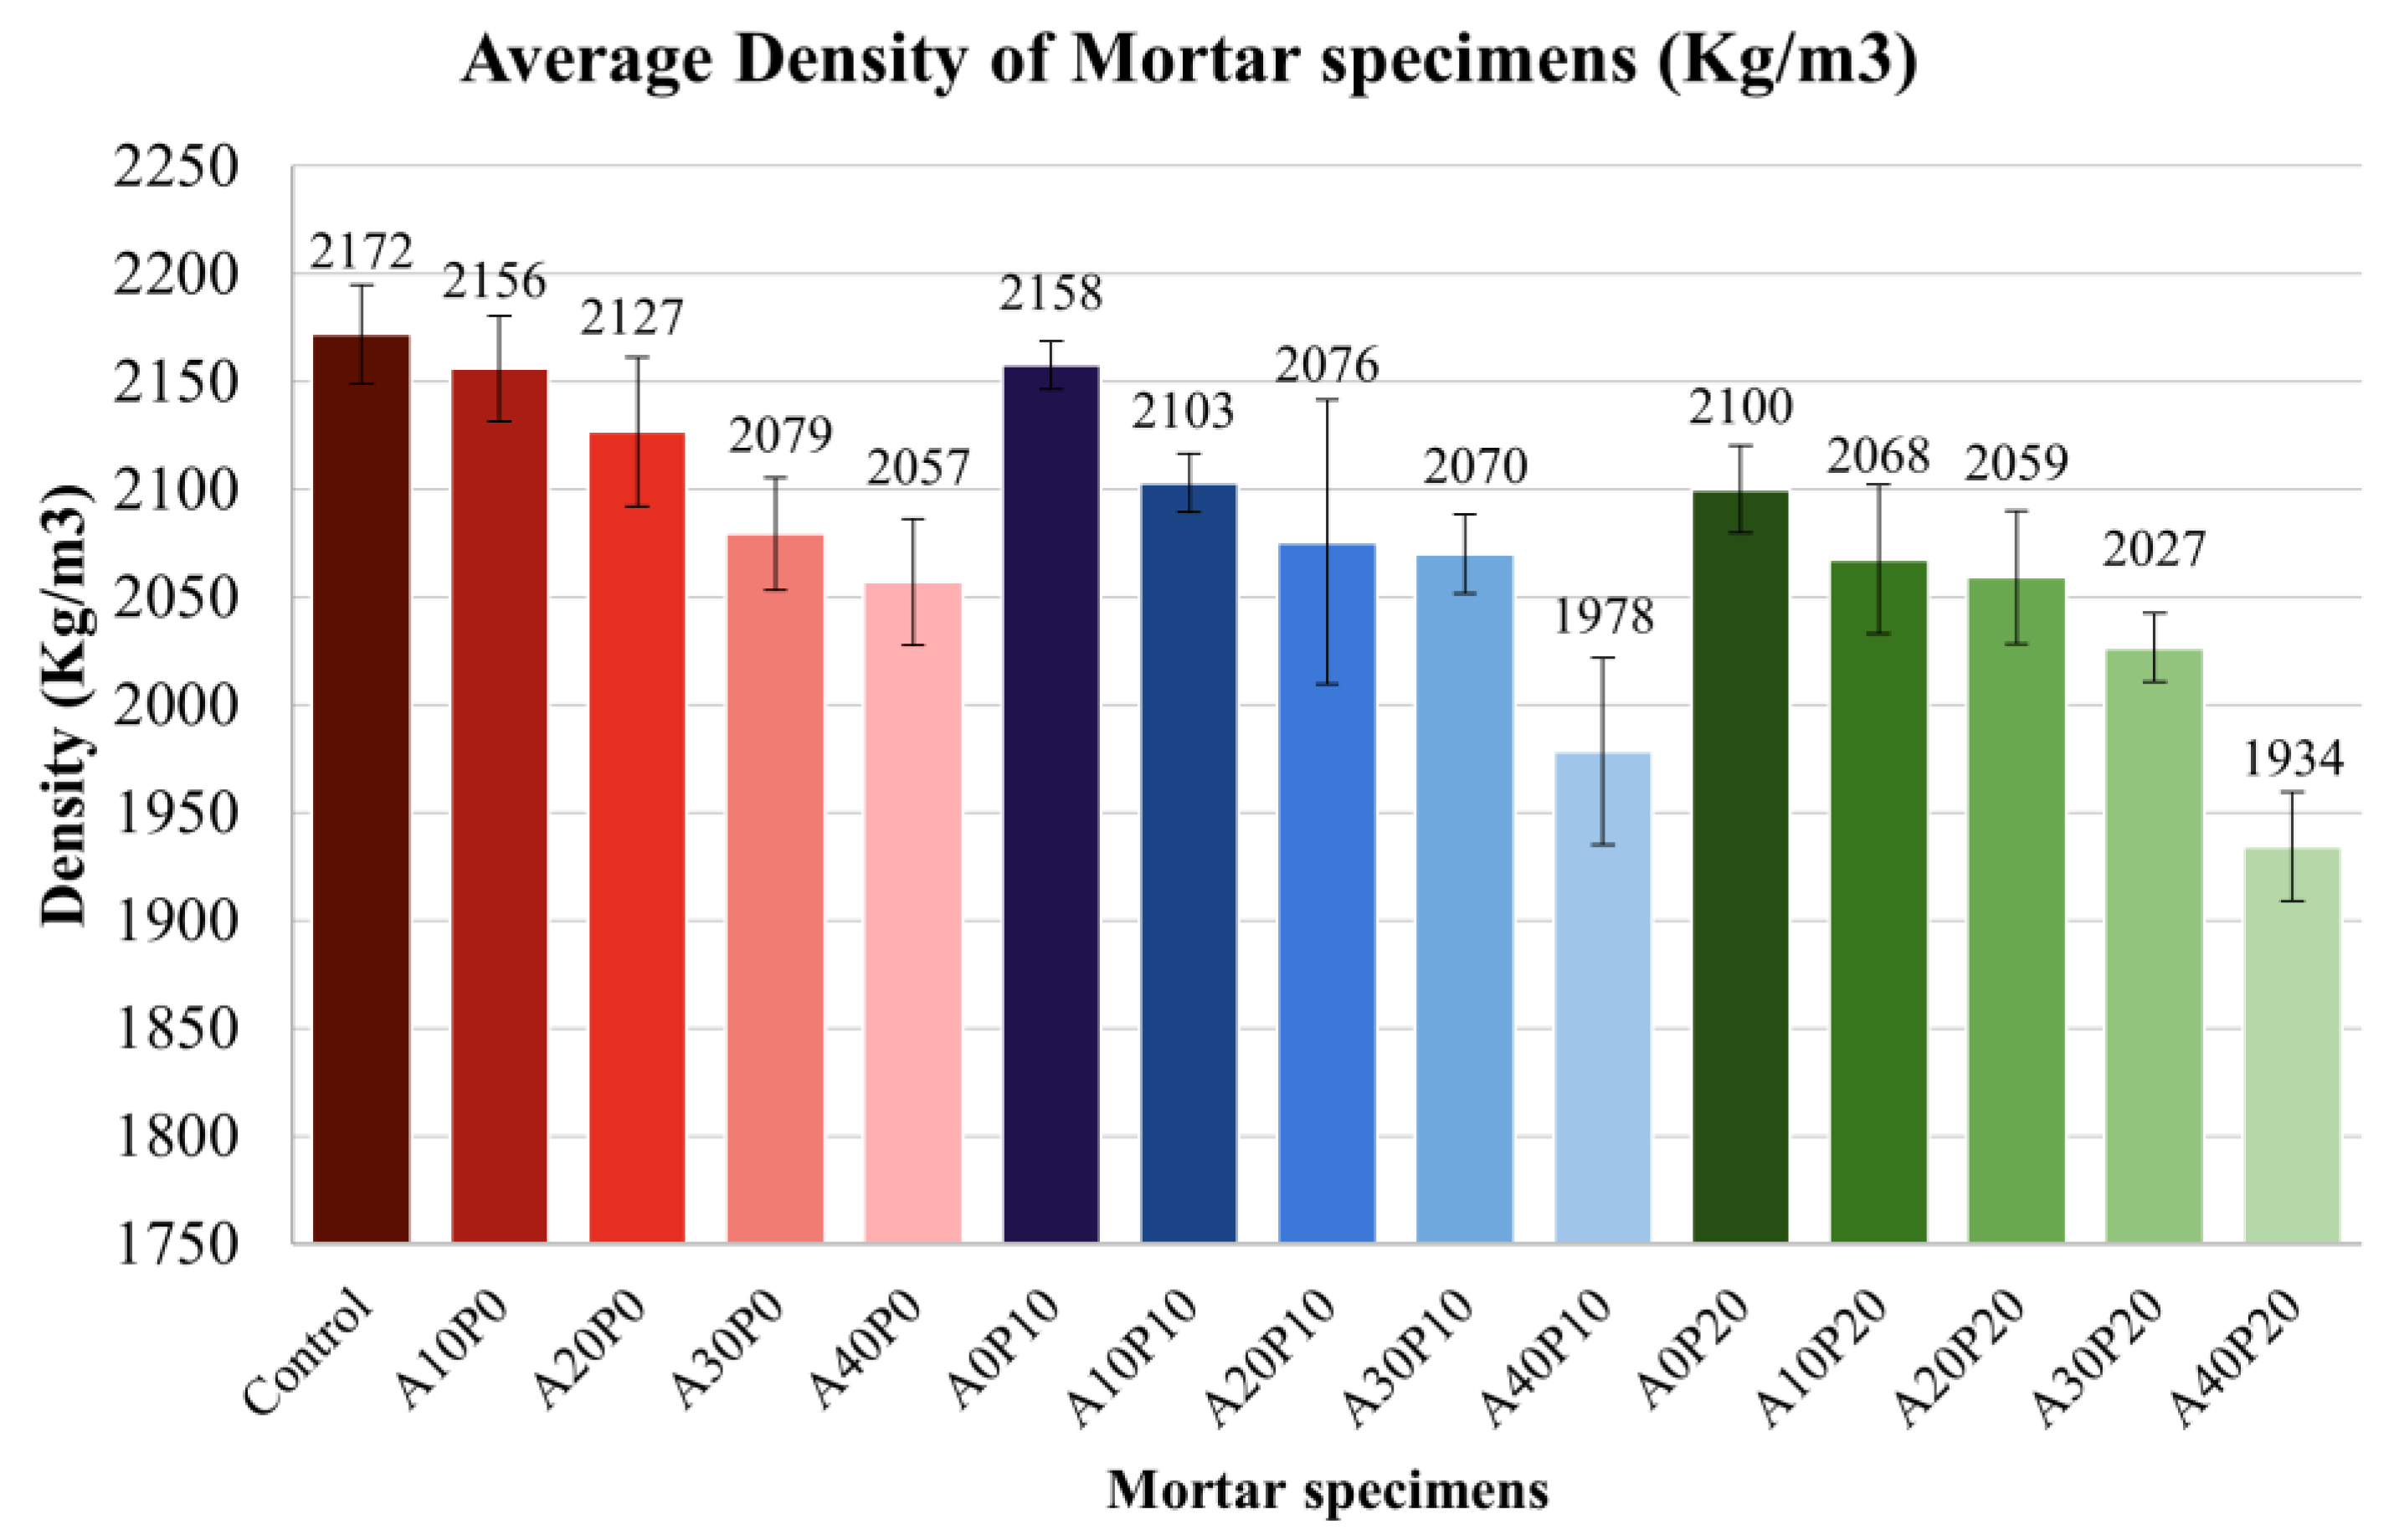
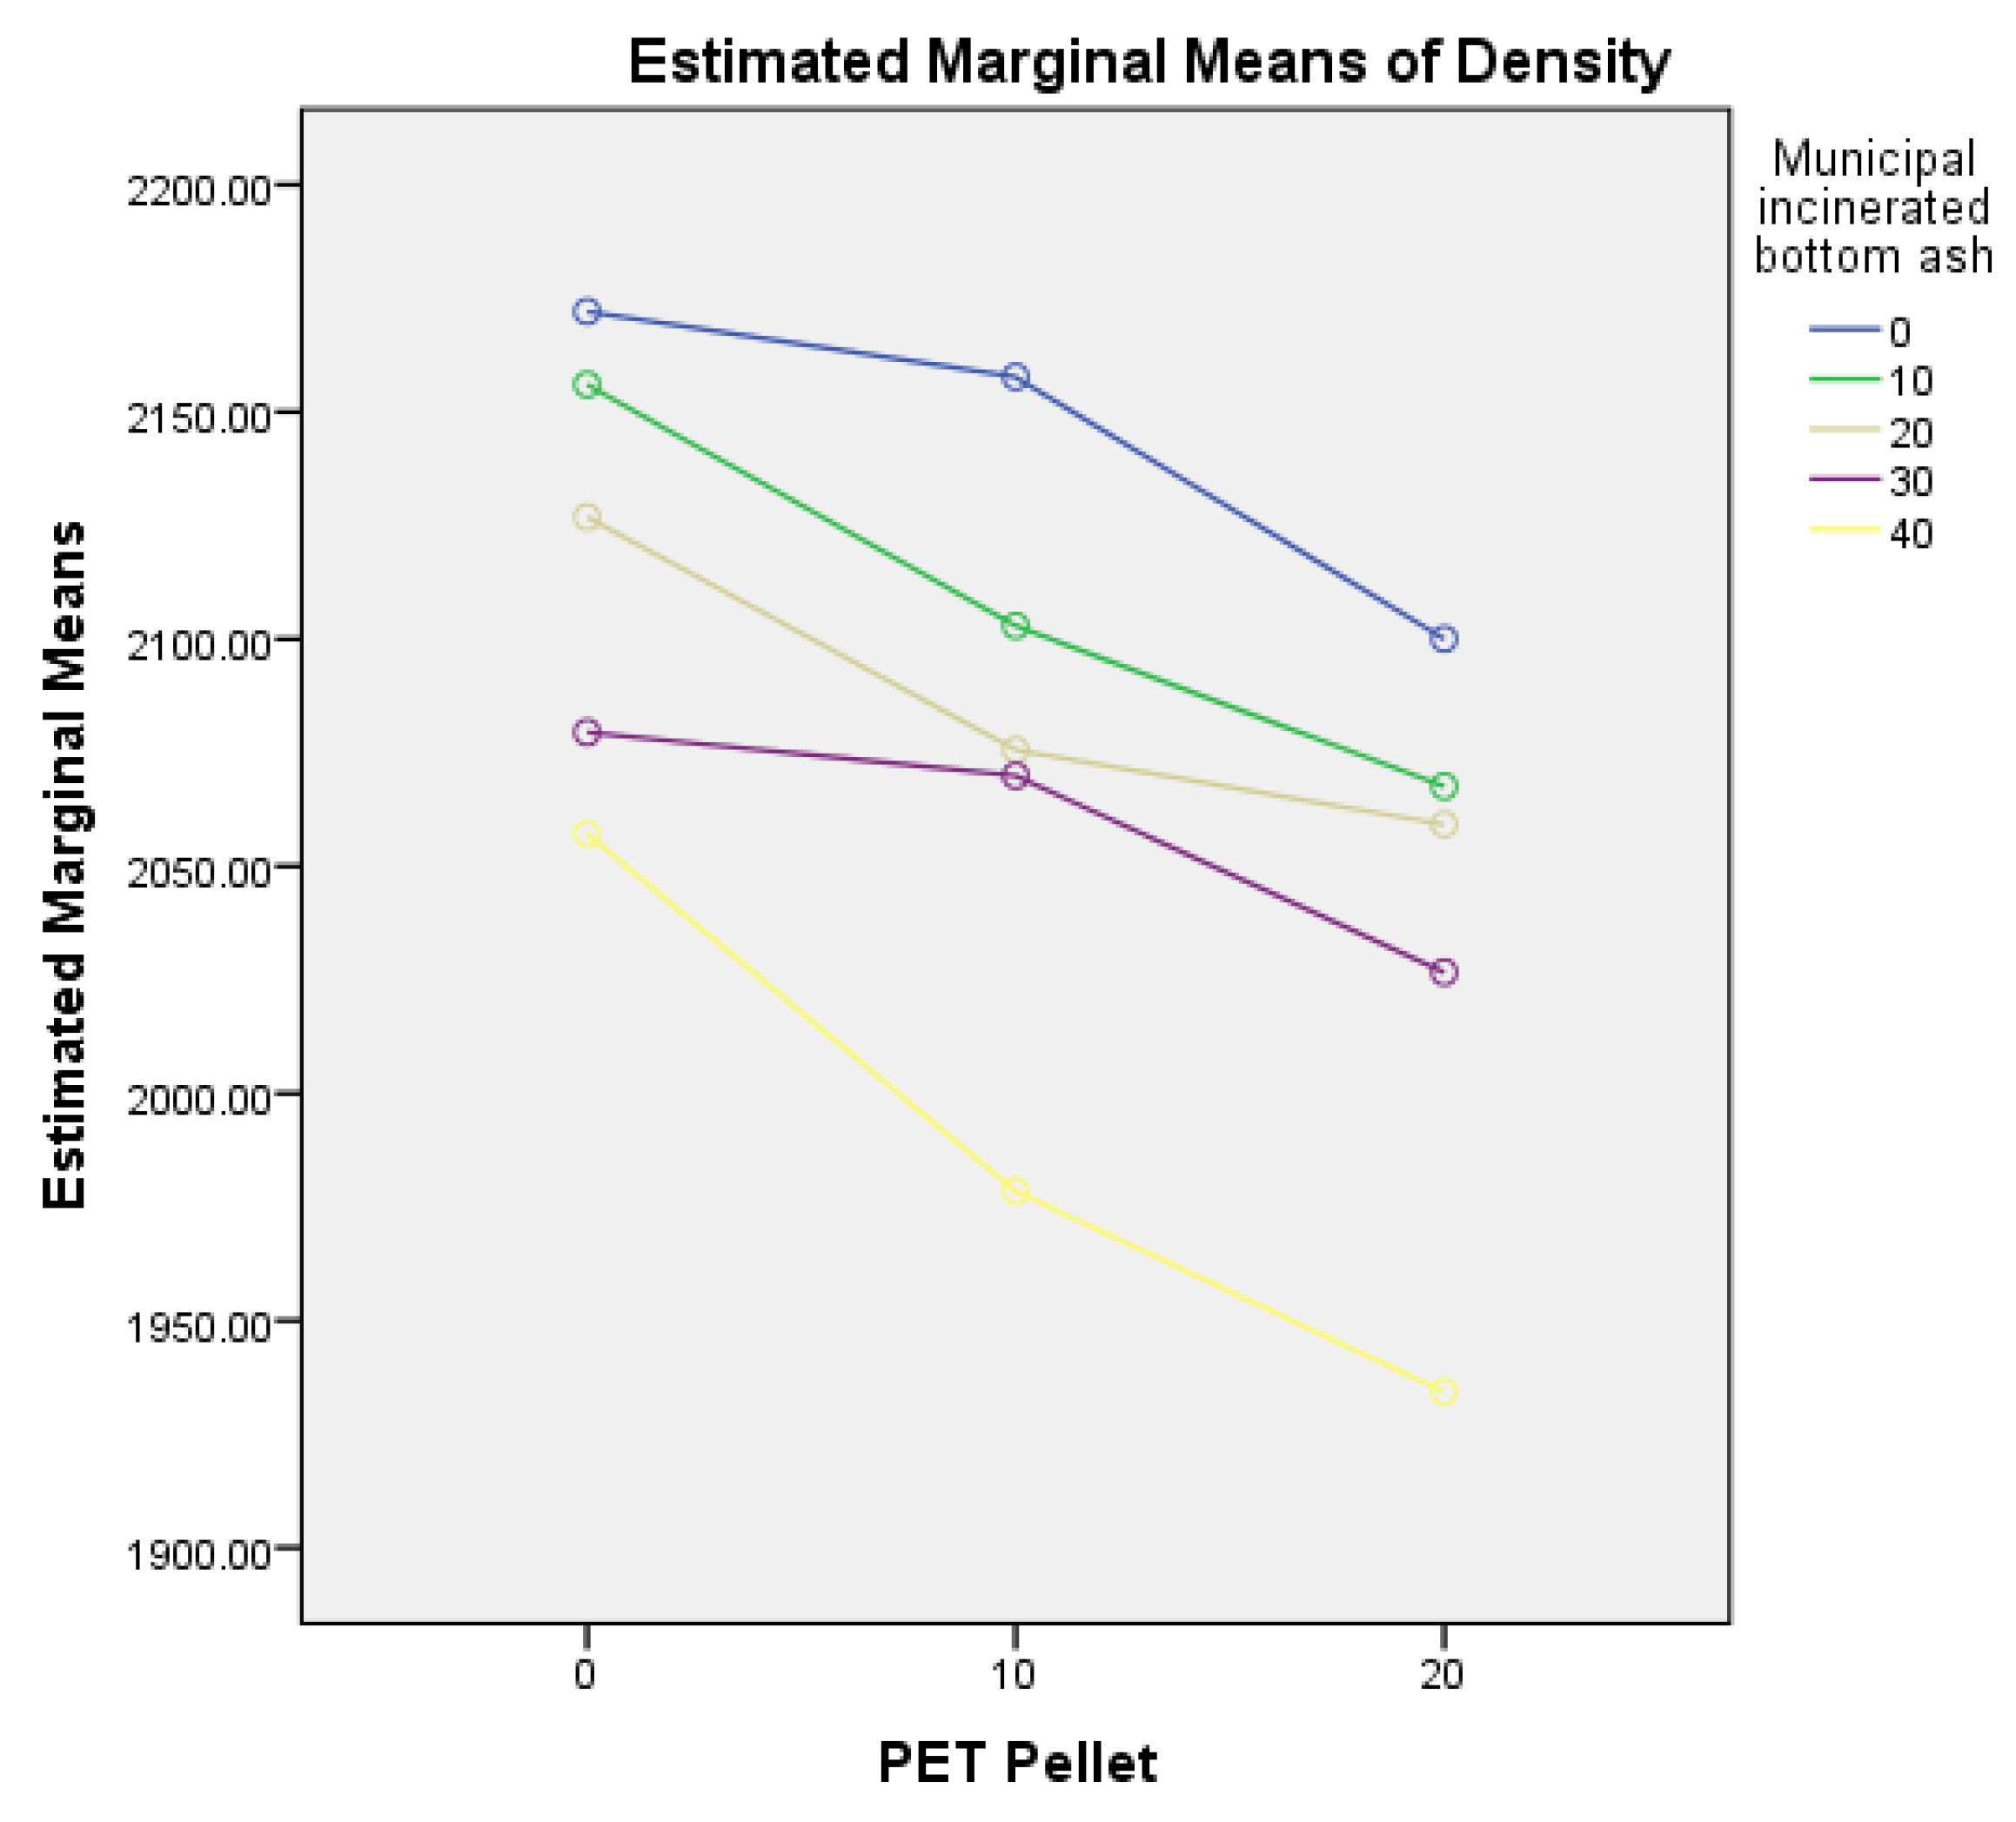
- Density
- 5.
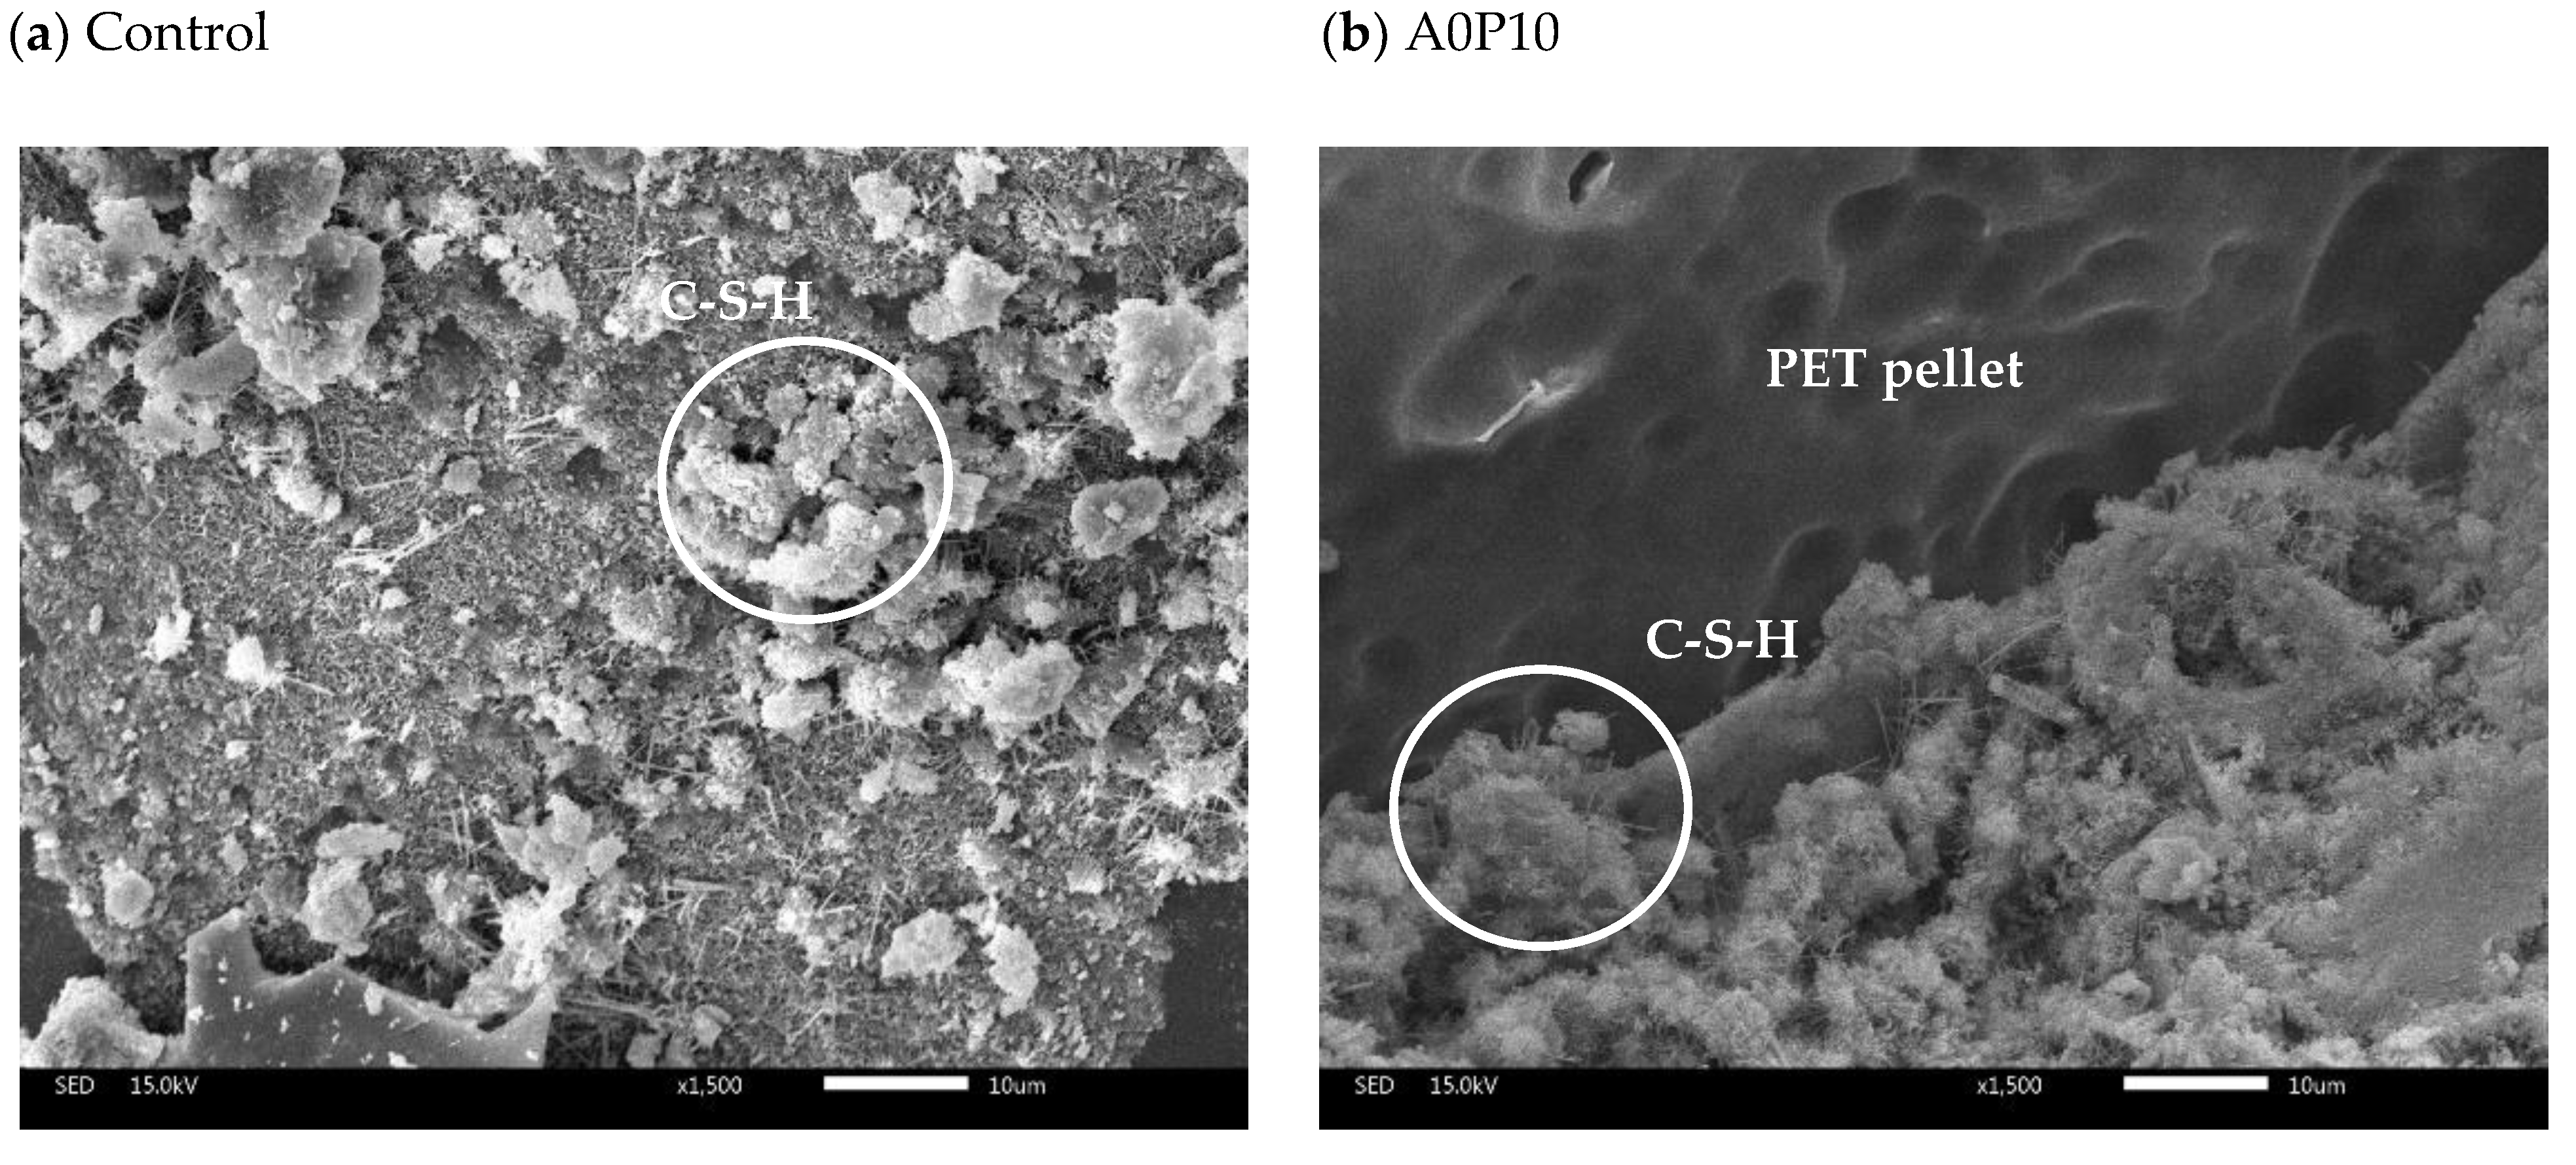
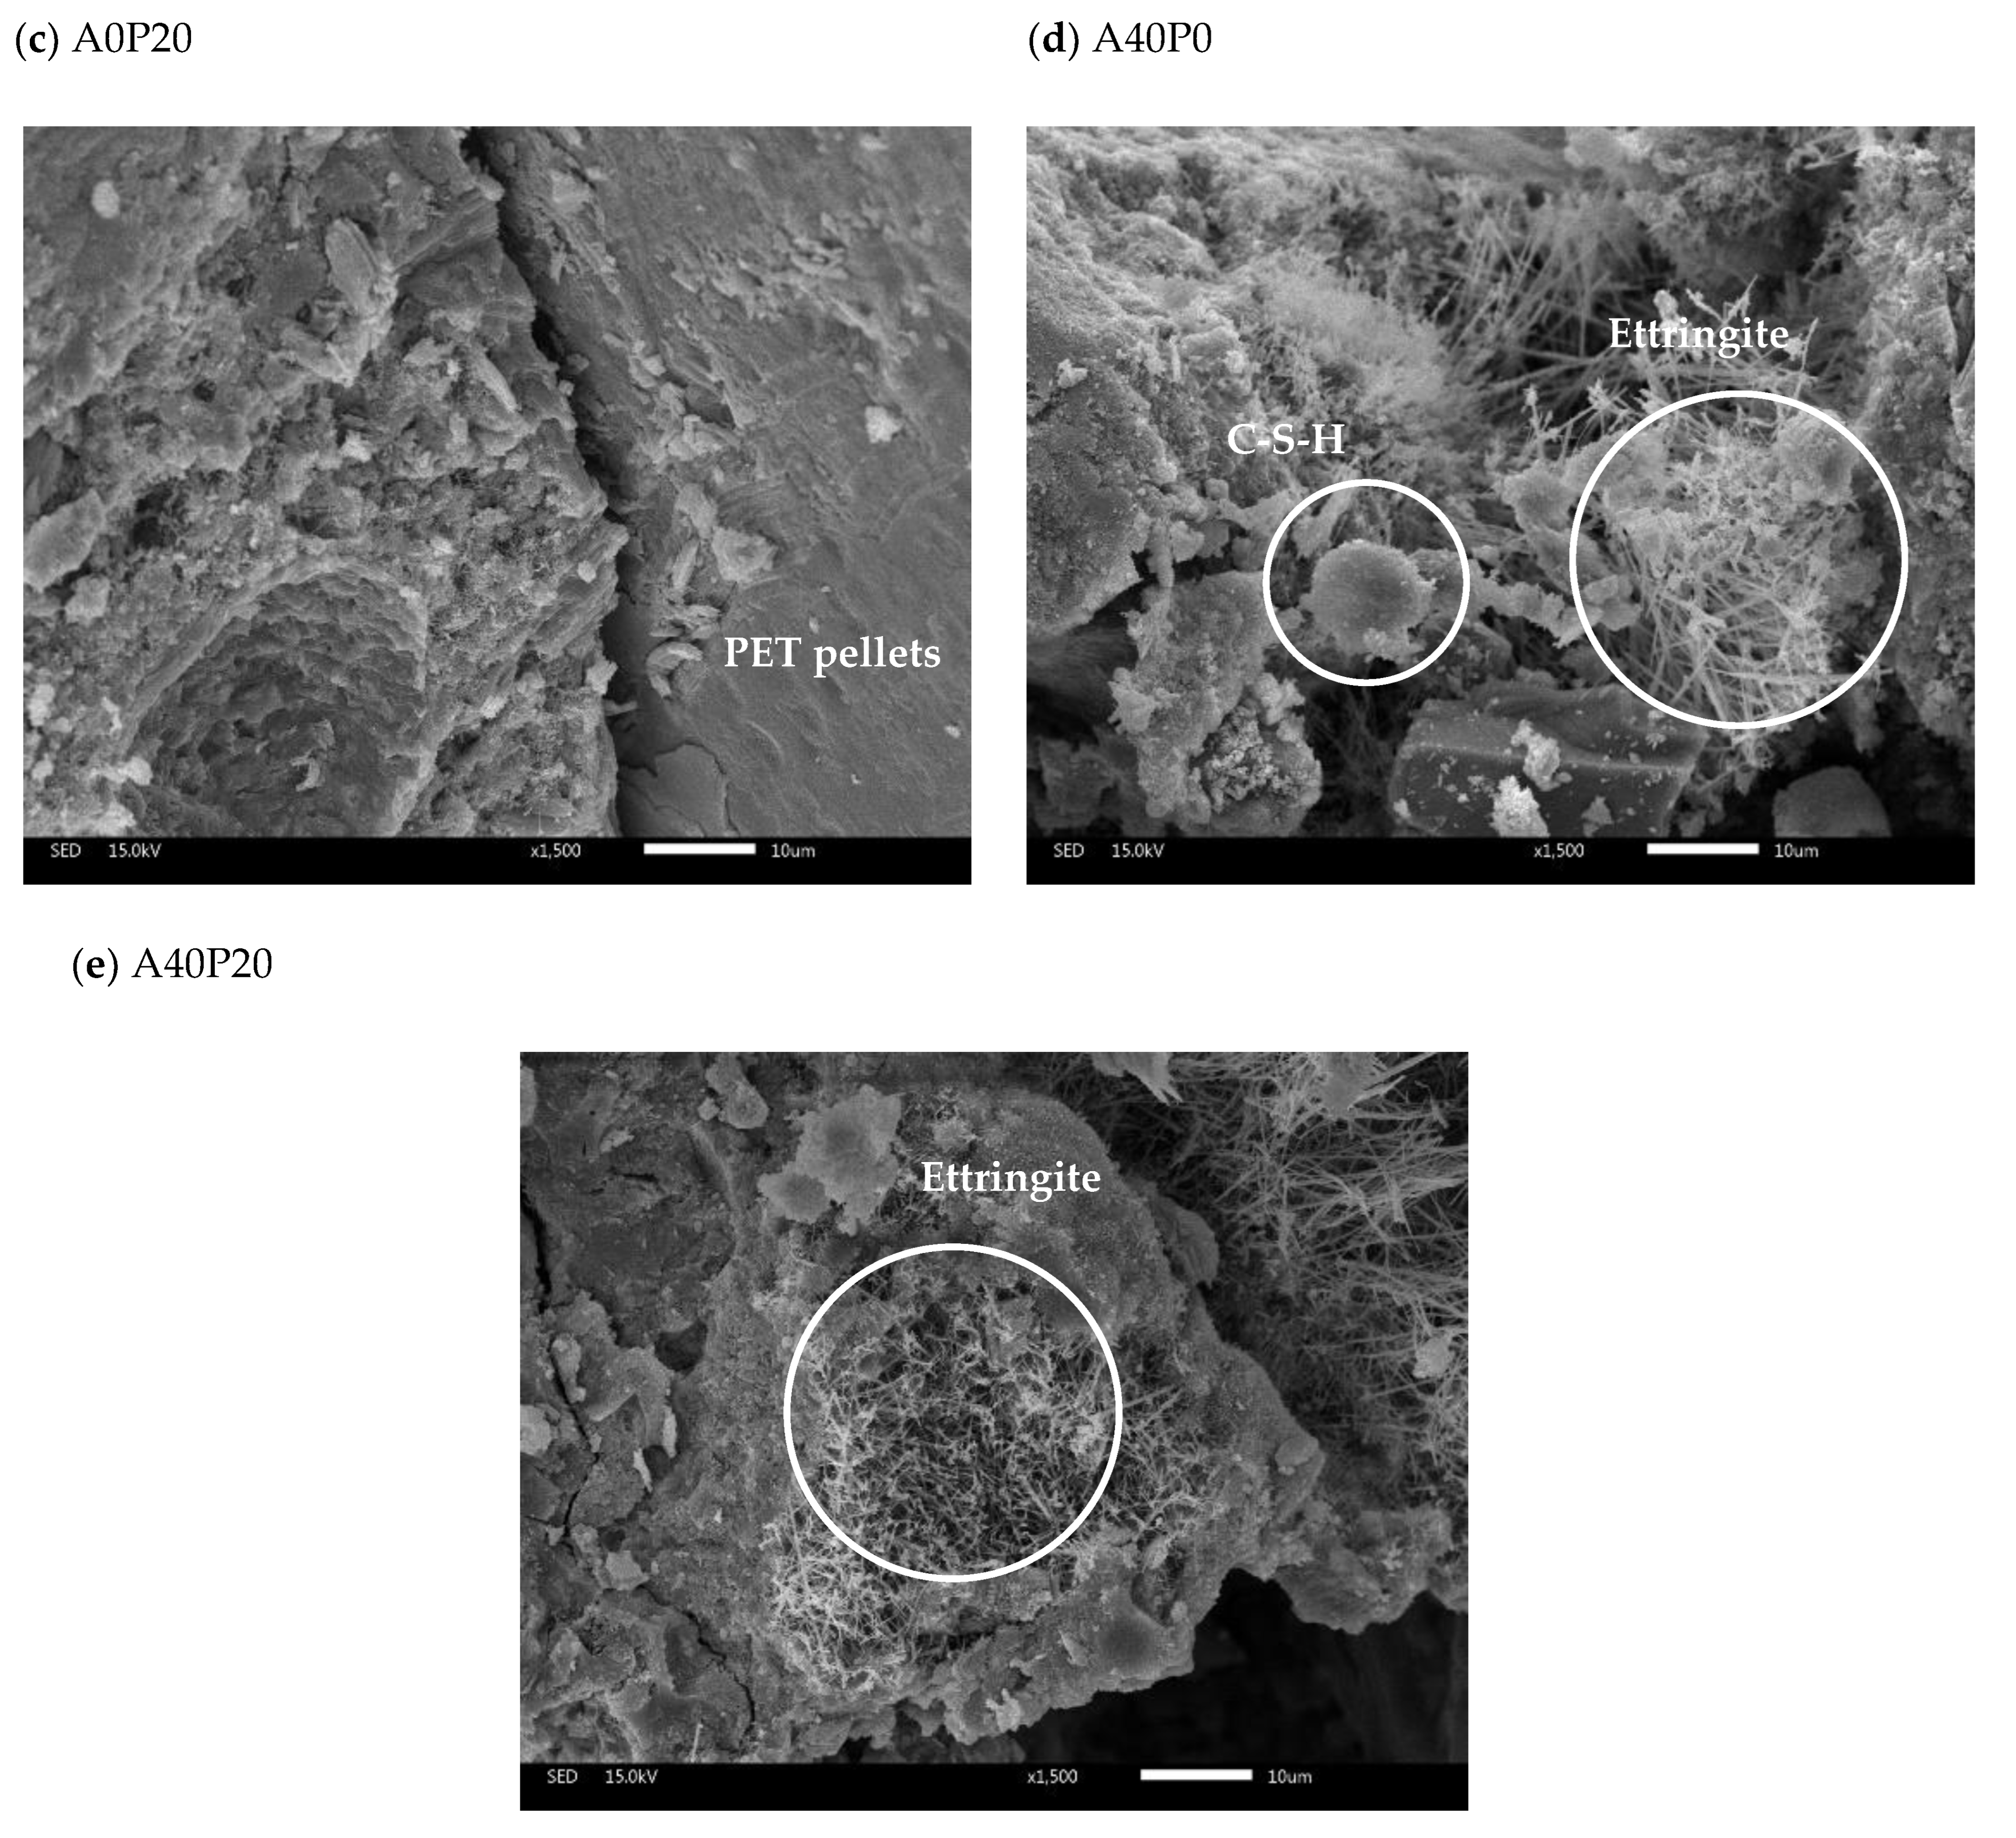
- Microstructure of Mortar Specimens
4. Conclusions
- The compressive strengths of mortar specimens cured for 56 days was greater than 40 MPa, and are as follows:
- A0P10 with 10% sand replaced by PET pellets obtained a compressive strength of 49.53 MPa.
- A10P0 with 10% sand replaced by MIBA obtained a compressive strength of 49.19 MPa.
- A20P0 with 20% sand replaced by MIBA obtained a compressive strength of 46.25 MPa.
- A0P20 with 20% sand replaced by PET pellets obtained a compressive strength of 46.00 MPa.
- The properties of the mortar specimens showed that the amount of waste replaced by fine aggregate in the manufacture of cement mortar affected the reduced compressive strength and density of mortar specimens due to the poor bonding of aggregates in the mortar specimen matrix and low-density properties of the waste. However, mortar specimens with 20% sand replaced by PET pellets obtained the lowest water absorption.
Author Contributions
Funding
Institutional Review Board Statement
Informed Consent Statement
Data Availability Statement
Acknowledgments
Conflicts of Interest
References
- Word Bank. Available online: https://data.worldbank.org.cn/ (accessed on 22 May 2021).
- Wang, H.; Wang, X.; Song, J.; Wang, S.; Liu, X. Uncovering regional energy and environmental benefits of urban waste utilization: A physical input-output analysis for a city case. J. Clean Prod. 2018, 189, 922–932. [Google Scholar] [CrossRef]
- Nordahl, S.L.; Devkota, J.P.; Amirebrahimi, J.; Smith, S.J.; Breunig, H.M.; Preble, C.V.; Satchwell, A.J.; Jin, L.; Brown, N.J.; Kirchstetter, T.W.; et al. Life-cycle greenhouse gas emissions and human health trade-offs of organic waste management strategies. Environ. Sci. Technol. 2020, 54, 9200–9209. [Google Scholar] [CrossRef] [PubMed]
- Corona, B.; Shen, L.; Reike, D.; Carreón, R.J.; Worrell, E. Towards sustainable development through the circular economy—A review and critical assessment on current circularity metrics. Resour. Conserv. Recycl. 2019, 151, 104498. [Google Scholar] [CrossRef]
- Baležentis, T.; Streimikiene, D.; Zhang, T.; Liobikiene, G. The role of bioenergy in greenhouse gas emission reduction in EU countries: An environmental Kuznets curve modelling. Resour. Conserv. Recycl. 2019, 142, 225–231. [Google Scholar] [CrossRef]
- Lanzotti, A.; Martorelli, M.; Maietta, S.; Gerbino, S.; Penta, F.; Gloria, A. A comparison between mechanical properties of specimens 3D printed with virgin and recycled PLA. Procidia CIRP 2019, 79, 143–146. [Google Scholar] [CrossRef]
- Si Chang IslandChangSubdistrict Municipality, Recycle Waste Trading Summary. Koh Si Chang Subdistrict Municipality. 2020. Available online: https://www.kohsichang.go.th/ (accessed on 1 May 2022).
- Interview with Phanuwat Robkob, officer of Si Chang Municipality, Chonburi province, Thailand. (interviewed on 16 August 2020).
- Abramov, S.; He, J.; Wimmer, D.; Lemloh, M.L.; Muehe, E.M.; Gann, B.; Roehm, E.; Kirchhof, R.; Babechuk, M.G.; Schoenberg, R.; et al. Heavy metal mobility and valuable contents of processed municipal solid waste incineration residues from Southwestern Germany. Waste Manag. 2018, 79, 735–743. [Google Scholar] [CrossRef] [PubMed]
- Lynn, C.J.; Obe, D.R.K.; Ghataora, G.S. Municipal incinerated bottom ash characteristics and potential for use as aggregate in concrete. Constr. Build. Mater. 2016, 127, 504–517. [Google Scholar] [CrossRef]
- Lynn, C.J.; Ghataora, G.S.; Obe, D.R.K. Municipal incinerated bottom ash (MIBA) characteristics and potential for use in road pavements. Int. J. Pavement Res. Technol. 2017, 10, 185–201. [Google Scholar] [CrossRef]
- Abdalla, A.; Mohammed, A.S. Surrogate models to predict the long-term compressive strength of cement based mortar modified with fly ash. Arch. Comp. Methods Eng. 2022, 1–26. [Google Scholar] [CrossRef]
- Koh Si Chang Subdistrict Municipality. History of Si Chang Island; Koh Si Chang Subdistrict Municipality: Bay of Siam, Thailand, 2017. [Google Scholar]
- Interview with Wisit La-ongsiri, Sichangmarine Service Co.,Ltd, Chonburi province, Thailand. (interviewed on 31 August 2020).
- Mohammed, A.; Rafiq, S.; Sihag, P.; Mahmood, W.; Ghafor, K.; Sarwar, W. ANN, M5P-tree model, and nonlinear regression approaches to predict the compression strength of cement-based mortar modified by quicklime at various water/cement ratios and curing times. Arab. J. Geosci. 2020, 13, 1216. [Google Scholar] [CrossRef]
- Raheem, A.A.; Ikotun, B.D. Incorporation of agricultural residues as partial substitution for cement in concrete and mortar–A review. J. Build. Eng. 2020, 31, 101428. [Google Scholar] [CrossRef]
- Mahmood, W.; Mohammed, A. Performance of ANN and M5P-tree to forecast the compressive strength of hand-mix cement-grouted sands modified with polymer using ASTM and BS standards and evaluate the outcomes using SI with OBJ assessments. Neural Comput. Appl. 2022, 1–21. [Google Scholar] [CrossRef]
- Saikia, N.; de Brito, J. Mechanical properties and abrasion behaviour of concrete containing shredded PET bottle waste as a partial substitution of natural aggregate. Constr. Build. Mater. 2014, 52, 236–244. [Google Scholar] [CrossRef]
- Thorneycroft, J.; Orr, J.; Savoikar, P.; Ball, R.J. Performance of structural concrete with recycled plastic waste as a partial replacement for sand. Constr. Build. Mater. 2018, 161, 63–69. [Google Scholar] [CrossRef]
- Bahij, S.; Omary, S.; Feugeas, F.; Faqiri, A. Fresh and hardened properties of concrete containing different forms of plastic waste—A review. Waste Manag. 2020, 113, 157–175. [Google Scholar] [CrossRef]
- Silva, R.V.; de Brito, J.; Lynn, C.J.; Dhir, R.K. Environmental impacts of the use of bottom ashes from municipal solid waste incineration: A review. Resour. Conserv. Recycl. 2019, 140, 23–35. [Google Scholar] [CrossRef]
- da Silva, A.M.; de Brito, J.; Veiga, R. Incorporation of fine plastic aggregates in rendering mortars. Constr. Build. Mater. 2014, 71, 226–236. [Google Scholar] [CrossRef]
- Wei, M.-C.; Wey, M.; Hwang, J.; Chen, J. Stability of heavy metals in bottom ash and fly ash under various incinerating conditions. J. Hazard. Mater. 1998, 57, 145–154. [Google Scholar] [CrossRef]
- Alam, Q.; Lazaro, A.; Schollbach, K.; Brouwers, H.J.H. Chemical speciation, distribution and leaching behavior of chlorides from municipal solid waste incineration bottom ash. Chemosphere 2020, 241, 124985. [Google Scholar] [CrossRef]
- Environmental Protection Agency (EPA). Identification and Listing of Hazardous Waste, Identification and Listing of Hazardous Waste; Environmental Protection Agency (EPA): Washington, DC, USA, 2022. Available online: https://www.ecfr.gov/current/title-40/chapter-I/subchapter-I/part-261 (accessed on 1 May 2022).
- Pollution Control Department. Announcement of the National Environment Board (BE 2547) Regarding to Determination of Soil Quality. In Government Gazette; Bangkok, Thailand, 2004; Volume 25. Available online: https://www.pcd.go.th/ (accessed on 1 May 2022).
- CPAC Academy. Concrete Technology; The Concrete Products and Aggregate Co., Ltd.: Bangkok, Thailand, 2000; Chapter 2 Cement. [Google Scholar]
- Naran, J.M.; Gonzalez, R.E.G.; del Rey Castillo, E.; Toma, C.L.; Almesfer, N.; van Vreden, P.; Saggi, O. Incorporating waste to develop environmentally-friendly concrete mixes. Constr. Build. Mater. 2022, 314, 125599. [Google Scholar] [CrossRef]
- Caprai, V.; Schollbach, K.; Brouwers, H.J.H. Influence of hydrothermal treatment on the mechanical and environmental performances of mortars including MSWI bottom ash. Waste Manag. 2018, 78, 639–648. [Google Scholar] [CrossRef] [PubMed]
- Kunther, W.; Ferreiro, S.; Skibsted, J. Influence of the Ca/Si ratio on the compressive strength of cementitious calcium–silicate–hydrate binders. J. Mater. Chem. A 2017, 5, 17401–17412. [Google Scholar] [CrossRef] [Green Version]
- Hanif Khan, M.; Zhu, H.; Ali Sikandar, M.; Zamin, B.; Ahmad, M.; Muayad Sabri Sabri, M. Effects of various mineral admixtures and fibrillated polypropylene fibers on the properties of engineered cementitious composite (ECC) based mortars. Materials 2022, 15, 2880. [Google Scholar] [CrossRef] [PubMed]
- Na, O.; Xi, Y.; Ou, E.; Saouma, V.E. The effects of alkali-silica reaction on the mechanical properties of concretes with three different types of reactive aggregate. Struct. Concr. 2016, 17, 74–83. [Google Scholar] [CrossRef]


| Name | Binder | Fine Aggregate | Water/Cement | ||
|---|---|---|---|---|---|
| Cement | Sand (%) | MIBA (%) | PET Pellets (%) | ||
| Control | 100 | 100 | 0 | 0 | 0.5 |
| A10P0 | 100 | 90 | 10 | 0 | |
| A20P0 | 100 | 80 | 20 | 0 | |
| A30P0 | 100 | 70 | 30 | 0 | |
| A40P0 | 100 | 60 | 40 | 0 | |
| A0P10 | 100 | 90 | 0 | 10 | |
| A10P10 | 100 | 80 | 10 | 10 | |
| A20P10 | 100 | 70 | 20 | 10 | |
| A30P10 | 100 | 60 | 30 | 10 | |
| A40P10 | 100 | 50 | 40 | 10 | |
| A0P20 | 100 | 80 | 0 | 20 | |
| A10P20 | 100 | 70 | 10 | 20 | |
| A20P20 | 100 | 60 | 20 | 20 | |
| A30P20 | 100 | 50 | 30 | 20 | |
| A40P20 | 100 | 40 | 40 | 20 | |
| Oxides | Content (wt.%) | |
|---|---|---|
| Sand | MIBA | |
| SiO2 | 73.6 | 17.0 |
| Al2O3 | 4.72 | 4.22 |
| K2O | 2.96 | 3.03 |
| Fe2O3 | 0.765 | 2.07 |
| Na2O | 0.266 | 3.57 |
| TiO2 | 0.125 | 1.19 |
| MgO | 868 PPM | 2.31 |
| CaO | 868 PPM | 31.3 |
| BaO | 359 PPM | 729 PPM |
| P2O5 | 345 PPM | 1.96 |
| Rb2O | 184 PPM | 60 PPM |
| ZrO2 | 141 PPM | 156 PPM |
| SO3 | 105 PPM | 3.04 |
| MnO | 87.4 PPM | 875 PPM |
| SrO | 34.7 PPM | 402 PPM |
| PbO | 27.4 PPM | 300 PPM |
| Cl | Not detected | 5.22 |
| CoO | Not detected | Not detected |
| NiO | Not detected | 81.6 PPM |
| CuO | Not detected | 0.118 |
| ZnO | Not detected | 0.22 |
| As2O3 | Not detected | Not detected |
| Heavy Metal | MIBA (mg/L) | Regulatory Level (mg/L) | Soil Quality Standards (mg/kg) |
|---|---|---|---|
| Ba | 0.638 ± 0.169 | 100.0 | - |
| As | Not detected | 5.0 | 3.9 |
| Co | Not detected | - | - |
| Cd | 0.003 ± 0.000 | 1.0 | 37 |
| Fe | Not detected | - | - |
| Cr | 0.228 ± 0.028 | 5.0 | 300 |
| Mn | Not detected | - | 1800 |
| Cu | 0.188 ± 0.058 | - | - |
| Se | 0.010 ± 0.000 | 1.0 | 390 |
| Zn | 0.013 ± 0.008 | - | - |
| Ni | Not detected | - | 1600 |
| Pb | 0.011 ± 0.003 | 5.0 | 400 |
| Source | Type III Sum of Squares | df | Mean Square | F | Sig. | Partial Eta Squared |
|---|---|---|---|---|---|---|
| Corrected Model | 5282.550 a | 14 | 377.325 | 22.857 | 0.000 | 0.842 |
| Intercept | 106,129.133 | 1 | 106,129.133 | 6428.935 | 0.000 | 0.991 |
| PET | 1508.426 | 2 | 754.213 | 45.688 | 0.000 | 0.604 |
| MIBA | 3523.559 | 4 | 880.890 | 53.361 | 0.000 | 0.781 |
| PET*MIBA | 250.564 | 8 | 31.321 | 1.897 | 0.077 | 0.202 |
| Error | 990.483 | 60 | 16.508 | |||
| Total | 112,402.165 | 75 | ||||
| Corrected Total | 6273.033 | 74 |
| Source | Type III Sum of Squares | df | Mean Square | F | Sig. | Partial Eta Squared |
|---|---|---|---|---|---|---|
| Corrected Model | 2413.943 a | 14 | 172.425 | 9.764 | 0.000 | 0.695 |
| Intercept | 760,274.953 | 1 | 760,274.953 | 43,051.327 | 0.000 | 0.999 |
| PET | 123.614 | 2 | 61.807 | 3.500 | 0.037 | 0.104 |
| MIBA | 1835.554 | 4 | 458.889 | 25.985 | 0.000 | 0.634 |
| PET*MIBA | 454.775 | 8 | 56.847 | 3.219 | 0.004 | 0.300 |
| Error | 1059.584 | 60 | 17.660 | |||
| Total | 763,748.480 | 75 | ||||
| Corrected Total | 3473.527 | 74 |
| Source | Type III Sum of Squares | df | Mean Square | F | Sig. | Partial Eta Squared |
|---|---|---|---|---|---|---|
| Corrected Model | 294,711.711 a | 14 | 21,050.837 | 20.365 | 0.000 | 0.826 |
| Intercept | 323,728,515.6 | 1 | 323,728,515.6 | 313,176.841 | 0.000 | 1.000 |
| PET | 81,567.215 | 2 | 40,783.608 | 39.454 | 0.000 | 0.568 |
| MIBA | 201,231.402 | 4 | 50,307.851 | 48.668 | 0.000 | 0.764 |
| PET*MIBA | 11,913.094 | 8 | 1489.137 | 1.441 | 0.199 | 0.161 |
| Error | 62,021.543 | 60 | 1033.692 | |||
| Total | 324,085,248.9 | 75 | ||||
| Corrected Total | 356,733.254 | 74 |
Publisher’s Note: MDPI stays neutral with regard to jurisdictional claims in published maps and institutional affiliations. |
© 2022 by the authors. Licensee MDPI, Basel, Switzerland. This article is an open access article distributed under the terms and conditions of the Creative Commons Attribution (CC BY) license (https://creativecommons.org/licenses/by/4.0/).
Share and Cite
Phutthimethakul, L.; Supakata, N. Partial Replacement of Municipal Incinerated Bottom Ash and PET Pellets as Fine Aggregate in Cement Mortars. Polymers 2022, 14, 2597. https://doi.org/10.3390/polym14132597
Phutthimethakul L, Supakata N. Partial Replacement of Municipal Incinerated Bottom Ash and PET Pellets as Fine Aggregate in Cement Mortars. Polymers. 2022; 14(13):2597. https://doi.org/10.3390/polym14132597
Chicago/Turabian StylePhutthimethakul, Lalitsuda, and Nuta Supakata. 2022. "Partial Replacement of Municipal Incinerated Bottom Ash and PET Pellets as Fine Aggregate in Cement Mortars" Polymers 14, no. 13: 2597. https://doi.org/10.3390/polym14132597
APA StylePhutthimethakul, L., & Supakata, N. (2022). Partial Replacement of Municipal Incinerated Bottom Ash and PET Pellets as Fine Aggregate in Cement Mortars. Polymers, 14(13), 2597. https://doi.org/10.3390/polym14132597