1. Introduction
Thermal expansion of solid materials is a property that considers the increase in size that characterizes the solid body as its temperature rises. The inverse property of thermal expansion is thermal contraction or negative thermal expansion.
Thermal expansion of a part is important in situations where this expansion could affect the integrity or behavior of the assembly of which the part is a component. Because the forces that occur during thermal expansion can be relatively large, they can cause deformation or even breakage of other parts or even the part affected by the expansion.
Thermal expansion is evaluated by considering the ratio between the increase in size under the action of increasing the temperature and the initial value of the dimension affected by heating. This ratio is the coefficient of thermal expansion and is usually used in the case of linear dimensions or volumes of parts affected by thermal expansion.
Significant differences exist between the expansion of metallic materials, plastics, or ceramics. It is appreciated that, in general, the thermal expansion of ceramic materials is less than the thermal expansion of metallic materials, as polymeric plastics have an expansion of about 10 times greater than those of metallic materials. Devices called dilatometers are used to evaluate linear thermal expansion.
With the increasing use of parts made of polymers by 3D printing, it has become important to know the thermal properties of polymers. These properties include thermal expansion.
Seven additive manufacturing technologies are currently considered: vat photopolymerization, material extrusion, material jetting, binder jetting, powder bed fusion, direct energy deposition, and sheet lamination [
1]. The process used in this paper was material extrusion. This process involves a wire advanced and extruded through a heated nozzle and deposited in successive layers as a result of precisely controlled movements between the nozzle and the table of the 3D printer until the final part is obtained. Many input factors influence how successive layering occurs in the 3D printing process. These factors include the nozzle hole diameter, the relative movement speed between the nozzle and the printer table, the proposed level for the density of the workpiece material, the nozzle and printer table temperatures, and the cooling level during the 3D printing process, etc.). Due to the values of the input factors, the material of the part manufactured by 3D printing may have different degrees of densification and filling of the space inside the part, which will affect some thermal properties of the part material. Among these properties, there is thermal capacity expansion.
The need to consider thermal expansion as a property of the materials from which 3D printing processes made parts was highlighted by researchers [
2,
3,
4,
5]. Effective experimental attempts to study thermal expansion specific to polymeric materials used in manufacturing parts by 3D printing were performed by Wang [
3] and Miller [
6]. The importance of thermal expansion in the use of thermoactivated morphing materials has been highlighted by Nam [
7]. The analysis of some thermal properties of the filaments used for 3D printing of parts of polymeric materials was developed by Trhlikova et al. [
8] and Savu [
9]. Zhang referred to the thermal expansion of power electronic components when he studied applications of additive manufacturing in this field [
10].
The generation of 3D printed parts’ deviations due to thermal and negative thermal expansion was analyzed by researchers interested in a better knowledge of additive manufacturing processes, namely those of 3D printing [
3,
5,
8,
9].
Wang et al. [
11] studied some characteristics of isotactic polypropylene. They found that the high crystallization rate of isotactic polypropylene can cause significant difficulties in the case of additive manufacturing processes. When studying the behavior of a composite material based on isotactic polypropylene, it was observed that the value of the coefficient of thermal expansion of isotactic polypropylene is about 10% higher than that of a composite material containing spray-dried cellulose nanofibrils.
Blanco considered thermal expansion when reviewing the applications of thermal analysis methods that can be used to manufacture parts by 3D printing processes [
12]. He highlighted the availability of thermogravimetric analysis, differential scanning calorimetry, and dynamic mechanical analysis to assess the thermal expansion capacity of materials used to manufacture filaments when applying 3D printing processes.
In an overview of the additive manufacturing of polymer and polymer composite parts, Nat and Nilufar appreciated that the negative thermal expansion of parts after applying an additive manufacturing process induces residual stresses that can affect the behavior of parts during mechanical stresses [
13]. They found a library created by Huang et al. [
14] in connection with the possibilities of designing the parts so that the dimensions of the 3D printed part are affected as little as possible after the thermal shrinkage.
Zohdi et al. investigated the anisotropy of some thermal properties, as it is, among others, thermal expansion [
15].
Hwang et al. have shown that a reduction in the value of the coefficient of thermal expansion is possible when copper particles are introduced into the ABS specimens [
16]. For example, for a content of 50 wt.% of copper, the coefficient of thermal expansion decreases by about 29.5% compared to the value of the same coefficient valid for pure ABS, which means a decrease in the coefficient of thermal expansion from 108.2 ppm/°C to 76.2 ppm/°C. This way, the test samples’ significant deformation during thermal shrinkage is avoided.
The anisotropic character of the thermal expansion was highlighted by Baker et al. [
17]. They compared the values of the coefficient of thermal expansion for test pieces printed along with longitudinal and transverse directions.
A relatively simple device has been proposed to allow direct observation of the spiral polymeric test samples during thermal or negative thermal expansion. This paper presents the research results to highlight the thermal expansion of spiral test parts made by the 3D printing of four different polymeric materials (styrene-butadiene acrylonitrile, polyethylene terephthalate, thermoplastic polyurethane, and polylactic acid). The experimental results were mathematically processed, and empirical mathematical models corresponding to the thermal contraction of the test samples were determined.
2. Materials and Methods
2.1. Initial Considerations
In principle, it is considered that thermal expansion can be explained by the asymmetry of the potential energy, which determines an increase in the mean distance between atoms when the atoms vibrate along the line of interaction between them. However, non-vibrational contributions to the development of the thermal expansion process have also been highlighted [
18].
When increasing the body temperature from a value
θ1 to a value
θ2, the magnitude Δ
L of the thermal expansion of the body of length
L0 is determined by using the relation:
or:
where
α is the coefficient of linear thermal expansion, and Δ
θ is the temperature variation.
Consistent with the above equation, the values of the coefficient of linear thermal expansion
α correspond to the following relation:
It is still possible to investigate the thermal expansion of the volume of a body. In this case, the volume thermal expansion coefficient
β is valid:
where
V0 is the initial volume of the body, and Δ
V—the increase in body volume.
In most cases, the value of the linear expansion coefficient is important.
Devices called dilatometers, or dilatation analyzers, are used to determine the thermal expansion coefficients’ values experimentally. Pushrod dilatometers using optical interferometry or X-ray diffraction, optical dilatometers, capacitance dilatometers, etc., are known. A mention shall be made about horizontal and vertical dilatometers, respectively, concerning the position of a rod made of a material whose coefficient of thermal expansion is determined. In principle, when the temperature of a rod in the investigated material increases, the displacement of the edge of one end of the rod is determined using suitable optical means.
The expansion of the use of polymeric materials has led to the need to know some characteristics of the behavior of parts made of such materials to temperature variation. Manufacturers of polymeric materials generally provide brief information on the expansion properties of these materials. In industrial practice, there is sometimes the problem of more detailed knowledge of the thermal expansion of a body of polymeric materials at different temperatures.
On the other hand, the last decades have highlighted the possibilities of obtaining polymer parts of various shapes and sizes.
Under the conditions mentioned above and to design and materialize an easily accessible dilatometer, the idea of increasing the length of the bar in the material whose thermal expansion is of interest was formulated using a polymer test sample in the shape of an Archimedean spiral. It was accepted that, among the different categories of spirals, the Archimedean spiral ensures a maximum length of the test sample within a flat surface of predetermined dimensions.
Using a spiral-shaped test sample located in a spiral-shaped groove and allowing the spiral to elongate only in the direction of the outer end of the spiral test sample, the length of the test sample whose thermal expansion is to be measured could be increased (
Figure 1). In this way, it would be possible to increase the accuracy of assessing the value of the linear thermal expansion coefficient due to considering the longer length of the test sample.
2.2. Experimental Conditions
Under the theoretical conditions mentioned above, a device has been designed to measure the thermal expansion of a spiral-shaped polymer test sample (
Figure 1).
A groove in the shape of an Archimedean spiral was machined by milling on a numerically controlled machine tool [
19]. An essential part of the device was an aluminum alloy plate. The outer end of the spiral groove is provided with a rectilinear segment. Inside the groove with a cross-section of 1.8 × 2.3 mm
2, a polymeric test sample can be placed, having a shape corresponding to that of the groove in the aluminum alloy plate, providing a lateral gap of about 0.03 mm. A transparent material cover can be placed over the aluminum alloy plate and fixed to the plate with screws to avoid the external deformation of the test sample during thermal expansion.
The aluminum alloy from which the plate was made was of the EN-AW-2017 type AlCu4MgSi(A) alloy and contained 0.2–0.8% Si, 0.70% Fe, 3.5–4.5% Cu, 0.4–1.0% Mn, 0.4–1.0% Mg, 0.10% Cr, 0.25% Zn, 0.25% Ti, 0.05% other chemical elements and the rest—aluminum. As values of the main thermal properties of the aluminum alloy, it can mention solidification temperature 510 °C, melting temperature 645 °C, heat transfer capacity 873 J∙kg−1∙K−1, thermal expansion coefficient 22.9 µm∙m−1∙K−1, thermal conductivity 134 W∙m−1∙K−1.
The free end movement from outside the spiral test sample in the rectilinear segment could be highlighted using a dial gauge (
Figure 1). However, it was appreciated that a higher accuracy would be obtained using an optical microscope. The microscope objective was fixed near the outer end of the linear segment of the test sample (
Figure 2).
Regarding the proper way of measuring the variation of the length of the test sample, the cooling of the test sample in a freezer was first considered. The aluminum alloy plate, together with the test sample, could be removed from the freezer and placed in the working area of the optical microscope so that minute-by-minute measurements of the thermal expansion of the test sample could be performed. Therefore, the temperature of the aluminum alloy plate and the polymeric test sample could be measured using a gun-type infrared thermometer, which measures the infrared radiation emitted by a given surface. A non-contact infrared thermometer (manufactured by HOPPLINE—Hungary) was used for this purpose, with a measuring range between −50 °C and +400 °C (measuring distance of 5–15 cm, measuring accuracy of ±1.5 °C).
The approximate distance from which the temperature was measured using the infrared thermometer was about 15 cm. Since the process of heat exchange between the aluminum alloy plate together with the spiral test piece and the external environment does not develop with the same intensity in all directions, the aluminum alloy plate temperature has different values at different points of the aluminum plate and, therefore, the average values of three measurements were considered.
The temperature evaluation of the aluminum plate was performed at 1-min intervals, determined by using a digital clock with a stopwatch (approximate time measurement accuracy of ±5 s). In the calculations, the average values of the measured temperatures were taken into account. As observed by using the finite element method and by measuring the temperature in different areas of the aluminum alloy plate, there are temperature differences, even when heated on the table of the 3D printer.
The following materials were considered as materials for the spiral test samples:
- (1)
Black ABS (styrene-butadiene acrylonitrile). This material is used, for example, for the manufacture of general-purpose goods, such as toys, carcass parts, furniture, refrigerator interiors, helmets, etc.;
- (2)
Red PET G (polyethylene terephthalate type G). Such material is used mainly in the textile industry, but also as a bottling or packaging material due to the lack of reaction with water or food;
- (3)
Red color thermoplastic polyurethane (trade name: Flexfill 98A). This material has a hardness equal to that of rubber (98A). It is used especially in the manufacture of solid wheels for scooters and skateboards or in the manufacture of protective cases of smartphones;
- (4)
Polylactic acid (type T PLA) silver color. This material is well adapted to the requirements of 3D printing processes. Its use in 3D printing does not require a heated substrate or a high melting temperature and increases the printing speed. It also ensures low manufacturing costs. A disadvantage is the increased sensitivity to the action of ultraviolet radiation. Parts with fine details can be easily made from polylactic acid. This material can be used to manufacture toys, jewelry, statues, etc.
The coefficient values of thermal expansion of these materials indicated in some specialized works can be observed in the second column of
Table 1.
The thermal expansion of the polymer test sample from a temperature of about −9 °C (when it was removed from the freezer) to a temperature close to that of the environment in the laboratory, 13 °C) was thus measured using an optical microscope TM-1005B (manufactured by the Japanese company Mitutoyo.
2.3. Evaluation of the Length of an Archimedean Spiral Test Sample
There are different ways to determine the length of an Archimedes spiral segment [
22]. The length of the test sample in the form of an Archimedean spiral was calculated using the “Measure” function in the SolidWorks software. The lengths of the two side surfaces of the profile (with a rectangular cross-section, measuring 1.8 × 2.3 mm
2) were measured. The arithmetic mean of the lengths of the two side surfaces was calculated, resulting in an average fiber length of 3337.63 mm.
A problem with the device is that during the thermal expansion or contraction of the polymer spiral test sample, not only the spiral test sample expands or contracts but also the aluminum alloy plate in which the spiral groove the test sample is placed.
It is generally considered that the value of the coefficient of thermal expansion in the case of a metallic material is about ten times lower than that of a polymeric material. Specifically, in the case of aluminum alloy, the value indicated of the coefficient of thermal expansion is αAl = 22.9 m/(m∙K), while, for example, in the case of the PLA polymer is indicated αPLA = 41 ∙ 10−6 m/m∙K, and in the case of the ABS polymer, αABS = 72 ∙ 10−6 m/(m∙K).
Suppose it takes into account that the size of the side of the square-shaped area of the aluminum alloy plate in which the spiral groove is located is about 128 mm, and assuming a temperature difference of 40 °C, this means a linear variation of the size of the aluminum alloy plate side:
Taking into account a length L ≈ 3337.63 mm of the spiral test sample in PLA and, respectively, in ABS and considering the values indicated for the coefficients of thermal expansion [
20,
21], it would be possible to increase the length of the spiral test sample Δ
LPLA = 5.47 mm and Δ
LABS = 9.61 mm. It is found that the share
w of the influence of the linear expansion of the aluminum alloy plate on the thermal expansion of the spiral test sample is very low (
w = 0.1172 ∙ 100/5.47 = 2.14% in the case of the spiral test sample made of PLA and
w = 0.1172 ∙ 100/9.61 = 1.21% in the case of the ABS spiral test sample, respectively. This situation allows us to neglect the influence exerted by the linear thermal expansion of the aluminum alloy plate on the thermal expansion of the spiral test sample of polymeric material.
2.4. Simulation by the Finite Element Method of the Thermal Expansion of the Test Piece
The investigated process was modeled using the finite element method (FEM) and the ANSYS 3D software to evaluate the thermal expansion capacity of the spiral test samples of polymeric materials used in manufacturing parts by 3D printing. For the purpose mentioned above, the situation of a spiral test sample located in the spiral-shaped groove in the aluminum alloy plate was considered.
One of the results of finite element modeling is shown in
Figure 3. The experimental tests will manage an uneven cooling or heating of the aluminum alloy plate. Due to heating or cooling at uneven speeds of different areas of the aluminum alloy plate where the polymer spiral test sample is located, there will be a distributed variation in temperature along with the spiral test sample. The value of the thermal expansion coefficient is variable with the temperature of the polymer spiral test sample. This means that the results will lead to an overall value of the evolution of the magnitude of the thermal expansion coefficient or negative thermal expansion coefficient.
It was developed a steady-state thermal FEM analysis considering the convection phenomena. Approximate convection coefficient values for aluminum alloys were confronted with those presented by Geng et al. [
23]. It has conducted the analyses on ABS simulating the heat transfer for the cool environment, which starts from around −10 ° C and records about 13 °C on the top side of the cover plate (
Table 2). The results are consistent with those measured by experimental means (
Figure 3a). The FEM.-based purpose was to analyze further heat transfer on the spiral test sample by transferring steady-state thermal results into the static structural analysis. Results were plotted in the form of thermal strain, equivalent stress von Mises, equivalent elastic strain, and directional deformation in the direction of the heat flow. Thus, it may further visually assess the influence of heat transfer on various polymers. For example, it was clear that uneven cooling leads to a random distribution in the case of equivalent elastic strain (
Figure 3b). The spiral undergoes multiple stages of deformation before it shrinks or expands in the designated groove. Static structural results highlight changes that occur to the original body. Directional deformation on the
Y-axis gives approximate values to those obtained by experimental means.
The initial conditions for steady-state thermal analysis include an initial ambient temperature of 22 °C and a temperature of −13.1 °C applied in increments on the lower surface of the plate, respectively. A process of free air convection of up to 2.5 W/mm2 °C applied to the upper surface of the plate was considered. The boundary conditions took into account both the contacts and the joints. The contacts are of three types, two of which include the frictionless thermal expansion of the 3D printed spiral and one that takes into account the friction between the spiral test sample and the groove walls. The joints refer to the spiral’s contact with the groove’s flat surface. Such conditions make it easier for the software to consider the material must flow only along the spiral groove.
The thermal imaging camera HT-18 (produced by Hti Instrument) was used to check the uneven heating of the aluminum plate on the table of the 3D printer. As it can be seen from
Figure 3c, the image obtained by using the thermal imaging camera shows a real unevenness in the heating of the aluminum plate under the action of the table of the 3D printer. This uneven heating of the aluminum plate results in an uneven distribution of the spiral test sample temperature.
3. Results
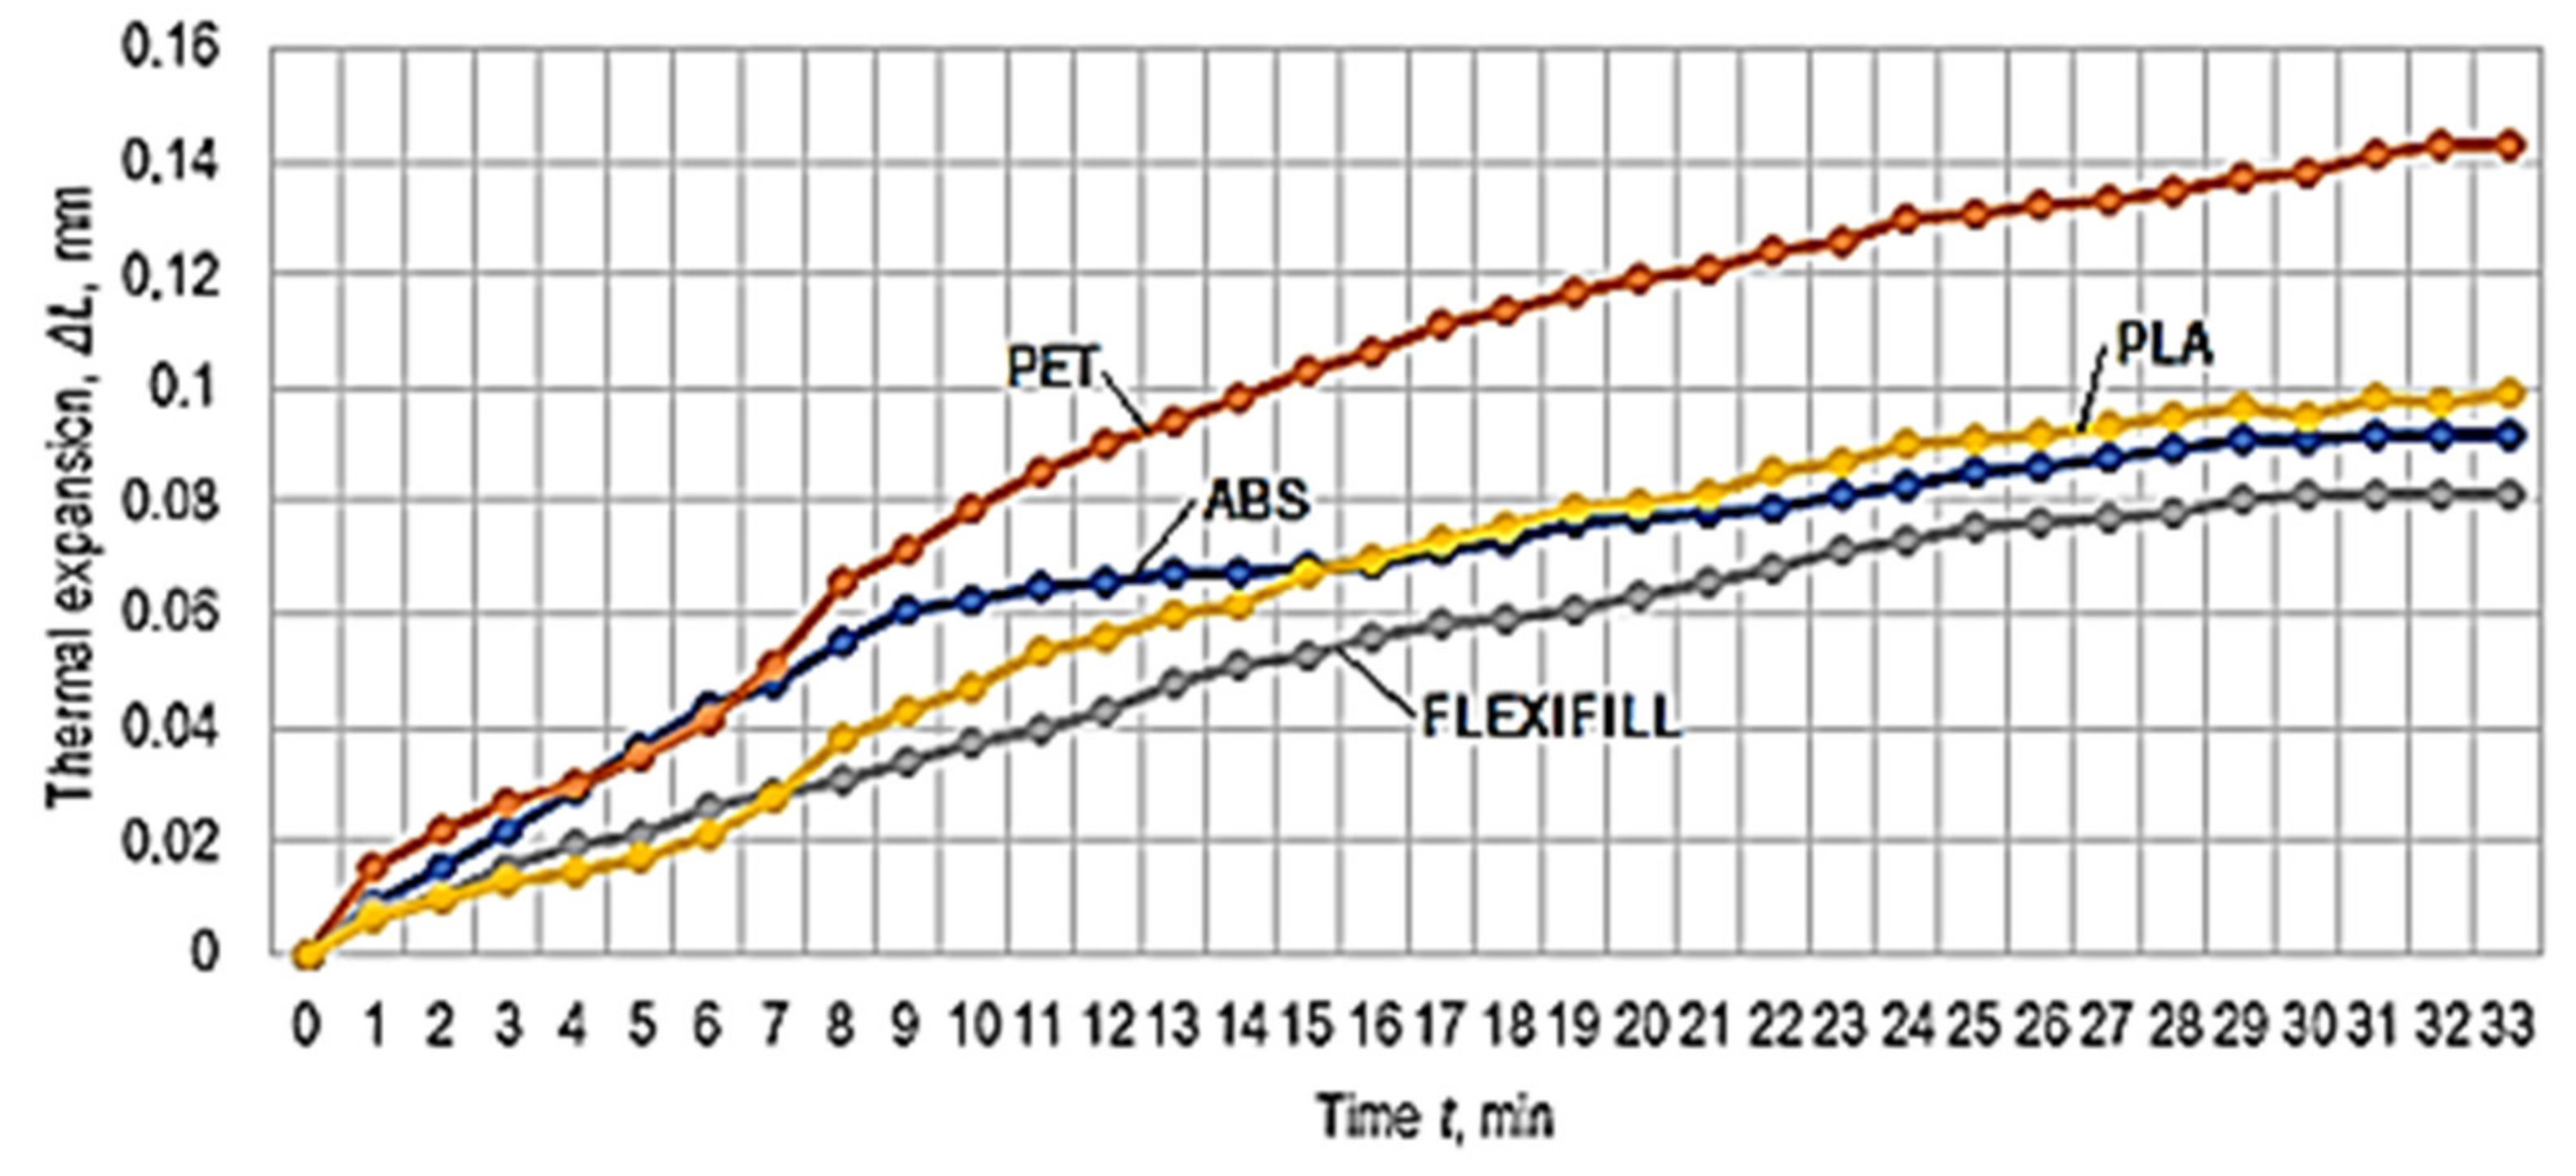
The results obtained in the experimental tests regarding the thermal expansion of the test samples made of the four materials are presented in
Table 2. A graphical representation of the Δ
L increase in the lengths of the test samples made of polymeric materials when the temperature increases from approximately −9 °C to +13 °C and corresponding to the experimental results in
Table 2 can be observed in
Figure 4.
Later, the idea of measuring the linear negative thermal expansion of the test samples appeared. The heating of the aluminum alloy plate on the table of a 3D printer was considered (
Figure 5). In such a case, the temperature of the upper area of the table can be programmed, this being an input factor in the 3D printing process. Thus, measurements of the negative thermal expansion were performed when the test sample cooled, from a temperature of 70 °C to the ambient temperature in the laboratory (30 °C), during the measurements. The measurement results of the test samples shrinkage are included in
Table 3. By considering the results in
Table 3, a graphical representation of the evolution of negative thermal expansion over time was made (
Figure 6).
The results of measurements on the thermal expansion of the previously polymer spiral test sample in the freezer can be seen in
Table 2. In contrast, the results of the thermal shrinkage of the polymer spiral test sample previously heated on the table of a 3D printer were included in
Table 3.
The values indicated in
Table 4 were determined by comparing the maximum values of thermal expansion and negative thermal expansion, respectively, at the temperature variation intervals in the case of experimental research.
For the experimental results in
Table 4, which show more pronounced differences in terms of negative thermal expansion for the four materials used in the experimental research, mathematical processing was used by means of specialized software [
24], to determine empirical mathematical models able to highlight the influence of temperature on linear negative thermal expansion.
The specialized software was generated by taking into account the least squares method. It provides conditions for selecting the most appropriate empirical mathematical model from five such models: the first-degree polynomial, the second-degree polynomial, the power function, the exponential function, and the hyperbolic function. For the selection, the value of the so-called Gauss criterion was used. This value (the Gauss’s criterion value) is defined using the sum of the squares of the differences between the ordinate’s values determined by the empirical mathematical model considered and the values determined experimentally. The lower the value of the Gauss criterion, the more appropriate the mathematical model is to the experimental results used.
The most appropriate empirical mathematical models determined using specialized software, and the models determined were included in the second column of
Table 5.
4. Discussion
In many situations in manufacturing engineering, empirical mathematical models of the power function type have been determined and used. Such empirical mathematical models are sometimes used to determine the influence of various factors on the cutting speed, the size of the components of the cutting forces, the size of a roughness parameter of the machined surface, etc. [
25,
26,
27]. An advantage of using empirical mathematical models of power function type derives from the possibility of evaluating the intensity of the influence exerted by a certain factor by analyzing the value of the exponent attached to that factor in the function of power type to the values of exponents attached to other factors. However, empirical mathematical models of the power function type are particularly appropriate when dealing with monotonous evolutions of the output parameter as the value of the input factor increases or decreases in the investigated process. Such a situation, i.e., the lack of minimums or maximums, was confirmed, for example, by the graphical representation in
Figure 5, where there is a continuous increase in thermal expansion when the temperature increases by heating the spiral test samples. For this reason, power function empirical mathematical models for the four polymeric materials were also determined, and those models can be seen in the second column of
Table 5.
By considering the values of temperatures and thermal expansions or negative thermal expansions in
Table 2 and
Table 3, it was possible to determine the values of the coefficients of thermal expansion corresponding to each of the four materials used to make the spiral test samples. Some aspects of calculating the coefficients of thermal expansion coefficients starting from the experimental values and Equation (3) are presented in
Table 5.
The graphical representations in
Figure 4 and
Figure 6 have been elaborated considering the experimental results in
Table 2 and
Table 3. In the case of the graphical representation in
Figure 3, there is a certain reversal of the thermal expansion values in the cases of ABS and PLA polymeric materials for the period from the beginning of heating. Subsequently, with the development of the expansion process, it is found that the thermal expansion of PLA exceeds that of ABS.
A clearer highlight of the differences between the negative thermal expansion of the spiral test samples in the two materials is provided by the content of the graphical representation in
Figure 7, which confirms the order defined by the results recorded for longer time intervals than those in the case of the diagram in
Figure 4.
The most appropriate empirical mathematical models for the experimental results were used to draw the graphical representation in
Figure 7. The descending order of the intensity of the influence exerted by the cooling process on the negative thermal expansion can be noticed in this diagram, where polymeric materials are arranged, from this point of view, in the order: polyethylene terephthalate (PET)—polylactic acid (PLA)—styrene-butadiene acrylonitrile (ABS)—thermoplastic polyurethane (Flexfill).
As seen from
Table 3, at the beginning of the experiment, heating the aluminum alloy plate and the test samples on the table of the 3D printer, was made on a temperature of 70 °C.
To reduce the friction between the spiral test samples and the spiral groove walls, a thin layer of mineral oil-based lubricant was applied to the support plate before the insertion of the test samples, both when applying the thermal expansion or negative thermal expansion.
In a cross-section, the profile of the spiral test samples made of the four materials has the shape of a rectangle with sides of 1.8 mm and 2.3 mm. The test sample width was 1.8 mm (value measured at a temperature of 22 °C). After the insertion of the spiral test sample in the groove with the shape of an Archimedean spiral, the lateral clearance between the test sample and the groove was about 0.03 mm, at a temperature of 22 °C.
Comparing the maximum values of thermal and negative thermal expansion, respectively, at the temperature variation intervals in the case of experimental research, we reach the values indicated in
Table 4.
Comparing the results obtained experimentally with the values indicated in other works shows that the determined coefficients of thermal expansion were lower (
Figure 8).
Possible explanations for this could be the following:
- -
There are, of course, differences between the properties of a part made by 3D printing and the properties of the bulk material. Due to the characteristics of the 3D printing manufacturing process, the material density of the 3D printing test sample may be much lower than in the case of bulk material. This could be the main cause of the relatively large differences between the values of the coefficients of linear thermal expansion indicated by the materials manufacturers or identified in specialized documents and the values determined experimentally using the proposed equipment. It should be noted that the values of the coefficients of thermal expansion determined experimentally were lower than those of the coefficients of linear expansion indicated by the manufacturers of the materials or identified in specialized documents in the case of all four materials;
- -
The thermal expansion way of the spiral sample is different from that of a strictly linear test sample;
- -
The relatively small gap between the spiral test sample and the spiral groove in the aluminum alloy plate could lead to frictional forces along the relatively long length of the spiral test sample, and these forces diminish the free expansion of the test sample;
- -
The existence of roughness resulting from the spiral groove as a result of the spiral groove generation by milling could also contribute to a braking of the free thermal expansion;
- -
A possible gap at the end of the test sample inside the spiral groove could also reduce the thermal expansion or the negative thermal expansion measured at the end of the segment in the form of a straight line of the spiral test sample.
A certain adjustment of the density of the material of the test sample made by 3D printing is possible by acting on a size that provides some information about the printing process and is called “infill”. It must still be taken into account that the density of the test sample material is not uniform, being higher near the outer walls and lower inside the test sample, where there may even be gaps of different sizes. There are, moreover, other print parameters of the printer whose values can change the density of the printed material and therefore can affect the values of the coefficient of thermal expansion. As such, it is expected that there will be a difference between the values of thermal expansion determined using a dilatometer and the proposed equipment, respectively, as long as the dilatometer indicates the value of the linear thermal expansion and the proposed equipment—the thermal expansion along a flat spiral.
Such issues may be further examined in the future to determine their influence on the final results on the values of the coefficients of expansion.
References to the coefficient of linear thermal expansion exist in ASTM E831, ASTM D696, and ISO 11359. These documents describe the test procedure valid for thermomechanical analysis when aiming at linear expansion of the test sample. As this paper aims to expand along a spiral and uses the equipment for such testing, only a few of the provisions included in the above standards could be met, including considering the equipment available for conducting experimental research.
Some aspects that may lead to differences between the results of determining the coefficient of thermal expansion using the proposed equipment and a dilatometer, respectively, have been briefly presented above. In the case of thermomechanical analysis and the use of a dilatometer, the test sample must be 12.7 mm (0.5″) wide and 75 mm (3″) long. The end surfaces of the test sample must be flat. Together with the support on which it is placed, the test sample is introduced into heating equipment and a gradual increase in temperature takes place, with a predetermined heating rate (for example, 10 °C/min) and in a temperature range default (for example, from −30–+30 °C). This ensures conditions for a controlled and as uniform heating as possible of the test sample. In the case of the proposed equipment, simple and accessible heating sources were used, but which do not allow slow and uniform heating of the spiral test sample. Additionally, the existence of a gap between the spiral test sample and the groove in the aluminum plate could affect to some extent the final result, as the thermal expansion of the aluminum plate exerts a certain influence on the value of the determined coefficient of expansion.


 ,
, 


