
Partially Ordered Lanthanide Carboxylates with a Highly Adaptable 1D Polymeric Structure


Abstract
:
1. Introduction
2. Materials and Methods
3. Discussion
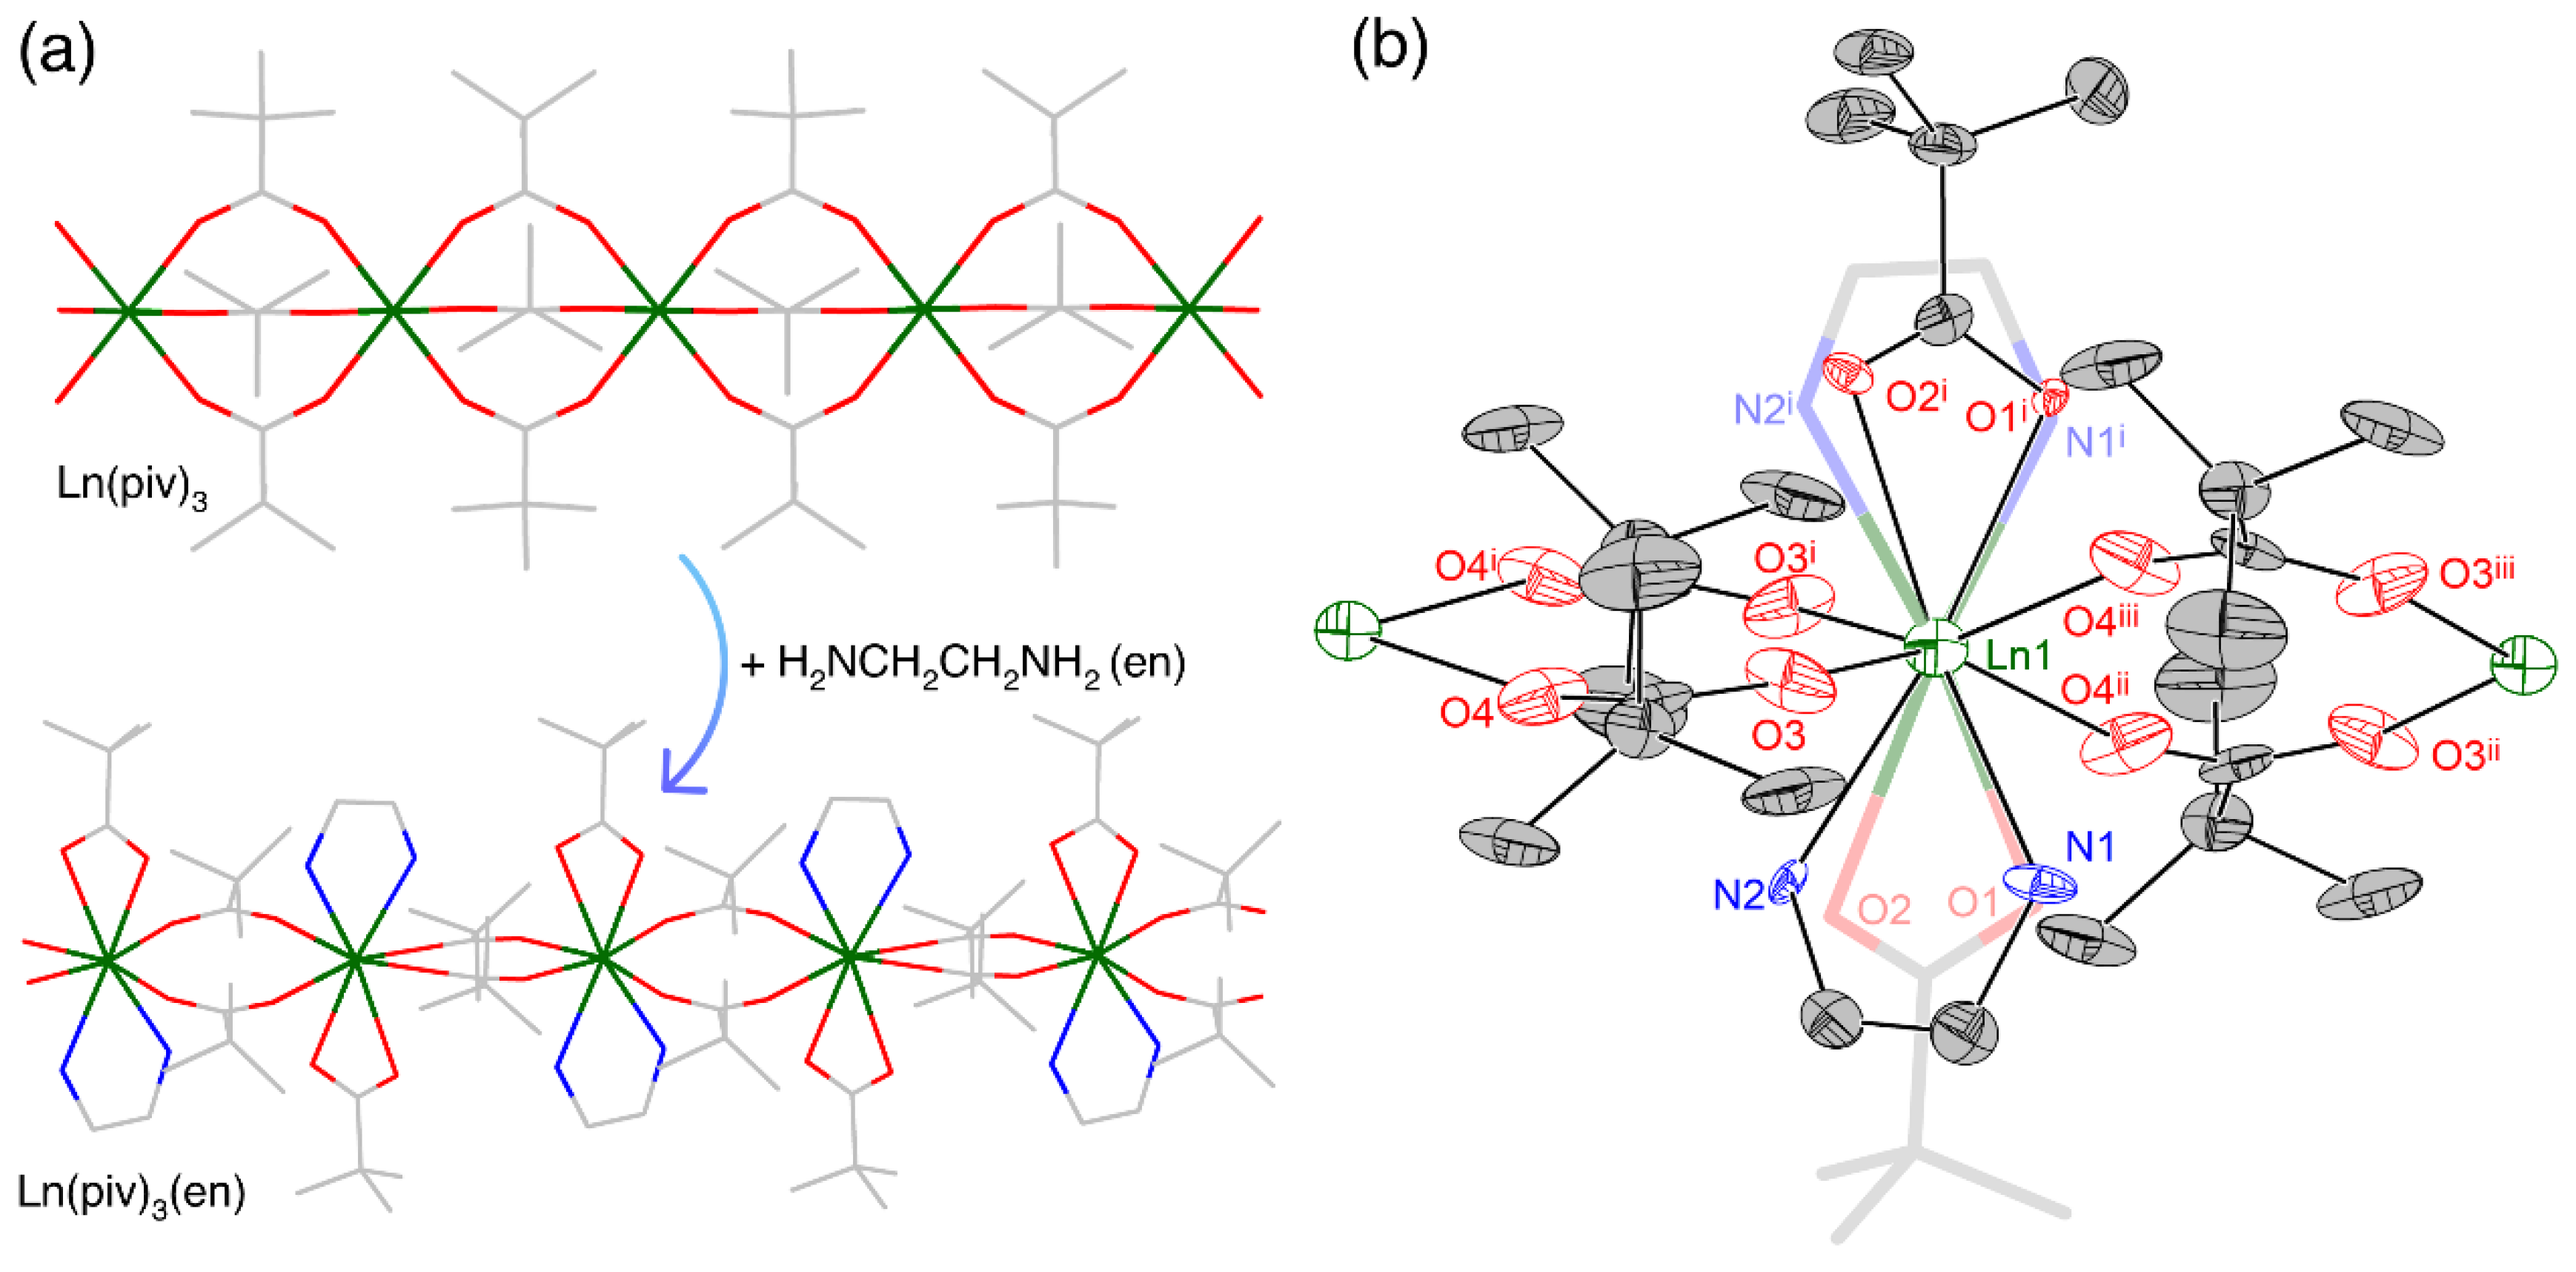
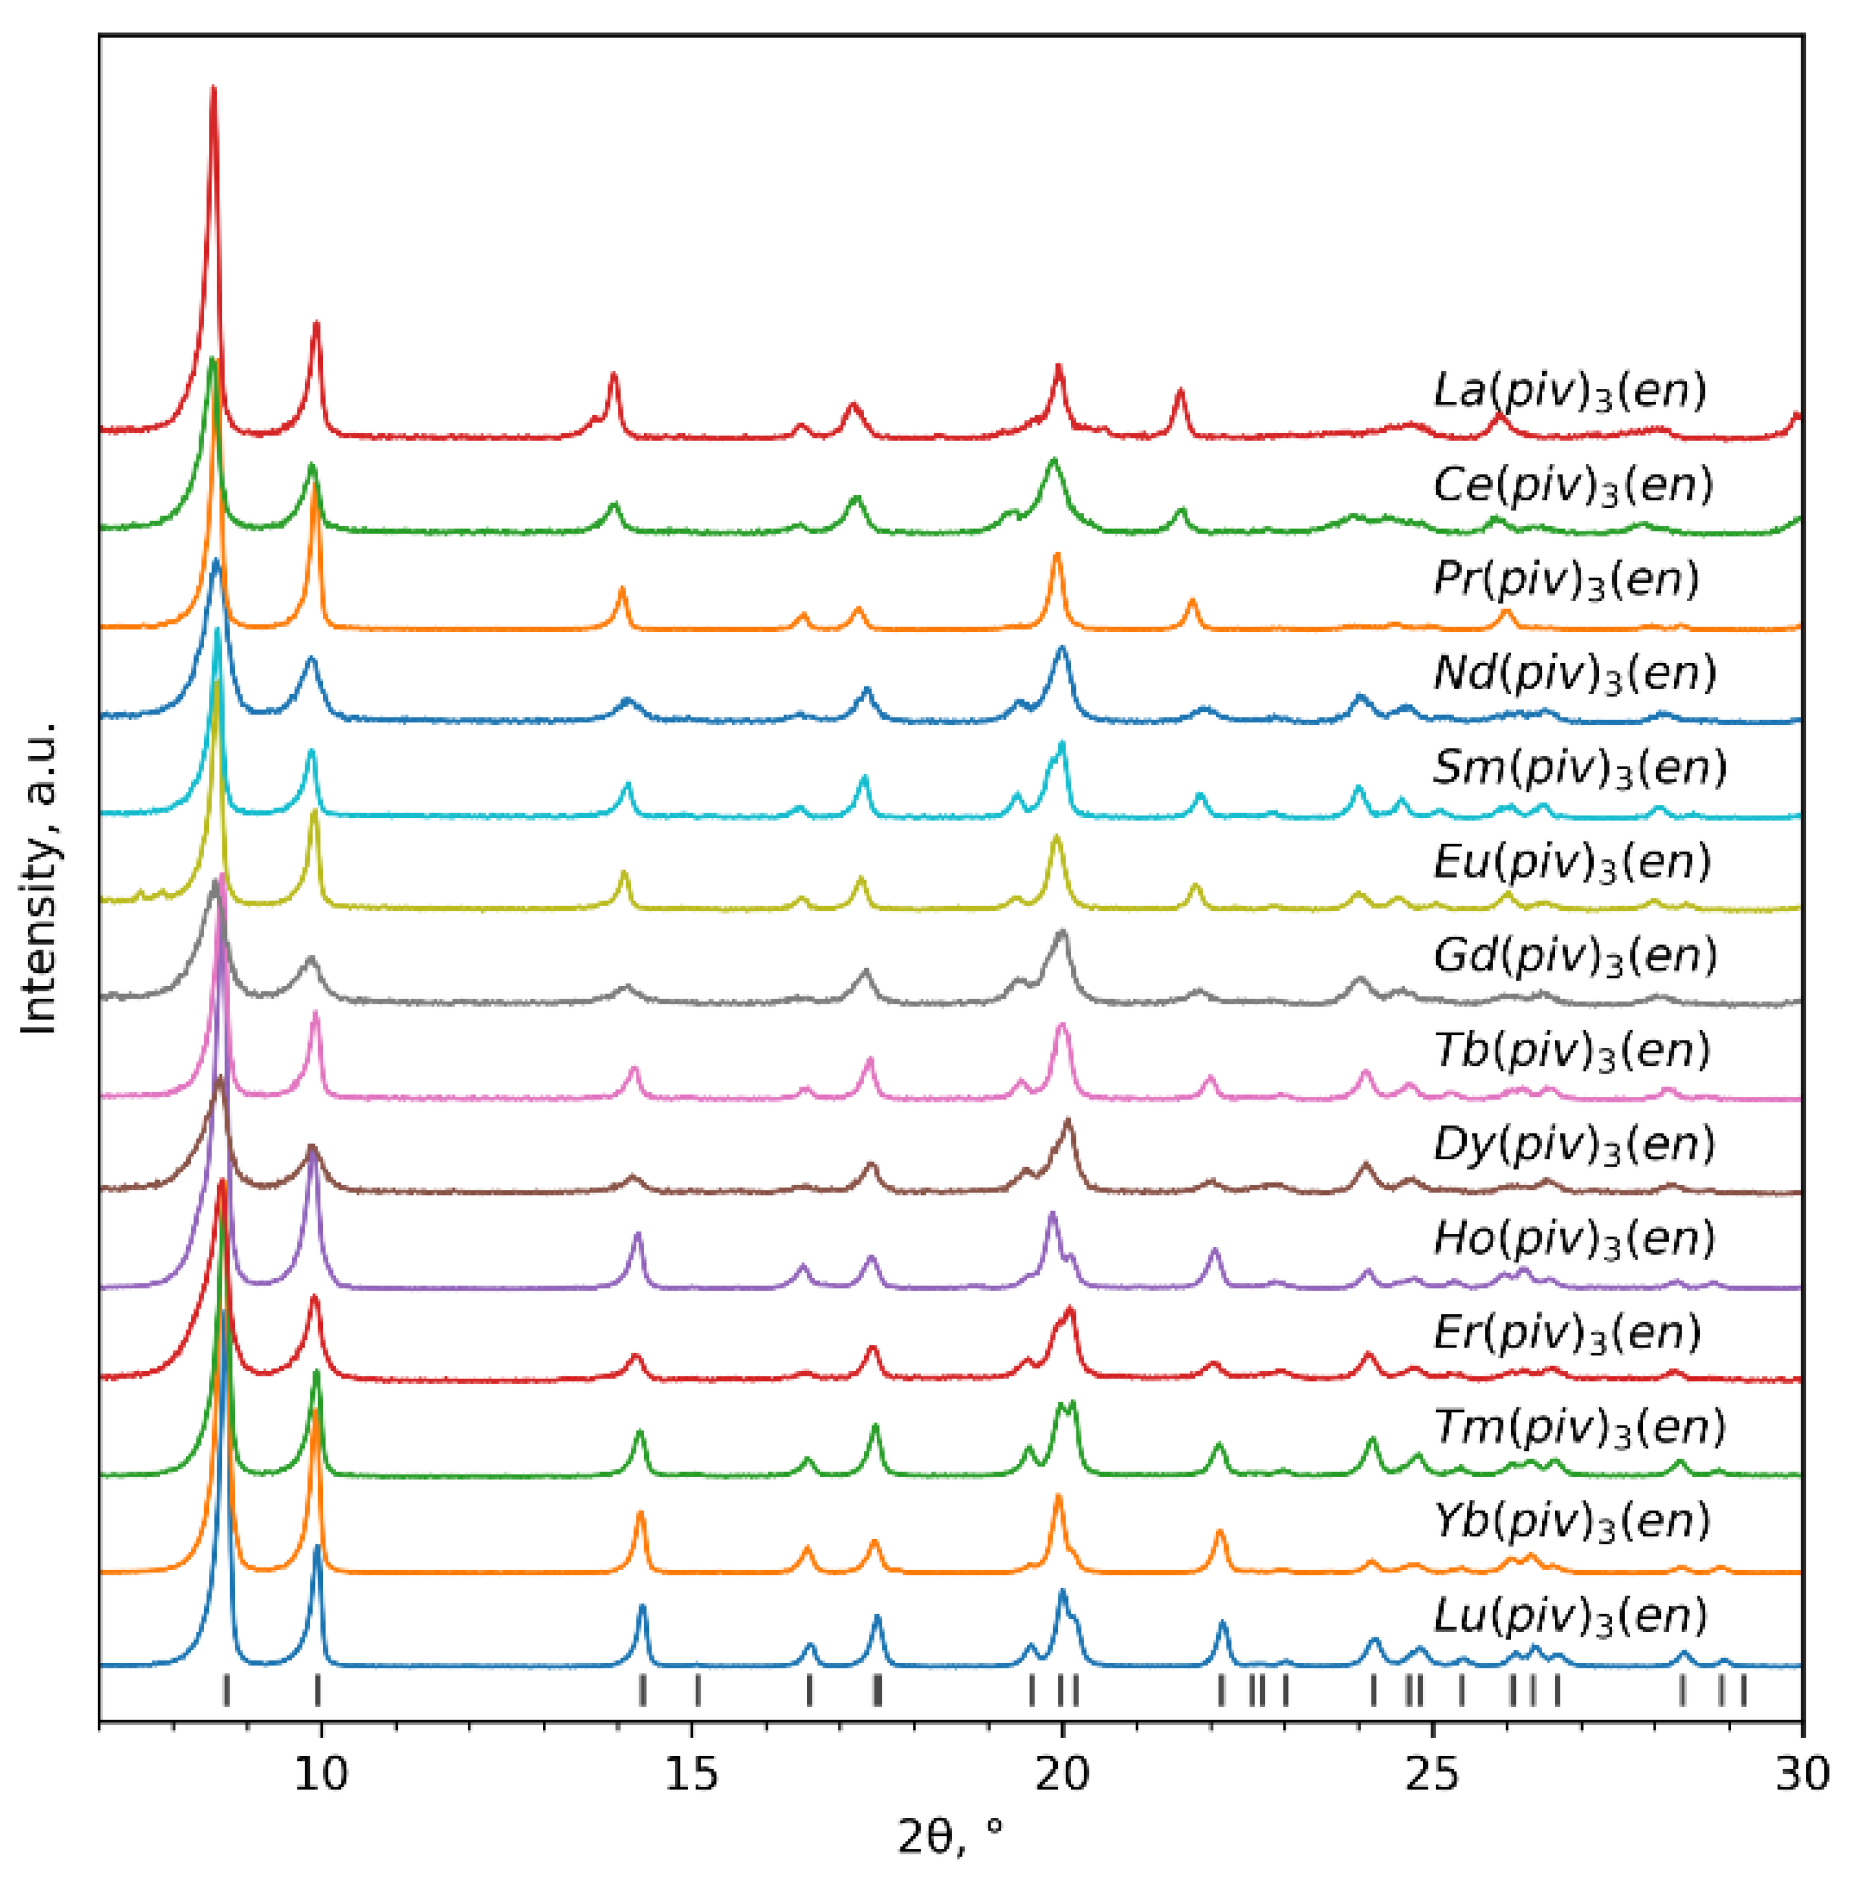
3.1. Synthesis
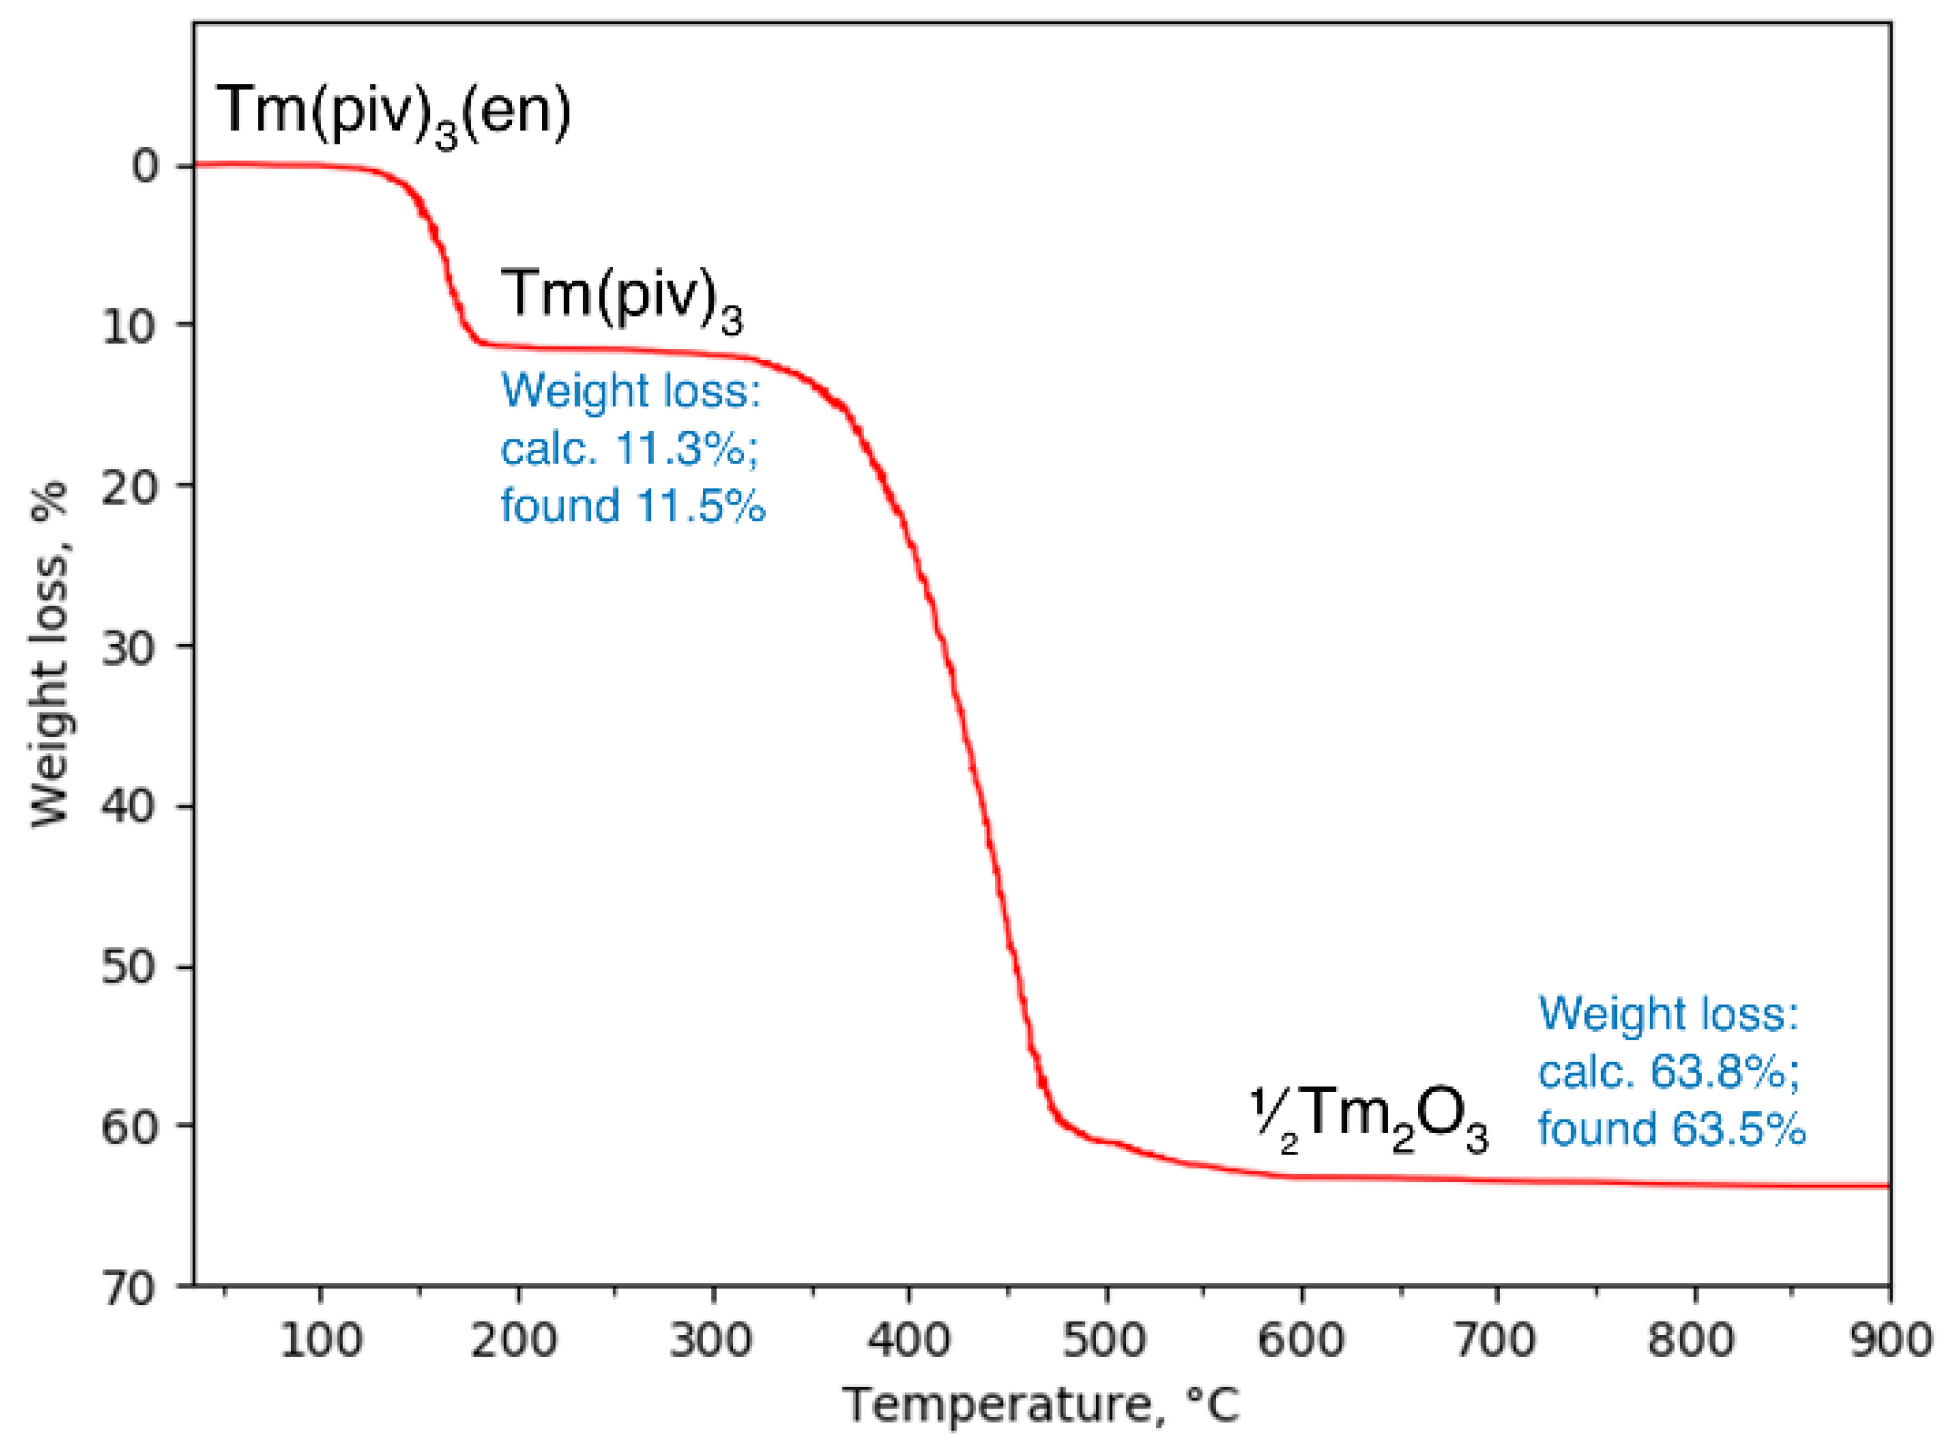
3.2. Thermal Behavior
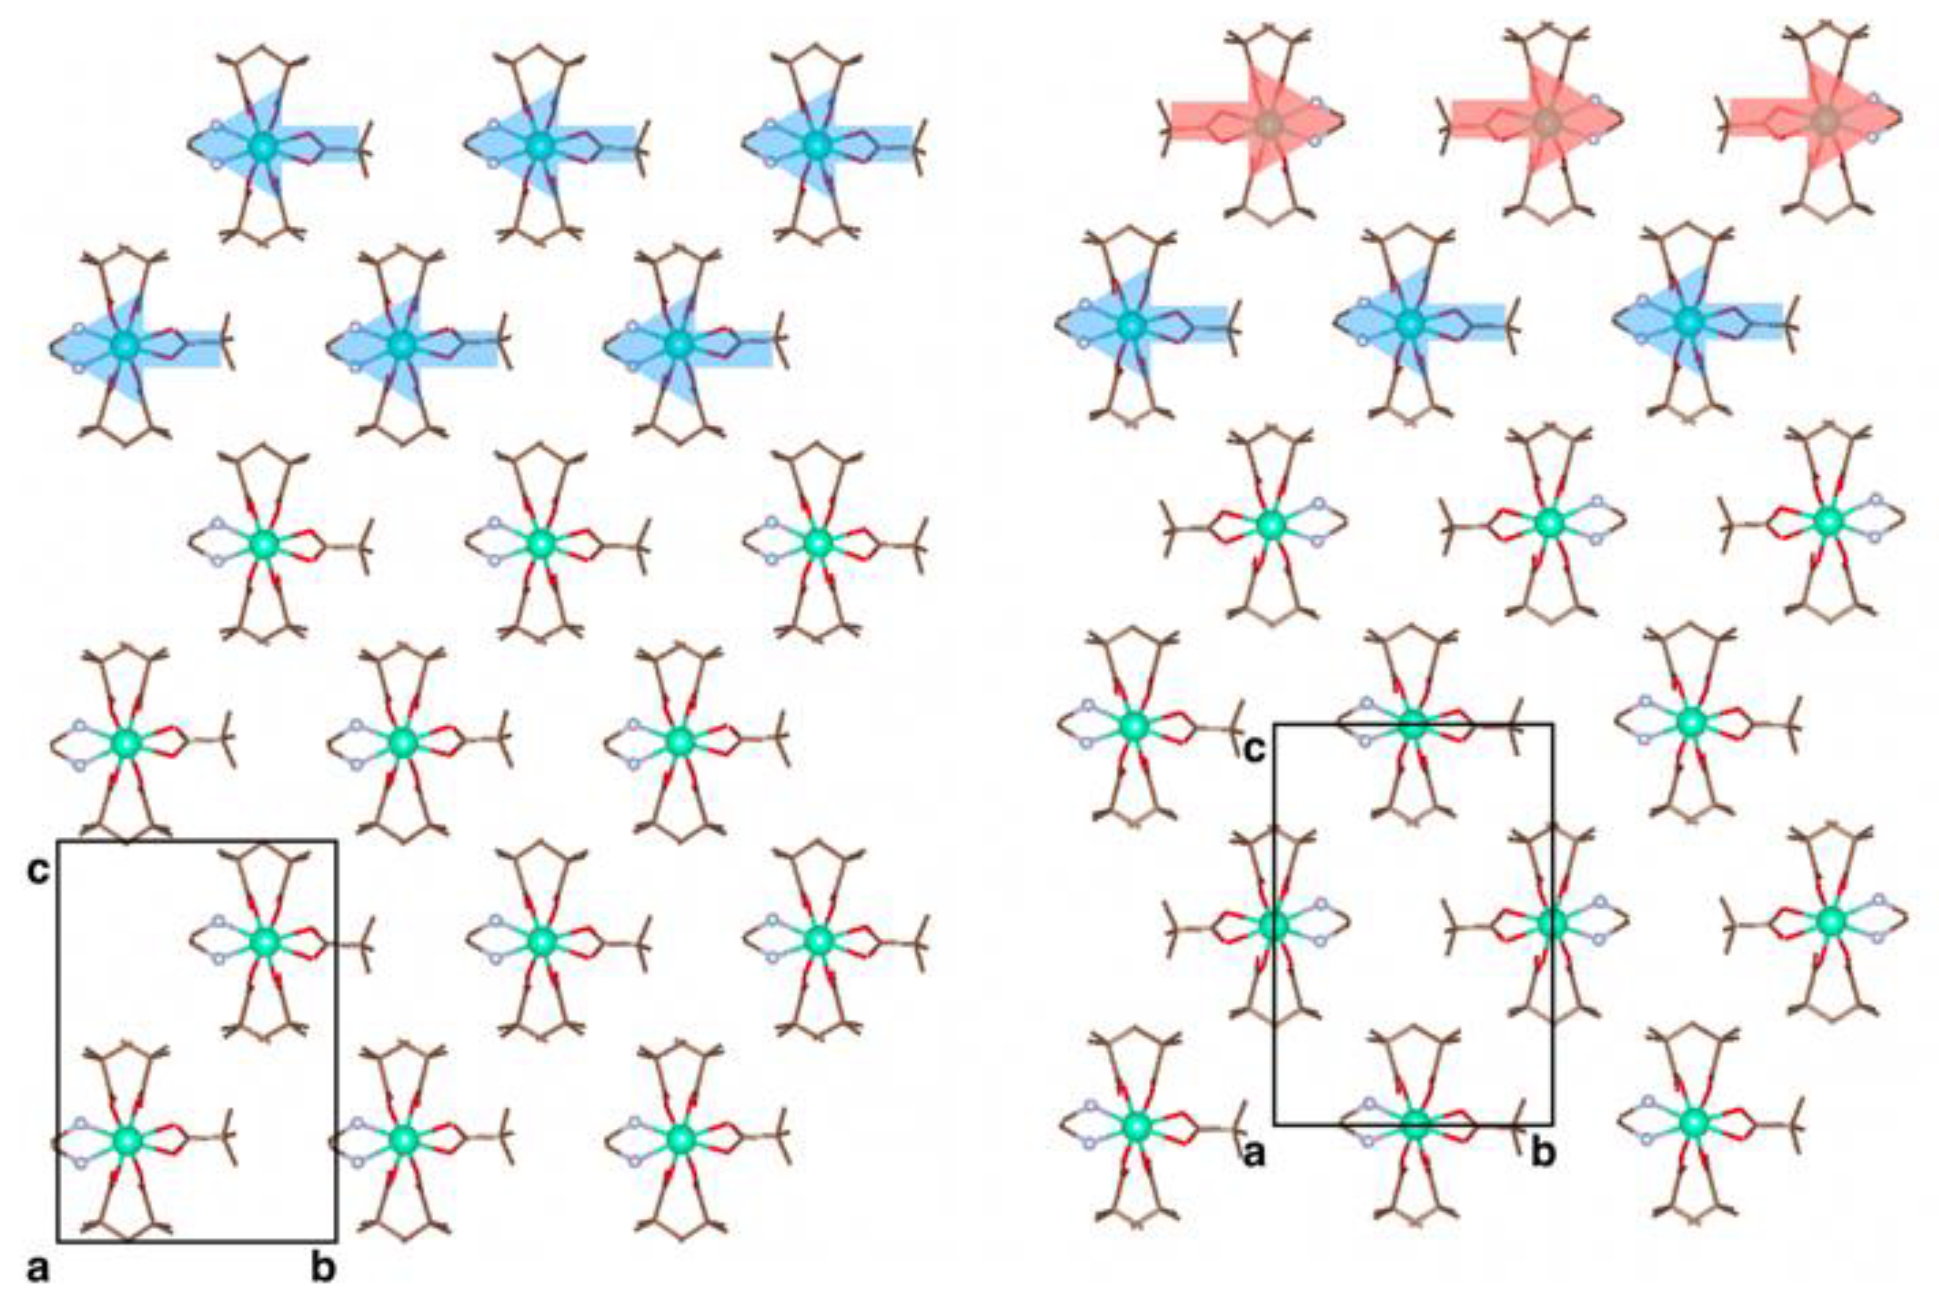
3.3. X-ray Crystallography
3.4. Periodic DFT Calculations
3.5. Bonding Analysis
3.6. Luminescent Thermometry
4. Conclusions
Supplementary Materials
Author Contributions
Funding
Institutional Review Board Statement
Informed Consent Statement
Data Availability Statement
Acknowledgments
Conflicts of Interest
References
- Loukopoulos, E.; Kostakis, G.E. Review: Recent Advances of One-Dimensional Coordination Polymers as Catalysts. J. Coord. Chem. 2018, 71, 371–410. [Google Scholar] [CrossRef]
- Pagis, C.; Ferbinteanu, M.; Rothenberg, G.; Tanase, S. Lanthanide-Based Metal Organic Frameworks: Synthetic Strategies and Catalytic Applications. ACS Catal. 2016, 6, 6063–6072. [Google Scholar] [CrossRef]
- Lammert, M.; Wharmby, M.T.; Smolders, S.; Bueken, B.; Lieb, A.; Lomachenko, K.A.; De Vos, D.; Stock, N. Cerium-Based Metal Organic Frameworks with UiO-66 Architecture: Synthesis, Properties and Redox Catalytic Activity. Chem. Commun. 2015, 51, 12578–12581. [Google Scholar] [CrossRef]
- Alzamly, A.; Bakiro, M.; Hussein Ahmed, S.; Alnaqbi, M.A.; Nguyen, H.L. Rare-Earth Metal–Organic Frameworks as Advanced Catalytic Platforms for Organic Synthesis. Coord. Chem. Rev. 2020, 425, 213543. [Google Scholar] [CrossRef]
- Zhou, H.-C.; Timofeeva, T.V.; Brown, C.; Xu, H.; Daemen, L.L.; Liu, Y.; Luo, J.; Zhao, Y.; Ma, S. Hydrogen Adsorption in a Highly Stable Porous Rare-Earth Metal-Organic Framework: Sorption Properties and Neutron Diffraction Studies. J. Am. Chem. Soc. 2008, 130, 9626–9627. [Google Scholar] [CrossRef]
- Xue, D.X.; Cairns, A.J.; Belmabkhout, Y.; Wojtas, L.; Liu, Y.; Alkordi, M.H.; Eddaoudi, M. Tunable Rare-Earth Fcu-MOFs: A Platform for Systematic Enhancement of CO2 Adsorption Energetics and Uptake. J. Am. Chem. Soc. 2013, 135, 7660–7667. [Google Scholar] [CrossRef] [PubMed]
- Kalmutzki, M.J.; Diercks, C.S.; Yaghi, O.M. Metal–Organic Frameworks for Water Harvesting from Air. Adv. Mater. 2018, 30, 1–26. [Google Scholar] [CrossRef]
- Hu, F.; Di, Z.; Wu, M.; Hong, M.; Li, J. A Robust Multifunctional Eu6-Cluster Based Framework for Gas Separation and Recognition of Small Molecules and Heavy Metal Ions. Cryst. Growth Des. 2019, 19, 6381–6387. [Google Scholar] [CrossRef]
- Bo, Q.B.; Zhang, H.T.; Wang, H.Y.; Miao, J.L.; Zhang, Z.W. Anhydrous Lanthanide MOFs and Direct Photoluminescent Sensing for Polyoxometalates in Aqueous Solution. Chem.—Eur. J. 2014, 20, 3712–3723. [Google Scholar] [CrossRef]
- Lustig, W.P.; Mukherjee, S.; Rudd, N.D.; Desai, A.V.; Li, J.; Ghosh, S.K. Metal-Organic Frameworks: Functional Luminescent and Photonic Materials for Sensing Applications. Chem. Soc. Rev. 2017, 46, 3242–3285. [Google Scholar] [CrossRef]
- Rocha, J.; Brites, C.D.S.; Carlos, L.D. Lanthanide Organic Framework Luminescent Thermometers. Chem.—Eur. J. 2016, 22, 14782–14795. [Google Scholar] [CrossRef] [PubMed]
- Kreno, L.E.; Leong, K.; Farha, O.K.; Allendorf, M.; Van Duyne, R.P.; Hupp, J.T. Metal–Organic Framework Materials as Chemical Sensors. Chem. Rev. 2012, 112, 1105–1125. [Google Scholar] [CrossRef]
- Yu, L.; Xiu-Dian, X.; Jian-Ling, N.; Jun-Feng, L.; Fang-Ming, W. Synthesis, Structure and Fluorescence Property of New Cd-MOFs Based on a Tetraphenylethylene (TPE) Ligand. Inorg. Chem. 2021, 40, 6. [Google Scholar]
- Zeng-Hui, L.; Liang, H.; Yu-Jun, G.; Ming-Bu, L.; Qi-Pu, L. A Stable Luminescent MOF Constructed by Bis- (4-Pyridyl)Thiazolo[5,4-d]Thiazole Containing Multi-Electron Donor-Acceptor Core. Chin. J. Struct. Chem. 2021, 40, 5. [Google Scholar]
- Gerkin, B.Y.R.E.; Reppart, W.J. The Structures of the Lanthanide Ethyl Sulfate Enneahydrates, M(C2H5SO4)3·9H2O [M = La-Lu (except Pm)], at 171 K. Acta Crystallogr. Sect. C Cryst. Struct. Commun. 1984, C40, 781–786. [Google Scholar] [CrossRef]
- Seitz, M.; Oliver, A.G.; Raymond, K.N. The Lanthanide Contraction Revisited. J. Am. Chem. Soc. 2007, 129, 11153–11160. [Google Scholar] [CrossRef] [PubMed]
- Abdelhameed, R.M.; Ananias, D.; Silva, A.M.S.; Rocha, J. Luminescent Nanothermometers Obtained by Post-Synthetic Modification of Metal-Organic Framework MIL-68. Eur. J. Inorg. Chem. 2019, 2019, 1354–1359. [Google Scholar] [CrossRef]
- D’Vries, R.F.; Álvarez-García, S.; Snejko, N.; Bausá, L.E.; Gutiérrez-Puebla, E.; De Andrés, A.; Monge, M.Á. Multimetal Rare Earth MOFs for Lighting and Thermometry: Tailoring Color and Optimal Temperature Range through Enhanced Disulfobenzoic Triplet Phosphorescence. J. Mater. Chem. C 2013, 1, 6316–6324. [Google Scholar] [CrossRef]
- Cui, Y.; Xu, H.; Yue, Y.; Guo, Z.; Yu, J.; Chen, Z.; Gao, J.; Yang, Y.; Qian, G.; Chen, B. A Luminescent Mixed-Lanthanide Metal-Organic Framework Thermometer. J. Am. Chem. Soc. 2012, 134, 3979–3982. [Google Scholar] [CrossRef]
- Vialtsev, M.B.; Dalinger, A.I.; Latipov, E.V.; Lepnev, L.S.; Kushnir, S.E.; Vatsadze, S.Z.; Utochnikova, V.V. New Approach to Increase the Sensitivity of Tb-Eu-Based Luminescent Thermometer. Phys. Chem. Chem. Phys. 2020, 22, 25450–25454. [Google Scholar] [CrossRef]
- Tsymbarenko, D.; Martynova, I.; Grebenyuk, D.; Shegolev, V.; Kuzmina, N. One-Dimensional Coordination Polymers of Whole Row Rare Earth Tris-Pivalates. J. Solid State Chem. 2018, 258, 876–884. [Google Scholar] [CrossRef]
- Grebenyuk, D.; Martynova, I.; Tsymbarenko, D. Self-Assembly of Hexanuclear Lanthanide Carboxylate Clusters of Three Architectures. Eur. J. Inorg. Chem. 2019, 3103–3111. [Google Scholar] [CrossRef]
- Sheldrick, G.M. Crystal Structure Refinement with SHELXL. Acta Crystallogr. Sect. C Struct. Chem. 2015, 71, 3–8. [Google Scholar] [CrossRef]
- Petrícek, V.; Dušek, M.; Palatinus, L. Crystallographic Computing System JANA2006: General Features. Z. Krist. 2014, 229, 345–352. [Google Scholar] [CrossRef]
- Kresse, G.; Furthmüller, J. Efficiency of Ab-Initio Total Energy Calculations for Metals and Semiconductors Using a Plane-Wave Basis Set. Comput. Mater. Sci. 1996, 6, 15–50. [Google Scholar] [CrossRef]
- Kresse, G.; Hafner, J. Ab Initio Molecular-Dynamics Simulation of the Liquid-Metalamorphous- Semiconductor Transition in Germanium. Phys. Rev. B 1994, 49, 14251–14269. [Google Scholar] [CrossRef]
- Kresse, G.; Furthmüller, J. Efficient Iterative Schemes for Ab Initio Total-Energy Calculations Using a Plane-Wave Basis Set. Phys. Rev. B-Condens. Matter Mater. Phys. 1996, 54, 11169–11186. [Google Scholar] [CrossRef]
- Kresse, G.; Hafner, J. Ab Initio Molecular Dynamics for Liquid Metals. Phys. Rev. B 1993, 47, 558–561. [Google Scholar] [CrossRef]
- Grimme, S.; Antony, J.; Ehrlich, S.; Krieg, H. A Consistent and Accurate Ab Initio Parametrization of Density Functional Dispersion Correction (DFT-D) for the 94 Elements H-Pu. J. Chem. Phys. 2010, 132, 154104. [Google Scholar] [CrossRef]
- Bader, R.F.W. Atoms in Molecules. Acc. Chem. Res. 1985, 18, 9–15. [Google Scholar] [CrossRef]
- Vega, D.; Almeida, D. AIM-UC: An Application for QTAIM Analysis. JCM 2014, 14, 131–136. [Google Scholar] [CrossRef]
- Espinosa, E.; Molins, E.; Lecomte, C. Hydrogen Bond Strengths Revealed by Topological Analyses of Experimentally Observed Electron Densities. Chem. Phys. Lett. 1998, 285, 170–173. [Google Scholar] [CrossRef]
- Dobrokhotova, Z.V.; Tyurin, A.V.; Fomina, I.G.; Gavrichev, K.S.; Ryumin, M.A.; Bykov, M.A.; Emelina, A.L.; Novotortsev, V.M.; Eremenko, I.L. Thermodynamic Properties of Mixed-Ligand Rare Earth Pivalates. Thermochim. Acta 2013, 556, 68–74. [Google Scholar] [CrossRef]
- Zoan, T.A.; Kuzmina, N.P.; Frolovskaya, S.N.; Rykov, A.N.; Mitrofanova, N.D.; Troyanov, S.I.; Pisarevsky, A.P.; Martynenko, L.I.; Korenev, Y.M. Synthesis, Structure and Properties of Volatile Lanthanide Pivalates. J. Alloys Compd. 1995, 225, 396–399. [Google Scholar] [CrossRef]
- Fomina, I.G.; Dobrokhotova, Z.V.; Ilyukhin, A.B.; Zhilov, V.I.; Bogomyakov, A.S.; Antoshkov, A.A.; Zavorotny, Y.S.; Gerasimova, V.I.; Novotortsev, V.M.; Eremenko, I.L. Heterodinuclear (Sm, Tb) Lanthanide Pivalates with Heterocyclic N-Donors: Synthesis, Structure, Thermal Behavior, and Magnetic and Photoluminescence Properties. Dalton Trans. 2014, 43, 18104–18116. [Google Scholar] [CrossRef]
- Tsymbarenko, D.M.; Martynova, I.A.; Malkerova, I.P.; Alikhanyan, A.S.; Kuzmina, N.P. Mixed Ligand Acetate, Propionate, and Pivalate Complexes of Rare Earth Metals with Monoethanolamine: A New Approach to the Synthesis, Composition, Structure, and Use for the Preparation of Oxide Materials. Russ. J. Coord. Chem./Koord. Khimiya 2016, 42, 662–678. [Google Scholar] [CrossRef]
- Kuzmina, N.P.; Martynova, I.A.; Tsymbarenko, D.M.; Lyssenko, K.A. Novel Mononuclear Mixed Ligand Ce(III) Pivalate with Protonated Cationic Form of Monoethanolamine as Ancillary Ligand. Inorg. Chem. Commun. 2011, 14, 180–183. [Google Scholar] [CrossRef]
- Lossin, A.; Meyer, G. Pr(CH3COO)3, Ein Wasserfreies Selten-Erd-Acetat Mit Netzwerkstruktur. Z. Anorg. Allg. Chem. 1994, 620, 438–443. [Google Scholar] [CrossRef]
- Meyer, G.; Gieseke-Vollmer, D. Das Wasserfreie Lanthanacetat, La(CH3COO)3, and Sein Precursor, (NH4)3[La(CH3COO)6] ½ H2O. Z. Anorg. Allg. Chem. 1993, 619, 1603–1608. [Google Scholar] [CrossRef]
- Torres, S.G.; Meyer, G. Anhydrous Neodymium(III) Acetate. Z. Anorg. Allg. Chem. 2008, 634, 231–233. [Google Scholar] [CrossRef]
- Torres, S.G.; Pantenburg, I.; Meyer, G. Direct Oxidation of Europium Metal with Acetic Acid: Anhydrous Europium(III) Acetate, Eu(OAc)3, Its Sesqui-Hydrate, Eu(OAc)3(H2O)1.5, and the “ Hydrogendiacetate”, [Eu(H(OAc)2)3](H2O). Z. Anorg. Allg. Chem. 2006, 632, 1989–1994. [Google Scholar] [CrossRef]
- Lossin, A.; Meyer, G. Wasserfreie Selten-Erd-Acetate, M(CH3COO)3 (M = Sm-Lu, Y) Mit Kettenstruktur. Kristallstrukturen von Lu(CH3COO)3 Und Ho(CH3COO)3. Z. Anorg. Allg. Chem. 1993, 619, 1609–1615. [Google Scholar] [CrossRef]
- Wu, X.Y.; Zhao, Q.; Zhang, D.X.; Liang, Y.C.; Zhang, K.K.; Liu, Q.; Dong, L.; Shan, C.X. A Self-Calibrated Luminescent Thermometer Based on Nanodiamond-Eu/Tb Hybrid Materials. Dalton Trans. 2019, 48, 7910–7917. [Google Scholar] [CrossRef]
- Aromi, G.; Abad-Galan, L.; Aguila, D.; Guyot, Y.; Velasco, V.; Roubeau, O.; Teat, S.J.; Massi, M.; Galán, L.A.; Aguilà, D.; et al. Accessing Lanthanide-to-Lanthanide Energy Transfer in a Family of Site-Resolved [Ln(III)Ln(III)’] Heterodimetallic Complexes. Chem.—Eur. J. 2021, 27, 7288–7299. [Google Scholar] [CrossRef]
- Balda, R.; Fernández, J.; Mendioroz, A.; Voda, M.; Al-Saleh, M. Infrared-to-Visible Upconversion Processes in Pr3+/Yb3+-Codoped KPb2Cl5. Phys. Rev. B -Condens. Matter Mater. Phys. 2003, 68, 1–7. [Google Scholar] [CrossRef]
- Wang, X.; Yan, X.; Kan, C. Thermal Loading Induced Near-Infrared Broadband Upconversion Emission of Sm3+-Doped β-NaYbF4 Nano-Phosphors. J. Lumin. 2011, 131, 2325–2329. [Google Scholar] [CrossRef]
- Wang, F.; Deng, R.; Wang, J.; Wang, Q.; Han, Y.; Zhu, H.; Chen, X.; Liu, X. Tuning Upconversion through Energy Migration in Core-Shell Nanoparticles. Nat. Mater. 2011, 10, 968–973. [Google Scholar] [CrossRef]
- Yi, G.-S.; Chow, G.-M. Water-Soluble NaYF4:Yb,Er(Tm)/NaYF4/Polymer Core/Shell/Shell Nanoparticles with Significant Enhancement of Upconversion Fluorescence. Chem. Mater. 2007, 19, 341–343. [Google Scholar] [CrossRef]
- Casanova, D.; Llunell, M.; Alemany, P.; Alvarez, S. The Rich Stereochemistry of Eight-Vertex Polyhedra: A Continuous Shape Measures Study. Chem.-A Eur. J. 2005, 11, 1479–1494. [Google Scholar] [CrossRef] [PubMed]
- Terban, M.W.; Billinge, S.J.L. Structural Analysis of Molecular Materials Using the Pair Distribution Function. Chem. Rev. 2022, 122, 1208–1272. [Google Scholar] [CrossRef]
- Tsymbarenko, D.; Grebenyuk, D.; Burlakova, M.; Zobel, M. Quick and Robust PDF Data Acquisition Using a Laboratory Single-Crystal X-ray Diffractometer for Study of Polynuclear Lanthanide Complexes in Solid Form and in Solution. J. Appl. Cryst. 2022, 55, 890–900. [Google Scholar] [CrossRef]
- Thomae, S.L.J.; Prinz, N.; Hartmann, T.; Teck, M.; Correll, S.; Zobel, M. Pushing Data Quality for Laboratory Pair Distribution Function Experiments. Rev. Sci. Instrum. 2019, 90, 043905. [Google Scholar] [CrossRef] [PubMed]
- Juhás, P.; Davis, T.; Farrow, C.L.; Billinge, S.J.L. PDFgetX3: A Rapid and Highly Automatable Program for Processing Powder Diffraction Data into Total Scattering Pair Distribution Functions. J. Appl. Crystallogr. 2013, 46, 560–566. [Google Scholar] [CrossRef]
- Juhás, P.; Farrow, C.L.; Yang, X.; Knox, K.R.; Billinge, S.J.L. Complex Modeling: A Strategy and Software Program for Combining Multiple Information Sources to Solve Ill Posed Structure and Nanostructure Inverse Problems. Acta Crystallogr. Sect. A Found. Adv. 2015, 71, 562–568. [Google Scholar] [CrossRef] [PubMed]
- Grebenyuk, D.; Zobel, M.; Polentarutti, M.; Ungur, L.; Kendin, M.; Zakharov, K.; Degtyarenko, P.; Vasiliev, A.; Tsymbarenko, D. A Family of Lanthanide Hydroxo Carboxylates with 1D Polymeric Topology and Ln 4 Butterfly Core Exhibits Switchable Supramolecular Arrangement. Inorg. Chem. 2021, 60, 8049–8061. [Google Scholar] [CrossRef]
- Liu, X.; Akerboom, S.; de Jong, M.; Mutikainen, I.; Tanase, S.; Meijerink, A.; Bouwman, E. Mixed-Lanthanoid Metal–Organic Framework for Ratiometric Cryogenic Temperature Sensing. Inorg. Chem. 2015, 54, 11323–11329. [Google Scholar] [CrossRef]
- Fu, L.; Fu, Z.; Yu, Y.; Wu, Z.; Jeong, J.H. An Eu/Tb-Codoped Inorganic Apatite Ca5(PO4)3F Luminescent Thermometer. Ceram. Int. 2015, 41, 7010–7016. [Google Scholar] [CrossRef]
- Marciniak, L.; Bednarkiewicz, A. The Influence of Dopant Concentration on Temperature Dependent Emission Spectra in LiLa1−x−yEuxTbyP4O12 Nanocrystals: Toward Rational Design of Highly-Sensitive Luminescent Nanothermometers. Phys. Chem. Chem. Phys. 2016, 18, 15584–15592. [Google Scholar] [CrossRef] [PubMed]


| Eu0.53Tb0.47(piv)3(en) | Tm(piv)3(en) | Lu(piv)3(en) | |
|---|---|---|---|
| Formula | Eu0.53Tb0.47C17H35N2O6 | TmC17H35N2O6 | LuC17H35N2O6 |
| Formula weight (g·mol−1) | 518.72 | 532.4 | 538.4 |
| Diffractometer | Bruker SMART APEX II | Rigaku SmartLab | Rigaku SmartLab |
| Wavelength (Å) | 0.71073 (Mo Kα) | 1.54187 (Cu Kα) | 1.54187 (Cu Kα) |
| Data collection method | ω-scans | θ-θ scan | θ-θ scan |
| Temperature (K) | 120 | 293 | 293 |
| Crystal system | Orthorhombic | Orthorhombic | Orthorhombic |
| Space group | Iba2 | Iba2 | Iba2 |
| a (Å) | 12.329(10) | 12.3746(3) | 12.3443(2) |
| b (Å) | 17.539(14) | 17.7891(4) | 17.7621(4) |
| c (Å) | 10.134(8) | 10.1367(3) | 10.1222(5) |
| α (°) | 90 | 90 | 90 |
| β (°) | 90 | 90 | 90 |
| γ (°) | 90 | 90 | 90 |
| V (Å3) | 2191(3) | 2231.42(10) | 2219.40(12) |
| Z | 4 | 4 | 4 |
| Color, habit | Colorless, needle | White, powder flat sheet | White, powder flat sheet |
| Sample dimensions (mm) | 0.25 × 0.06 × 0.06 | 25 × 25 × 0.5 | 25 × 25 × 0.5 |
| Dcalc (g·cm−3) | 1.572 | 1.5848 | 1.6114 |
| μ (mm−1) | 3.066 | 7.712 | 8.781 |
| Unique reflections (Rint) | 3077(0.1249) | 499 | 496 |
| Observed reflections [I > 2σ(I)] | 1667 | 499 | 496 |
| Parameters, restrains | 169, 65 | 83, 38 | 83, 38 |
| R1[I > 2σ(I)], ωR2 | 0.0583, 0.1553 | – | – |
| RBragg, Rp, ωRp | – | 0.0152, 0.0350, 0.0526 | 0.0189, 0.0510, 0.0757 |
| Goodness-of-fit 1 | 1.002 | 4.35 | 5.23 |
| Absorption correction | SADABS | not required | not required |
| Tmin, Tmax | 0.6202, 0.8039 | – | – |
| ρmin, ρmax (eÅ−3) | −2.609, 2.213 | −1.43, 2.72 | −1.43, 2.72 |
| Parameter | Eu0.53Tb0.47(piv)3(en) | Tm(piv)3(en) | Lu(piv)3(en) |
|---|---|---|---|
| Ln1–O1 | 2.47(4) | 2.41(3) | 2.415(11) |
| Ln1–O2 | 2.58(2) | 2.41(2) | 2.415(11) |
| Ln1–N1 | 2.51(6) | 2.45(3) | 2.541(8) |
| Ln1–N2 | 2.46(5) | 2.45(3) | 2.541(8) |
| Ln1–O3 | 2.33(3) | 2.208(13) | 2.237(13) |
| Ln1–O3 i | 2.33(3) | 2.208(13) | 2.237(13) |
| Ln1-O4 ii | 2.32(3) | 2.352(14) | 2.199(12) |
| Ln1–O4 iii | 2.32(3) | 2.352(14) | 2.199(12) |
| Ln1⋯Ln1 iv | 5.067(8) | 5.0684(3) | 5.0611(5) |
| ∠Ln1-O3-C6 | 141(2) | 138.4(9) | 158.7(7) |
| ∠Ln1 iv-O4-C6 | 167(2) | 167.6(9) | 153.2(7) |
| Compound | E(Pca21), eV | E(Ia), eV | ΔE, kJ/mol |
|---|---|---|---|
| La(piv)3(en) | −1433.1727 | −1433.1828 | 0.97 |
| Gd(piv)3(en) | −1432.2695 | −1432.2314 | −3.68 |
| Lu(piv)3(en) | −1431.7396 | −1431.6679 | −6.92 |
| La(piv)3(en) | Gd(piv)3(en) | Lu(piv)3(en) | |
|---|---|---|---|
| ΣEbrid, kJ/mol | 268.97 | 363.95 | 411.89 |
| ΣEchel, kJ/mol | 190.17 | 234.01 | 253.69 |
| ΣEH, kJ/mol | 34.53 | 34.53 | 34.59 |
| ΣEtot, kJ/mol | 493.67 | 632.49 | 700.17 |
Publisher’s Note: MDPI stays neutral with regard to jurisdictional claims in published maps and institutional affiliations. |
© 2022 by the authors. Licensee MDPI, Basel, Switzerland. This article is an open access article distributed under the terms and conditions of the Creative Commons Attribution (CC BY) license (https://creativecommons.org/licenses/by/4.0/).
Share and Cite
Grebenyuk, D.; Zobel, M.; Tsymbarenko, D. Partially Ordered Lanthanide Carboxylates with a Highly Adaptable 1D Polymeric Structure. Polymers 2022, 14, 3328. https://doi.org/10.3390/polym14163328
Grebenyuk D, Zobel M, Tsymbarenko D. Partially Ordered Lanthanide Carboxylates with a Highly Adaptable 1D Polymeric Structure. Polymers. 2022; 14(16):3328. https://doi.org/10.3390/polym14163328
Chicago/Turabian StyleGrebenyuk, Dimitry, Mirijam Zobel, and Dmitry Tsymbarenko. 2022. "Partially Ordered Lanthanide Carboxylates with a Highly Adaptable 1D Polymeric Structure" Polymers 14, no. 16: 3328. https://doi.org/10.3390/polym14163328
APA StyleGrebenyuk, D., Zobel, M., & Tsymbarenko, D. (2022). Partially Ordered Lanthanide Carboxylates with a Highly Adaptable 1D Polymeric Structure. Polymers, 14(16), 3328. https://doi.org/10.3390/polym14163328