3.1. Influence of CNTs Content on Rheological Behavior
The viscoelasticity of the polymer melt, which plays a critical role in the molding process and part quality, is dependent on the temperature, shear rate and material composition [
17].
Figure 2 shows the rheological properties of PEEK/CNTs composites with different CNTs content at 380 °C and the frequency is from 0.5 to 100.0 rad/s. As can be seen from
Figure 2a,b, in every composite, both the storage modulus (G’) and loss modulus (G’’) increase as the frequency (ω) increases. Furthermore, the increases in G’ and G’’ are more significant with the increasing CNTs content at the same ω, and it is obvious at the higher ω. This phenomenon is caused by the characteristic relaxation time increasing with the CNTs content [
18].
Figure 2c shows that the complex viscosity (η*) of PEEK/CNTs composites drops rapidly with the increasing ω, showing an apparent shear-thinning behavior. This is due to the fact that the CNTs and polymer chains preferentially align along the shear direction under higher strain rate, which leads to the drop in viscosity [
19]. In addition to the apparent shear-thinning, the value of η* increases with the increasing CNTs content. Such an increase in the viscosity indicates that the CNTs have formed an effective network structure inside the composites, which increases the viscosity of composites [
20]. Such a dramatic increase in the viscosity will result in higher shear stress during the melt-mixing, which is conducive to forming a uniform dispersion of the CNTs in the PEEK matrix.
Figure 2d plots the loss factor (tanδ) of the samples versus frequency (ω) at 380 °C to characterize the elastic response of the composites. It can be seen that the composites have a viscoelastic transition within the tested frequency range. The viscous to elastic transition point, which corresponds to the peak in the loss factor, shifts to a high frequency as the CNTs content increases. In addition, because the increase in the CNTs content can enhance the stiffness of the composites, the tanδ gradually decreases. Moreover, at a higher CNTs content (over 1.0 wt%), the tanδ values become almost less than 1.0, which can be attributed to the formation of the network structure by the CNTs–CNTs interaction and CNTs–polymer chain interactions [
20]. The described viscoelastic property of the composites also plays an integral role in the feasibility of the recently emerged 3D printing technology [
21]. With proper tuning of these properties, the PEEK-CNTs composite may emerge as an appealing candidate for 3D printing [
22].
3.3. Influence of CNTs Content on Non-Isothermal of PEEK/CNTs Composites
It is well known that promoting the nucleation of polymers and hindering the movement of the polymer chain are important factors that affect the crystallization process of polymers.
Figure 4 shows the crystallization behavior of PEEK/CNTs composites at a constant cooling rate of 30 °C/min. The crystallinity of composites can be calculated using Equation (1), and the non-isothermal crystallization parameters are summarized in
Table 2. When the CNTs content increases from 0.5 to 10.0%, the crystallization onset temperatures (T
s) of PEEK/CNTs composites shifts to a higher temperature, increasing from 292 to 300 °C. However, the crystallinity with increasing CNTs content decreases significantly from 27.7 to 16.6%, proving that the addition of CNTs hinders the movement of molecules to decrease the crystallinity. The current study is consistent with the results of Li et al. [
24]. Furthermore, it is observed that the crystallization peak temperature (
Tp) of the composites increases with the increasing CNTs content, indicating that CNTs can promote nucleation to increase crystallization rates. This phenomenon has also been observed by many researchers [
25,
26]. In summary, the change in crystallinity can be observed clearly, which indicates that hindering crystal growth is dominated during the crystallization process.
Jeziomy [
27] extended the Avrami method, which was applicable to isothermal crystallization to the case of non-isothermal crystallization. In fact, the non-isothermal crystallization process can be approximately considered as an isothermal process by modifying the rate constant. The double-logarithmic form of the Avrami equation is shown in Equation (9). Compared with the isothermal crystallization process, the non-isothermal crystallization process is affected by the cooling rate. Therefore, the rate constant Z needs to be corrected by the cooling rates. The modified parameter for crystallization kinetics is given by Equation (10).
By using Equations (9) and (10), a plot of
ln(−ln(1−Xt)) versus
lnt gives the slope Avrami exponent
n and the intercept lnZ, as shown in
Figure 5. The linearity of the plots shows that the adaptation of the modified Avrami method for neat PEEK in the crystallization process is satisfactory. According to the kinetic parameters shown in
Table 3, the Avrami exponent is not an integer. It can be observed that the
n is stable around 3 with increasing the CNTs content, indicating that the addition of CNT does not change the growth pattern of crystals. When the value of
n decreases, it proves that the crystal growth is limited during the crystallization process and results in the simpler geometry of spherulites. As for the effect of the CNTs content on
, the higher CNTs content shows lower
values. It means that the crystal growth rates decrease at a higher CNTs content, which hinders the crystallization.
Tp increases with increasing filler, suggesting that CNTs can promote the formation of nucleation sites. As stated above, the addition of CNTs can promote nucleation while hindering the crystals’ growth. Meanwhile, the hindering effects become more dominant with the increasing CNTs loading.
3.4. Influence of Annealing Treatment on Crystallization of PEEK/CNTs Composites
Recently, many studies have found that the annealing treatment of polymers can improve the crystallization by the van der Waals force between the fillers. The crystallization plays an important role in the conductivity or mechanical properties [
28,
29].
Figure 6 illustrates the DSC thermograms of the samples before and after annealing treatment. From to
Figure 6a, the thermograms of all the unannealed samples show a single melting endotherm. With the CNTs content increases, the area of melting endotherm decreases gradually, which means that the addition of CNTs reduces the crystallinity of the composites. It can be clearly seen from
Table 4 that the neat PEEK melting temperature (T
m) and PEEK/CNTs composites are similar, about 337.7 °C, indicating that the crystal structure of PEEK/CNTs composites does not change [
16]. Nevertheless, when the CNTs content reaches 10%, the crystallinity of the composites reduces from 27.3 to 16.8%. This is consistent with the above analysis of non-isothermal crystallization kinetics.
As shown in
Figure 6b, it can be found that the annealed samples display the secondary melting peak, and the position of the secondary melting peak is different with the CNTs content.
Table 5 summarizes the peak temperatures (T
m1, T
m2) of both the endotherms during the polymer-melting process. Compared with the annealing treatment temperature, the second peak temperature is approximately 5–20 °C higher. This indicates that the small and imperfect crystals are present during annealing treatment. In the meantime, with the increase in CNTs content, the secondary peak shifts to the primary endotherm, which indicates that CNTs hinder the movement of the PEEK chain greatly. It is worth noting that the changes in crystallinity of annealed samples are the same as those of unannealed ones, which decrease with the increase in CNTs. Compared with the crystallinity of unannealed samples, the crystallinity of the annealed samples is higher than that of unannealed samples, with an increase of 18.3%, as the PEEK chain gains more energy during the annealing process [
30].
3.5. Influence of Annealing Treatment on Mechanical Properties of PEEK/CNTs Composites
Figure 7 shows the tensile strength, elastic modulus, and maximum strain of the PEEK composites with different CNTs content (up to 5.0 wt%). It can be seen from
Figure 7a that the tensile strength increases by as much as 8.7% with 5.0 wt% CNTs loading. It means that the incorporation of CNTs is conducive to improving the mechanical properties of composites.
Figure 7b compares the effect of CNTs on the elastic modulus of the tested samples. When CNTs loading increases from 0.5 to 5.0 wt%, the elastic modulus increases from 22.5% and up to 34.6% compared to the neat PEEK. Such concurrent increases in the tensile strength and elastic modulus with the increasing CNTs loading implies a good interfacial interaction between the CNTs and PEEK matrix. This finding also indicates that there is no obvious agglomeration between CNTs, which is confirmed by SEM images. It is worth noticing that the enhancement in the elastic modulus appears less significant with higher CNTs. This is probably due to the decrease in the crystallinity in the composites with higher CNTs loading, as the crystallinity drops from 27.7% to 16.6%, as was shown in the earlier section. Such a finding is also consistent with other studies [
14]. Taking the effect of crystallinity into account, the improvement of the elastic modulus can be attributed to the reinforcing effect of the filler itself.
Figure 7c shows the maximum strain of composites with the increasing CNTs loading. It is obvious that the maximum strain decreases from 105.3 to 46.1% as the CNTs increase to 5.0 wt%.
To further unveil the effect of annealing on the mechanical properties of the PEEK/CNT composites,
Figure 7 also compares the tensile strength, elastic modulus and elongation of non-annealed and annealed specimens. After annealing treatment, both the tensile strength and elastic modulus increase monotonically compared with the non-annealed sample. For instance, when the CNTs content is 5.0 wt%, the tensile strength and elastic modulus reach 118.2 MPa and 3070.0 MPa, respectively, which is 19.9% or 19.5% higher than the unannealed sample. In contrast, annealing results in a significant drop in plasticity, as shown in
Figure 7c. After annealing, the maximum elongation drops from 104.0% to 64.0% for the neat PEEK. The drop in plasticity is also pervasive for the composite specimen. The decrease in the plasticity after annealing is much anticipated because of the increased crystallinity, which hinders the connection [
31]. Beyond the mechanical properties, a recent study also indicated that the annealing process can tune the surface roughness of the specimen, which may merit investigation in the future studies.
3.6. Influence of Annealing Treatment on EMI Properties of PEEK/CNTs Composites
As a highly conductive nano filler, CNTs can effectively endow high electrical conductivity to the otherwise insulting polymeric matrix [
32,
33].
Figure 8a shows the electrical conductivity of the PEEK/CNTs composites with different CNTs content. It can be found that the electrical conductivity of composites increases with an increase in the CNTs content. When the CNTs content is 0.5 wt%, the conductivity of the composites increases about 9.0 orders of magnitude compared with the neat PEEK matrix, reaching 1.5 × 10
−3 S/mm. Moreover, with the CNTs content being further increased, the electrical conductivity of the composites reaches a higher value. When the CNTs content is 10 wt%, the conductivity reaches 2.3 S/cm, almost 100 times higher than that of the 0.5 wt% CNT-loading specimen. This means that CNTs have formed a relatively complete conductive network in the PEEK matrix [
34].
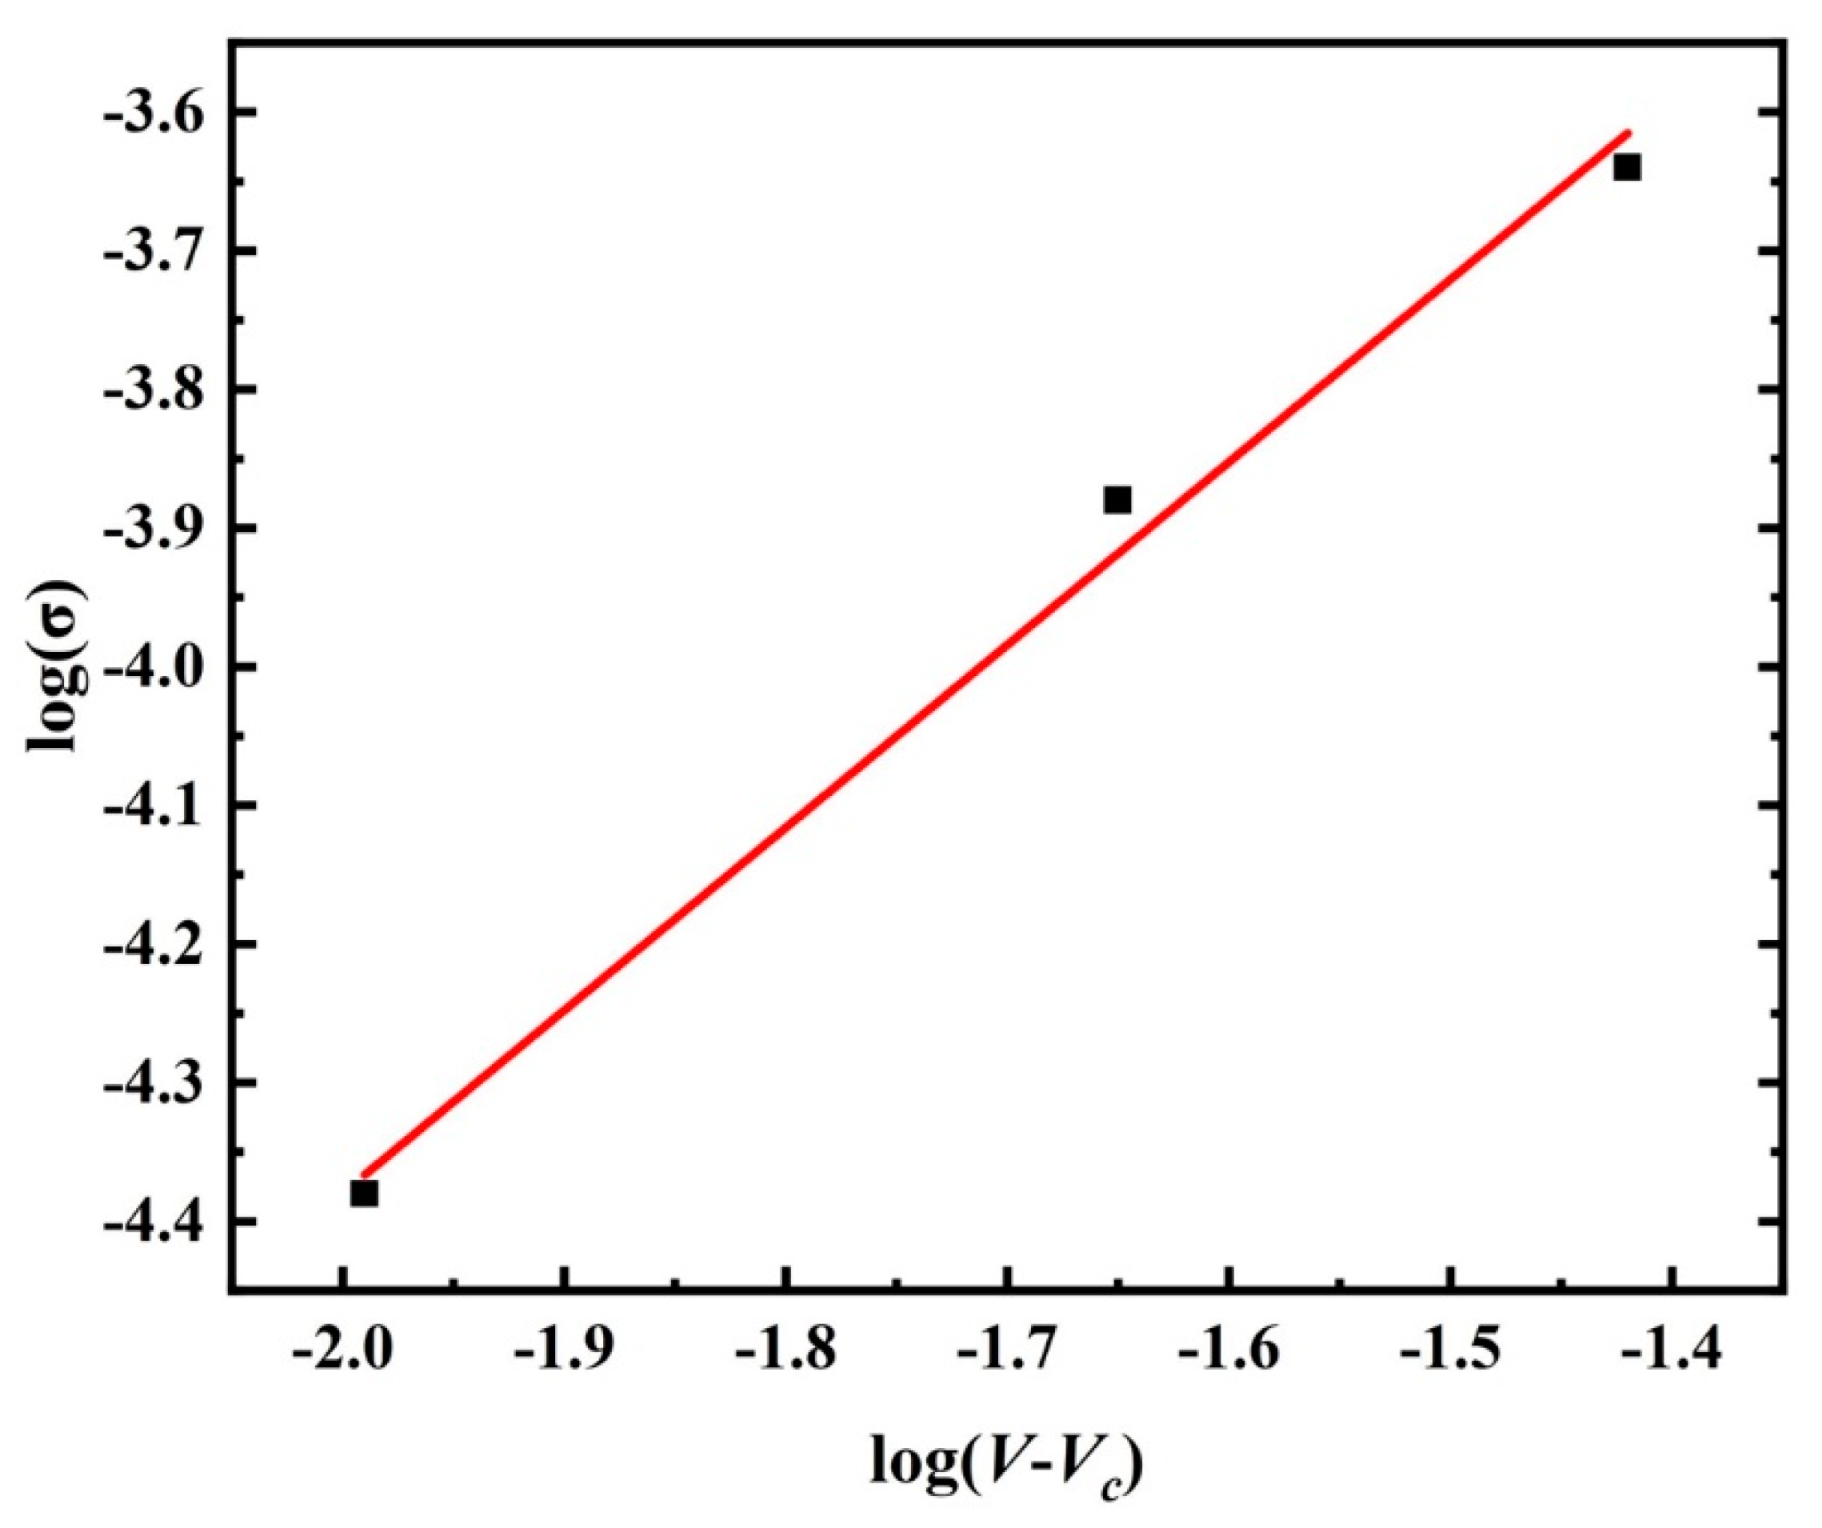
In order to further the influence of CNTs on the conductive network of composites, the classical percolation theory was used to analyze the conductive network in the composites with regard to the critical concentration of fillers, as shown in Equations (11) and (12):
where
VCNTs is defined as the CNTs volume fraction,
ω denotes the CNTs weight fraction,
ρCNTs and
ρPEEK represents the density of the CNTs and PEEK,
σ is the resistivity of the composite,
σ0 denotes the resistivity of CNTs,
V is defined as the filler volume,
Vc represents the percolation threshold, and
t is the critical exponent. The composition and density of varied composite are present in
Table 6. To facilitate the analysis of the critical index, Equation (12) is revised as follows:
where the critical exponent
t is transformed into the slope of the function, as shown in
Figure 8.
Previous studies have shown that the percolation threshold of thermoplastics polymer is 1.0~5.0 wt%, and the percolation threshold of PEEK/CNTs composite system is usually 3.5 wt% [
35]. From
Figure 8, the critical exponent of PEEK/CNTs composites was determined to be 1.31 by ordinary least squares fitting. Due to the small data sample, the critical exponent may have a large error. Nonetheless, Weber and Kamal [
36] reported the critical exponent as being between 1.3 and 3.1 for different polymer and reinforcement systems. It can be seen that the critical exponent of the PEEK/CNTs system is in reasonable agreement with the experimental and theoretical predictions.
To further reveal the effect of annealing on the electrical conductivity of PEEK/CNTs composites, the samples with different CNTs content were annealed at 280 °C for 4.0 h. Similarly, the electrical conductivity of thermal annealed PEEK/CNTs composites was measured, and the test results are shown in
Figure 9a. It is worth noticing that, for all the composite specimens, the electrical conductivity decreased after annealing. For instance, after annealing, the electrical conductivity of PEEK/CNTs composites with 10.0 wt% CNTs reduced from 2.3 to 2.1 S/cm. This result, however, is contradictory to a few previous studies where annealing appears to boost the electrical conductivity [
37]. One probable explanation for such a discrepancy is the extremely small-sized crystallites in PEEK. As shown in
Figure 9b, the polarizing microscope of neat PEEK shows very small-sized crystallites. The incorporation of nanoscale CNTs enables the formation of a highly conductive network. After annealing treatment, however, the crystal size grew and the crystallinity of the composites increased, leading to the exclusion of CNTs to the boundaries of the crystals, thus disrupting the otherwise conductive network. Nevertheless, the conductivity drop is not significant in all the composites demonstrated in this study, as the volume exclusion effect can possibly bring new pathways for electric conductivity [
16].
With such superior electrical conductivity, the as-prepared PEEK/CNTs composites possess great potential for a variety of functional applications, such as electromagnetic shielding performance. The ability of composites to resist the electromagnetic waves can be measured by electromagnetic shielding performance (SE). Usually, when the SE reaches 30.0 dB, it means that the composites can attenuate 99.9% of electromagnetic waves.
Figure 10a shows the electromagnetic shielding properties of PEEK/CNTs composites with different CNTs content. As the CNTs content increased, the SE increased dramatically. When the CNTs loading was above 7.0 wt%, the composites exhibited outstanding shielding performance, with SE exceeding 30.0 dB. To further identify the components responsible for the shielding effect,
Figure 10b shows the quantitative reflection loss (SE
R) and absorption loss (SE
A) for the PEEK/CNTs composites with varying CNTs. While both SE
A and SE
R increased monotonically with the increasing CNTs content, it is apparent that SE
A is the major component for the electromagnetic shielding. For instance, when the CNTs content reached 10.0 wt%, the SE
A reached 27.8 dB, which accounts for more than 80.0% of the SE
T. This meant that when electromagnetic waves propagate through composites, higher conductivity causes more current to convert electromagnetic energy into heat, increasing the absorption loss [
38]. In other words, the improvement of electromagnetic shielding properties by CNTs is mainly due to the increase in the absorption of incident electromagnetic waves, rather than increasing the surface reflection loss.
It is also interesting to investigate the effect of annealing on the electromagnetic shielding performance. After annealing all samples at 280 °C for 4.0 h, the EMI shielding performance is shown in
Figure 10c. Compared with
Figure 10a,c, the SE dropped significantly after annealing treatment. Such a drop is consistent with the change in the electrical conductivity. For example, the SE
T of the PEEK/CNTs composites with 10.0 wt% CNTs was 34.7 dB, but it dropped to 29.6 dB with a decrease of 14.7% after annealing treatment. In order to clearly investigate the changes in SE
A, SE
R and SE
T after annealing,
Figure 10d shows the variation of SE
A, SE
R and SE
T at 22 GHz. Compared with the values of SE
R, the values of SE
A dropped more obviously, decreasing about 15.6%. However, SE
A still accounted for 79.2% of SE
T, indicating that the electromagnetic shielding properties of annealed PEEK/CNTs composites are still dominated by absorption loss. Earlier studies have indicated the EMI absorption loss is strongly related to the electrical conductivity of the tested specimen [
39,
40], which explains the drop in the EMI shielding performance after annealing.


