
Liquid Oil Trapped inside PVA Electrospun Microcapsules

 ,
, 

 ,
,  and
and 
Abstract
:1. Introduction
2. Materials and Methods
2.1. Materials
2.2. Methods
3. Results
3.1. Emulsion Characterization
3.2. Nanofiber Characterization
3.2.1. Organoleptic Test
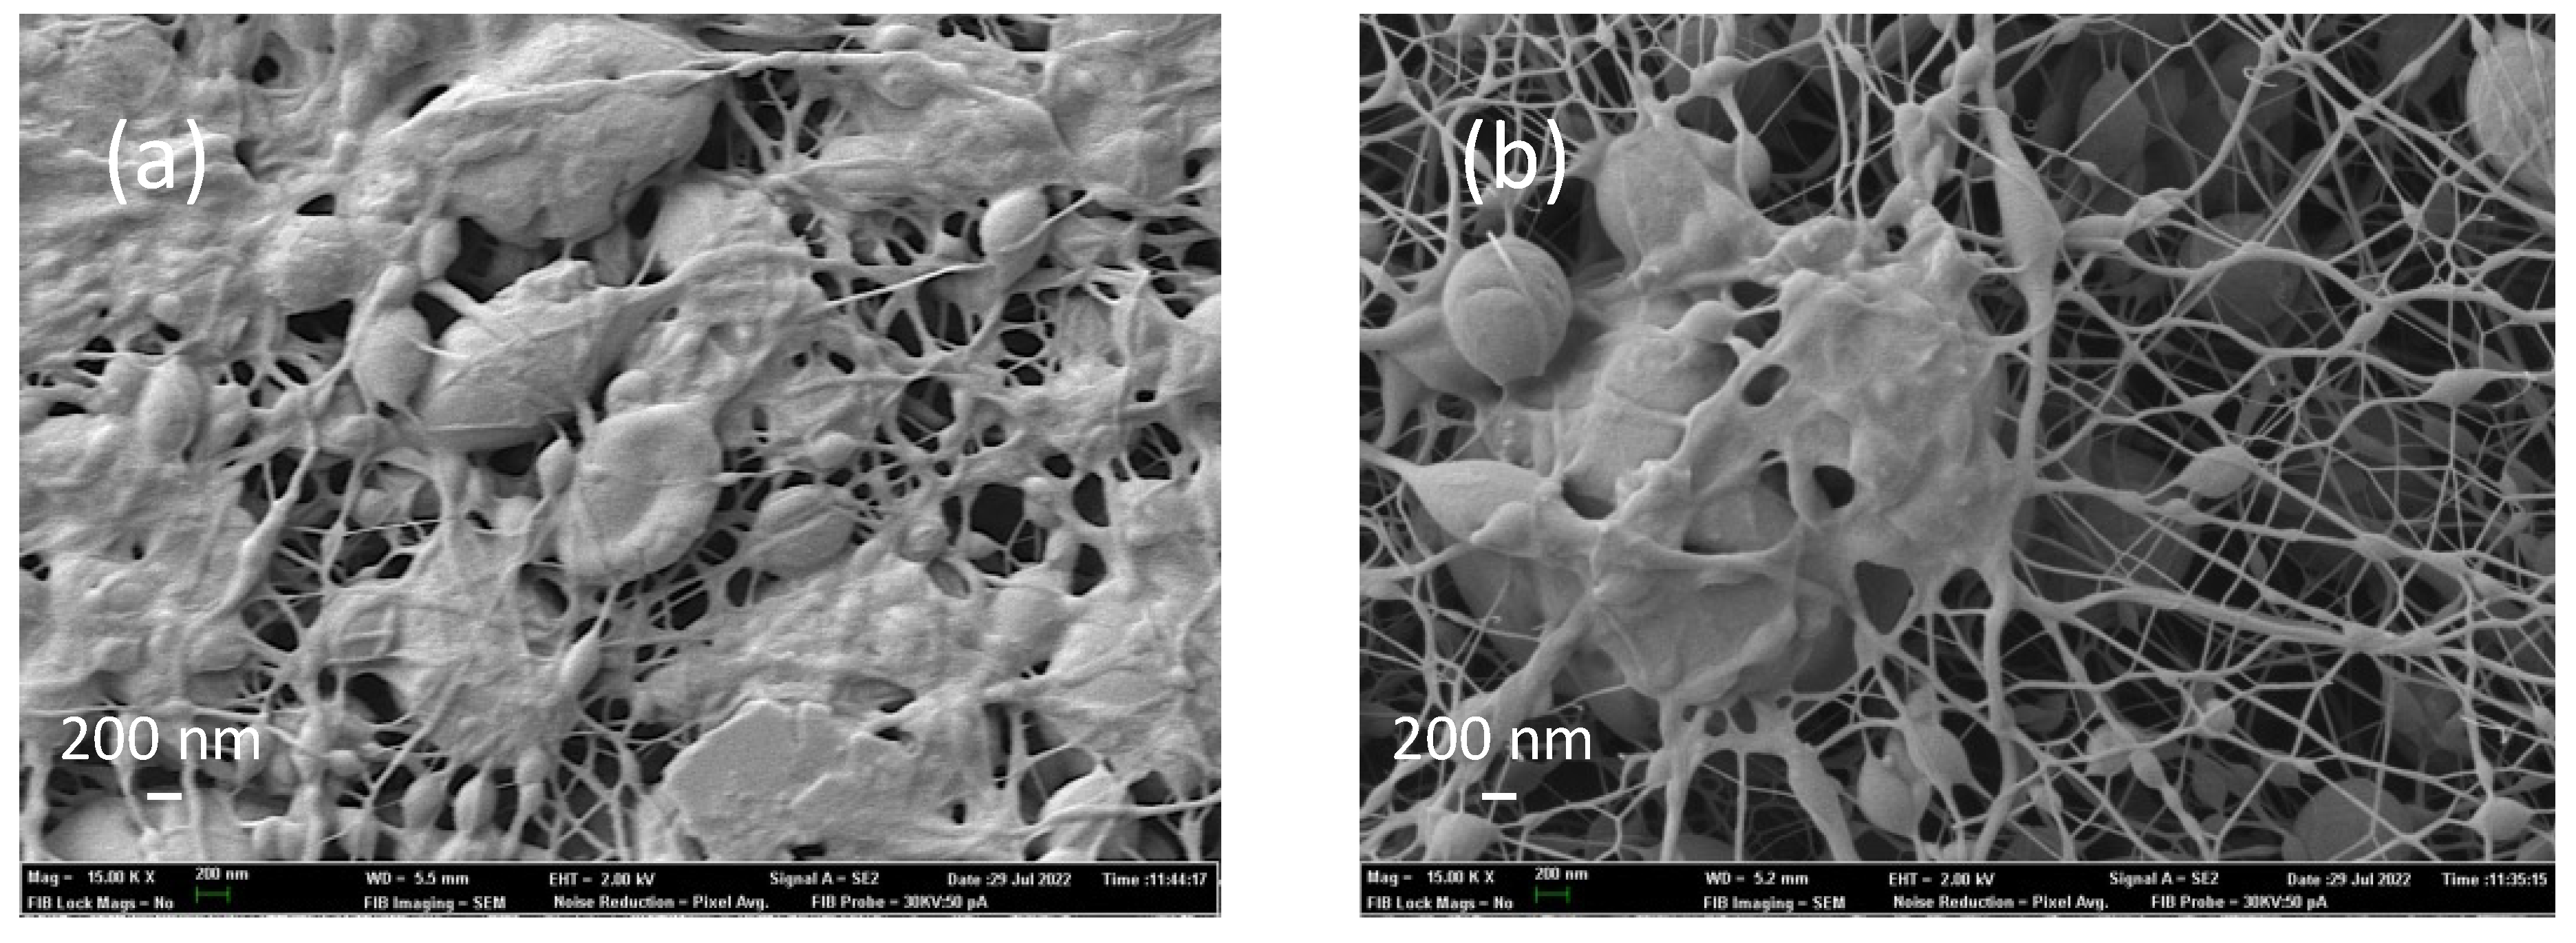
3.2.2. SEM
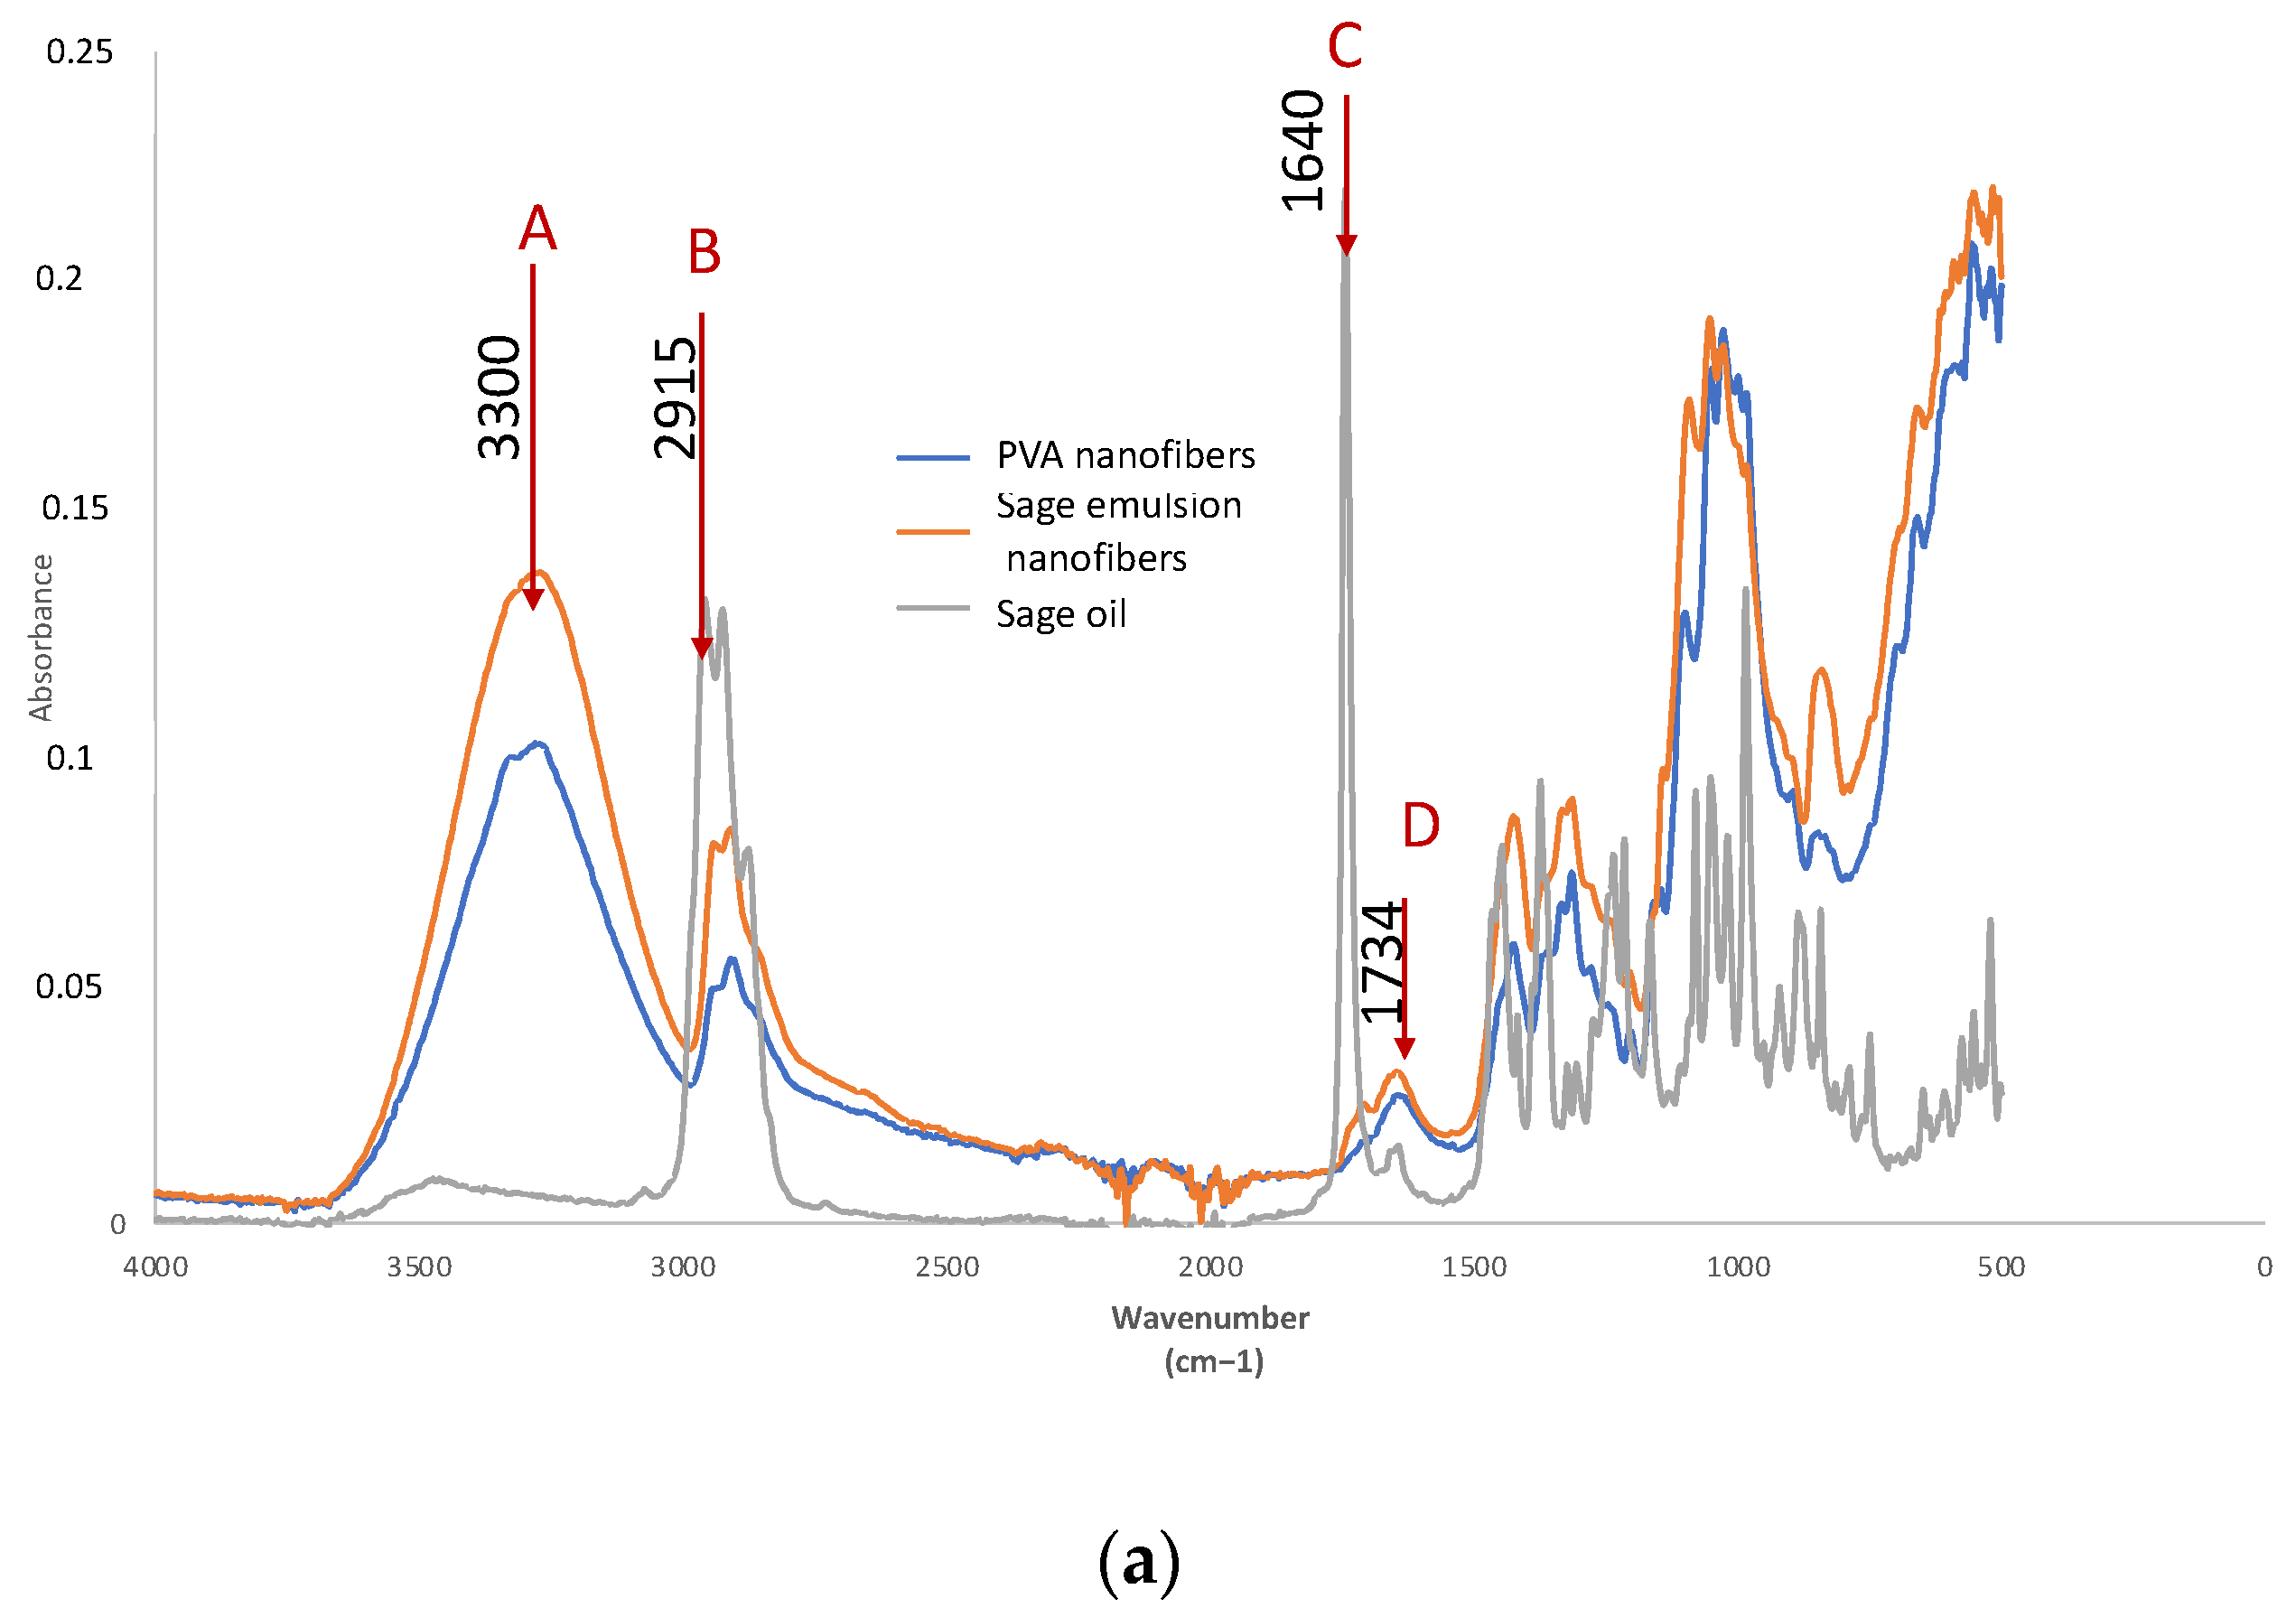
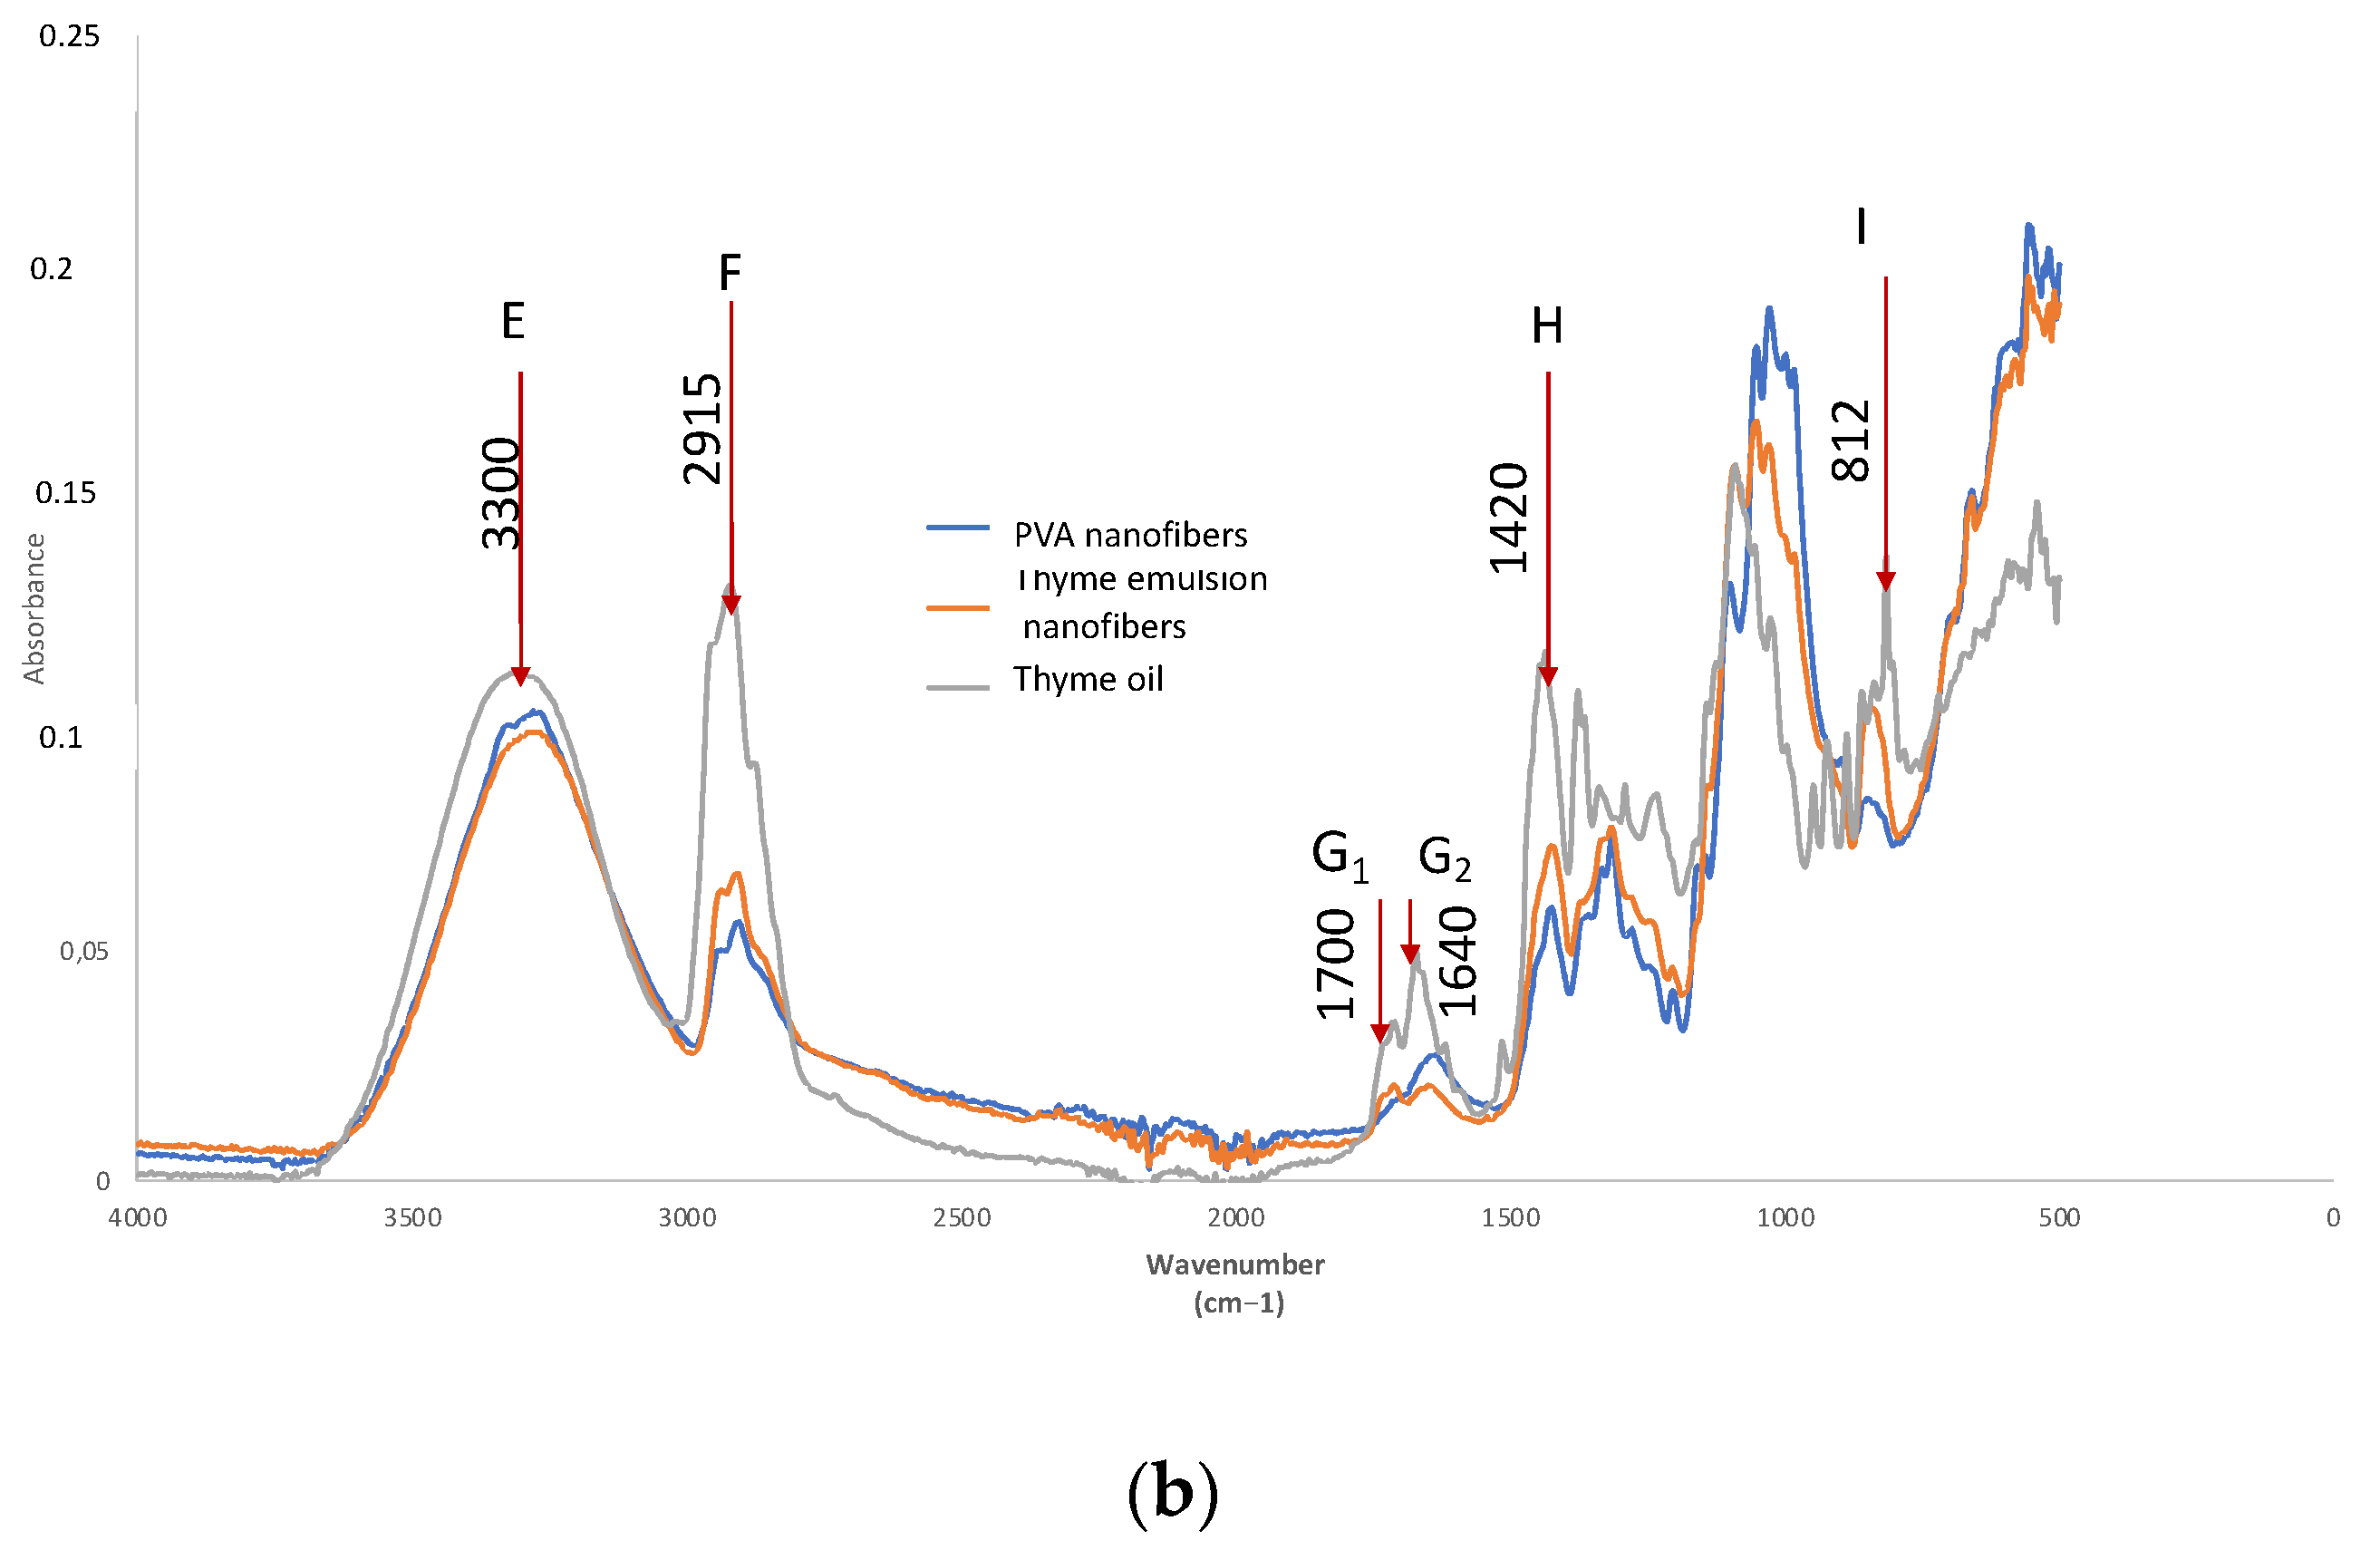
3.2.3. FTIR
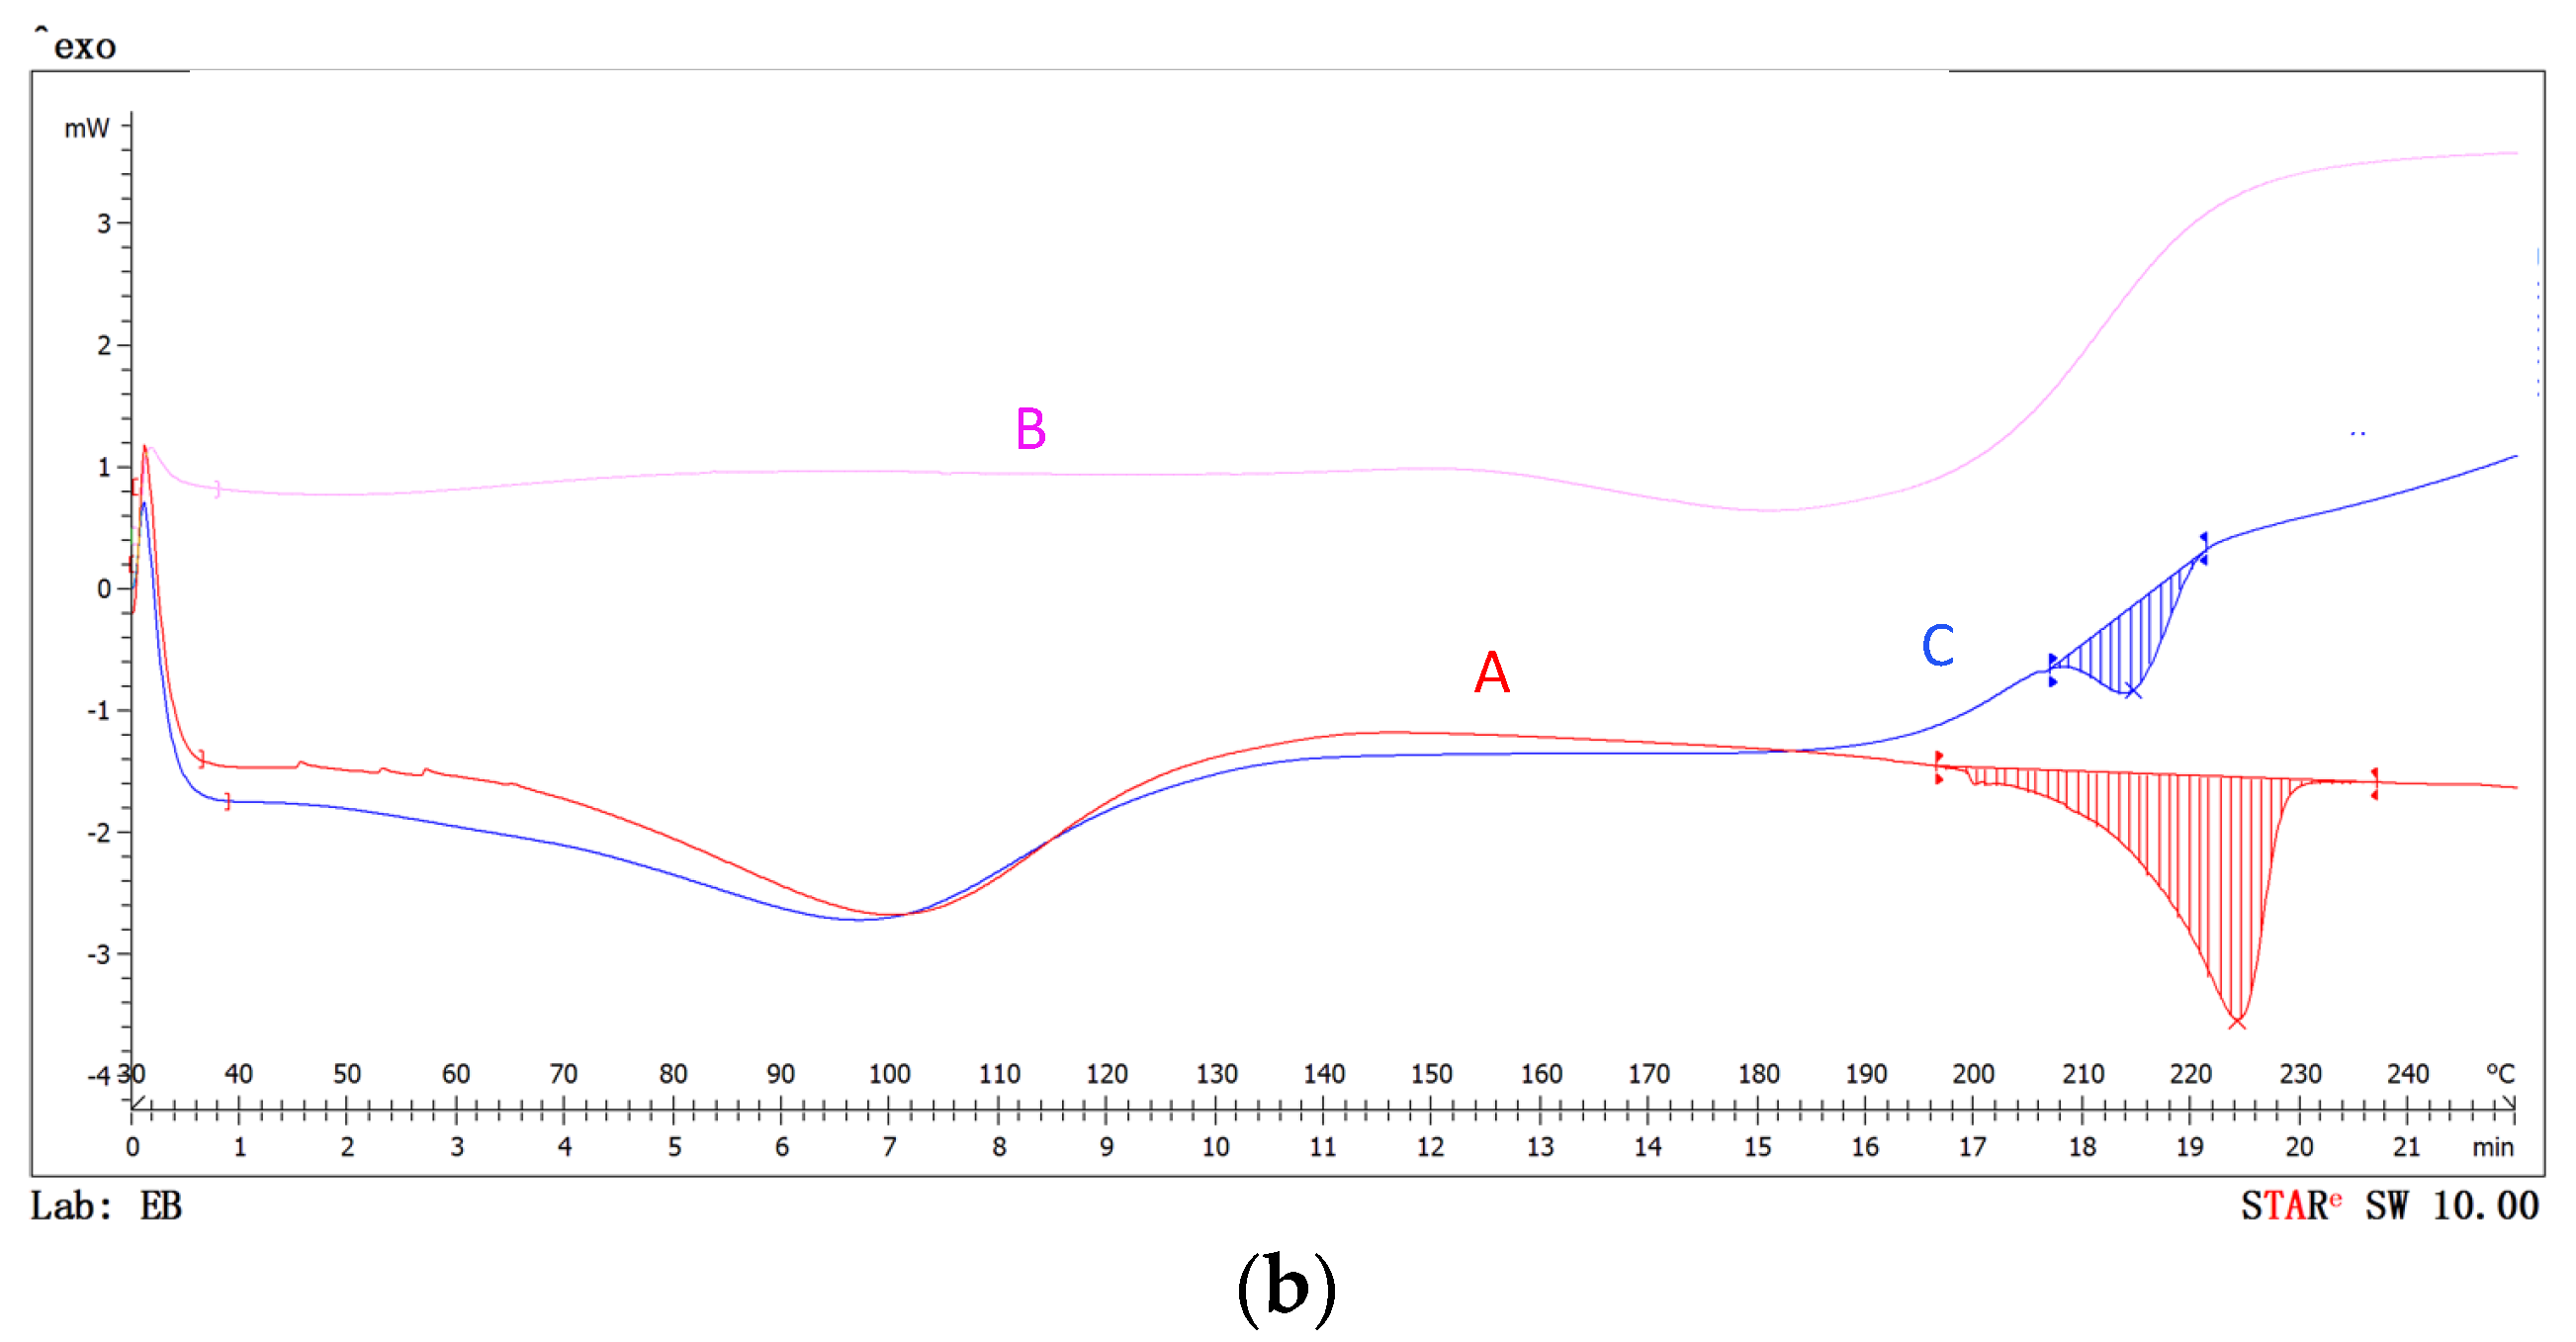
3.2.4. DSC
3.2.5. Pressure Test
3.2.6. Antibacterial Effect
4. Discussion
5. Conclusions
Author Contributions
Funding
Data Availability Statement
Conflicts of Interest
References
- Wang, X.; Xiang, H.; Song, C.; Zhu, D.; Sui, J.; Liu, Q.; Long, Y. Highly efficient transparent air filter prepared by collecting-electrode-free bipolar electrospinning apparatus. J. Hazard. Mater. 2020, 385, 121535. [Google Scholar] [CrossRef] [PubMed]
- Liu, C.; Hsu, P.C.; Lee, H.W.; Ye, M.; Zheng, G.; Liu, N.; Cui, Y. Transparent air filter for high-efficiency PM 2.5 capture. Nat. Commun. 2015, 6, 6205. [Google Scholar] [CrossRef] [PubMed] [Green Version]
- Whang, C.; Wang, X.; Zhang, E.; Yang, L.; Yuan, H.; Tu, W.; Zhang, Y. An epigenetic bioactive composite scaffold with well-aligned nanofibers for functional tendon tissue engineering. Acta Biomaterialia 2018, 66, 141–156. [Google Scholar]
- Ren, G.; Xu, X.; Liu, Q.; Cheng, J.; Yuan, X.; Wu, L.; Wan, Y. Electrospun poly (vinyl alcohol)/glucose oxidase biocomposite membranes for biosensor applications. React. Funct. Polym. 2006, 66, 1559–1564. [Google Scholar] [CrossRef]
- Si, Y.; Zhang, Z.; Wu, W.; Fu, Q.; Huang, K.; Nitin, N.; Sun, G. Daylight-driven rechargeable antibacterial and antiviral nanofibrous membranes for bioprotective applications. Sci. Adv. 2018, 4, eaar5931. [Google Scholar] [CrossRef] [Green Version]
- Khanzada, H.; Salam, A.; Qadir, M.B.; Phan, D.N.; Hassan, T.; Munir, M.U.; Kim, I.S. Fabrication of promising antimicrobial aloe vera/PVA electrospun nanofibers for protective clothing. Materials 2020, 13, 3884. [Google Scholar] [CrossRef]
- Zhang, L.; Li, L.; Wang, L.; Nie, J.; Ma, G. Multilayer electrospun nanofibrous membranes with antibacterial property for air filtration. Appl. Surf. Sci. 2020, 515, 145962. [Google Scholar] [CrossRef]
- Chowdhury, M.A.; Shuvho, M.B.A.; Shahid, M.A.; Haque, A.M.; Kashem, M.A.; Lam, S.S.; Mofijur, M. Prospect of biobased antiviral face mask to limit the coronavirus outbreak. Environ. Res. 2021, 192, 110294. [Google Scholar] [CrossRef]
- Cho, D.; Zhou, H.; Cho, Y.; Audus, D.; Joo, Y.L. Structural properties and superhydrophobicity of electrospun polypropylene fibers from solution and melt. Polymer 2010, 51, 6005–6012. [Google Scholar] [CrossRef]
- Heikkilä, P.; Harlin, A. Parameter study of electrospinning of polyamide-6. Eur. Polym. J. 2008, 44, 3067–3079. [Google Scholar] [CrossRef]
- Koski, A.; Yim, K.; Shivkumar, S.J.M.L. Effect of molecular weight on fibrous PVA produced by electrospinning. Mater. Lett. 2004, 58, 493–497. [Google Scholar] [CrossRef]
- Chen, Y.; Lin, J.; Fei, Y.V.; Wang, H.; Gao, W. Preparation and characterization of electrospinning PLA/curcumin composite membranes. Fibers Polym. 2010, 11, 1128–1131. [Google Scholar] [CrossRef]
- Agarwal, S.; Greiner, A. On the way to clean and safe electrospinning—Green electrospinning: Emulsion and suspension electrospinning. Polym. Adv. Technol. 2011, 22, 372–378. [Google Scholar] [CrossRef]
- Lv, D.; Zhu, M.; Jiang, Z.; Jiang, S.; Zhang, Q.; Xiong, R.; Huang, C. Green electrospun nanofibers and their application in air filtration. Macromol. Mater. Eng. 2018, 303, 1800336. [Google Scholar] [CrossRef]
- Zhang, C.; Feng, F.; Zhang, H. Emulsion electrospinning: Fundamentals, food applications and prospects. Trends Food Sci. Technol. 2018, 80, 175–186. [Google Scholar] [CrossRef]
- Çallıoğlu, F.C.; Güler, H.K.; Çetin, E.S. Emulsion electrospinning of bicomponent poly (vinyl pyrrolidone)/gelatin nanofibers with thyme essential oil. Mater. Res. Express 2019, 6, 125013. [Google Scholar] [CrossRef]
- Ding, B.; Li, C.; Miyauchi, Y.; Kuwaki, O.; Shiratori, S. Formation of novel 2D polymer nanowebs via electrospinning. Nanotechnology 2006, 17, 3685–3691. [Google Scholar] [CrossRef]
- Almería, B.; Deng, W.; Fahmy, T.M.; Gomez, A. Controlling the morphology of electrospray-generated PLGA microparticles for drug delivery. J. Colloid Interface Sci. 2010, 343, 125–133. [Google Scholar] [CrossRef] [PubMed]
- Raut, J.S.; Karuppiah, S.M. A status review on the medicinal properties of essential oils. Ind. Crops Prod. 2014, 62, 250–264. [Google Scholar] [CrossRef]
- Adorjan, B.; Buchbauer, G. Biological properties of essential oils: An updated review. Flavour Fragr. J. 2010, 25, 407–426. [Google Scholar] [CrossRef]
- Ali, B.; Al-Wabel, N.A.; Shams, S.; Ahamad, A.; Khan, S.A.; Anwar, F. Essential oils used in aromatherapy: A systemic review. Asian Pac. J. Trop. Biomed. 2015, 5, 601–611. [Google Scholar] [CrossRef]
- Turek, C.; Stintzing, F.C. Stability of essential oils: A review. Compr. Rev. Food Sci. Food Saf. 2013, 12, 40–53. [Google Scholar] [CrossRef]
- Hu, J.; Zhang, Y.; Xiao, Z.; Wang, X. Preparation and properties of cinnamon-thyme-ginger composite essential oil nanocapsules. Ind. Crops Prod. 2018, 122, 85–92. [Google Scholar] [CrossRef]
- Sepahvand, R.; Delfan, B.; Ghanbarzadeh, S.; Rashidipour, M.; Veiskarami, G.H.; Ghasemian-Yadegari, J. Chemical composition, antioxidant activity and antibacterial effect of essential oil of the aerial parts of Sage sclareoides. Asian Pac. J. Trop. Med. 2014, 7, S491–S496. [Google Scholar] [CrossRef] [Green Version]
- Papantonakis, D.M.; Collins, B.; Brookes, E.; Wood, J.; Gurudas, U. The influence of solvent parameters upon the surface roughness of matrix assisted laser deposited thin polymer films. Chem. Phys. Lett. 2007, 448, 194–197. [Google Scholar]
- Popa, R.M.; Fetea, F.; Socaciu, C. ATR-FTIR-MIR Spectrometry and Pattern Recognition of Bioactive Volatiles in Oily versus Microencapsulated Food Supplements: Authenticity, Quality, and Stability. Molecules 2021, 26, 4837. [Google Scholar] [CrossRef]
- Ciko, L.; Andoni, A.; Ylli, F.; Plaku, E.; Taraj, K.; Çomo, A. Extraction of essential oil from Albanian sage officinalis L. and its characterization by FTIR Spectroscopy. Asian J. Chem. 2016, 28, 1401. [Google Scholar] [CrossRef]
- Carvalho, R.A.; de Oliveira, A.C.S.; Santos, T.A.; Días, M.V.; Yoshida, M.I.; Borges, S.V. WPI and Cellulose Nanofibers Bio-nanocomposites: Effect of Thyme Essential Oil on the Morphological, Mechanical, Barrier and Optical Properties. J. Polym. Environ. 2020, 28, 231–241. [Google Scholar] [CrossRef]
- Choi, H.S.; Cho, J.Y.; Jin, M.R.; Lee, Y.G.; Kim, S.J.; Ham, K.S.; Moon, J.H. Phenolics, acyl galactopyranosyl glycerol, and lignan amides from Tetragonia tetragonioides (Pall.) Kuntze. Food Sci. Biotechnol. 2016, 25, 1275–1281. [Google Scholar] [CrossRef]
- Bonet, M.; Bou-Belda, E.; Monllor, M.; Gisbert, J. Binder effectiveness of microcapsules applied onto cotton fabrics during laundry. J. Text. Inst. 2016, 107, 300–306. [Google Scholar]


| Reference | PVA 9% | S | T | 4% S | 4% T |
|---|---|---|---|---|---|
| Viscosity (cP) | 173.2 | 30.7 | 28.9 | 338 | 230 |
| Conductivity (μS) | 270 | -- | -- | 242 | 268 |
| Surface tension (mN/m) | 70 | 27.82 | 32.76 | 37.12 | 33.25 |
| Reference | PVA 9% | PVA + S 14 kV | PVA + S 20 kV | PVA + T 14 kV | PVA + T 20 kV |
|---|---|---|---|---|---|
| Odor identification (volunteers) | No (5) | Yes (5) | Yes (5) | Yes (5) | Yes (5) |
| Fragrance identification (volunteers) | - | Yes (5) | Yes (5) | Yes (5) | Yes (5) |
| Size (μm) | S 14 kV | S 20 kV | T 14 kV | T 20 kV |
|---|---|---|---|---|
| 0–0.25 | 18.02 | 15.23 | 25.5 | 41.83 |
| 0.25–0.5 | 29.73 | 43.71 | 52.5 | 31.73 |
| 0.5–0.75 | 18.92 | 17.22 | 12 | 3.85 |
| 0.75–1 | 15.32 | 9.27 | 5 | 3.37 |
| 1–1.25 | 5.41 | 7.28 | 1.5 | 5.29 |
| 1.25–1.5 | 8.11 | 3.97 | 0.5 | 4.33 |
| 1.5–1.75 | 0.00 | 0.66 | 1 | 3.37 |
| 1.75–2 | 0.90 | 1.32 | 0.5 | 1.44 |
| 2–2.25 | 0.00 | 0.66 | 0.5 | 3.85 |
| 2.25–2.5 | 0.00 | 0.00 | 0.5 | 0.48 |
| 2.5–2.75 | 0.90 | 0.66 | 0 | 0.48 |
| 2.75–3 | 0.00 | 0.00 | 0 | 0.00 |
| 3–3.25 | 0.00 | 0.00 | 0 | 0.00 |
| 3.25–3.5 | 1.80 | 0.00 | 0 | 0.00 |
| 3.5–3.75 | 0.90 | 0.00 | 0 | 0.00 |
| Size (μM) | S 14 kV % | S 20 kV % | T 14 kV % | T 20 kV % | ||||
|---|---|---|---|---|---|---|---|---|
| No Emb. | Emb. | No Emb. | Emb. | No Emb. | Emb. | No Emb. | Emb. | |
| 0–0.25 | 0.00 | 20.62 | 0.00 | 18.85 | 0.00 | 28.18 | 0.00 | 55.41 |
| 0.25–0.5 | 0.00 | 34.02 | 0.00 | 54.10 | 0.00 | 58.01 | 0.00 | 42.04 |
| 0.5–0.75 | 0.00 | 21.65 | 6.90 | 19.67 | 31.58 | 9.94 | 9.80 | 1.91 |
| 0.75–1 | 14.29 | 15.46 | 37.93 | 2.46 | 21.05 | 3.31 | 11.76 | 0.64 |
| 1–1.25 | 14.29 | 4.12 | 27.59 | 2.46 | 10.53 | 0.55 | 21.57 | 0.00 |
| 1.25–1.5 | 35.71 | 4.12 | 17.24 | 0.82 | 5.26 | 0.00 | 17.65 | 0.00 |
| 1.5–1.75 | 0.00 | 0.00 | 3.45 | 0.00 | 10.53 | 0.00 | 13.73 | 0.00 |
| 1.75–2 | 7.14 | 0.00 | 3.45 | 0.82 | 5.26 | 0.00 | 5.88 | 0.00 |
| 2–2.25 | 0.00 | 0.00 | 0.00 | 0.82 | 5.26 | 0.00 | 15.69 | 0.00 |
| 2.25–2.5 | 0.00 | 0.00 | 0.00 | 0.00 | 5.26 | 0.00 | 1.96 | 0.00 |
| 2.5–2.75 | 7.14 | 0.00 | 3.45 | 0.00 | 0.00 | 0.00 | 1.96 | 0.00 |
| 2.75–3 | 0.00 | 0.00 | 0.00 | 0.00 | 0.00 | 0.00 | 0.00 | 0.00 |
| 3–3.25 | 0.00 | 0.00 | 0.00 | 0.00 | 0.00 | 0.00 | 0.00 | 0.00 |
| 3.25–3.5 | 14.29 | 0.00 | 0.00 | 0.00 | 0.00 | 0.00 | 0.00 | 0.00 |
| 3.5–3.75 | 7.14 | 0.00 | 0.00 | 0.00 | 0.00 | 0.00 | 0.00 | 0.00 |
| Reference | PVA 9% | PVA + S 14 kV | PVA + S 20 kV | PVA + T 14 kV | PVA + T 20 kV |
|---|---|---|---|---|---|
| Size (nm) | 0.2256 | 0.098 | 0.0972 | 0.1408 | 0.1238 |
| Reference | A | B | A/B | C | D | C/D |
|---|---|---|---|---|---|---|
| I3300 | I2915 | I3300/I2915 | I 1640 | I1734 | I1640/I1734 | |
| PVA | 0.1007 | 0.0546 | 1.8443 | 0.0263 | 0.0153 | 1.7189 |
| SAGE (S) | 0.0062 | 0.1288 | 0.0481 | 0.0156 | 0.219 | 0.0712 |
| PVA-S Electrospun | 0.1381 | 0.0827 | 1.6699 | 0.0307 | 0.0231 | 1.3290 |
| Reference | E | F | E/F | I | I/E |
|---|---|---|---|---|---|
| I3300 | I2915 | I3300/I2915 | I812 | I812/I3300 | |
| PVA | 0.1018 | 0.0532 | 1.9135 | 0.0805 | 0.7908 |
| Thyme (T) | 0.1100 | 0.1261 | 0.8723 | 0.1329 | 1.2082 |
| PVA-T Electrospun | 0.0963 | 0.0639 | 1.5070 | 0.1011 | 1.0498 |
| Reference | E | H | H/E | I | I/E | G1 | G2 | G1/G2 |
|---|---|---|---|---|---|---|---|---|
| I3300 | I1420 | I1420/I3300 | I1226 | I1226/I3300 | I1700 | I1640 | I1700/I1640 | |
| PVA | 0.1018 | 0.0535 | 1.1863 | 0.0451 | 0.4430 | 0.0123 | 0.0265 | 0.4642 |
| Thyme (T) | 0.1100 | 0.1112 | 1.3745 | 0.0809 | 0.7355 | 0.032 | 0.0491 | 0.6517 |
| PVA-T Electrospun | 0.0963 | 0.068 | 1.2274 | 0.0554 | 0.5753 | 0.0156 | 0.0188 | 0.8298 |
| % Reduction (cfu/mL) | S | T | S 20 kV | T 20 kV |
|---|---|---|---|---|
| Oil | Oil | Nanofibers | Nanofibers | |
| Escherichia coli | 99.99 | 99.99 | 99.99 | 99.99 |
Publisher’s Note: MDPI stays neutral with regard to jurisdictional claims in published maps and institutional affiliations. |
© 2022 by the authors. Licensee MDPI, Basel, Switzerland. This article is an open access article distributed under the terms and conditions of the Creative Commons Attribution (CC BY) license (https://creativecommons.org/licenses/by/4.0/).
Share and Cite
Mínguez-García, D.; Breve, N.; Capablanca, L.; Bonet-Aracil, M.; Díaz-García, P.; Gisbert-Payá, J. Liquid Oil Trapped inside PVA Electrospun Microcapsules. Polymers 2022, 14, 5242. https://doi.org/10.3390/polym14235242
Mínguez-García D, Breve N, Capablanca L, Bonet-Aracil M, Díaz-García P, Gisbert-Payá J. Liquid Oil Trapped inside PVA Electrospun Microcapsules. Polymers. 2022; 14(23):5242. https://doi.org/10.3390/polym14235242
Chicago/Turabian StyleMínguez-García, David, Noel Breve, Lucía Capablanca, Marilés Bonet-Aracil, Pablo Díaz-García, and Jaime Gisbert-Payá. 2022. "Liquid Oil Trapped inside PVA Electrospun Microcapsules" Polymers 14, no. 23: 5242. https://doi.org/10.3390/polym14235242
APA StyleMínguez-García, D., Breve, N., Capablanca, L., Bonet-Aracil, M., Díaz-García, P., & Gisbert-Payá, J. (2022). Liquid Oil Trapped inside PVA Electrospun Microcapsules. Polymers, 14(23), 5242. https://doi.org/10.3390/polym14235242