Resistance and Strength of Conductive PLA Processed by FDM Additive Manufacturing
Abstract
1. Introduction
2. Materials and Methods
- Volume resistivity of molded resin (not 3D Printed): 15 ohm-cm
- Volume resistivity of 3D printed parts perpendicular to layers: 30 ohm-cm
- Volume resistivity of 3D printed parts through layers (along Z axis): 115 ohm-cm
- Resistance of a 10 cm length of 1.75 mm filament: 2–3 kohm
- Resistance of a 10 cm length of 2.85 mm filament: 800–1200 ohm
2.1. Tensile Strength Measurement
2.2. Resistance Measurement
3. Results and Discussion
3.1. Evaluation of Tensile Strength Measurement
3.2. Evaluation of Resistance Measurement
4. Conclusions
Author Contributions
Funding
Institutional Review Board Statement
Informed Consent Statement
Data Availability Statement
Conflicts of Interest
References
- Brancewicz-Steinmetz, E.; Sawicki, J.; Byczkowska, P. The Influence of 3D Printing Parameters on Adhesion between Polylactic Acid (PLA) and Thermoplastic Polyurethane (TPU). Materials 2021, 14, 6464. [Google Scholar] [CrossRef] [PubMed]
- Daminabo, S.C.; Goel, S.; Grammatikos, S.A.; Nezhad, H.Y.; Thakur, V.K. FDM-based Additive Manufacturing (3D Printing): Techniques for Polymer Material Systems. Mater. Today 2020, 16, 100248. [Google Scholar] [CrossRef]
- Gordelier, T.J.; Thies, P.R.; Turner, L.; Johanning, L. Optimising the FDM additive manufacturing process to achieve maximum tensile strength: A state-of-the-art review. Rapid Prototyp. J. 2019, 25, 953–971. [Google Scholar] [CrossRef]
- Özen, A.; Auhl, D.; Völlmecke, C.; Kiendl, J.; Abali, B.E. Optimization of Manufacturing Parameters and Tensile Specimen Geometry for Fused Deposition Modeling (FDM) 3D-Printed PETG. Materials 2021, 14, 2556. [Google Scholar] [CrossRef] [PubMed]
- Beniak, J.; Križan, P.; Šooš, Ľ.; Matúš, M. Research on Shape and Dimensional Accuracy of FDM Produced Parts. IOP Conf. Ser. Mater. Sci. Eng. 2019, 501, 012030. [Google Scholar] [CrossRef]
- Verdejo de Toro, E.; Coello Sobrino, J.; Martínez Martínez, A.; Miguel Eguía, V.; Ayllón Pérez, J. Investigation of a Short Carbon Fibre-Reinforced Polyamide and Comparison of Two Manufacturing Processes: Fused Deposition Modelling (FDM) and Polymer Injection Moulding (PIM). Materials 2020, 13, 672. [Google Scholar] [CrossRef]
- Kim, H.; Park, E.; Kim, S.; Park, B.; Kim, N.; Lee, S. Experimental study on mechanical properties of single- and dual-material 3D printed products. Procedia Manuf. 2017, 10, 887–897. [Google Scholar] [CrossRef]
- Travieso-Rodriguez, J.A.; Jerez-Mesa, R.; Llumà, J.; Traver-Ramos, O.; Gomez-Gras, G.; Roa Rovira, J.J. Mechanical properties of 3D-printing polylactic acid parts subjected to bending stress and fatigue testing. Materials 2019, 12, 3859. [Google Scholar] [CrossRef]
- Zhang, J.; Jung, Y. Additive Manufacturing: Materials, Processes, Quantifications and Applications; Butterworth-Heinemann: Oxford, UK; Elsevier: Amsterdam, The Netherlands, 2018. [Google Scholar]
- EasyWood PLA Material, Formfutura, Online. Available online: https://formfutura.com/shop/product/easywood-2804?category=465 (accessed on 15 December 2021).
- Srivatsan, T.; Sudarshan, T. Additive Manufacturing: Innovations, Advances, and Applications; CRC Press: Boca Raton, FL, USA; Taylor & Francis: Abingdon-on-Thames, UK, 2015. [Google Scholar]
- Kalova, M.; Rusnakova, S.; Krzikalla, D.; Mesicek, J.; Tomasek, R.; Podeprelova, A.; Rosicky, J.; Pagac, M. 3D Printed Hollow Off-Axis Profiles Based on Carbon Fiber-Reinforced Polymers: Mechanical Testing and Finite Element Method Analysis. Polymers 2021, 13, 2949. [Google Scholar] [CrossRef]
- Stejskal, T.; Dovica, M.; Svetlik, J.; Demec, P. Experimental assessment of the static stiffness of machine parts and structures by changing the magnitude of the hysteresis as a function of loading. Open Eng. 2019, 9, 655–659. [Google Scholar] [CrossRef]
- Silva, J.V.; Rezende, R.A. Additive Manufacturing and its future impact in logistics. IFAC Proc. 2013, 46, 277–282. [Google Scholar] [CrossRef]
- Lee, B.N.; Pei, E.; Um, J. An overview of information technology standardization activities related to additive manufacturing. Prog. Addit. Manuf. 2019, 4, 345–354. [Google Scholar] [CrossRef]
- Huang, J.C. Carbon black filled conducting polymers and polymer blends. Adv. Polym. Technol. 2002, 21, 299–313. [Google Scholar] [CrossRef]
- Chen, J.; Du, X.-C.; Zhang, W.-B.; Yang, J.-H.; Zhang, N.; Huang, T.; Wang, Y. Synergistic effect of carbon nanotubes and carbon black on electrical conductivity of PA6/ABS blend. Compos. Sci. Technol. 2013, 81, 1–8. [Google Scholar] [CrossRef]
- Meincke, O.; Kaempfer, D.; Weickmann, H.; Friedrich, C.; Vathauer, M.; Warth, H. Mechanical properties and electrical conductivity of carbon-nanotube filled polyamide-6 and its blends with acrylonitrile/butadiene/styrene. Polymer 2004, 45, 739–748. [Google Scholar] [CrossRef]
- Zhang, W.; Dehghani-Sanij, A.A.; Blackburn, R.S. Carbon based conductive polymercomposites. J. Mater. Sci. 2007, 42, 3408–3418. [Google Scholar] [CrossRef]
- Shang, S.M.; Zeng, W.; Tao, X.M. High stretchable MWNTs/polyurethaneconductive nanoomposites. J. Mater. Chem. 2011, 21, 7274–7280. [Google Scholar] [CrossRef]
- Liu, X.-M.; Huang, Z.D.; Oh, S.W.; Zhang, B.; Ma, P.-C.; Yuen, M.M.; Kim, J.-K. Carbon nanotube (CNT)-based composites as electrode material for rechargeable Li-ion batteries: A review. Compos. Sci. Technol. 2011, 72, 121–144. [Google Scholar] [CrossRef]
- Dharaiya, D.P.; Jana, S.C.; Lyuksyutov, S.F. Production of electrically conductivenetworks in immiscible polymer blends by chaotic mixing. Polym. Eng. Sci. 2005, 46, 19–28. [Google Scholar] [CrossRef]
- Thongruang, W.; Spontak, R.J.; Balik, C. Correlated electrical conductivity and mechanical property analysis of high-density polyethylene filled with graphite and carbon fiber. Polymer 2002, 43, 2279–2286. [Google Scholar] [CrossRef]
- Ai-Saleh, M.H.; Sundararaj, U. A review of vapor grown carbon nanofiber/polymer conductive composites. Carbon 2009, 47, 2–22. [Google Scholar] [CrossRef]
- Ai-Saleh, M.H.; Sundararaj, U. Processing-microstructure0property relationship in conductive polymer nanocomposites. Polymer 2010, 51, 2740–2747. [Google Scholar] [CrossRef]
- Costa, P.; Silva, J.; Sencadas, V.; Costa, C.M.; van Hattum, F.; Rocha, J.G.; Lanceros-Mendez, S. The effect of fibre concentration on the α to β-phase transformation, degree of crystallinity and electrical properties of vapour grown carbon nanofibre/poly(vinylidene fluoride) composites. Carbon 2009, 47, 2590–2599. [Google Scholar] [CrossRef]
- Wang, R.X.; Tao, X.M.; Wang, Y.; Wang, G.F.; Shang, S.M. Microstructures and electrical conductance of silver nanocrystalline thin films on flexible polymer substrates. Surf. Coat. Technol. 2010, 204, 1206–1210. [Google Scholar] [CrossRef]
- Yang, X.M.; Li, L.; Shang, S.M.; Tao, X.M. Water-based amorphous carbon nanotubes filled polymer nanocomposites. J. Appl. Polym. Sci. 2011, 122, 1986–1992. [Google Scholar] [CrossRef]
- Liu, F.J.; Shang, S.M.; Duan, Y.J.; Li, L. Electrical and optical properties of polymereAu nanocomposite films synthesized by magnetron co-sputtering. J. Appl. Polym. Sci. 2011, 123, 2800–2804. [Google Scholar] [CrossRef]
- Shang, S.M.; Zeng, W.; Tao, X.M. Highly Stretchable Conductive Polymer Composited with Carbon Nanotubes and Nanospheres. Adv. Mater. Res. 2010, 123-125, 109–112. [Google Scholar] [CrossRef]
- Dang, Z.-M.; Yuan, J.; Zha, J.-W.; Zhou, T.; Li, S.-T.; Hu, G.-H. Fundamentals, processes and applications of high-permittivity polymer–matrix composites. Prog. Mater. Sci. 2011, 57, 660–723. [Google Scholar] [CrossRef]
- Spitalsky, Z.; Tasis, D.; Papagelis, K.; Galiotis, C. Carbon nanotube-polymer composites: Chemistry, processing, mechanical and electrical properties. Prog. Polym. Sci. 2010, 35, 357–401. [Google Scholar] [CrossRef]
- Zhang, Q.-H.; Chen, D.-J. Percolation threshold and morphology of composites of conducting carbon black/polypropylene/EVA. J. Mater. Sci. 2004, 39, 1751–1757. [Google Scholar] [CrossRef]
- Li, Y.; Wang, S.F.; Zhang, Y.; Zhang, Y.X. Carbon black-filled immiscible polypropylene/ epoxy blends. J. Appl. Polym. Sci. 2006, 99, 461–471. [Google Scholar] [CrossRef]
- Yu, J.; Zhang, L.Q.; Rogunova, M.; Summers, J.; Hiltner, A.; Baer, E. Conductivity of polyolefins filled with high-structure carbon black. J. Appl. Polym. Sci. 2005, 98, 1799–1805. [Google Scholar] [CrossRef]
- Kausar, A.; Taherian, R. Electrical conductivity behavior of polymer nanocomposite with carbon nanofillers. In Electrical Conductivity in Polymer-Based Composites: Experiments, Modelling, and Applications; Elsevier: Amsterdam, The Netherlands, 2019; pp. 41–72. [Google Scholar] [CrossRef]
- Wen, M.; Sun, X.; Su, L.; Shen, J.; Li, J.; Guo, S. The electrical conductivity of carbon nanotube/carbon black/polypropylene composites prepared through multistage stretching extrusion. Polymer 2012, 53, 1602–1610. [Google Scholar] [CrossRef]
- Balberg, I. A comprehensive picture of the electrical phenomena in carbon blackepolymer composites. Carbon 2002, 40, 139–143. [Google Scholar] [CrossRef]
- Luo, S.J.; Wong, C.P. Study on effect of carbon black on behavior of conductive polymer composites with positive temperature coefficient. IEEE Trans. Compon. Packag. Technol. 2000, 23, 151–156. [Google Scholar] [CrossRef][Green Version]
- Kohjiya, S.; Katoh, A.; Suda, T.; Shimanuki, J.; Ikeda, Y. Visualisation of carbon black networks in rubbery matrix by skeletonisation of 3D-TEM image. Polymer 2006, 47, 3298–3301. [Google Scholar] [CrossRef]
- Beniak, J.; Krizan, P.; Matus, M. Mechanical properties of biodegradable PLA plastic parts produced by 3D printing. MM Sci. J. 2019, 2019, 2746–2750. [Google Scholar] [CrossRef]
- Vanaei, H.; Shirinbayan, M.; Vanaei, S.; Fitoussi, J.; Khelladi, S.; Tcharkhtchi, A. Multi-scale damage analysis and fatigue behavior of PLA manufactured by fused deposition modeling (FDM). Rapid Prototyp. J. 2020, 27, 371–378. [Google Scholar] [CrossRef]
- Tirado-Garcia, I.; Garcia-Gonzalez, D.; Garzon-Hernandez, S.; Rusinek, A.; Robles, G.; Martinez-Tarifa, J.; Arias, A. Conductive 3D printed PLA composites: On the interplay of mechanical, electrical and thermal behaviours. Compos. Struct. 2021, 265, 113744. [Google Scholar] [CrossRef]
- Stopforth, R. Conductive polylactic acid filaments for 3D printed sensors: Experimental electrical and thermal characterization. Sci. Afr. 2021, 14, e01040. [Google Scholar] [CrossRef]
- Marasso, S.L.; Cocuzza, M.; Bertana, V.; Perrucci, F.; Tommasi, A.; Ferrero, S.; Scaltrito, L.; Pirri, C.F. PLA conductive filament for 3D printed smart sensing applications. Rapid Prototyp. J. 2018, 24, 739–743. [Google Scholar] [CrossRef]



| FACTORS | LEVEL 1 | LEVEL 2 |
|---|---|---|
| A—INFILL VOLUME | 50% | 90% |
| B—LAYER HEIGHT | 0.125 mm | 0.250 mm |
| C—INFILL TYPE | Rectilinear | Honeycomb |
| Exp. | A | B | C | A | B | C |
|---|---|---|---|---|---|---|
| 1 | 1 | 1 | 1 | 50% | 0.125 mm | Rectilinear |
| 2 | 1 | 1 | 2 | 50% | 0.125 mm | Honeycomb |
| 3 | 1 | 2 | 1 | 50% | 0.250 mm | Rectilinear |
| 4 | 1 | 2 | 2 | 50% | 0.250 mm | Honeycomb |
| 5 | 2 | 1 | 1 | 90% | 0.125 mm | Rectilinear |
| 6 | 2 | 1 | 2 | 90% | 0.125 mm | Honeycomb |
| 7 | 2 | 2 | 1 | 90% | 0.250 mm | Rectilinear |
| 8 | 2 | 2 | 2 | 90% | 0.250 mm | Honeycomb |
| Factors | Level 1 | Level 2 | Level x | Level 10 |
|---|---|---|---|---|
| A—length | 10 mm | 20 mm | X mm | 100 mm |
| B—Nozzle temperature | 190 °C | 220 °C | - | - |
| C—measurement temp. | 25 °C | 80 °C | - | - |
| Exp. | A | B | C | A | B | C |
|---|---|---|---|---|---|---|
| 1 | 1 | 1 | 1 | 10 mm | 190 °C | 25 °C |
| 2 | 1 | 1 | 2 | 10 mm | 190 °C | 80 °C |
| 3 | 1 | 2 | 1 | 10 mm | 220 °C | 25 °C |
| 4 | 1 | 2 | 2 | 10 mm | 220 °C | 80 °C |
| 5 | 2 | 1 | 1 | 20 mm | 190 °C | 25 °C |
| 6 | 2 | 1 | 2 | 20 mm | 190 °C | 80 °C |
| 7 | 2 | 2 | 1 | 20 mm | 220 °C | 25 °C |
| 8 | 2 | 2 | 2 | 20 mm | 220 °C | 80 °C |
| 9 | 3 | 1 | 1 | 30 mm | 190 °C | 25 °C |
| 10 | 3 | 1 | 2 | 30 mm | 190 °C | 80 °C |
| 11 | 3 | 2 | 1 | 30 mm | 220 °C | 25 °C |
| 12 | 3 | 2 | 2 | 30 mm | 220 °C | 80 °C |
| 13 | 4 | 1 | 1 | 40 mm | 190 °C | 25 °C |
| 14 | 4 | 1 | 2 | 40 mm | 190 °C | 80 °C |
| 15 | 4 | 2 | 1 | 40 mm | 220 °C | 25 °C |
| 16 | 4 | 2 | 2 | 40 mm | 220 °C | 80 °C |
| 17 | 5 | 1 | 1 | 50 mm | 190 °C | 25 °C |
| 18 | 5 | 1 | 2 | 50 mm | 190 °C | 80 °C |
| 19 | 5 | 2 | 1 | 50 mm | 220 °C | 25 °C |
| 20 | 5 | 2 | 2 | 50 mm | 220 °C | 80 °C |
| 21 | 6 | 1 | 1 | 60 mm | 190 °C | 25 °C |
| 22 | 6 | 1 | 2 | 60 mm | 190 °C | 80 °C |
| 23 | 6 | 2 | 1 | 60 mm | 220 °C | 25 °C |
| 24 | 6 | 2 | 2 | 60 mm | 220 °C | 80 °C |
| 25 | 7 | 1 | 1 | 70 mm | 190 °C | 25 °C |
| 26 | 7 | 1 | 2 | 70 mm | 190 °C | 80 °C |
| 27 | 7 | 2 | 1 | 70 mm | 220 °C | 25 °C |
| 28 | 7 | 2 | 2 | 70 mm | 220 °C | 80 °C |
| 29 | 8 | 1 | 1 | 80 mm | 190 °C | 25 °C |
| 30 | 8 | 1 | 2 | 80 mm | 190 °C | 80 °C |
| 31 | 8 | 2 | 1 | 80 mm | 220 °C | 25 °C |
| 32 | 8 | 2 | 2 | 80 mm | 220 °C | 80 °C |
| 33 | 9 | 1 | 1 | 90 mm | 190 °C | 25 °C |
| 34 | 9 | 1 | 2 | 90 mm | 190 °C | 80 °C |
| 35 | 9 | 2 | 1 | 90 mm | 220 °C | 25 °C |
| 36 | 9 | 2 | 2 | 90 mm | 220 °C | 80 °C |
| 37 | 10 | 1 | 1 | 100 mm | 190 °C | 25 °C |
| 38 | 10 | 1 | 2 | 100 mm | 190 °C | 80 °C |
| 39 | 10 | 2 | 1 | 100 mm | 220 °C | 25 °C |
| 40 | 10 | 2 | 2 | 100 mm | 220 °C | 80 °C |
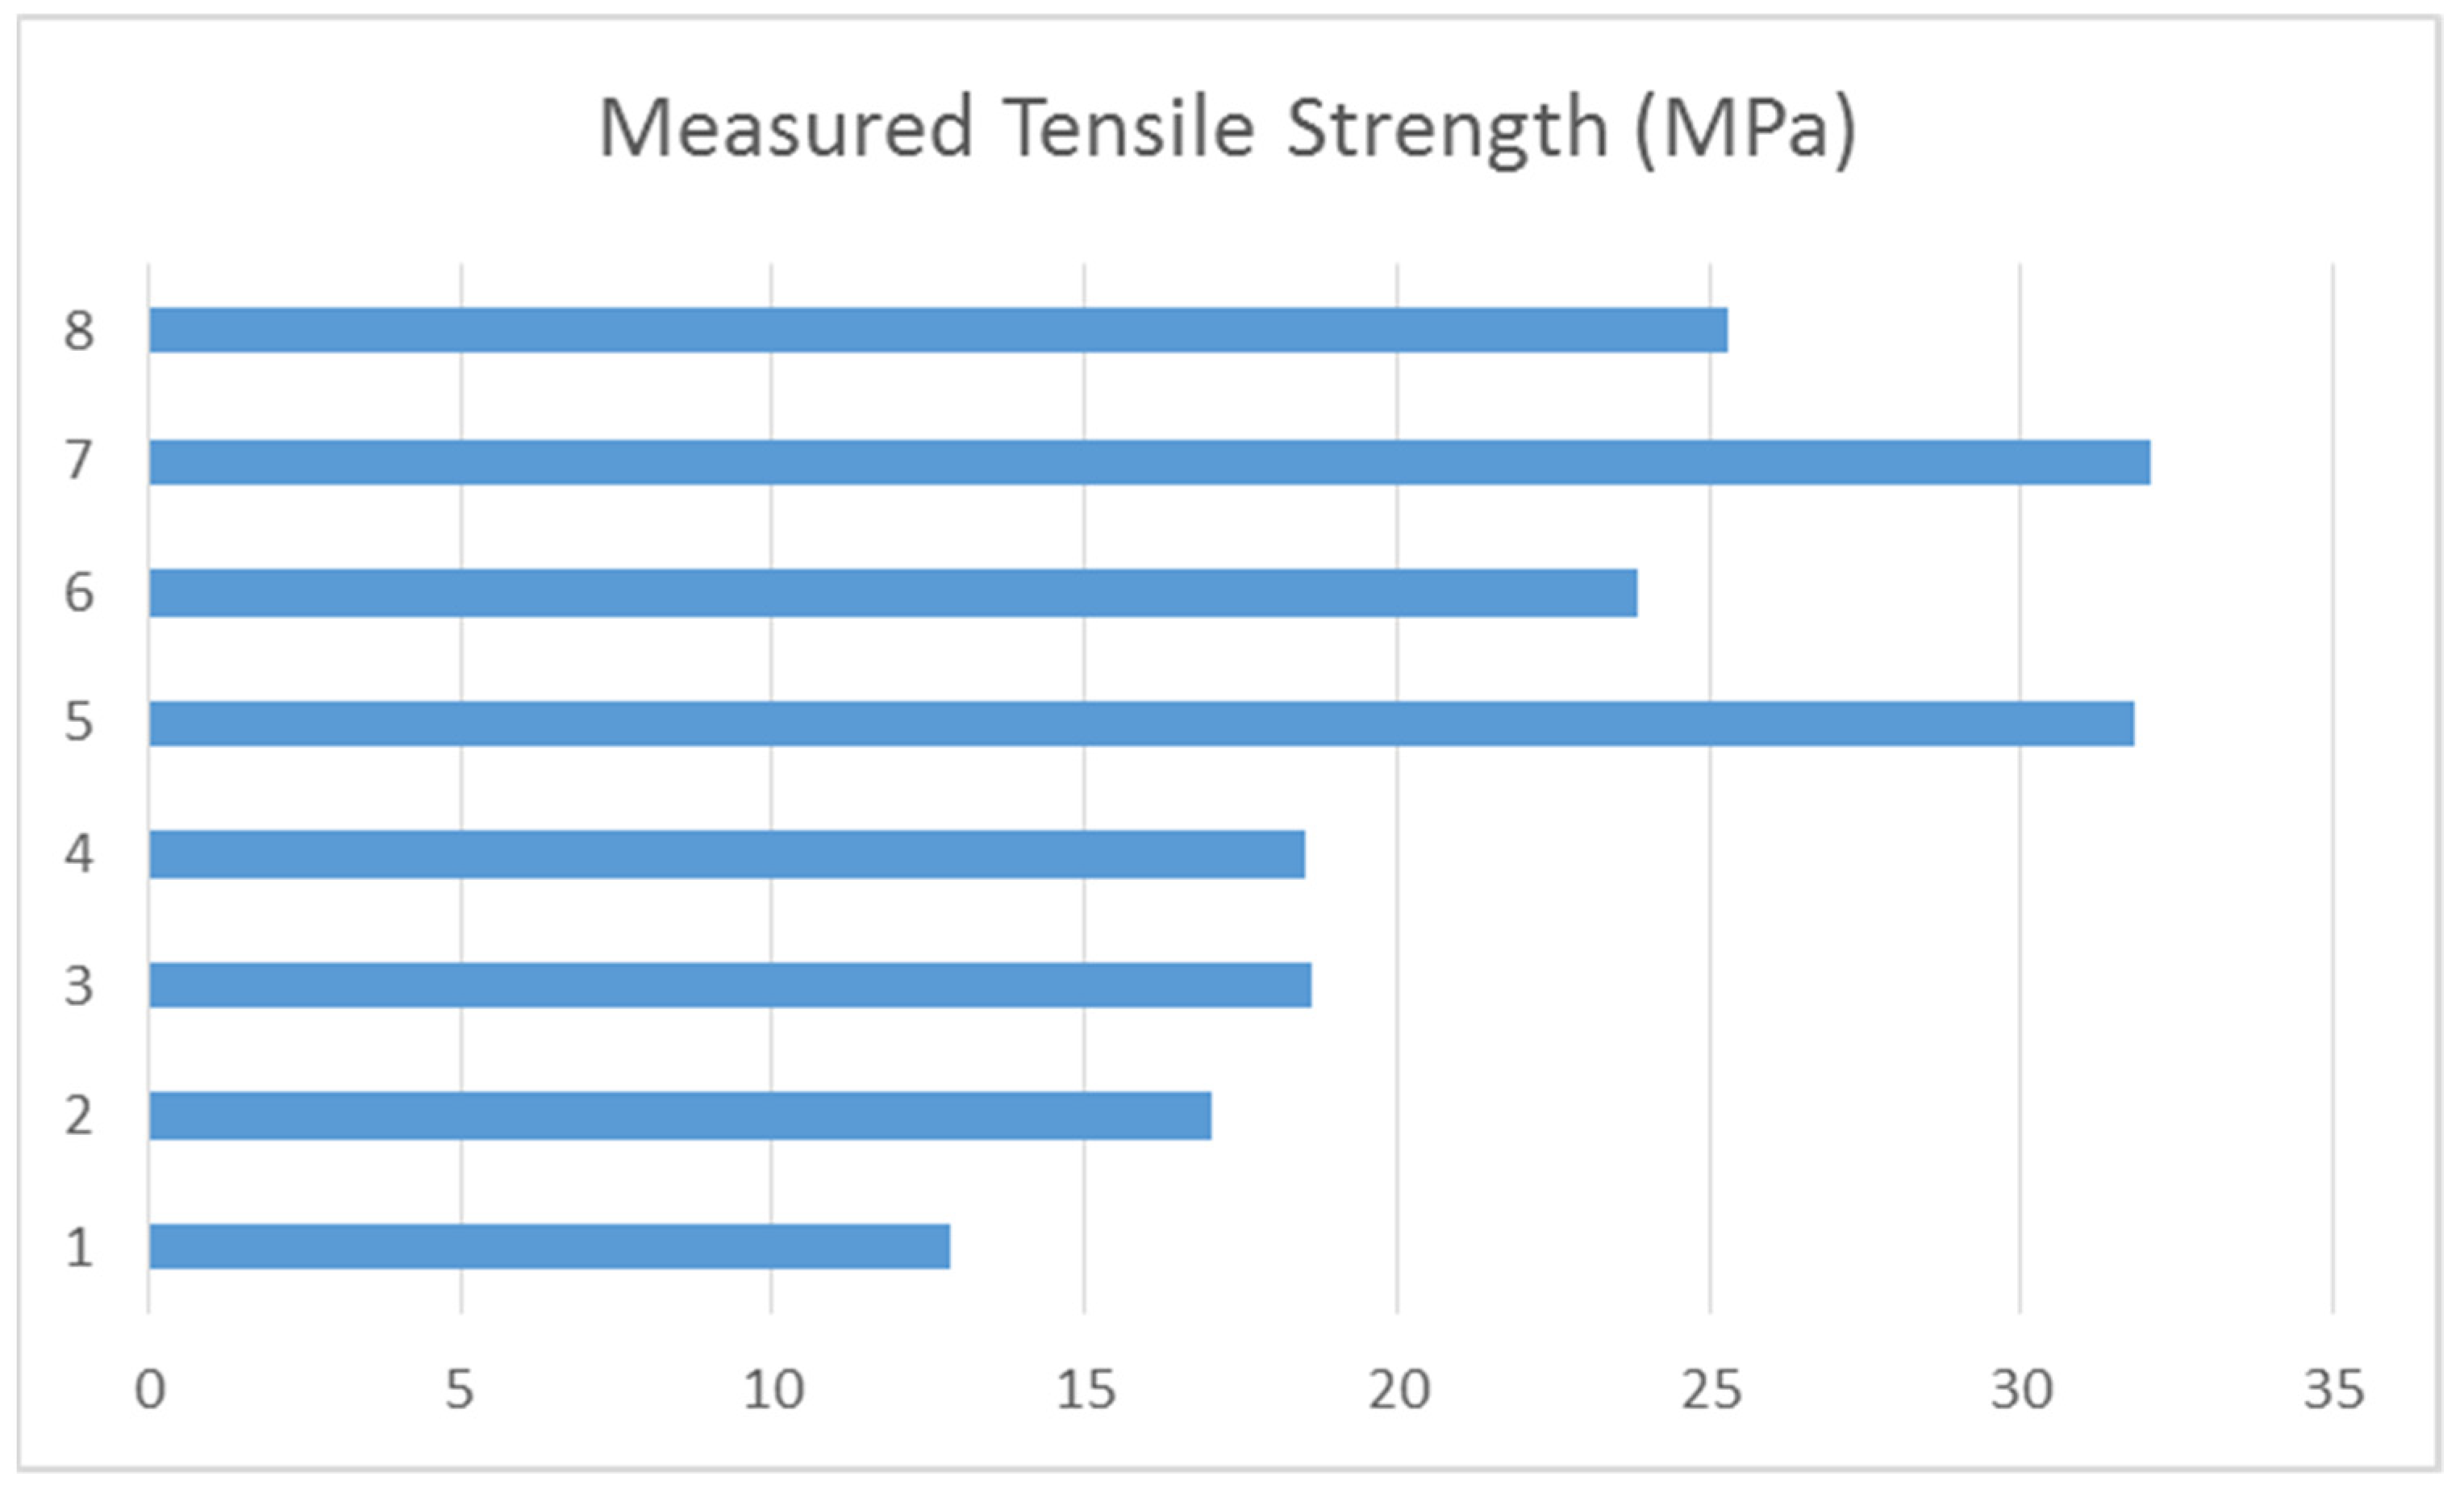
| Exp. | A | B | C | Rm1 | Rm2 | Rm3 | Rm4 | Rm (MPa) |
|---|---|---|---|---|---|---|---|---|
| 1 | 1 | 1 | 1 | 12.84 | 12.84 | 12.59 | 13.04 | 12.83 |
| 2 | 1 | 1 | 2 | 16.47 | 16.12 | 17.76 | 17.76 | 17.03 |
| 3 | 1 | 2 | 1 | 19.02 | 18.96 | 17.84 | 18.85 | 18.66 |
| 4 | 1 | 2 | 2 | 18.24 | 19.1 | 18.1 | 18.75 | 18.55 |
| 5 | 2 | 1 | 1 | 32.88 | 31.28 | 31.02 | 32.03 | 31.80 |
| 6 | 2 | 1 | 2 | 23.56 | 23.67 | 23.79 | 24.35 | 23.84 |
| 7 | 2 | 2 | 1 | 32.58 | 32.03 | 31.98 | 31.82 | 32.10 |
| 8 | 2 | 2 | 2 | 25.2 | 25.43 | 24.9 | 25.62 | 25.29 |
| FACTOR/ INTERACTIONS | F (Calculated) | p Significancy | SS | MSe | Ftab 0.95 |
|---|---|---|---|---|---|
| A | F (1, 24) = 3641 | p < 0.000001 | SS = 1056.39 | MSe = 0.29 | 4.242 |
| B | F (1, 24) = 143 | p < 0.000001 | SS = 41.45 | MSe = 0.29 | 4.242 |
| C | F (1, 24) = 197 | p < 0.000001 | SS = 57.19 | MSe = 0.29 | 4.242 |
| A × B | F (1, 24) = 54.3 | p < 0.000001 | SS = 15.76 | MSe = 0.29 | 4.242 |
| A × C | F (1, 24) = 613 | p < 0.000001 | SS = 177.76 | MSe = 0.29 | 4.242 |
| B × C | F (1, 24) = 17.4 | p < 0.000344 | SS = 5.04 | MSe = 0.29 | 4.242 |
| A × B × C | F (1, 24) = 51.5 | p < 0.000001 | SS = 14.93 | MSe = 0.29 | 4.242 |
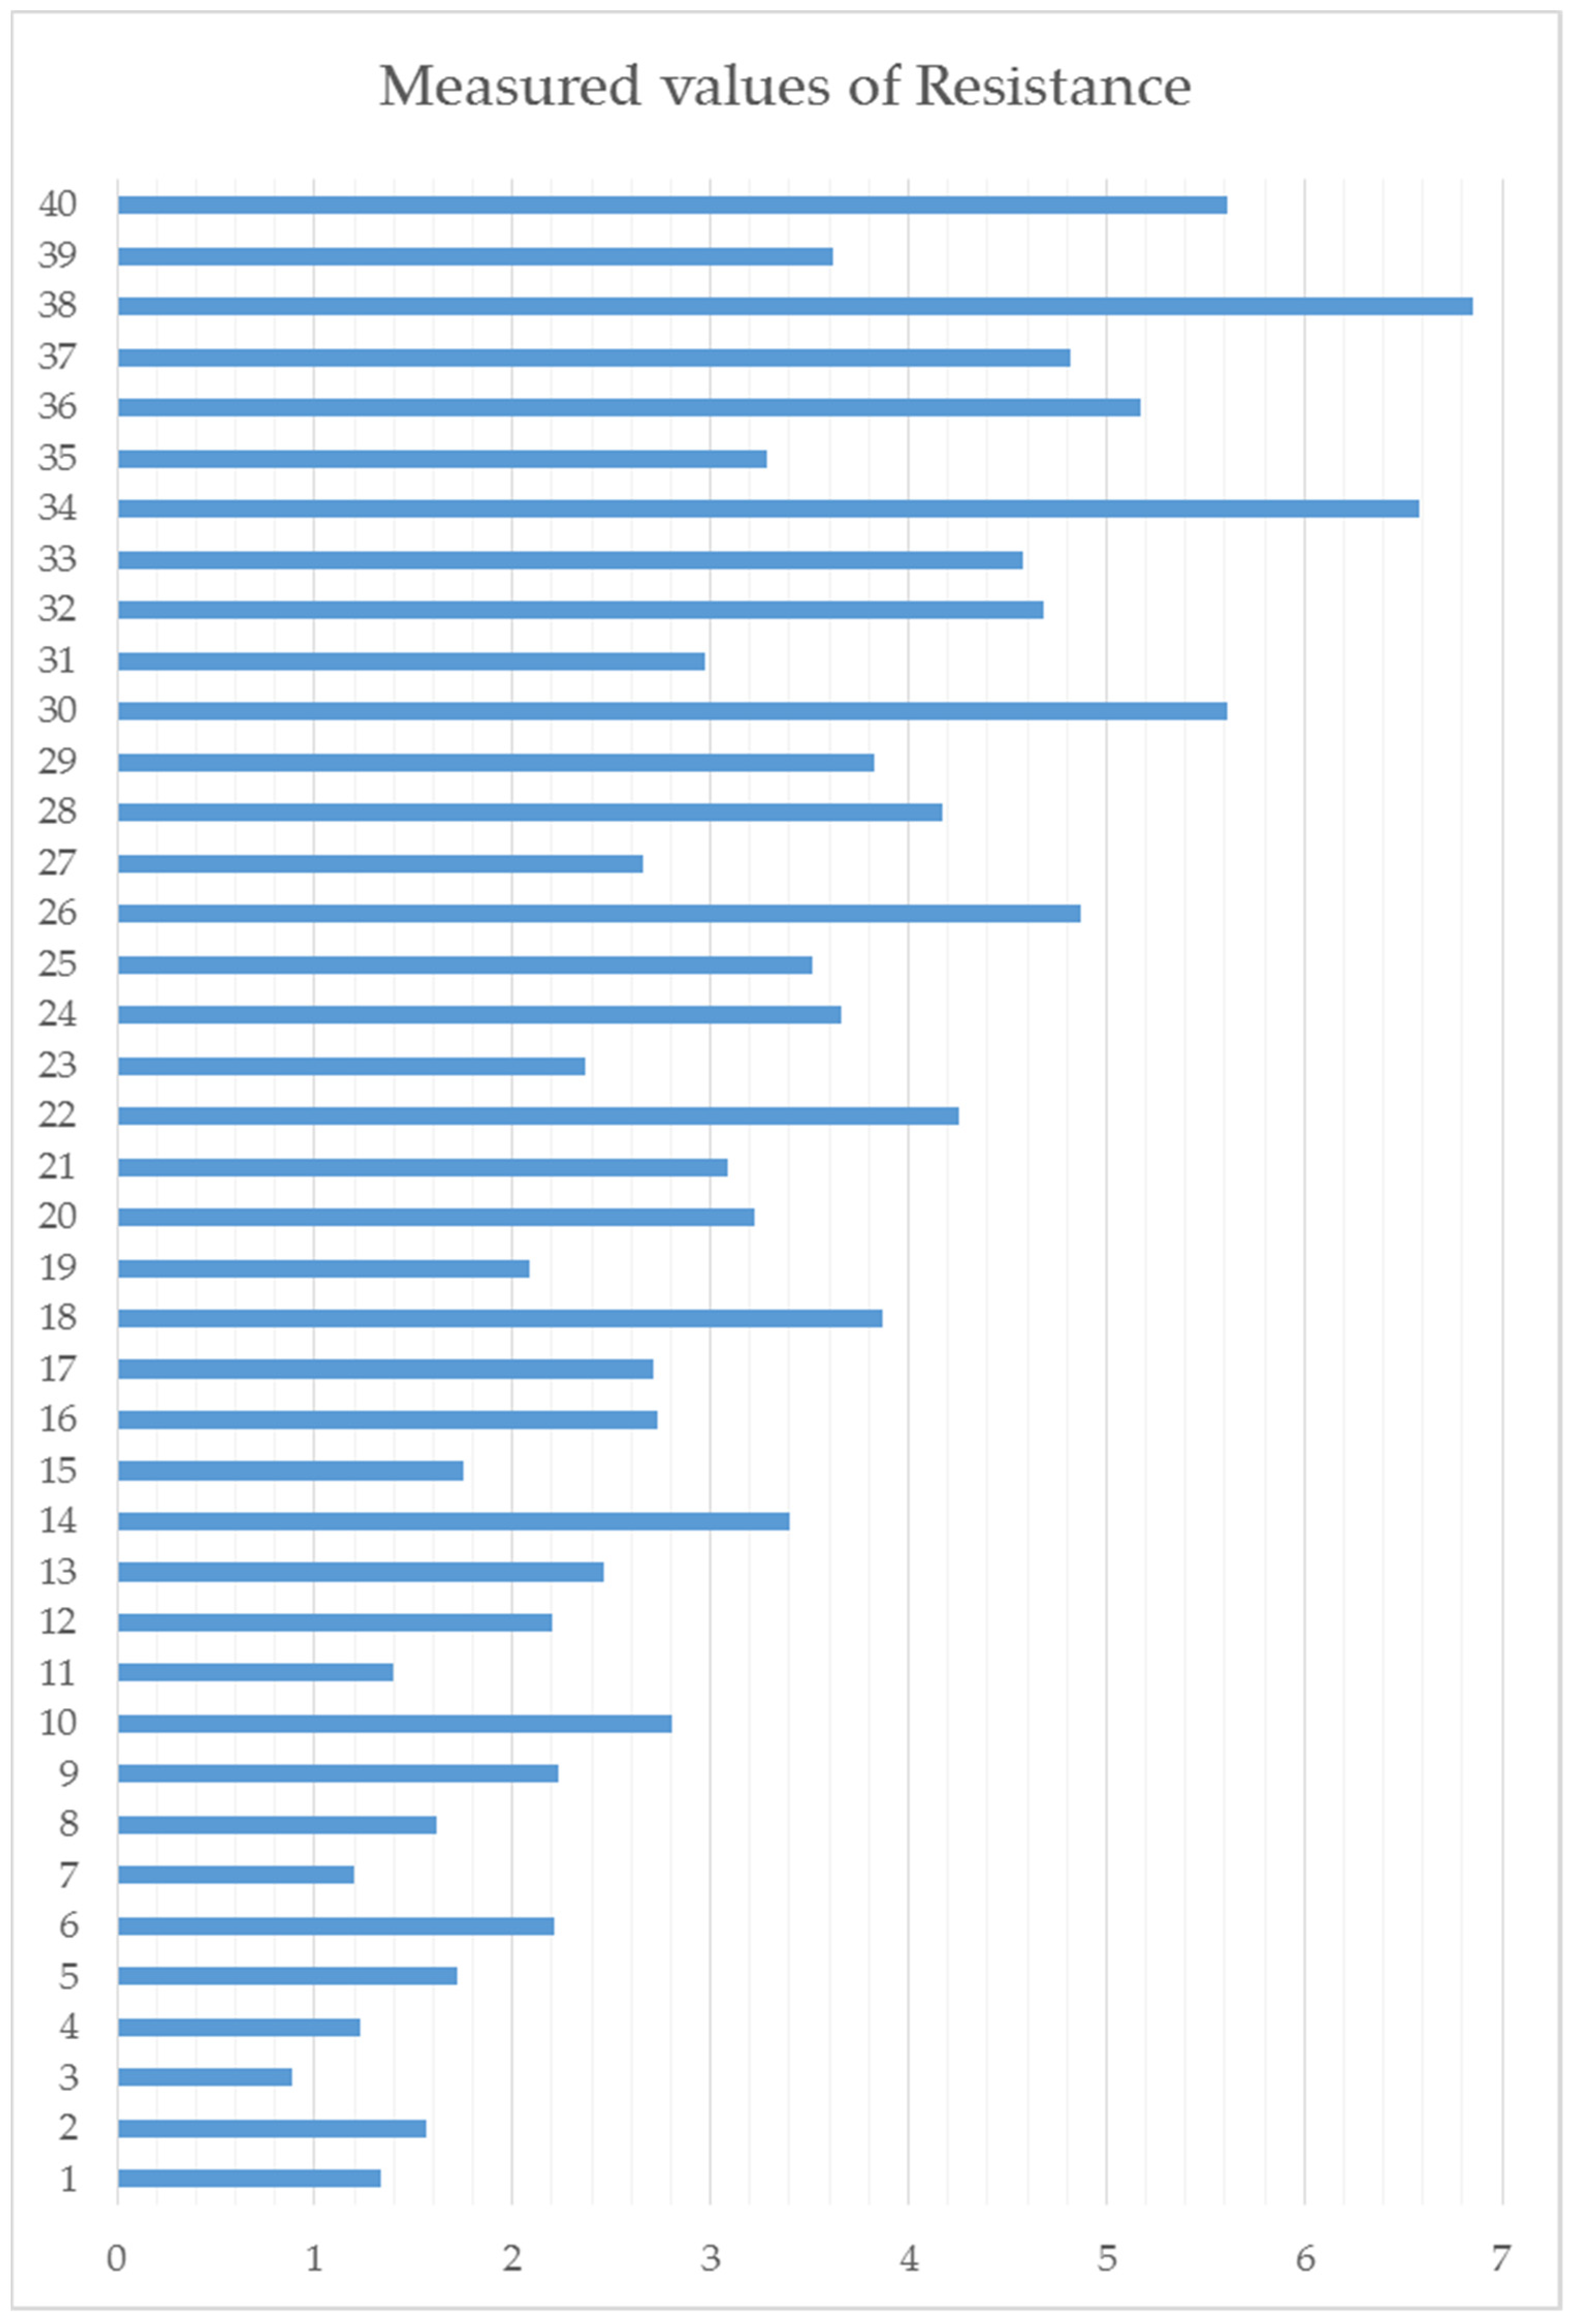
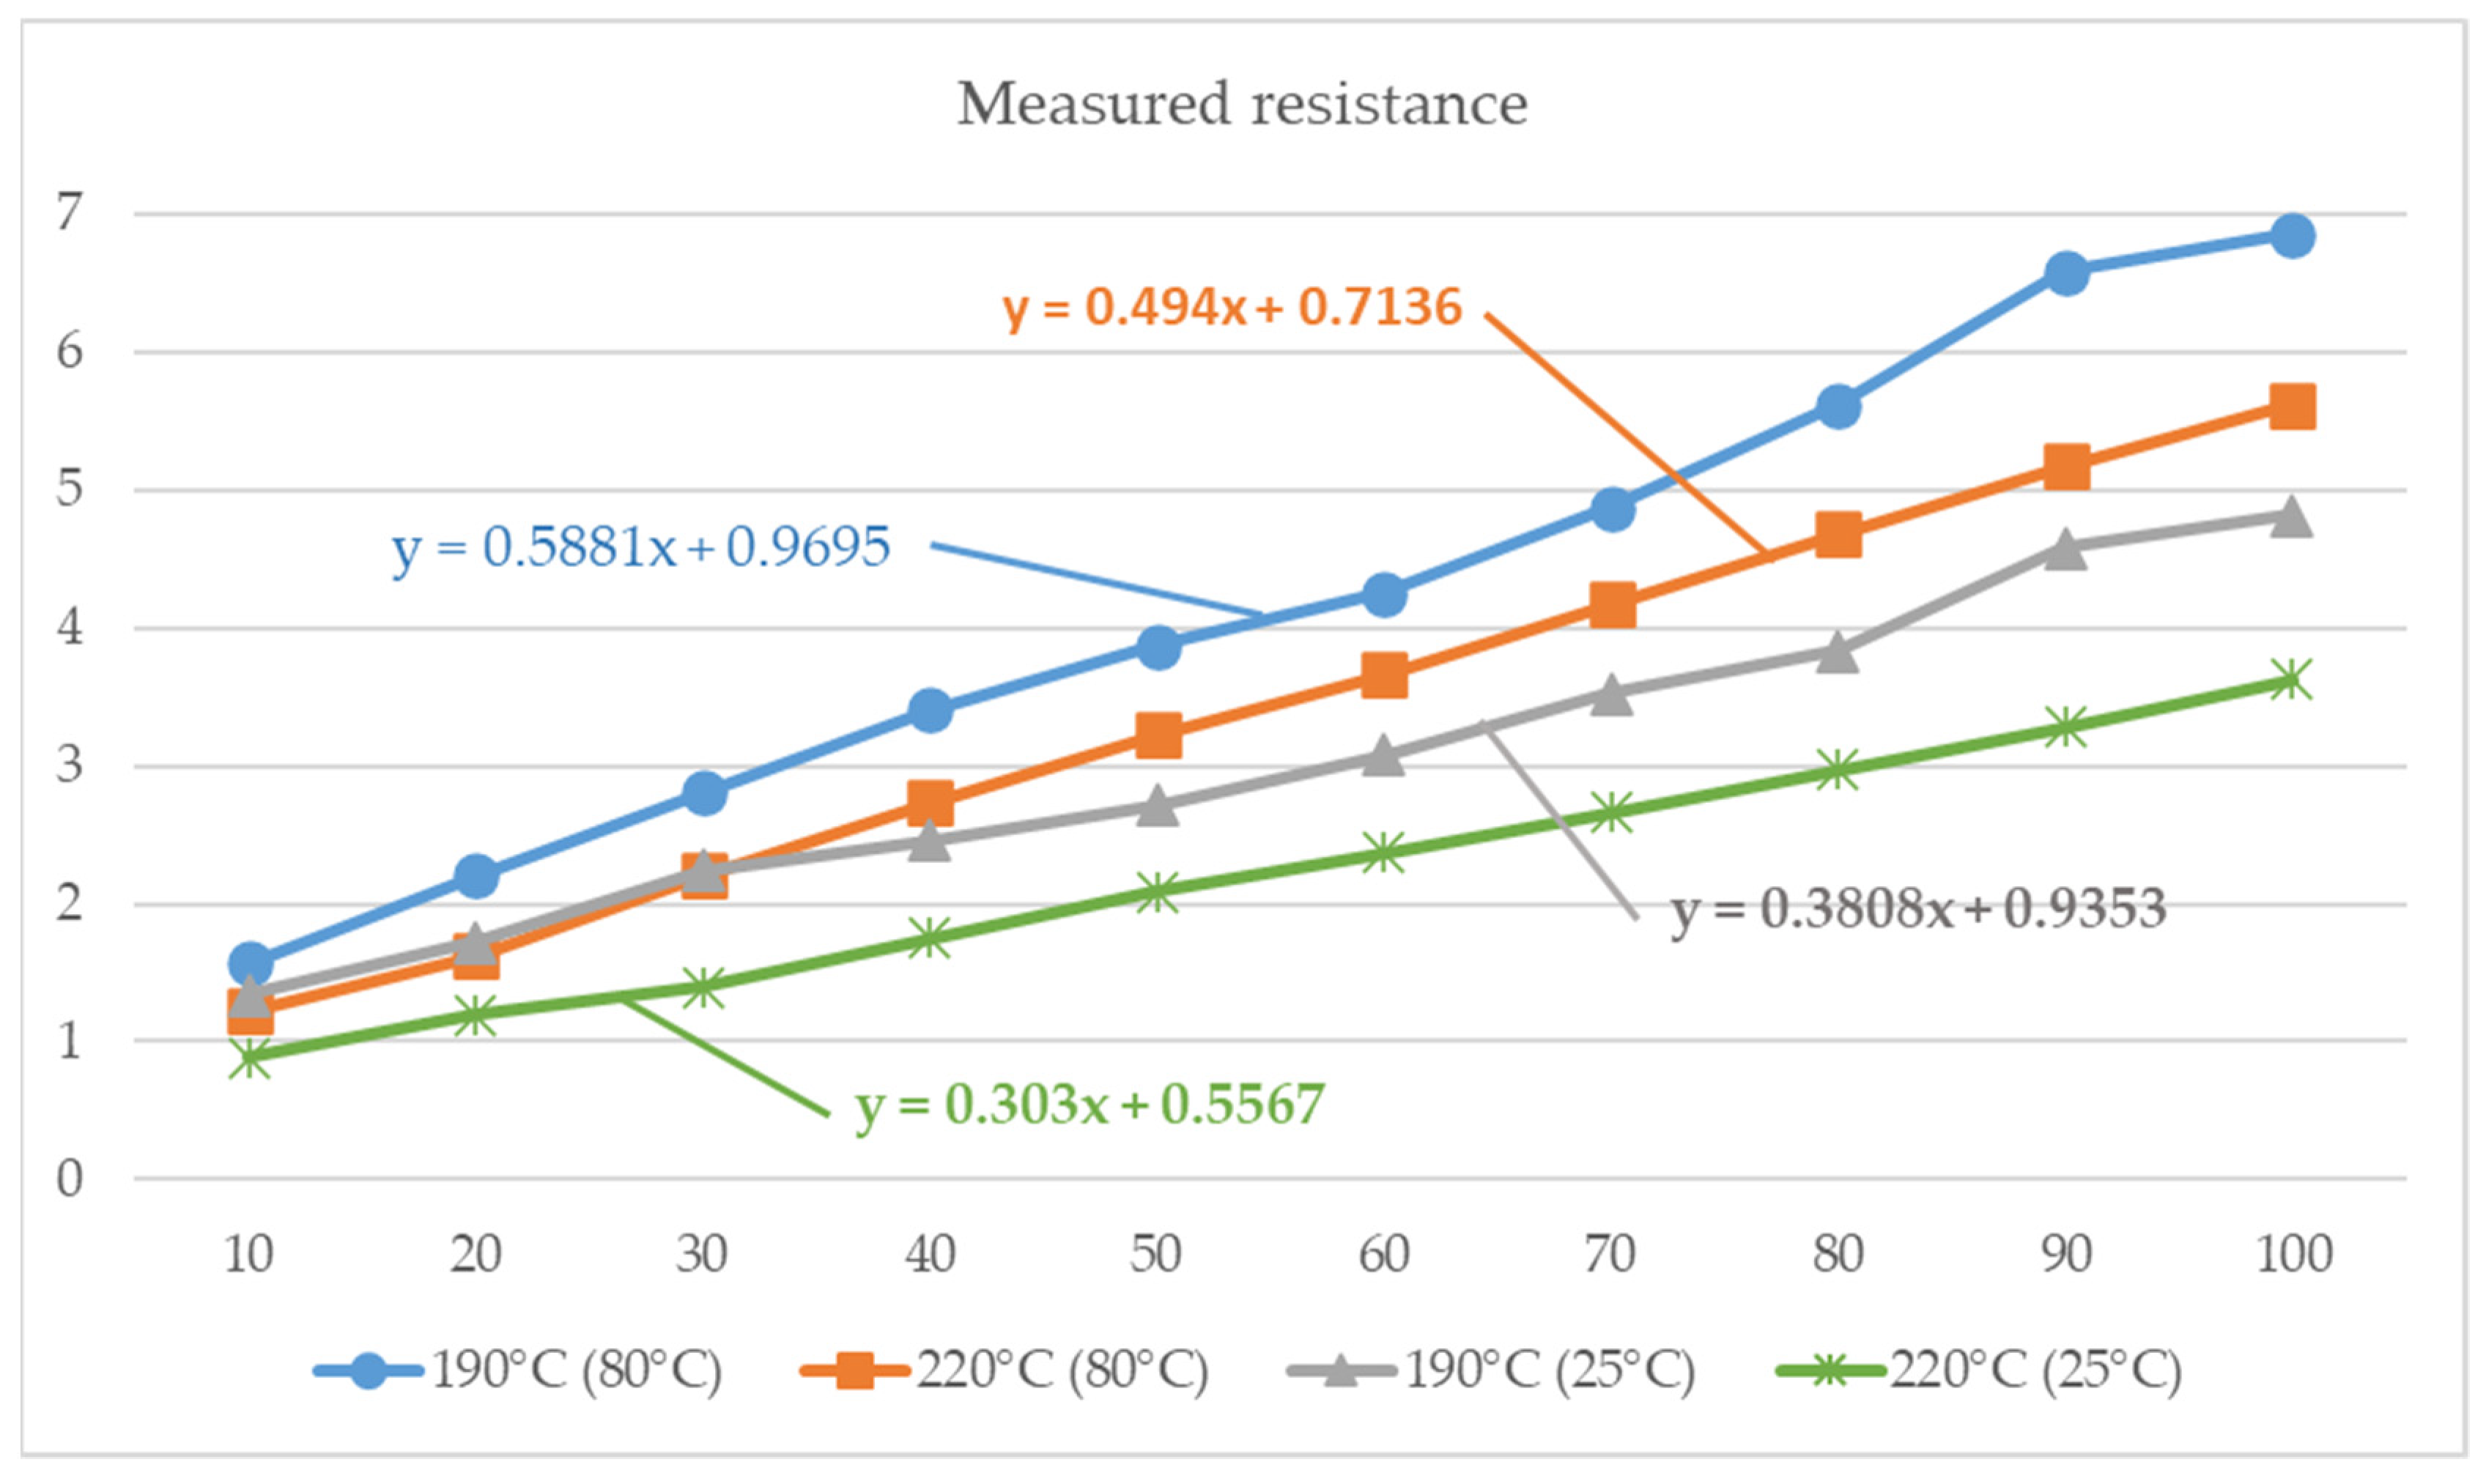
| Exp. | A | B | C | R1 | R2 | R3 | R4 | R5 | R (Ω) |
|---|---|---|---|---|---|---|---|---|---|
| 1 | 1 | 1 | 1 | 1.33 | 1.34 | 1.38 | 1.36 | 1.27 | 1.34 |
| 2 | 1 | 1 | 2 | 1.67 | 1.77 | 1.57 | 1.4 | 1.42 | 1.57 |
| 3 | 1 | 2 | 1 | 0.83 | 0.89 | 0.97 | 0.88 | 0.87 | 0.89 |
| 4 | 1 | 2 | 2 | 1.2 | 1.24 | 1.25 | 1.22 | 1.22 | 1.23 |
| 5 | 2 | 1 | 1 | 1.75 | 1.73 | 1.74 | 1.69 | 1.7 | 1.72 |
| 6 | 2 | 1 | 2 | 2.22 | 2.11 | 2.26 | 2.22 | 2.234 | 2.21 |
| 7 | 2 | 2 | 1 | 1.13 | 1.24 | 1.24 | 1.21 | 1.16 | 1.20 |
| 8 | 2 | 2 | 2 | 1.56 | 1.68 | 1.66 | 1.6 | 1.6 | 1.62 |
| 9 | 3 | 1 | 1 | 2.23 | 2.21 | 2.19 | 2.3 | 2.25 | 2.24 |
| 10 | 3 | 1 | 2 | 2.89 | 2.71 | 2.86 | 2.83 | 2.75 | 2.81 |
| 11 | 3 | 2 | 1 | 1.46 | 1.39 | 1.41 | 1.36 | 1.36 | 1.40 |
| 12 | 3 | 2 | 2 | 2.18 | 2.25 | 2.16 | 2.23 | 2.19 | 2.20 |
| 13 | 4 | 1 | 1 | 2.45 | 2.42 | 2.49 | 2.49 | 2.43 | 2.46 |
| 14 | 4 | 1 | 2 | 3.45 | 3.39 | 3.38 | 3.35 | 3.45 | 3.40 |
| 15 | 4 | 2 | 1 | 1.68 | 1.76 | 1.77 | 1.77 | 1.77 | 1.75 |
| 16 | 4 | 2 | 2 | 2.76 | 2.81 | 2.69 | 2.67 | 2.75 | 2.74 |
| 17 | 5 | 1 | 1 | 2.62 | 2.75 | 2.69 | 2.73 | 2.78 | 2.71 |
| 18 | 5 | 1 | 2 | 3.85 | 3.87 | 3.85 | 3.89 | 3.9 | 3.87 |
| 19 | 5 | 2 | 1 | 2.08 | 2.09 | 2.08 | 2.09 | 2.11 | 2.09 |
| 20 | 5 | 2 | 2 | 3.2 | 3.3 | 3.19 | 3.18 | 3.25 | 3.22 |
| 21 | 6 | 1 | 1 | 3.02 | 3.15 | 3.04 | 3.13 | 3.07 | 3.08 |
| 22 | 6 | 1 | 2 | 4.16 | 4.27 | 4.28 | 4.35 | 4.22 | 4.26 |
| 23 | 6 | 2 | 1 | 2.39 | 2.34 | 2.37 | 2.29 | 2.45 | 2.37 |
| 24 | 6 | 2 | 2 | 3.62 | 3.64 | 3.68 | 3.64 | 3.7 | 3.66 |
| 25 | 7 | 1 | 1 | 3.47 | 3.51 | 3.58 | 3.51 | 3.51 | 3.52 |
| 26 | 7 | 1 | 2 | 4.95 | 4.84 | 4.81 | 4.9 | 4.87 | 4.87 |
| 27 | 7 | 2 | 1 | 2.71 | 2.66 | 2.67 | 2.65 | 2.63 | 2.66 |
| 28 | 7 | 2 | 2 | 4.13 | 4.15 | 4.17 | 4.18 | 4.23 | 4.17 |
| 29 | 8 | 1 | 1 | 3.85 | 3.81 | 3.85 | 3.81 | 3.83 | 3.83 |
| 30 | 8 | 1 | 2 | 5.55 | 5.8 | 5.57 | 5.64 | 5.5 | 5.61 |
| 31 | 8 | 2 | 1 | 3.07 | 3 | 2.97 | 2.91 | 2.91 | 2.97 |
| 32 | 8 | 2 | 2 | 4.8 | 4.62 | 4.62 | 4.75 | 4.62 | 4.68 |
| 33 | 9 | 1 | 1 | 4.51 | 4.55 | 4.68 | 4.58 | 4.58 | 4.58 |
| 34 | 9 | 1 | 2 | 6.55 | 6.58 | 6.54 | 6.68 | 6.57 | 6.58 |
| 35 | 9 | 2 | 1 | 3.22 | 3.39 | 3.32 | 3.27 | 3.22 | 3.28 |
| 36 | 9 | 2 | 2 | 5.13 | 5.16 | 5.25 | 5.17 | 5.16 | 5.17 |
| 37 | 10 | 1 | 1 | 4.86 | 4.78 | 4.89 | 4.82 | 4.76 | 4.82 |
| 38 | 10 | 1 | 2 | 6.89 | 6.84 | 6.86 | 6.83 | 6.85 | 6.85 |
| 39 | 10 | 2 | 1 | 3.71 | 3.63 | 3.74 | 3.56 | 3.44 | 3.62 |
| 40 | 10 | 2 | 2 | 5.6 | 5.58 | 5.54 | 5.74 | 5.61 | 5.61 |
| FACTOR/ INTERACTION | F (Calculated) | p Significancy | SS | MSe | Ftab 0.95 |
|---|---|---|---|---|---|
| A | F (9, 160) = 9690 | p < 0.000001 | SS = 322.73 | MSe = 0.01 | 4.444 |
| B | F (1, 160) = 8436 | p < 0.000001 | SS = 31.22 | MSe = 0.01 | 4.444 |
| C | F (1, 160) = 19177 | p < 0.000001 | SS = 70.96 | MSe = 0.01 | 4.444 |
| A × B | F (9, 160) = 118 | p < 0.000001 | SS = 3.91 | MSe = 0.01 | 4.444 |
| A × C | F (9, 160) = 493 | p < 0.000001 | SS = 16.43 | MSe = 0.01 | 4.444 |
| B × C | F (1, 160) = 3.84 | p < 0.000001 | SS = 0.01 | MSe = 0.01 | 4.444 |
| A × B × C | F (9, 160) = 4.35 | p < 0.000001 | SS = 0.14 | MSe = 0.01 | 4.444 |
Publisher’s Note: MDPI stays neutral with regard to jurisdictional claims in published maps and institutional affiliations. |
© 2022 by the authors. Licensee MDPI, Basel, Switzerland. This article is an open access article distributed under the terms and conditions of the Creative Commons Attribution (CC BY) license (https://creativecommons.org/licenses/by/4.0/).
Share and Cite
Beniak, J.; Šooš, Ľ.; Križan, P.; Matúš, M.; Ruprich, V. Resistance and Strength of Conductive PLA Processed by FDM Additive Manufacturing. Polymers 2022, 14, 678. https://doi.org/10.3390/polym14040678
Beniak J, Šooš Ľ, Križan P, Matúš M, Ruprich V. Resistance and Strength of Conductive PLA Processed by FDM Additive Manufacturing. Polymers. 2022; 14(4):678. https://doi.org/10.3390/polym14040678
Chicago/Turabian StyleBeniak, Juraj, Ľubomír Šooš, Peter Križan, Miloš Matúš, and Vít Ruprich. 2022. "Resistance and Strength of Conductive PLA Processed by FDM Additive Manufacturing" Polymers 14, no. 4: 678. https://doi.org/10.3390/polym14040678
APA StyleBeniak, J., Šooš, Ľ., Križan, P., Matúš, M., & Ruprich, V. (2022). Resistance and Strength of Conductive PLA Processed by FDM Additive Manufacturing. Polymers, 14(4), 678. https://doi.org/10.3390/polym14040678


