
Stress Dependent Biofilm Formation and Bioactive Melanin Pigment Production by a Thermophilic Bacillus Species from Chilean Hot Spring

 , ,
, ,  and
and 
Abstract
:
1. Introduction
2. Materials and Methods
2.1. Sampling and Microorganism
2.2. Biofilm Formation, Staining, and Quantification
2.3. Pellicle Competition Analysis
2.4. Pigment Production Study
2.4.1. Physicochemical Characterization of the Pigment
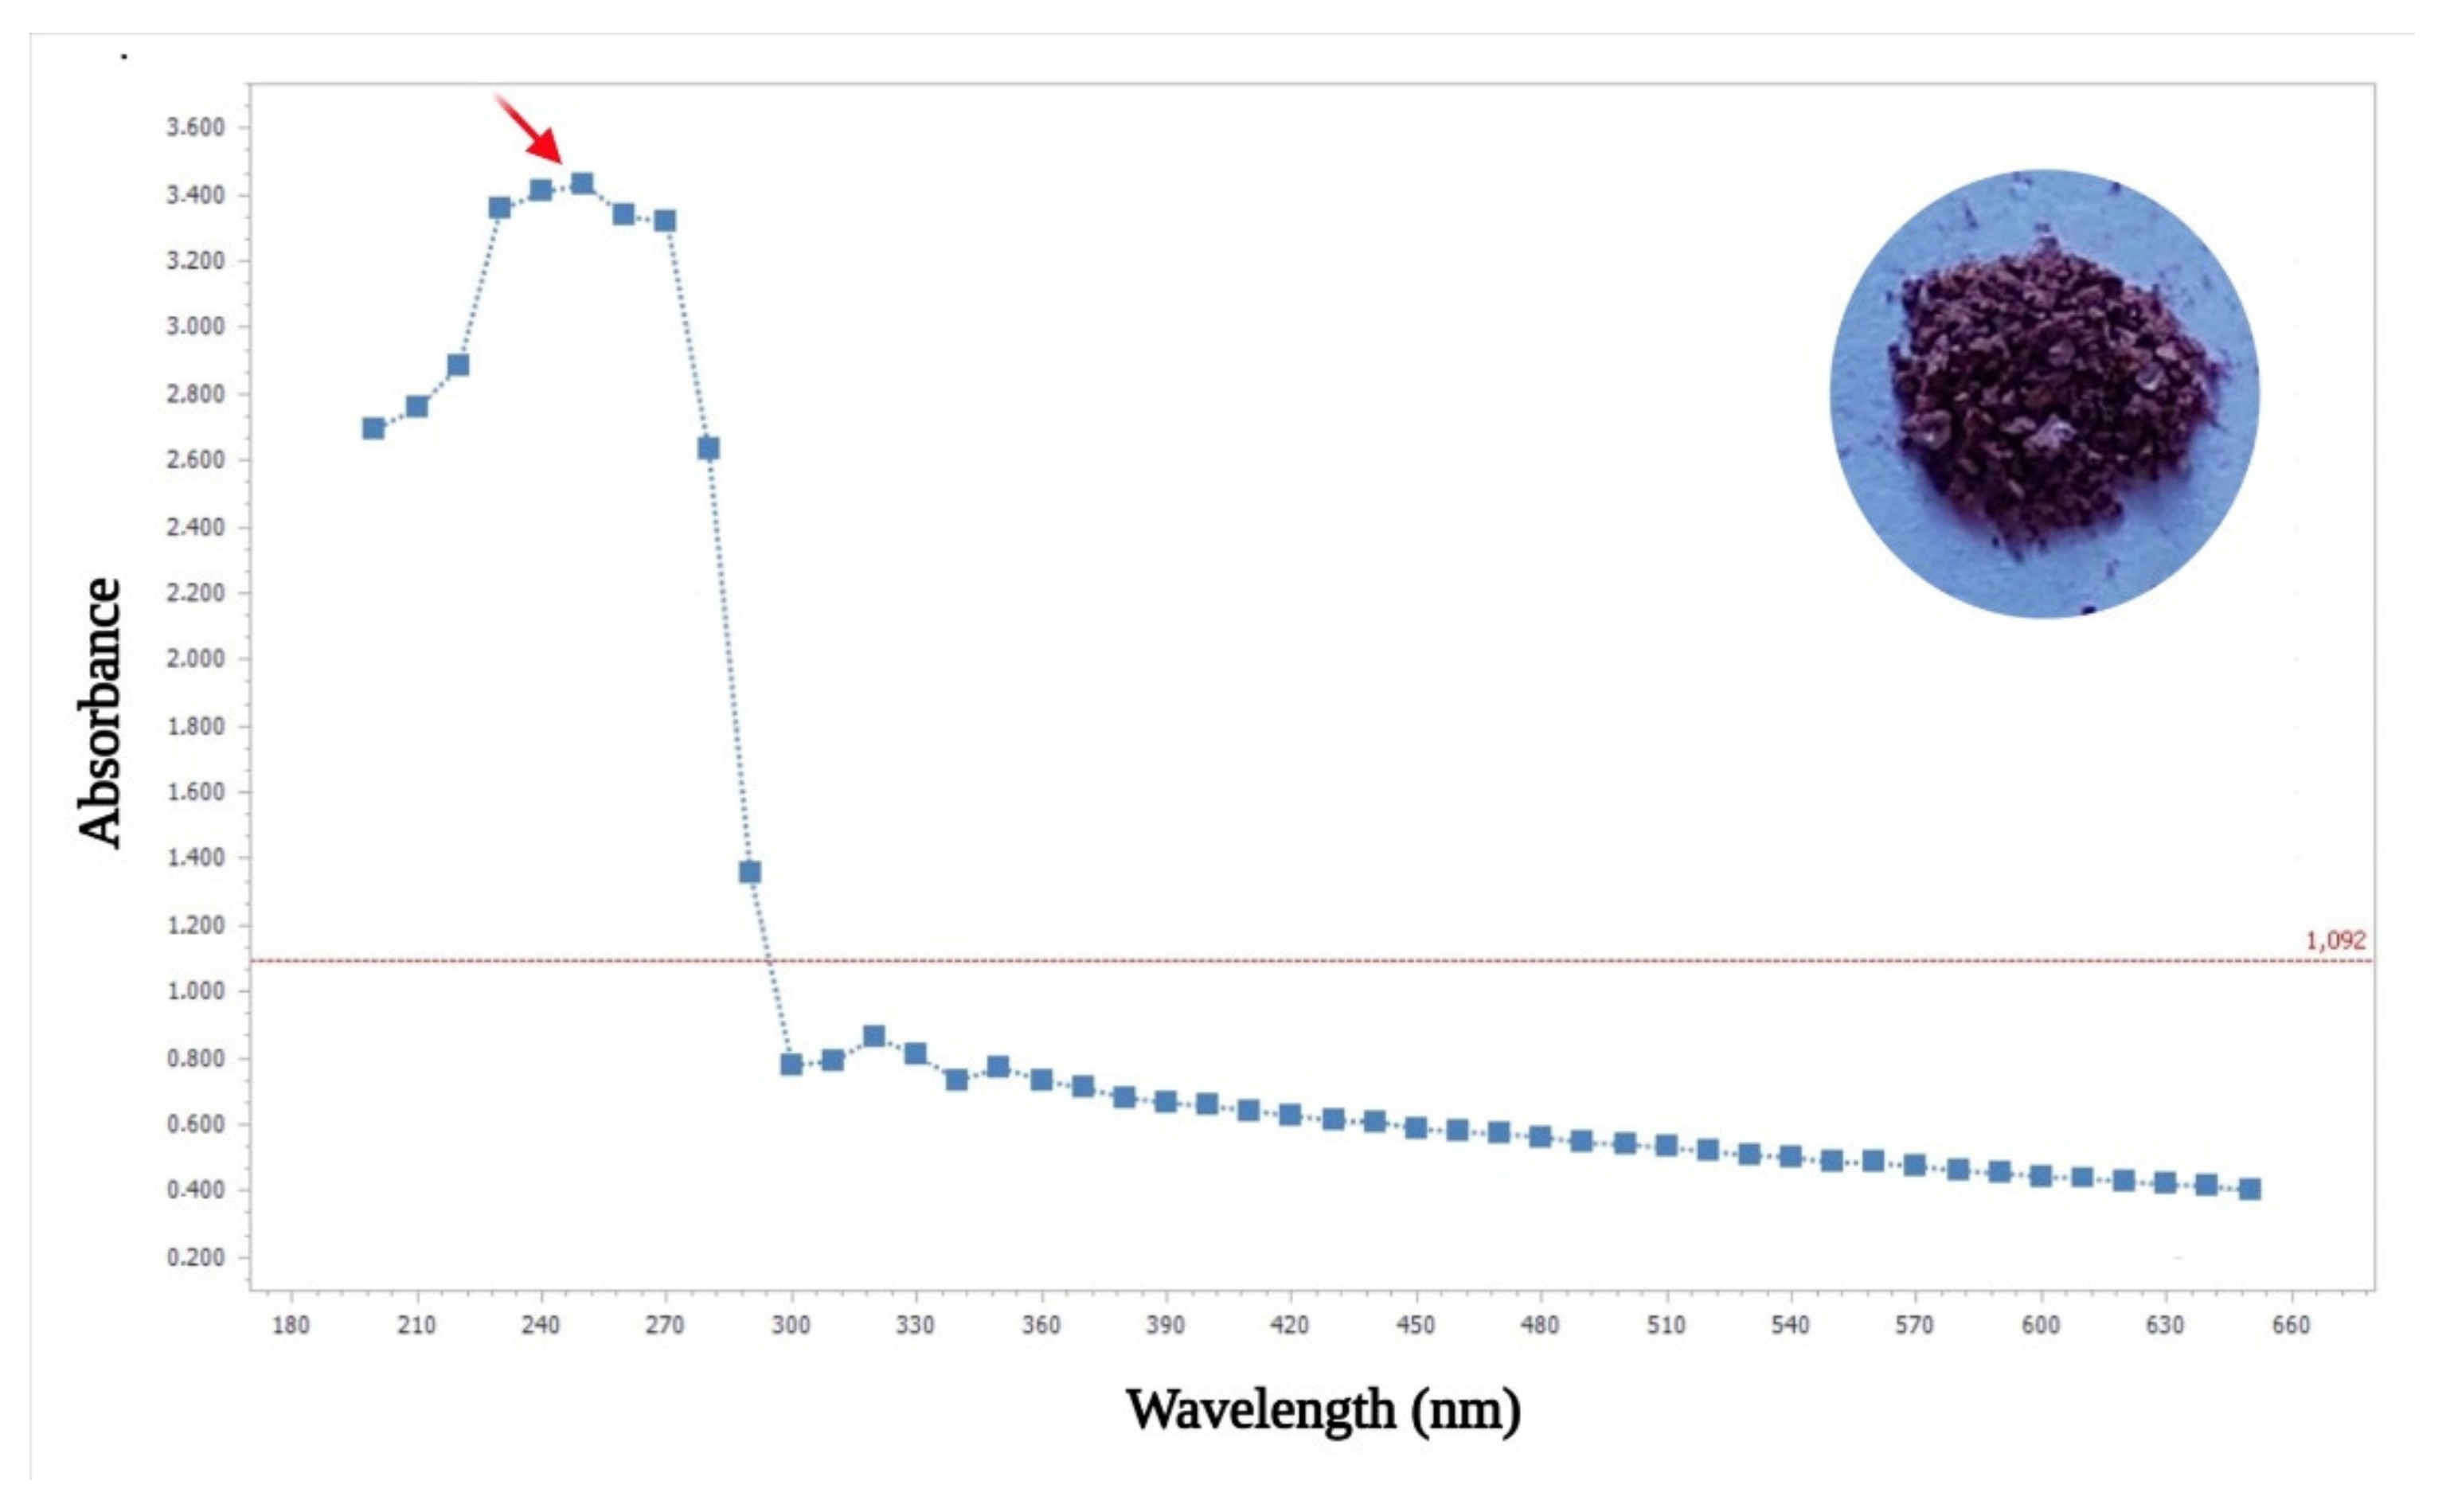
- UV-Visible Analysis
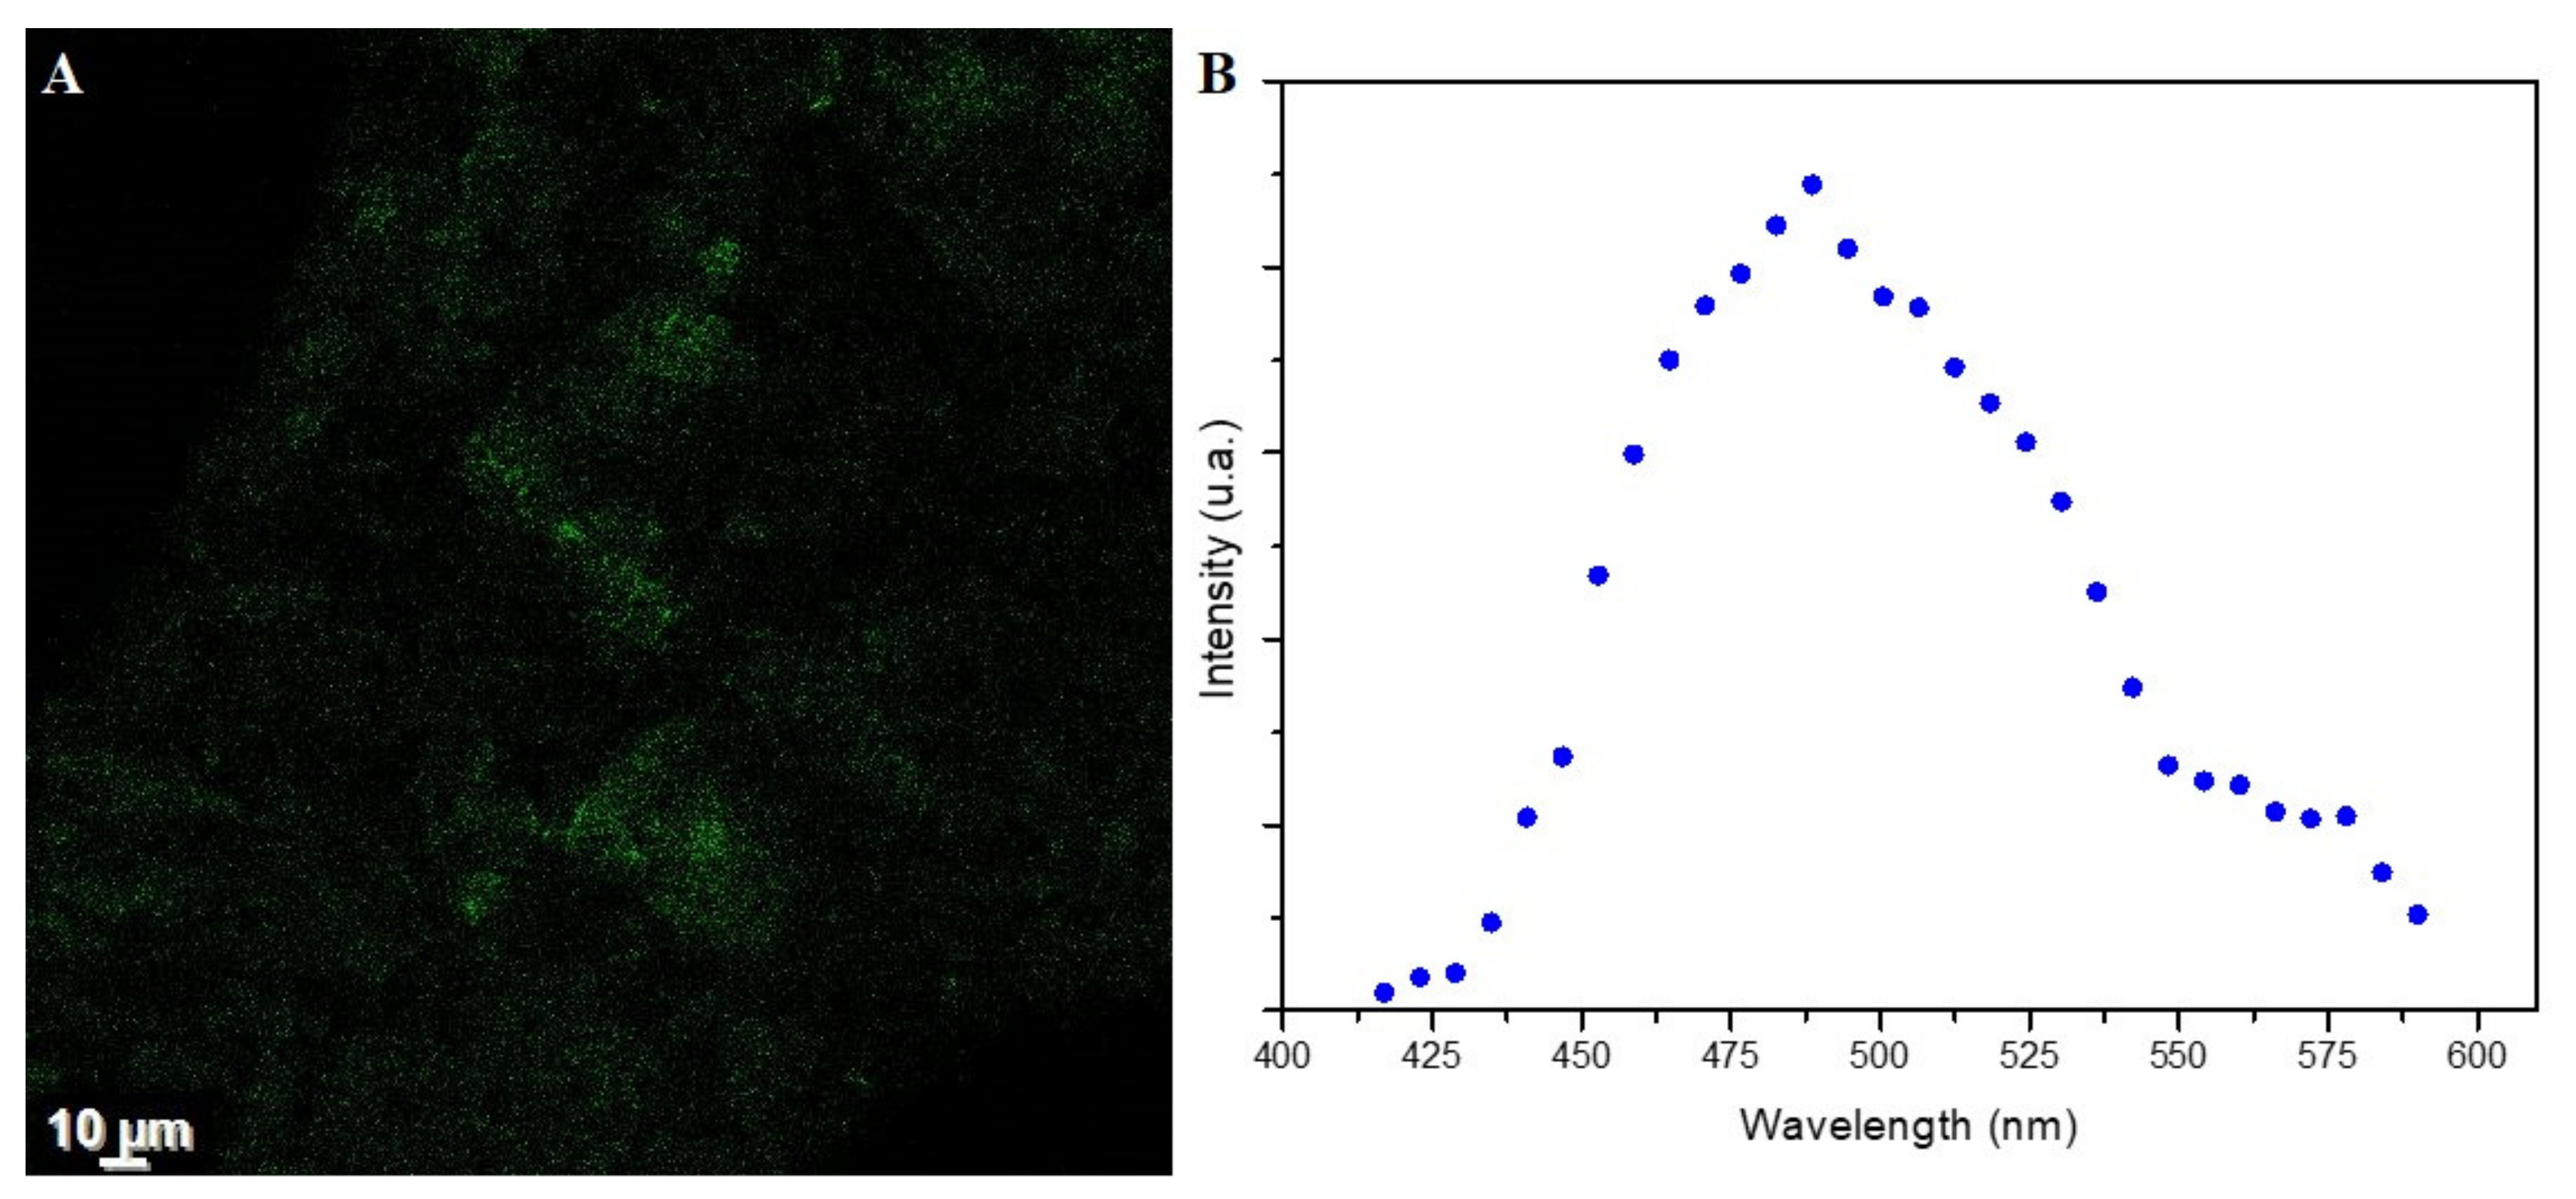
- Fluorescence Property Analysis
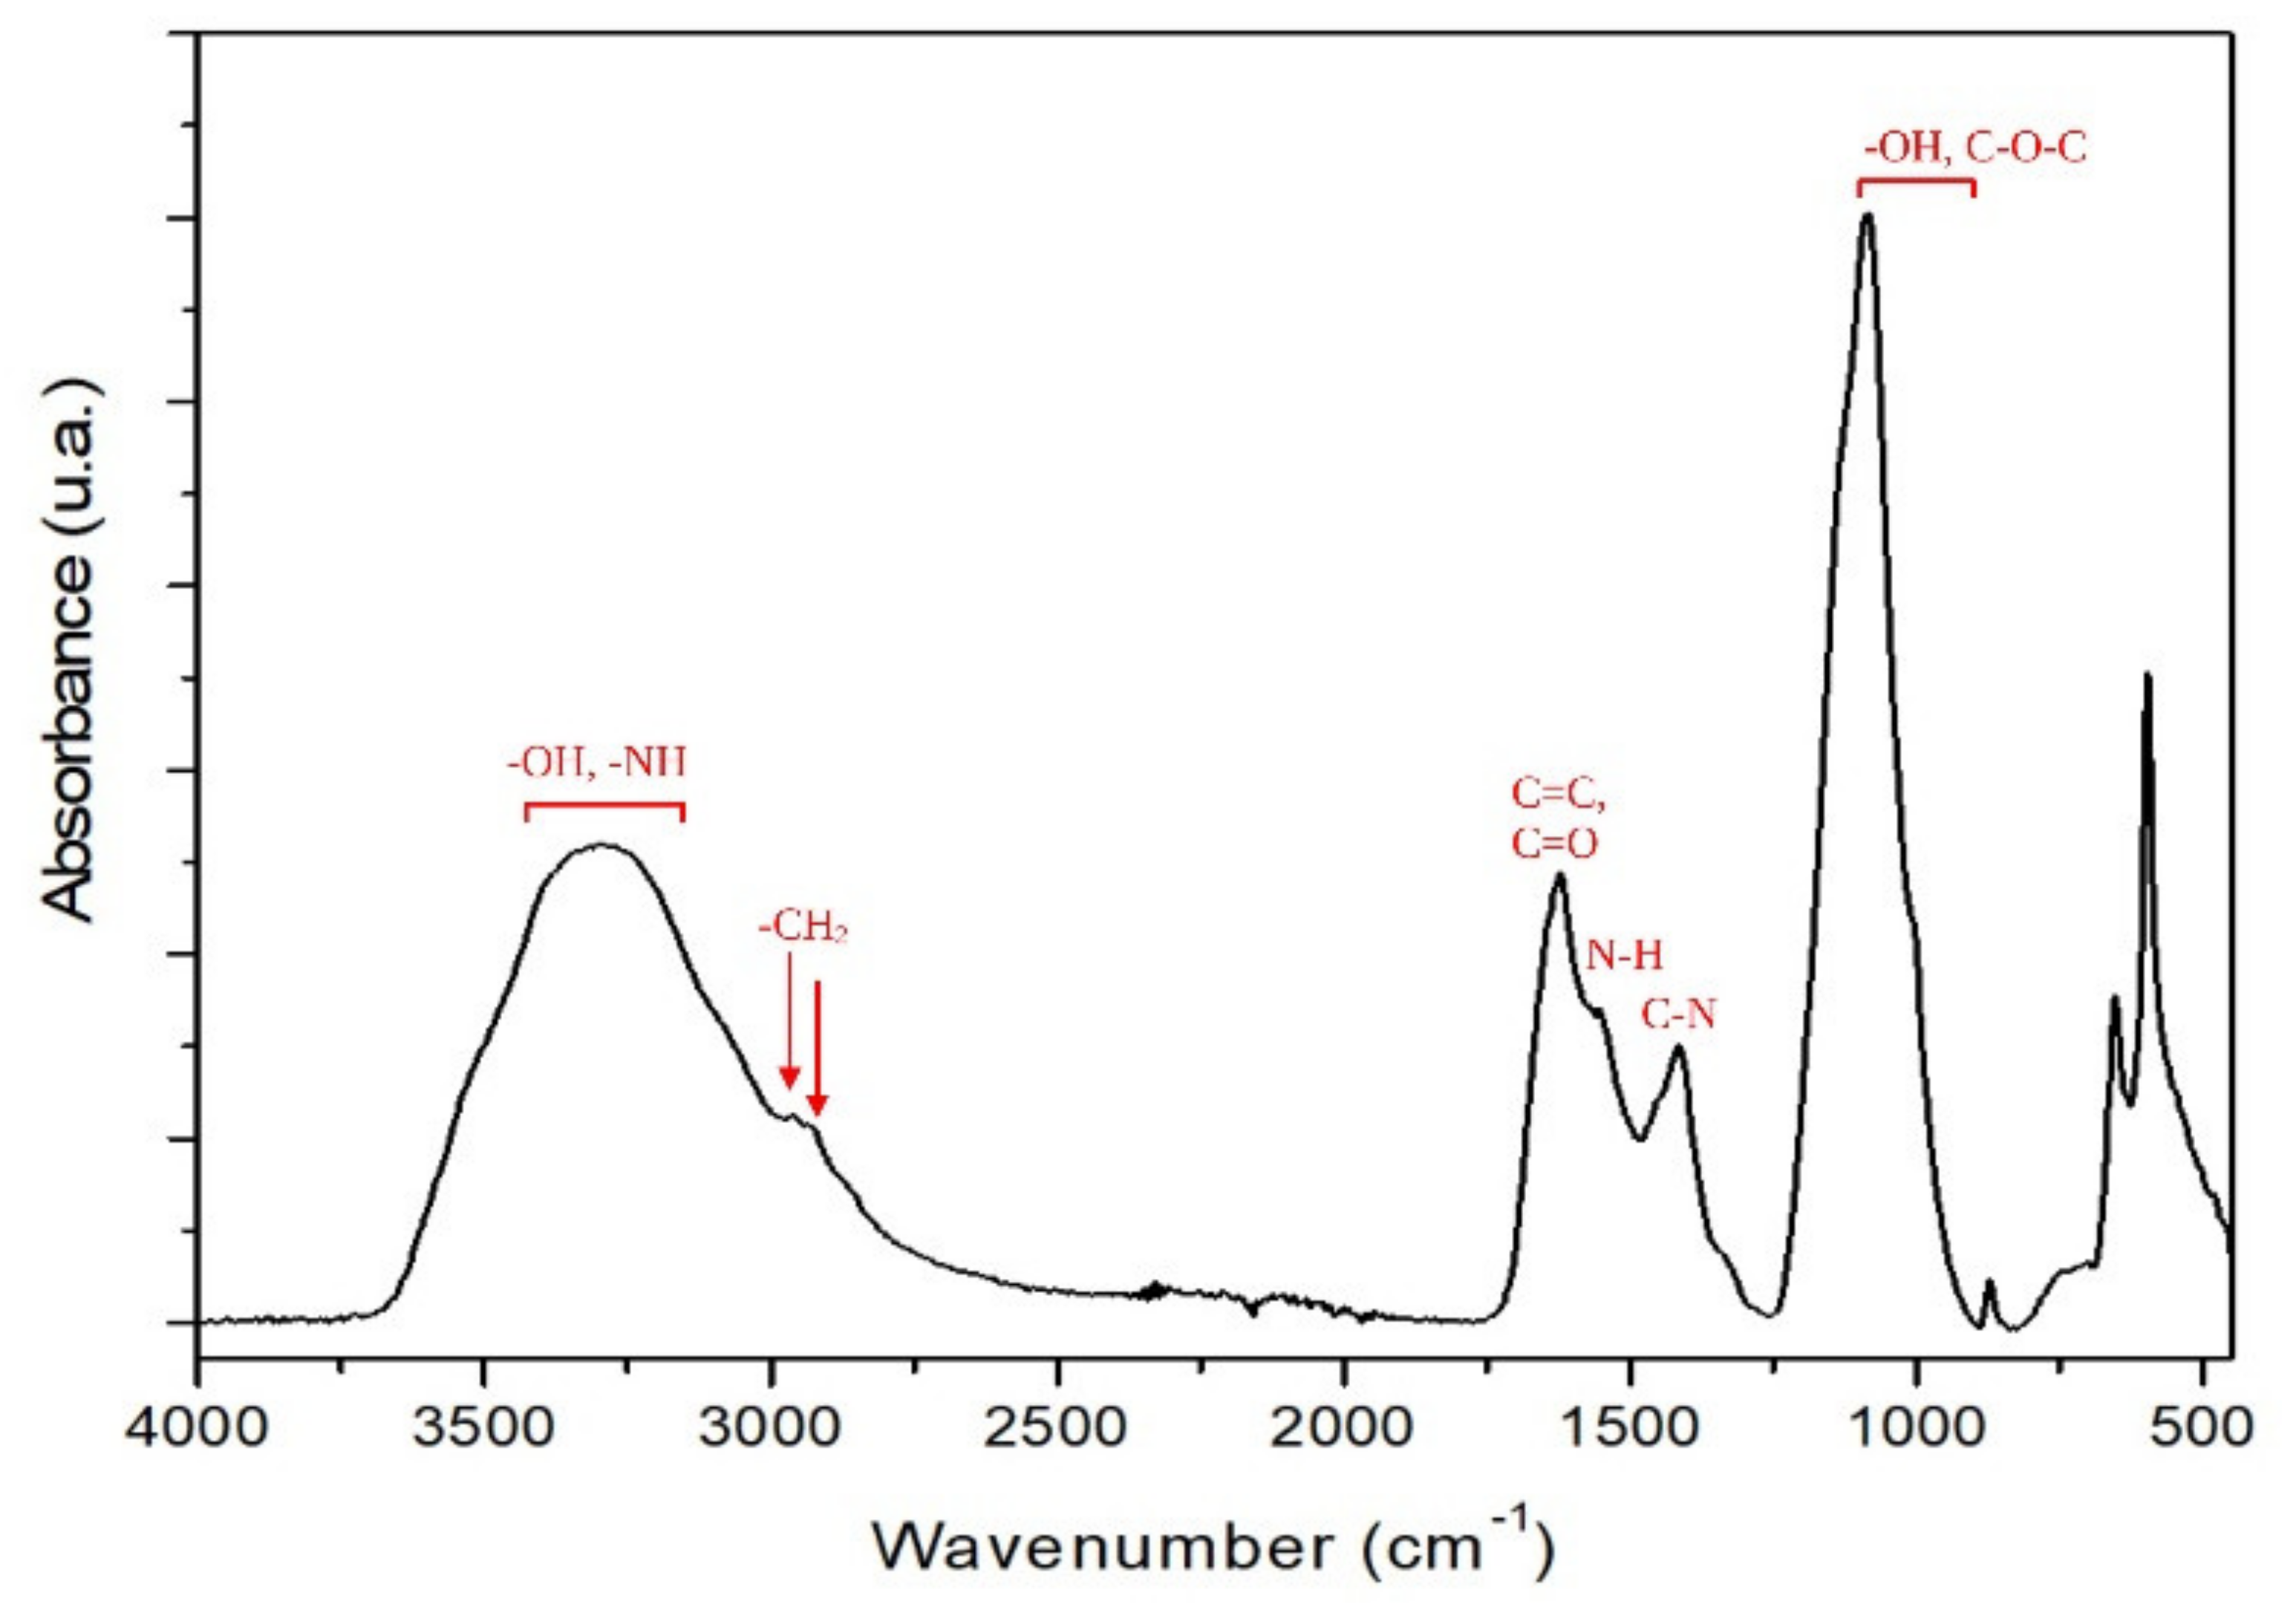
- FTIR-ATR Analysis
- Thermogravimetric Analysis
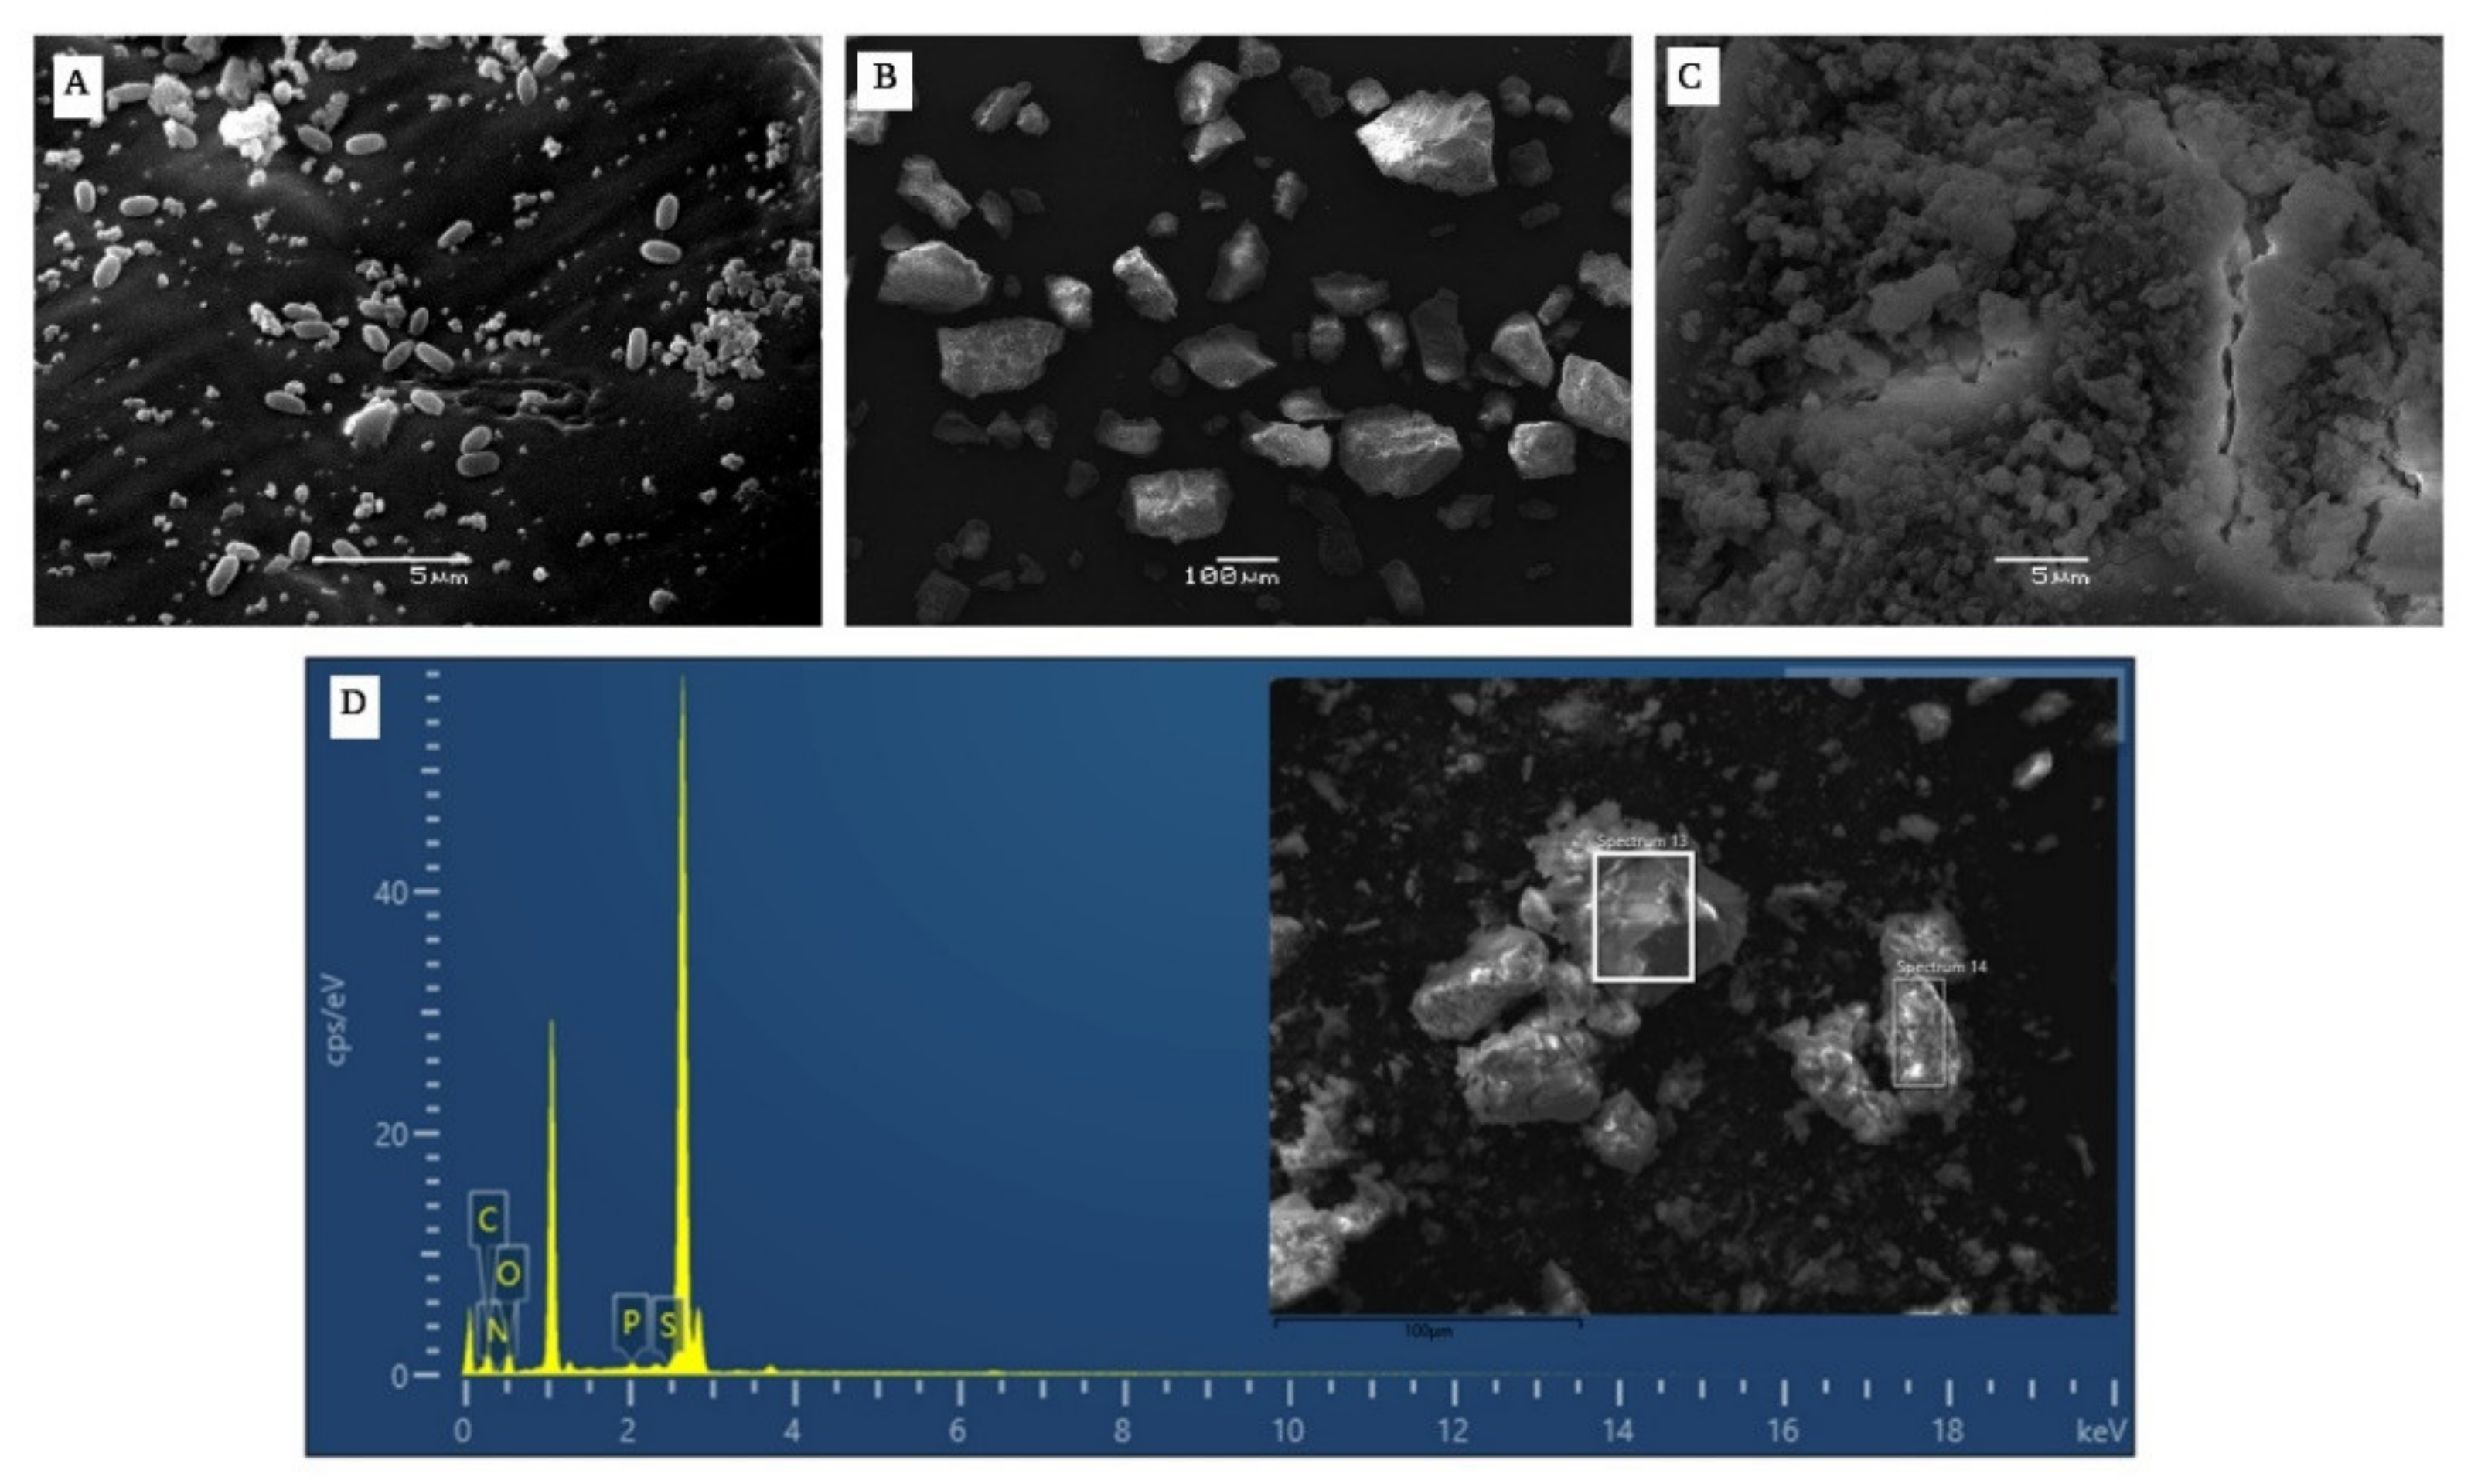
- SEM-EDS Analysis
- Pyrolysis Gas Chromatography Analysis (py-GC/MS)
2.4.2. Antioxidant Activity Determination
2.5. Statistical Analsysis
3. Results and Discussion
3.1. Biofilm Formation Study
3.2. Pellicle Competition Analysis
3.3. Pigment Production Study
3.3.1. Physicochemical Characterization of the Pigment
- UV-Visible Analysis
- Fluorescence Property Analysis
- FTIR-ATR Analysis
- Thermogravimetric Analysis
- SEM-EDS Analysis
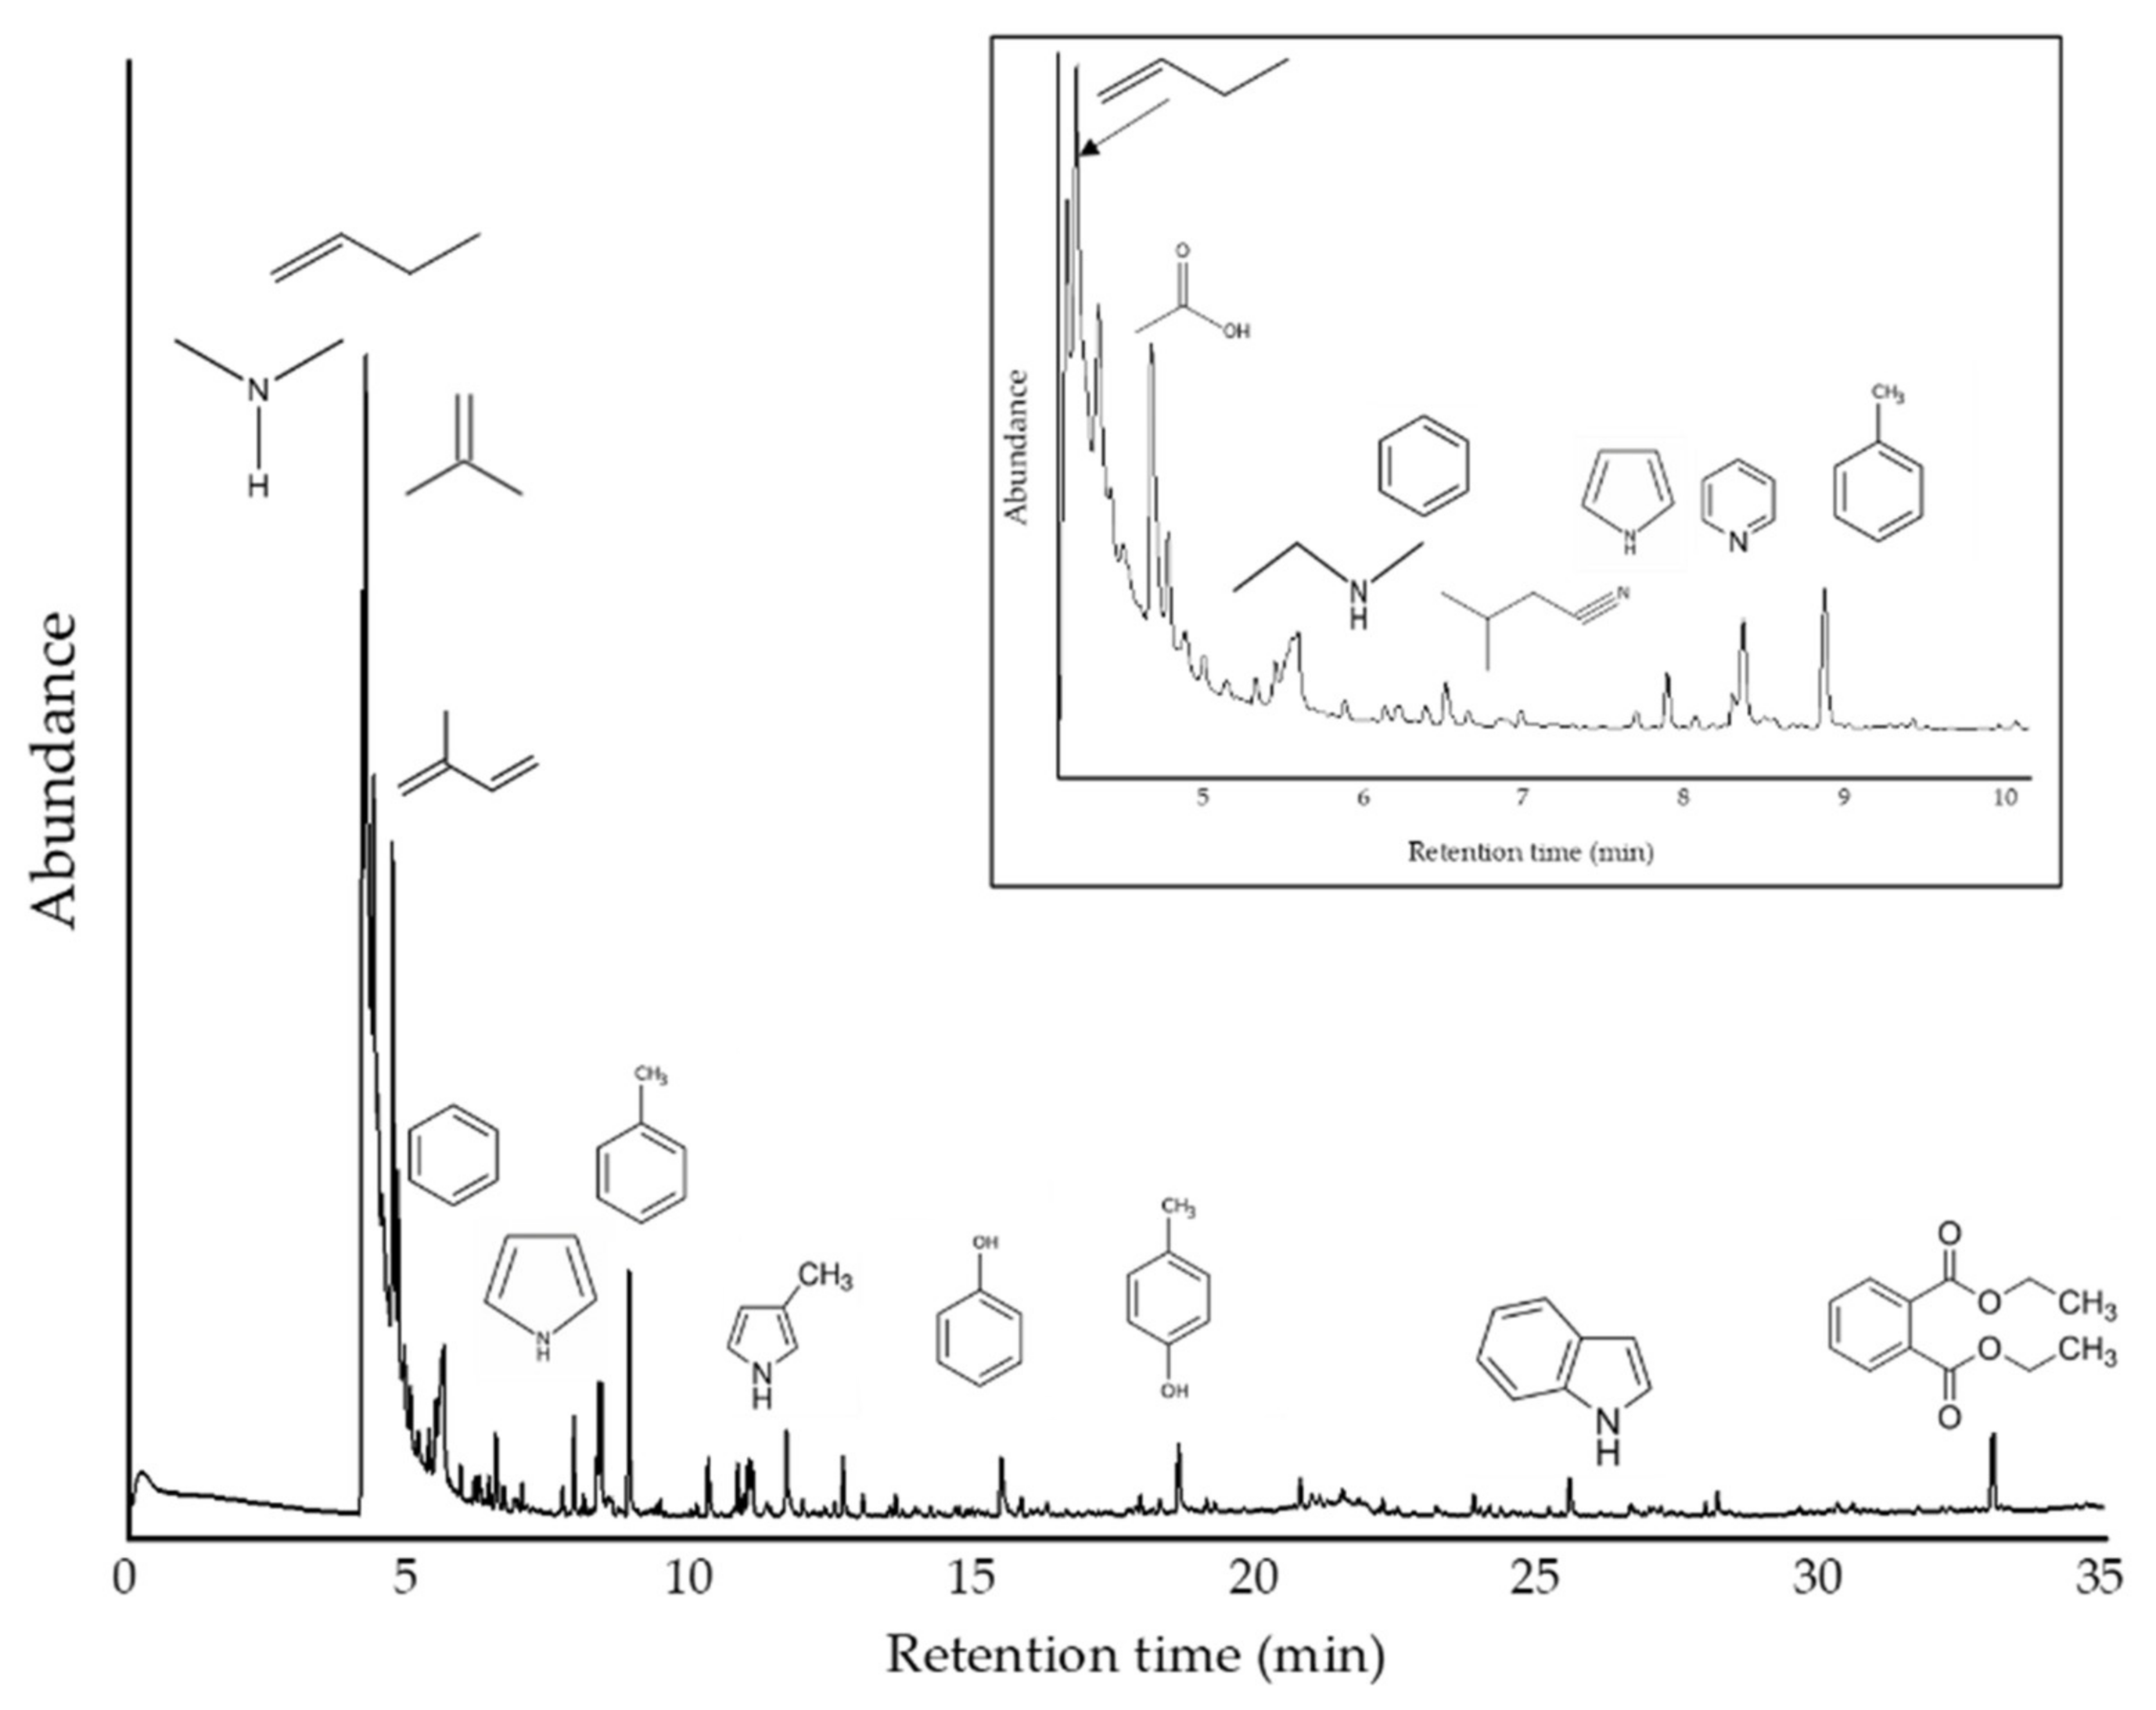
- Pyrolysis Gas Chromatography Analysis (py-GC/MS)
3.3.2. Antioxidant Activity Determination
4. Conclusions
Author Contributions
Funding
Institutional Review Board Statement
Informed Consent Statement
Data Availability Statement
Acknowledgments
Conflicts of Interest
Abbreviations
| NA | nutrient agar |
| OFAT | one factor at time |
| NB | nutrient broth |
| LB | Luria Bertani |
| MB | marine broth |
| UV | ultra violet |
| UV-Vis | UV-Visible |
| FTIR-ATR | Fourier transform infrared spectroscopy-attenuated total reflection |
| TG | thermogravimetric analysis |
| SEM | scanning electron microscopy |
| EDS | energy dispersive spectroscopy |
| py-GC/MS | pyrolysis gas chromatography/mass spectrometry |
| EDTA | ethylenediamine tetraacetic acid |
| EPS | Exopolysaccharide |
References
- Ibrar, M.; Ullah, M.W.; Manan, S.; Farooq, U.; Rafiq, M.; Hasan, F. Fungi from the extremes of life: An untapped treasure for bioactive compounds. Appl. Microbiol. Biotechnol. 2020, 104, 2777–2801. [Google Scholar] [CrossRef]
- Farmer, J. Thermophiles, early biosphere evolution, and the origin of life on Earth: Implications for the exobiological exploration of Mars. J. Geophys. Res. Planets 1998, 103, 28457–28461. [Google Scholar] [CrossRef]
- Giddings, L.A.; Newman, D.J. Microbial natural products: Molecular blueprints for antitumor drugs. J. Ind. Microbiol. Biotechnol. 2013, 40, 1181–1210. [Google Scholar] [CrossRef] [PubMed]
- Giordano, D. Bioactive Molecules from Extreme Environments. Mar. Drugs 2020, 18, 640. [Google Scholar] [CrossRef] [PubMed]
- Gomes, E.; de Souza, A.R.; Orjuela, G.L.; da Silva, R.; de Oliveira, T.B.; Rodrigues, A. Applications and benefits of thermophilic microorganisms and their enzymes for industrial biotechnology. In Gene Expression Systems in Fungi: Advancements and Applications, 1st ed.; Schmoll, M., Dattenböck, C., Eds.; Springer: Cham, Switzerland, 2016; pp. 459–492. [Google Scholar]
- De Rosa, M.; Gambacorta, A.; Nicolaus, B. A new type of cell membrane, in thermophilic archaebacteria, based on bipolar ether lipids. J. Membr. Sci. 1983, 16, 287–294. [Google Scholar] [CrossRef]
- Wang, Q.; Cen, Z.; Zhao, J. The survival mechanisms of thermophiles at high temperatures: An angle of omics. Physiology 2015, 30, 97–106. [Google Scholar] [CrossRef]
- Kaur, A.; Capalash, N.; Sharma, P. Communication mechanisms in extremophiles: Exploring their existence and industrial applications. Microbiol. Res. 2019, 221, 15–27. [Google Scholar] [CrossRef]
- Nicolaus, B.; Kambourova, M.; Oner, E.T. Exopolysaccharides from extremophiles: From fundamentals to biotechnology. Environ. Technol. 2010, 31, 1145–1158. [Google Scholar] [CrossRef]
- González-Faune, P.; Sánchez-Arévalo, I.; Sarkar, S.; Majhi, K.; Bandopadhyay, R.; Cabrera-Barjas, G.; Gómez, A.; Banerjee, A. Computational Study on Temperature Driven Structure-Function Relationship of Polysaccharide Producing Bacterial Glycosyl Transferase Enzyme. Polymers 2021, 13, 1771. [Google Scholar] [CrossRef]
- Suvilampi, J.; Lehtomäki, A.; Rintala, J. Comparison of laboratory-scale thermophilic biofilm and activated sludge processes integrated with a mesophilic activated sludge process. Bioresour. Technol. 2003, 88, 207–214. [Google Scholar] [CrossRef]
- Ahmadi, A.; Schaffie, M.; Petersen, J.; Schippers, A.; Ranjbar, M. Conventional and electrochemical bioleaching of chalcopyrite concentrates by moderately thermophilic bacteria at high pulp density. Hydrometallurgy 2011, 106, 84–92. [Google Scholar] [CrossRef]
- Rathinam, N.K.; Bibra, M.; Salem, D.R.; Sani, R.K. Bioelectrochemical approach for enhancing lignocellulose degradation and biofilm formation in Geobacillus strain WSUCF1. Bioresour. Technol. 2020, 295, 122271. [Google Scholar] [CrossRef]
- Correa-Llantén, D.N.; Amenábar, M.J.; Blamey, J.M. Antioxidant capacity of novel pigments from an Antarctic bacterium. J. Microbiol. 2012, 50, 374–379. [Google Scholar] [CrossRef] [PubMed]
- Wu, D.; Raymond, J.; Wu, M.; Chatterji, S.; Ren, Q.; Graham, J.E.; Bryant, D.A.; Robb, F.; Colman, A.; Tallon, L.J.; et al. Complete genome sequence of the aerobic CO-oxidizing thermophile Thermomicrobium roseum. PLoS ONE 2009, 4, e4207. [Google Scholar] [CrossRef] [Green Version]
- Kaur, N.; Arora, A.; Kumar, N.; Mayilraj, S. Genome sequencing and annotation of Laceyella sacchari strain GS 1-1, isolated from hot spring, Chumathang, Leh, India. Genom. Data 2014, 2, 18–19. [Google Scholar] [CrossRef] [Green Version]
- Magdalena, S.; Giovani, F.; Yogiara, Y. Evaluation of the potentials of Bacillus subtilis KM16 and Pseudomonas sp. PAP 26 isolated from the hot spring and crater lakes as antibiofilm agents. Int. J. Appl. Biol. 2021, 5, 83–94. [Google Scholar]
- Venil, C.K.; Zakaria, Z.A.; Ahmad, W.A. Bacterial pigments and their applications. Process Biochem. 2013, 48, 1065–1079. [Google Scholar] [CrossRef]
- Zeng, Z.; Cai, X.; Wang, P.; Guo, Y.; Liu, X.; Li, B.; Wang, X. Biofilm formation and heat stress induce pyomelanin production in deep-sea Pseudoalteromonas sp. SM9913. Front. Microbiol. 2017, 8, 1822. [Google Scholar] [CrossRef] [PubMed] [Green Version]
- DeCastro, M.E.; Doane, M.P.; Dinsdale, E.A.; Rodríguez-Belmonte, E.; González-Siso, M.I. Exploring the taxonomical and functional profile of As Burgas hot spring focusing on thermostable β-galactosidases. Sci. Rep. 2021, 11, 101. [Google Scholar] [CrossRef] [PubMed]
- Orellana, R.; Macaya, C.; Bravo, G.; Dorochesi, F.; Cumsille, A.; Valencia, R.; Rojas, C.; Seeger, M. Living at the frontiers of life: Extremophiles in Chile and their potential for bioremediation. Front. Microbiol. 2018, 9, 2309. [Google Scholar] [CrossRef] [PubMed]
- Banerjee, A.; Das, D.; Rudra, S.G.; Mazumder, K.; Andler, R.; Bandopadhyay, R. Characterization of exopolysaccharide produced by Pseudomonas sp. PFAB4 for synthesis of EPS-coated AgNPs with antimicrobial properties. J. Polym. Environ. 2020, 28, 242–256. [Google Scholar] [CrossRef]
- Khan, R.M. Problem Solving and Data Analysis Using Minitab: A Clear and Easy Guide to Six Sigma Methodology, 1st ed.; John Wiley & Sons: Hoboken, NJ, USA, 2013. [Google Scholar]
- Coffey, B.M.; Anderson, G.G. Biofilm formation in the 96-well microtiter plate. In Pseudomonas Methods and Protocols, 1st ed.; Filloux, A., Ramos, J.L., Eds.; Humana Press: New York, NY, USA, 2014; pp. 631–641. [Google Scholar]
- Aggarwal, S.; Somani, V.K.; Bhatnagar, R. Phosphate starvation enhances the pathogenesis of Bacillus anthracis. Int. J. Med. Microbiol. 2015, 305, 523–531. [Google Scholar] [CrossRef] [PubMed]
- Banerjee, A.; Somani, V.K.; Chakraborty, P.; Bhatnagar, R.; Varshney, R.K.; Echeverría-Vega, A.; Cuadros-Orellana, S.; Bandopadhyay, R. Molecular and genomic characterization of PFAB2: A non-virulent Bacillus anthracis strain isolated from an Indian hot spring. Curr. Genom. 2019, 20, 491–507. [Google Scholar] [CrossRef] [PubMed]
- Jeronimo, L.P.; Choi, M.R.; Yeon, S.H.; Park, S.K.; Yoon, Y.H.; Choi, S.H.; Kim, H.J.; Jang, I.T.; Park, J.K.; Rha, K.S.; et al. Effects of povidone-iodine composite on the elimination of bacterial biofilm. Int. Forum Allergy Rhinol. 2020, 10, 884–892. [Google Scholar] [CrossRef] [PubMed]
- Dai, M.; Li, C.; Yang, Z.; Sui, Z.; Li, J.; Dong, P.; Liang, X. The astaxanthin aggregation pattern greatly influences its antioxidant activity: A comparative study in caco-2 cells. Antioxidants 2020, 9, 126. [Google Scholar] [CrossRef] [PubMed] [Green Version]
- Shi, M.; Zhang, Z.; Yang, Y. Antioxidant and immunoregulatory activity of Ganoderma lucidum polysaccharide (GLP). Carbohydr. Polym. 2013, 95, 200–206. [Google Scholar] [CrossRef]
- Zhou, G.; Li, L.J.; Shi, Q.S.; Ouyang, Y.S.; Chen, Y.B.; Hu, W.F. Effects of nutritional and environmental conditions on planktonic growth and biofilm formation of Citrobacter werkmanii BF-6. J. Microbiol. Biotechnol. 2013, 23, 1673–1682. [Google Scholar] [CrossRef]
- Dewanti, R.; Wong, A.C. Influence of culture conditions on biofilm formation by Escherichia coli O157: H7. Int. J. Food Microbiol. 1995, 26, 147–164. [Google Scholar] [CrossRef]
- Ham, Y.; Kim, T.J. Nitrogen sources inhibit biofilm formation by Xanthomonas oryzae pv. oryzae. J. Microbiol. Biotechnol. 2018, 28, 2071–2078. [Google Scholar] [CrossRef]
- Maurya, A.; Kumar, P.S.; Raj, A. Characterization of biofilm formation and reduction of hexavalent chromium by bacteria isolated from tannery sludge. Chemosphere 2022, 286, 131795. [Google Scholar] [CrossRef]
- Kilic, T.U.Ğ.B.A.; Cihan, A.C. Biofilm Formation of the Facultative Thermophile Bacillus pumilus D194A and Affects of Sanitation Agents on Its Biofilms. Microbiology 2020, 89, 64–73. [Google Scholar] [CrossRef]
- Kilic, T. Biofilm-Forming Ability and Effect of Sanitation Agents on Biofilm-Control of Thermophile Geobacillus sp. D413 and Geobacillus toebii E134. Pol. J. Microbiol. 2020, 69, 411. [Google Scholar] [CrossRef] [PubMed]
- Fasnacht, M.; Polacek, N. Oxidative Stress in Bacteria and the Central Dogma of Molecular Biology. Front. Mol. Biosci. 2021, 8, 392. [Google Scholar] [CrossRef] [PubMed]
- Rajitha, K.; Nancharaiah, Y.V.; Venugopalan, V.P. Acid soluble extracellular matrix confers structural stability to marine Bacillus haynesii pellicle biofilms. Colloids Surf. B 2020, 194, 111160. [Google Scholar]
- Liang, Y.; Gao, H.; Chen, J.; Dong, Y.; Wu, L.; He, Z.; Liu, X.; Qiu, G.; Zhou, J. Pellicle formation in Shewanella oneidensis. BMC Microbiol. 2010, 10, 291. [Google Scholar] [CrossRef] [Green Version]
- Kobayashi, K. Bacillus subtilis pellicle formation proceeds through genetically defined morphological changes. J. Bacteriol. 2007, 189, 4920–4931. [Google Scholar] [CrossRef] [PubMed] [Green Version]
- Yu, H.S.; Saw, J.H.; Hou, S.; Larsen, R.W.; Watts, K.J.; Johnson, M.S.; Zimmer, M.A.; Ordal, G.W.; Taylor, B.L.; Alam, M. Aerotactic responses in bacteria to photoreleased oxygen. FEMS Microbiol. Lett. 2002, 217, 237–242. [Google Scholar] [CrossRef] [PubMed]
- Hölscher, T.; Bartels, B.; Lin, Y.C.; Gallegos-Monterrosa, R.; Price-Whelan, A.; Kolter, R.; Dietrich, L.E.; Kovács, Á.T. Motility, chemotaxis and aerotaxis contribute to competitiveness during bacterial pellicle biofilm development. J. Mol. Biol. 2015, 427, 3695–3708. [Google Scholar] [CrossRef] [PubMed] [Green Version]
- Rodrigues, D.A.; Almeida, M.A.; Teixeira, P.A.; Oliveira, R.T.; Azeredo, J.C. Effect of batch and fed-batch growth modes on biofilm formation by Listeria monocytogenes at different temperatures. Curr. Microbiol. 2009, 59, 457–462. [Google Scholar] [CrossRef] [PubMed] [Green Version]
- Joshi, M.H.; Patil, A.A.; Adivarekar, R.V. Characterization of brown-black pigment isolated from soil bacteria, Beijerinckia fluminensis. BioRxiv 2021. [Google Scholar] [CrossRef]
- Bayram, S. Production, purification, and characterization of Streptomyces sp. strain MPPS2 extracellular pyomelanin pigment. Arch. Microbiol. 2021, 203, 4419–4426. [Google Scholar] [CrossRef] [PubMed]
- Meredith, P.; Powell, B.J.; Riesz, J.; Nighswander-Rempel, S.P.; Pederson, M.R.; Moore, E.G. Towards structure-property-function relationships for eumelanin. Soft Matter 2006, 2, 37–44. [Google Scholar] [CrossRef] [PubMed] [Green Version]
- Mostert, A.B. Melanin, the what, the why and the how: An introductory review for materials scientists interested in flexible and versatile Polymers. Polymers 2021, 13, 1670. [Google Scholar] [CrossRef] [PubMed]
- Pralea, I.-E.; Moldovan, R.-C.; Petrache, A.-M.; Ilieș, M.; Hegheș, S.-C.; Ielciu, I.; Nicoara, R.; Moldo-van, M.; Ene, M.; Radu, M.; et al. From extraction to advanced analytical methods: The challenges of melanin analysis. Int. J. Mol. Sci. 2019, 20, 3943. [Google Scholar] [CrossRef] [PubMed] [Green Version]
- Hou, R.; Liu, X.; Xiang, K.; Chen, L.; Wu, X.; Lia, W.; Wu, X.; Lin, W.; Zheng, M.; Fu, J. Characterization of the physicochemical properties and extraction optimization of natural melanin from Inonotus hispidus mushroom. Food Chem. 2018, 277, 533–542. [Google Scholar] [CrossRef] [PubMed]
- Wang, L.F.; Rhim, J.W. Isolation and characterization of melanin from black garlic and sepia ink. LWT-Food Sci. Technol. 2018, 99, 17–23. [Google Scholar] [CrossRef]
- Gómez-Marín, A.M.; Sánchez, C.I. Thermal and mass spectroscopic characterization of a sulphur-containing bacterial melanin from Bacillus subtilis. J. Non Cryst. Solids 2010, 356, 1576–1580. [Google Scholar] [CrossRef]
- Ribera, J.; Panzarasa, G.; Stobbe, A.; Osypova, A.; Rupper, P.; Klose, D.; Schwarze, F.W. Scalable biosynthesis of melanin by the basidiomycete Armillaria cepistipes. J. Agric. Food Chem. 2018, 67, 132–139. [Google Scholar] [CrossRef]
- Simonovic, B.; Vucelic, V.; Hadzi-Pavlovic, A.; Stepien, K.; Wilczok, T.; Vucelic, D. Thermogravimetry and differential scanning calorimetry of natural and synthetic melanins. J. Therm. Anal. 1990, 36, 2475–2482. [Google Scholar] [CrossRef]
- Palani, P.; Shree, C.G. Microbial Production and Characterization of 3, 4-dihydroxy-L Phenylalanine Mediated an Extracellular Heterogenic Eumelanin Pigment From Marine Actinomycetes Prauserella sp. MAPPL 017A. Res. Sq. 2021. [Google Scholar] [CrossRef]
- Banerjee, A.; Supakar, S.; Banerjee, R. Melanin from the nitrogen-fixing bacterium Azotobacter chroococcum: A spectroscopic characterization. PLoS ONE 2014, 9, e84574. [Google Scholar] [CrossRef] [PubMed] [Green Version]
- Dworzanski, J.P. Pyrolysis-Gas Chromatography of Natural and Synthetic Melanins. J. Anal. Appl. Pyrolysis 1983, 5, 69–79. [Google Scholar] [CrossRef]
- Stepien, K.B.; Dworzanski, J.P.; Bilinska, B.; Porebska-Budny, M.; Hollek, A.M.; Wilczok, T. Catecholamine Melanins. Structural Changes Induced by Copper Ions. Biochim. Biophys. Acta 1989, 997, 49–54. [Google Scholar] [CrossRef]
- Seraglia, R.; Traldi, P.; Elli, G.; Bertazzo, A.; Costa, C.; Allegri, G. Laser Desorption Ionization Mass Spectrometry in the Study of Natural and Synthetic Melanins. I-Tyrosine Melanins. Biol. Mass Spectrom. 1993, 22, 687–697. [Google Scholar] [CrossRef] [PubMed]
- Dzierzega-Lecznar, A.; Chodurek, E.; Stepien, K.; Wilczok, T. Pyrolysis-Gas Chromatography-Mass Spectrometry of Synthetic Neuromelanins. J. Anal. Appl. Pyrolysis 2002, 62, 239–248. [Google Scholar] [CrossRef]
- Dzierzega-Lecznar, A.; Kurkiewicz, S.; Stepien, K.; Chodurek, E.; Wilczok, T.; Arzberger, T.; Riederer, P.; Gerlach, M. GC/MS analysis of thermally degraded neuromelanin from the human substantia nigra. J. Am. Soc. Mass Spectrom. 2004, 15, 920–926. [Google Scholar] [CrossRef] [PubMed]
- Ye, M.; Guo, G.Y.; Lu, Y.; Song, S.; Wang, H.Y.; Yang, L. Purification, structure and anti-radiation activity of melanin from Lachnum YM404. Int. J. Biol. Macromol. 2014, 63, 170–176. [Google Scholar] [CrossRef] [PubMed]
- Vasanthakumar, A.; DeAraujo, A.; Mazurek, J.; Schilling, M.; Mitchell, R. Pyomelanin production in Penicillium chrysogenum is stimulated by L-tyrosine. Microbiology 2015, 161, 1211–1218. [Google Scholar] [CrossRef]
- Arteaga-Pérez, L.E.; Jiménez, R.; Grob, N.; Gómez, O.; Romero, R.; Ronsse, F. Catalytic upgrading of biomass-derived vapors on carbon aerogel-supported Ni: Effect of temperature, metal cluster size and catalyst-to-biomass ratio. Fuel Process. Technol. 2018, 178, 251–261. [Google Scholar] [CrossRef]
- Hunter, R.C.; Newman, D.K. A putative ABC transporter, hatABCDE, is among molecular determinants of pyomelanin production in Pseudomonas aeruginosa. J. Bacteriol. 2010, 192, 5962–5971. [Google Scholar] [CrossRef] [Green Version]
- Han, H.; Iakovenko, L.; Wilson, A.C. Loss of homogentisate 1, 2-dioxygenase activity in Bacillus anthracis results in accumulation of protective pigment. PLoS ONE 2015, 10, e0128967. [Google Scholar] [CrossRef] [Green Version]
- Mekala, L.P.; Mohammed, M.; Chinthalapati, S.; Chinthalapati, V.R. Pyomelanin production: Insights into the incomplete aerobic l-phenylalanine catabolism of a photosynthetic bacterium, Rubrivivax benzoatilyticus JA2. Int. J. Biol. Macromol. 2019, 126, 755–764. [Google Scholar] [CrossRef] [PubMed]
- Rita, D.C.; Pombeiro-Sponchiado, S.R. Antioxidant activity of the melanin pigment extracted from Aspergillus nidulans. Biol. Pharm. Bull. 2005, 28, 1129–1131. [Google Scholar]
- Yao, Z.Y.; Qi, J.H. Comparison of antioxidant activities of melanin fractions from chestnut shell. Molecules 2016, 21, 487. [Google Scholar] [CrossRef] [PubMed] [Green Version]
- Lee, J.; Koo, N.; Min, D.B. Reactive oxygen species, aging, and antioxidative nutraceuticals. Compr. Rev. Food Sci. Food Saf. 2004, 3, 21–33. [Google Scholar] [CrossRef]
- Li, D.M.; Zhou, D.Y.; Zhu, B.W.; Miao, L.; Qin, L.; Dong, X.P.; Wang, X.D.; Murata, Y. Extraction, structural characterization and antioxidant activity of polyhydroxylated 1, 4-naphthoquinone pigments from spines of sea urchin Glyptocidaris crenularis and Strongylocentrotus intermedius. Eur. Food Res. Technol. 2013, 237, 331–339. [Google Scholar] [CrossRef]
- Harley-Mason, J. Constitution of Melanin. Nature 1947, 159, 338–339. [Google Scholar] [CrossRef]
- Jacobson, E.S.; Tinnell, S.B. Antioxidant function of fungal melanin. J. Bacteriol. 1993, 175, 7102–7104. [Google Scholar] [CrossRef] [Green Version]
- Wang, Z.; Dillon, J.; Gaillard, E.R. Antioxidant properties of melanin in retinal pigment epithelial cells. Photochem. Photobiol. 2006, 82, 474–479. [Google Scholar] [CrossRef]
- Ferraz, A.R.; Pacheco, R.; Vaz, P.D.; Pintado, C.S.; Ascensão, L.; Serralheiro, M.L. Melanin: Production from Cheese Bacteria, Chemical Characterization, and Biological Activities. Int. J. Environ. Res. Public Health 2021, 18, 10562. [Google Scholar] [CrossRef]
- Vijayan, V.; Jasmin, C.; Anas, A.; Kuttan, S.P.; Vinothkumar, S.; Subrayan, P.P.; Nair, S. Sponge-associated bacteria produce non-cytotoxic melanin which protects animal cells from photo-toxicity. Appl. Biochem. Biotechnol. 2017, 183, 396–411. [Google Scholar] [CrossRef] [PubMed]
- Tran-Ly, A.N.; Reyes, C.; Schwarze, F.W.; Ribera, J. Microbial production of melanin and its various applications. World J. Microbiol. Biotechnol. 2020, 36, 170. [Google Scholar] [CrossRef]
- Roy, S.; Rhim, J.W. Agar-based antioxidant composite films incorporated with melanin nanoparticles. Food Hydrocoll. 2019, 94, 391–398. [Google Scholar] [CrossRef]
- Finley, J.W.; Given, P., Jr. Technological necessity of antioxidants in the food industry. Food Chem. Toxicol. 1986, 24, 999–1006. [Google Scholar] [CrossRef]
- Xu, X.; Liu, A.; Hu, S.; Ares, I.; Martínez-Larrañaga, M.R.; Wang, X.; Martínez, M.; Anadón, A.; Martínez, M.A. Synthetic phenolic antioxidants: Metabolism, hazards and mechanism of action. Food Chem. 2021, 353, 129488. [Google Scholar] [CrossRef] [PubMed]


| Sample | Temperature (°C) | Weight Loss (%) | ||
|---|---|---|---|---|
| TOnset | TPeak | TEnd | ||
| Pyomelanin | 25 | 51 | 173 | 8.8 |
| 174 | 309 | 462 | 24.8 | |
| 463 | 541 | 600 | 8.1 | |
| Element | Weight% | Weight% Sigma | Atomic % |
|---|---|---|---|
| C | 43.65 ± 5.05 | 0.83 ± 0.16 | 49.61 ± 3.13 |
| O | 42.66 ± 4.60 | 0.83 ± 0.20 | 37.60 ± 4.61 |
| P | 1.96 ± 1.19 | 0.09 ± 0.42 | 0.90 ± 0.56 |
| S | 2.16 ± 1.38 | 0.06 ± 0.03 | 0.95 ± 0.60 |
| N | 10.91 ± 2.14 | 1.33 ± 0.28 | 10.95 ± 1.98 |
| Total | 100 | 100 |
| R.Time | Area (%) | Name | Classification | m/z |
|---|---|---|---|---|
| 4.14 | 13.8 | Dimethylamine | Amine | 44, 45, 28, 42, 43 |
| 4.20 | 33.8 | Propene | Hydrocarbon | 41, 42, 39, 27, 40, 38 |
| 4.34 | 19.7 | 1-Propene, 2-methyl- | Hydrocarbon | 41, 56, 39, 55, 28, 27 |
| 4.77 | 6.23 | Isoprene | Hydrocarbon | 67, 53, 68, 39, 40, 41 |
| 5.58 | 4.13 | Acetic acid | Acid | 43, 45, 60, 42 |
| 5.87 | 0.4 | Isobutyronitrile | Nitrile | 42, 68, 54, 41, 28 |
| 6.50 | 1.12 | Benzene | Aromatic | 78, 77, 51, 50, 52, 39 |
| 7.68 | 0.35 | Ethenamine, N-methylene- | Amine | 28, 55, 54, 27 |
| 7.88 | 1.18 | Butanenitrile, 3-methyl- | Nitrile | 43, 41, 27, 39, 68 |
| 8.28 | 0.74 | Pyridine | Aromatic Amine | 79, 52, 51, 50, 78 |
| 8.35 | 2.78 | Pyrrole | Aromatic Amine | 67, 39, 41, 40, 28 |
| 8.86 | 3.27 | Toluene | Aromatic | 91, 92, 65 |
| 10.26 | 0.91 | Pyridine, 2-methyl- | Aromatic Amine | 93, 66, 39, 92, 51 |
| 10.78 | 0.68 | 1H-Pyrrole, 3-methyl- | Aromatic Amine | 80, 81, 53, 52, 51 |
| 10.89 | 0.27 | Diazene, bis(1,1-dimethylethyl)- | Azo | 57, 41, 29, 39 |
| 10.97 | 0.89 | Isoamyl cyanide | Nitrile | 55, 41, 43, 57, 54 |
| 11.03 | 0.82 | 1H-Pyrrole, 2-methyl- | Aromatic Amine | 80, 81, 53, 52, 51 |
| 11.65 | 0.85 | Ethylbenzene | Aromatic | 91, 106, 51, 65, 77 |
| 12.65 | 0.84 | Bicyclo [4.2.0]octa-1,3,5-triene | Hydrocarbon | 104, 103, 78, 51, 50 |
| 13.00 | 0.39 | Pyridine, 2-ethyl- | Aromatic Amine | 106, 107, 79, 78, 52 |
| 13.47 | 0.15 | 1H-Pyrrole, 2,5-dimethyl- | Aromatic Amine | 94, 95, 80, 93, 42 |
| 13.58 | 0.29 | 1H-Pyrrole, 3-ethyl- | Aromatic Amine | 80, 95, 53, 94, 67 |
| 15.45 | 1.37 | Phenol | Phenolic | 94, 66, 65, 39, 40 |
| 18.59 | 1.38 | p-Cresol | Phenolic | 107, 108, 77, 79, 80 |
| 20.75 | 0.42 | 5H-1-Pyrindine | Aromatic Amine | 117, 90, 89, 63, 39 |
| 25.52 | 0.81 | Indole | Aromatic Amine | 117, 90, 89, 63, 118 |
| 33.02 | 2.43 | Diethyl Phthalate | Ester | 149, 177, 150, 65 |
Publisher’s Note: MDPI stays neutral with regard to jurisdictional claims in published maps and institutional affiliations. |
© 2022 by the authors. Licensee MDPI, Basel, Switzerland. This article is an open access article distributed under the terms and conditions of the Creative Commons Attribution (CC BY) license (https://creativecommons.org/licenses/by/4.0/).
Share and Cite
Marín-Sanhueza, C.; Echeverría-Vega, A.; Gómez, A.; Cabrera-Barjas, G.; Romero, R.; Banerjee, A. Stress Dependent Biofilm Formation and Bioactive Melanin Pigment Production by a Thermophilic Bacillus Species from Chilean Hot Spring. Polymers 2022, 14, 680. https://doi.org/10.3390/polym14040680
Marín-Sanhueza C, Echeverría-Vega A, Gómez A, Cabrera-Barjas G, Romero R, Banerjee A. Stress Dependent Biofilm Formation and Bioactive Melanin Pigment Production by a Thermophilic Bacillus Species from Chilean Hot Spring. Polymers. 2022; 14(4):680. https://doi.org/10.3390/polym14040680
Chicago/Turabian StyleMarín-Sanhueza, Cathalina, Alex Echeverría-Vega, Aleydis Gómez, Gustavo Cabrera-Barjas, Romina Romero, and Aparna Banerjee. 2022. "Stress Dependent Biofilm Formation and Bioactive Melanin Pigment Production by a Thermophilic Bacillus Species from Chilean Hot Spring" Polymers 14, no. 4: 680. https://doi.org/10.3390/polym14040680