
Anticorrosion, Thermal Degradation, and Hydrophobic Performances of Graphene/
 , ,
, ,  ,
,  ,
, 
Abstract
:1. Introduction
2. Materials and Methods
2.1. Materials
2.2. Preparation of the Nanocomposite Coatings
2.3. Characterization
2.3.1. FTIR
2.3.2. Thermal Analysis
2.3.3. Optical Transmittance
2.3.4. Water Contact Angle (WCA) Analysis
2.3.5. Coating Surface Adhesion Analysis
2.3.6. Electrochemical Impedance Spectroscopy (EIS)
2.3.7. Surface Morphology
3. Results and Discussion
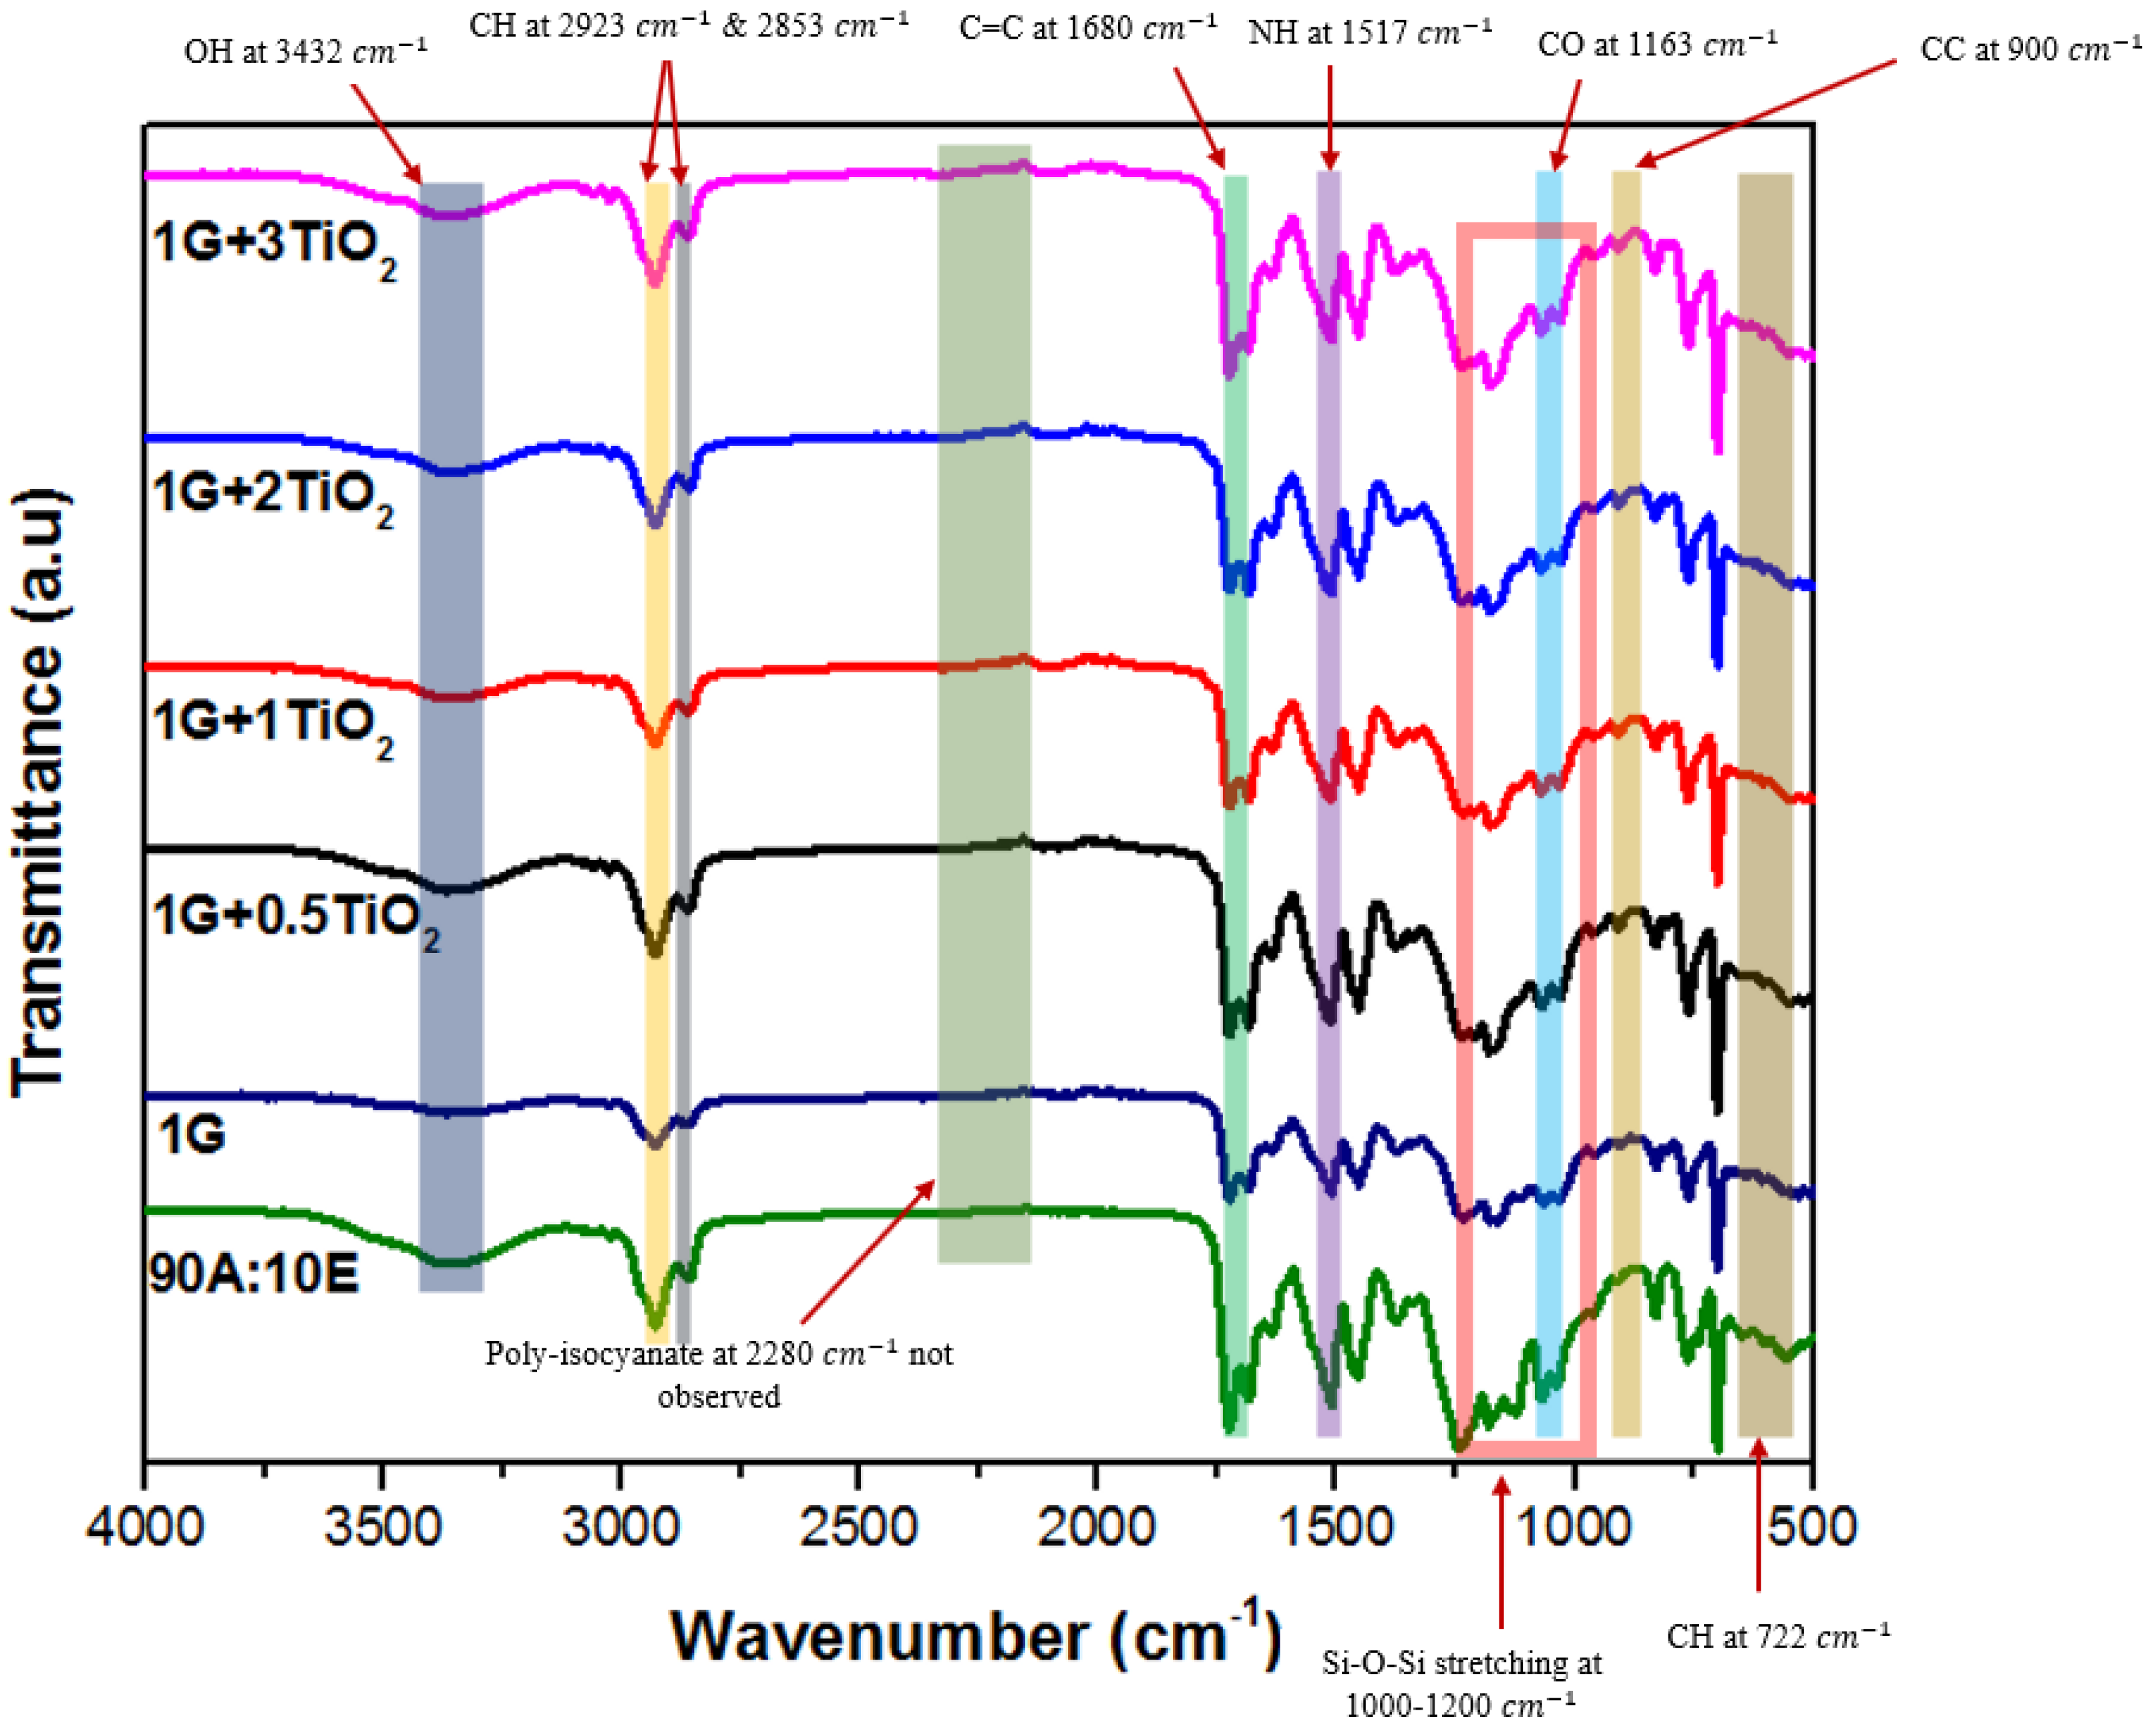
3.1. Fourier-Transform Infrared Spectroscopy (FTIR)
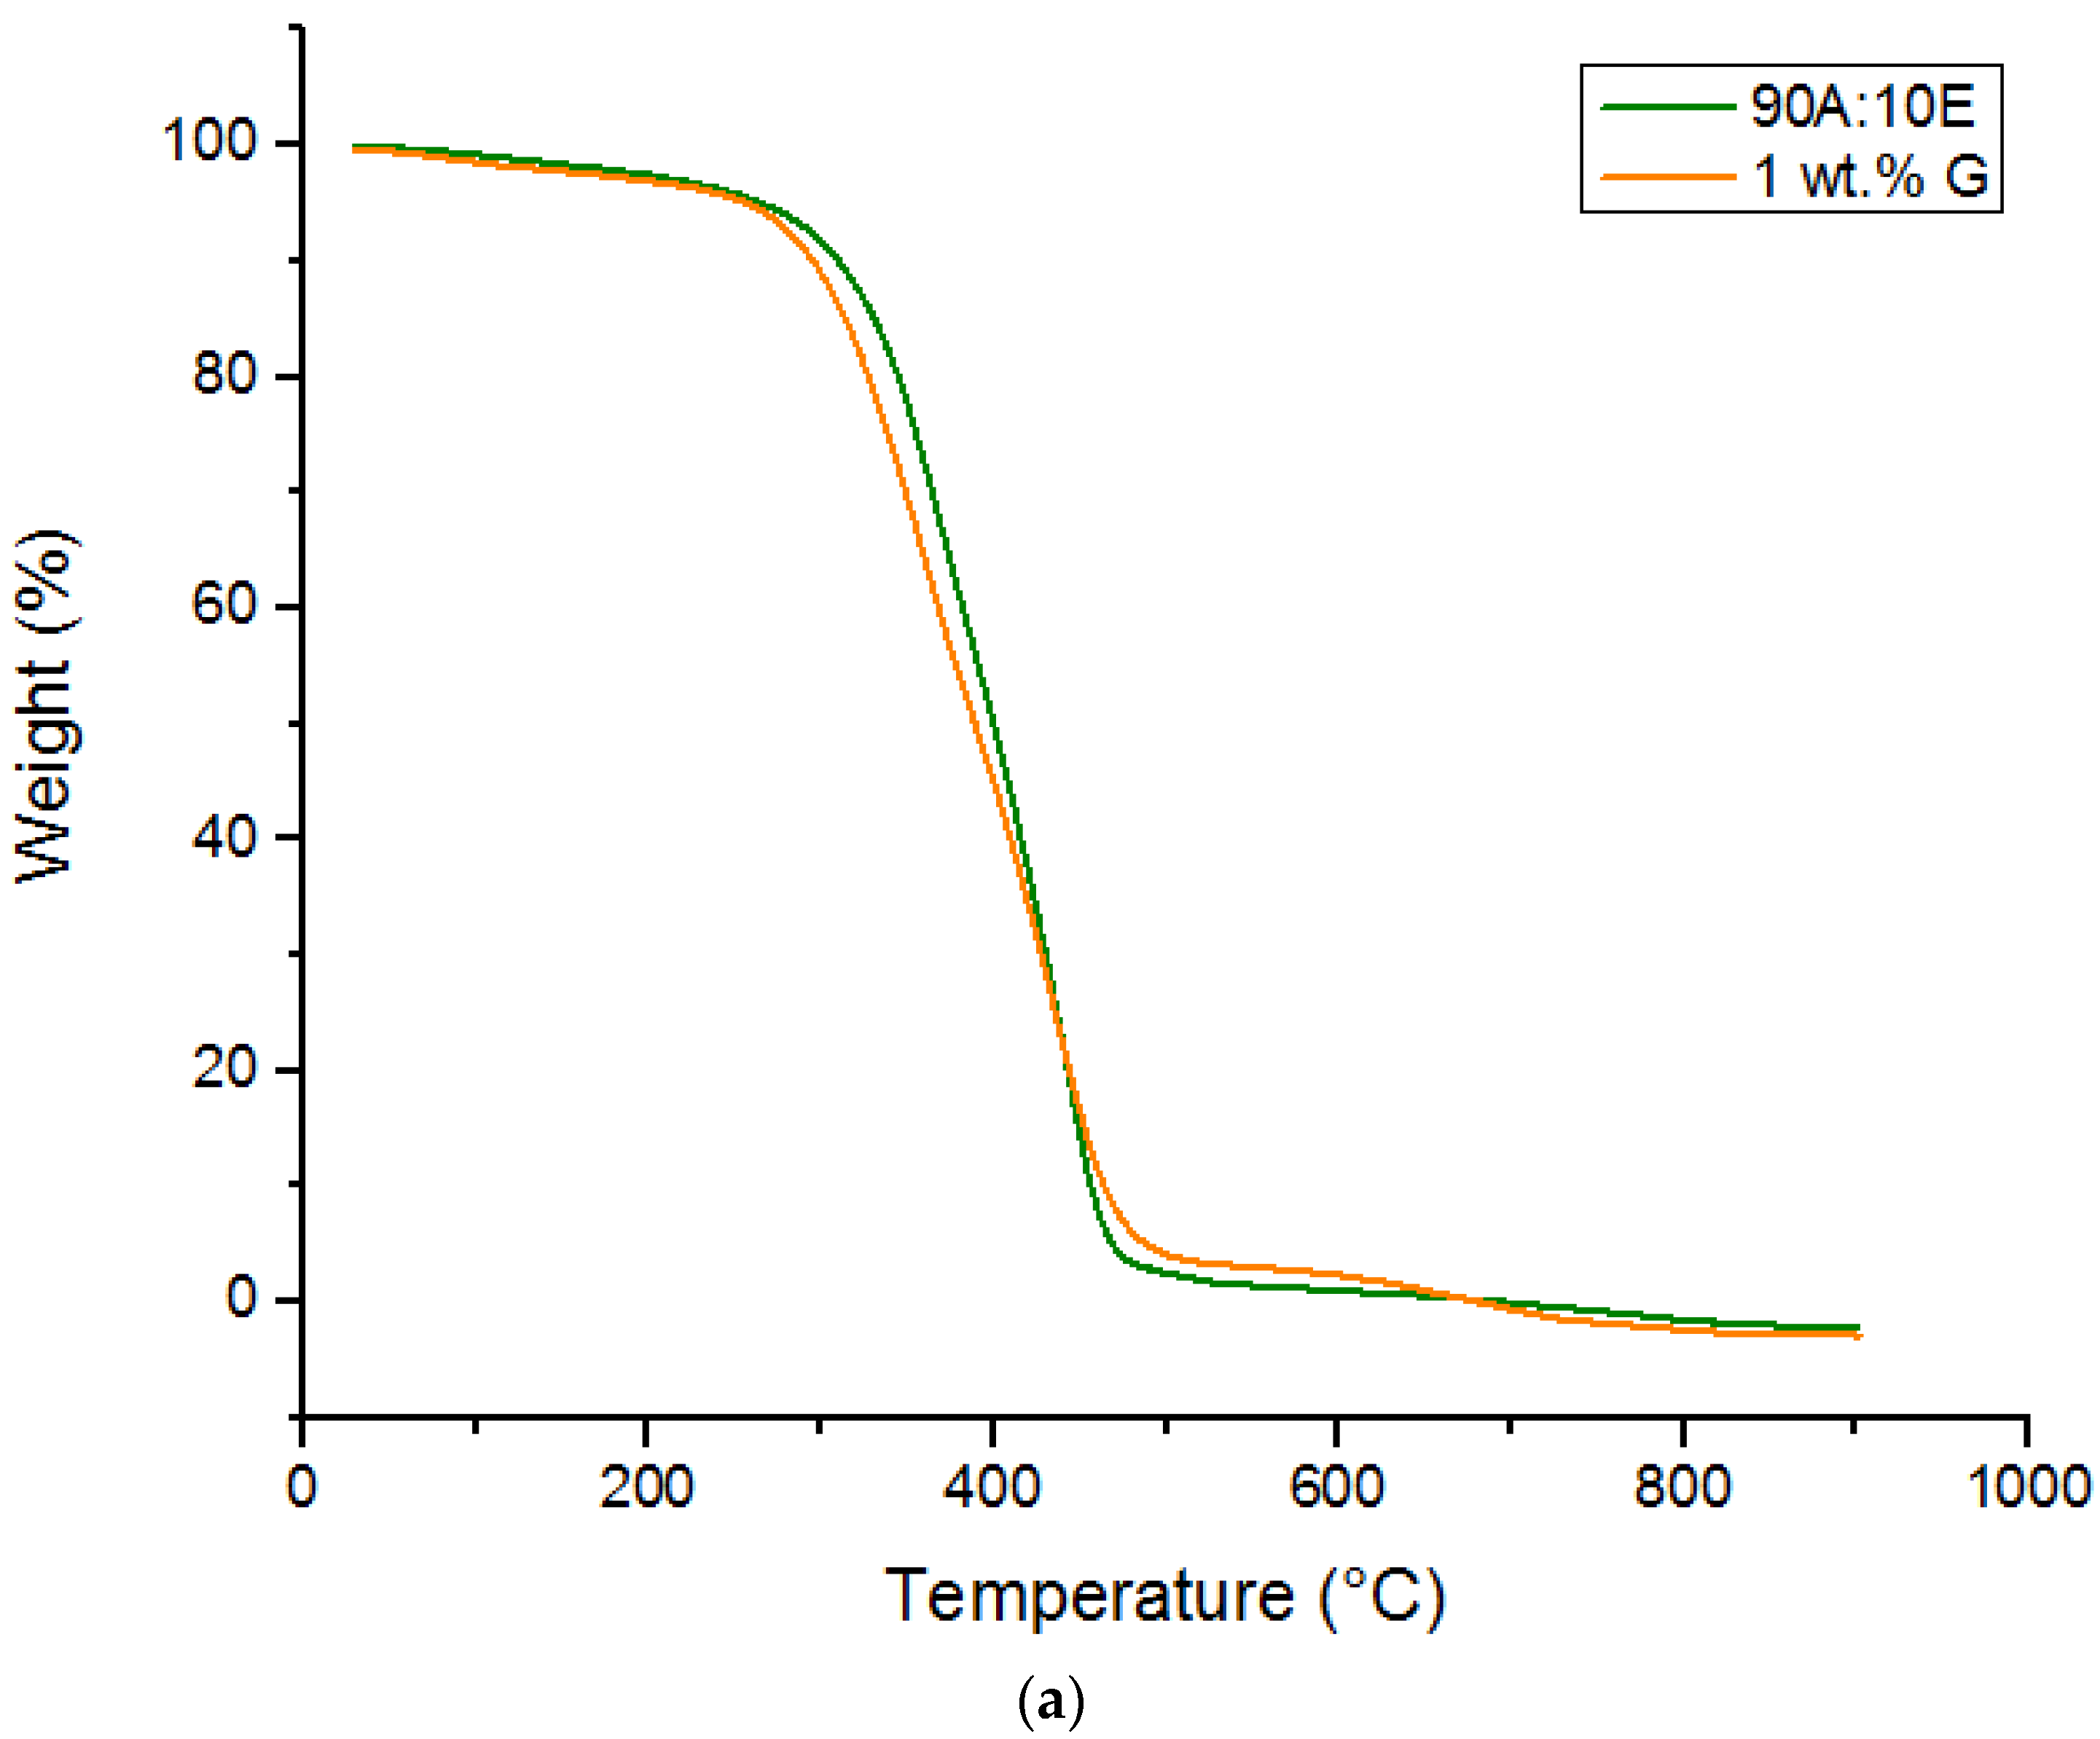
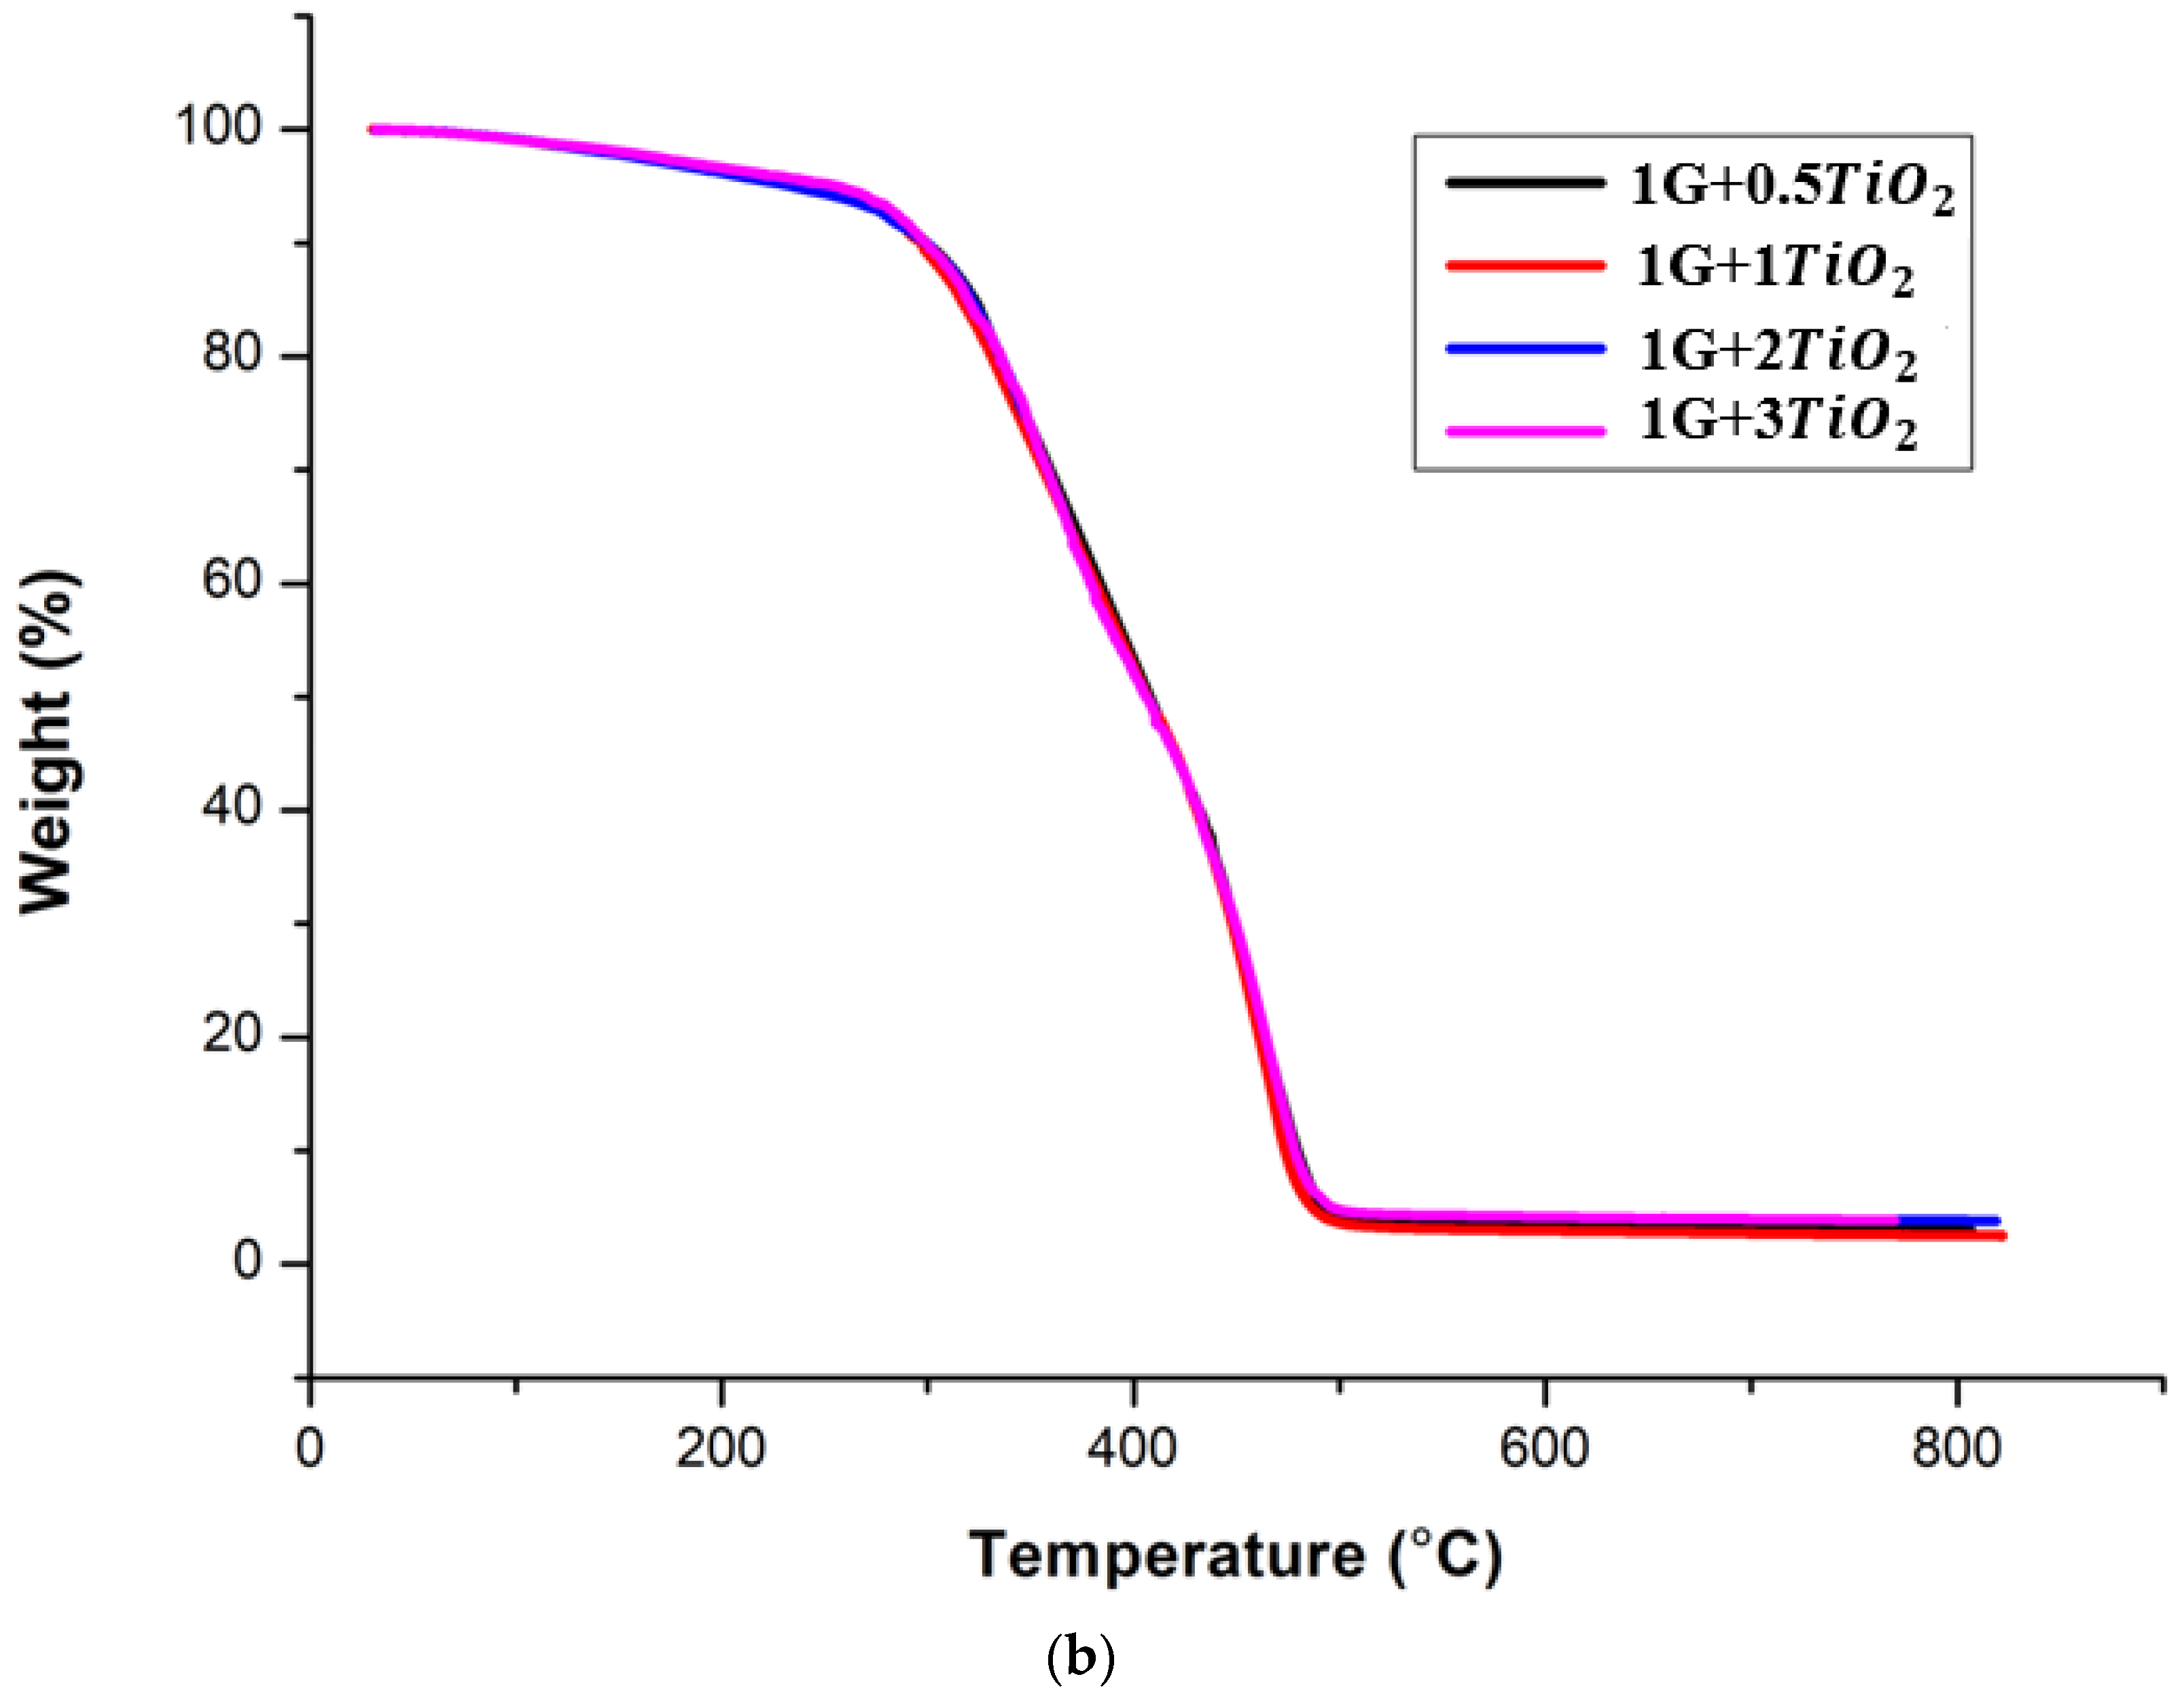
3.2. Thermal Analysis
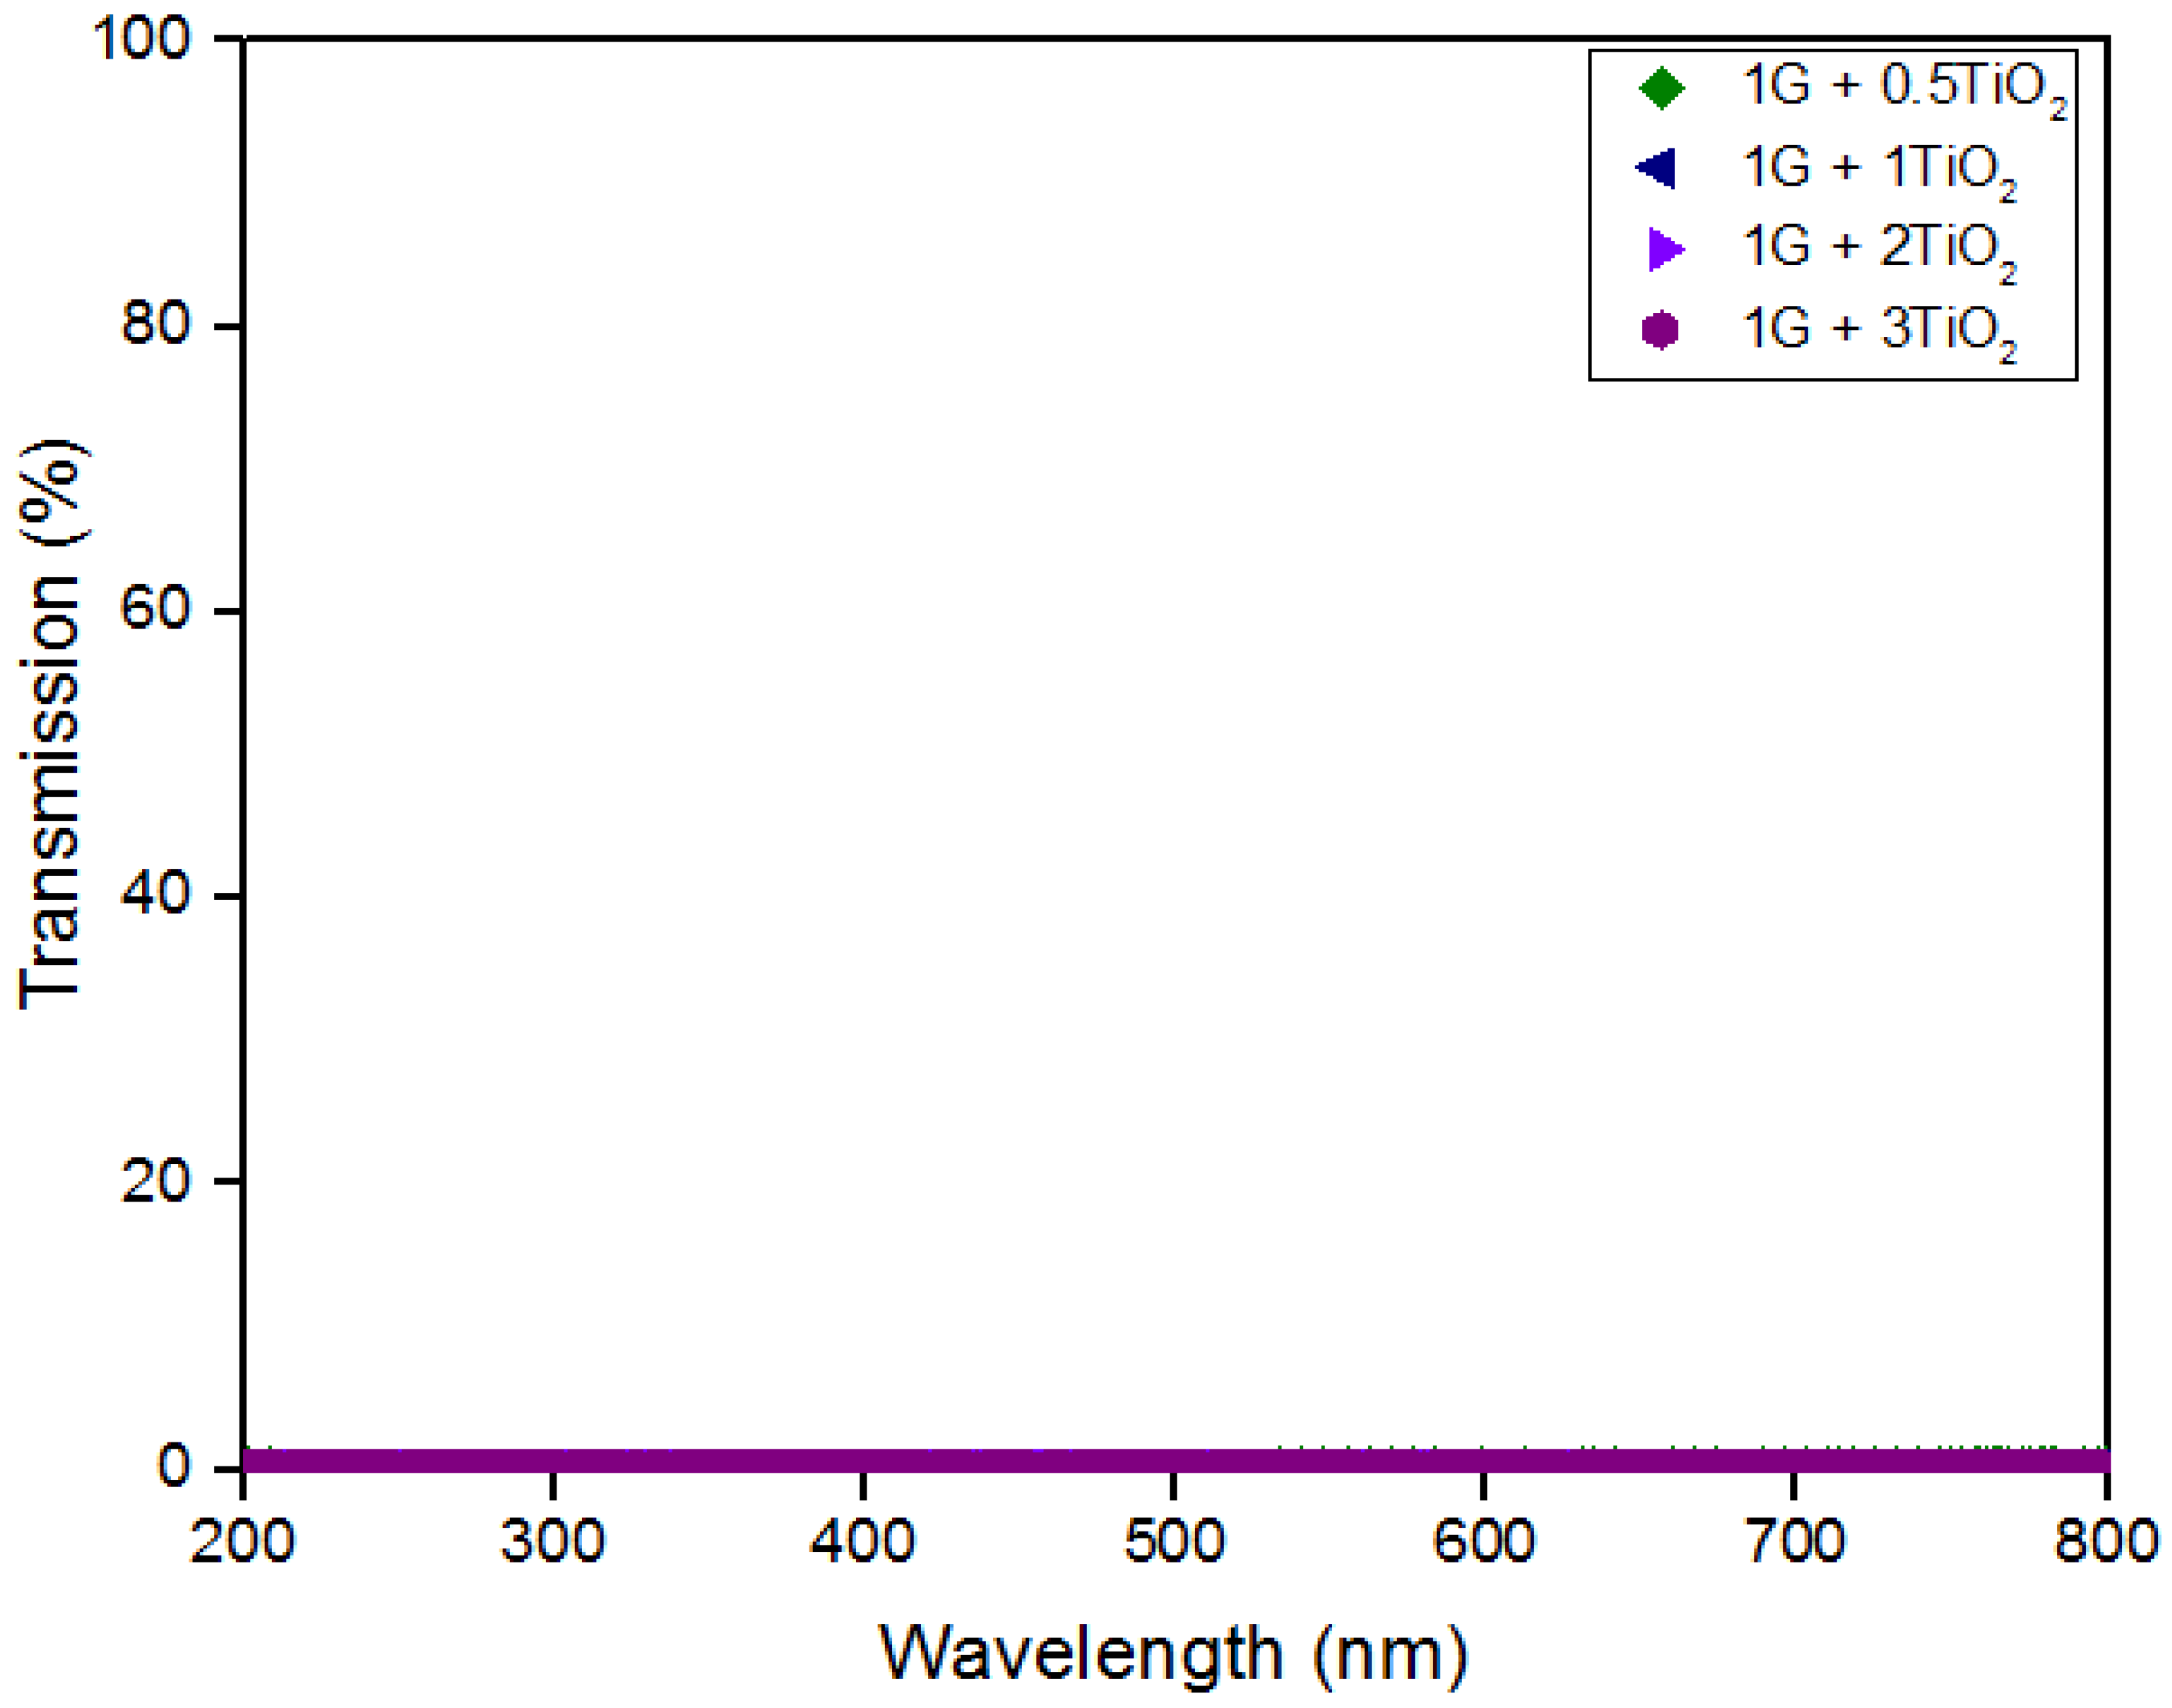
3.3. Optical Transmittance
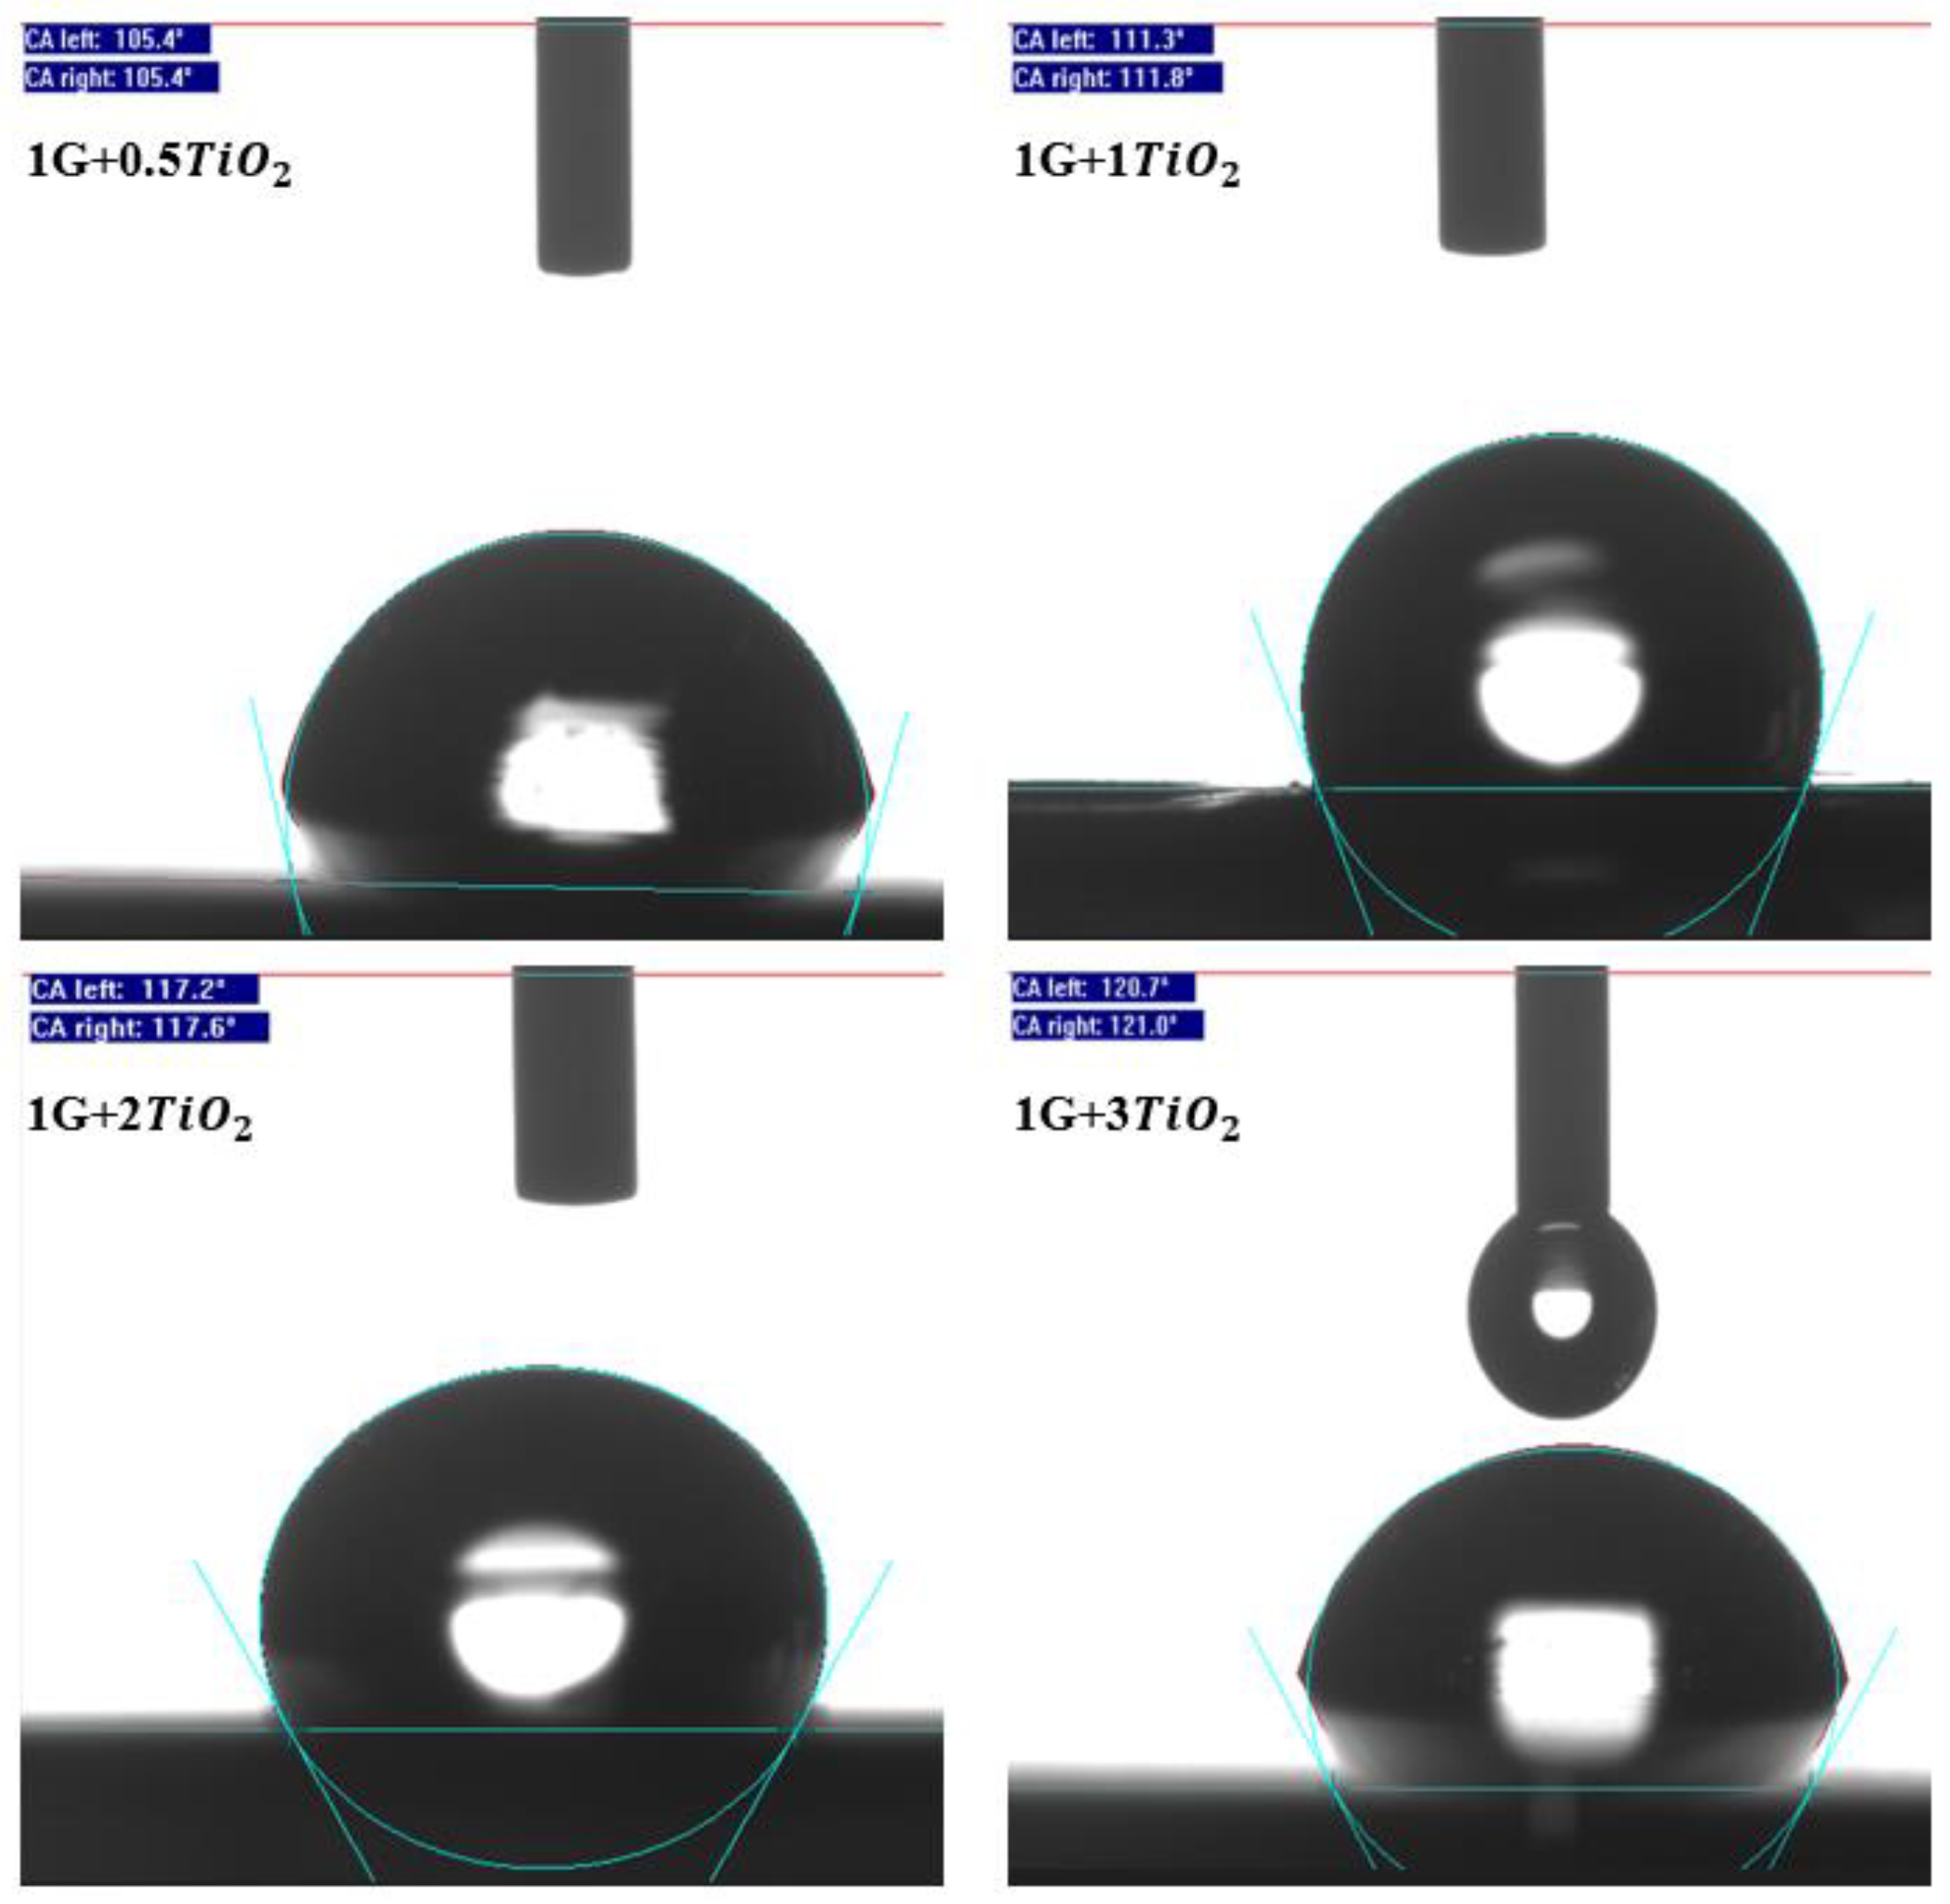
3.4. Water Contact Angle (WCA) Measurements
3.5. Cross-Hatch Test (CHT) Analysis
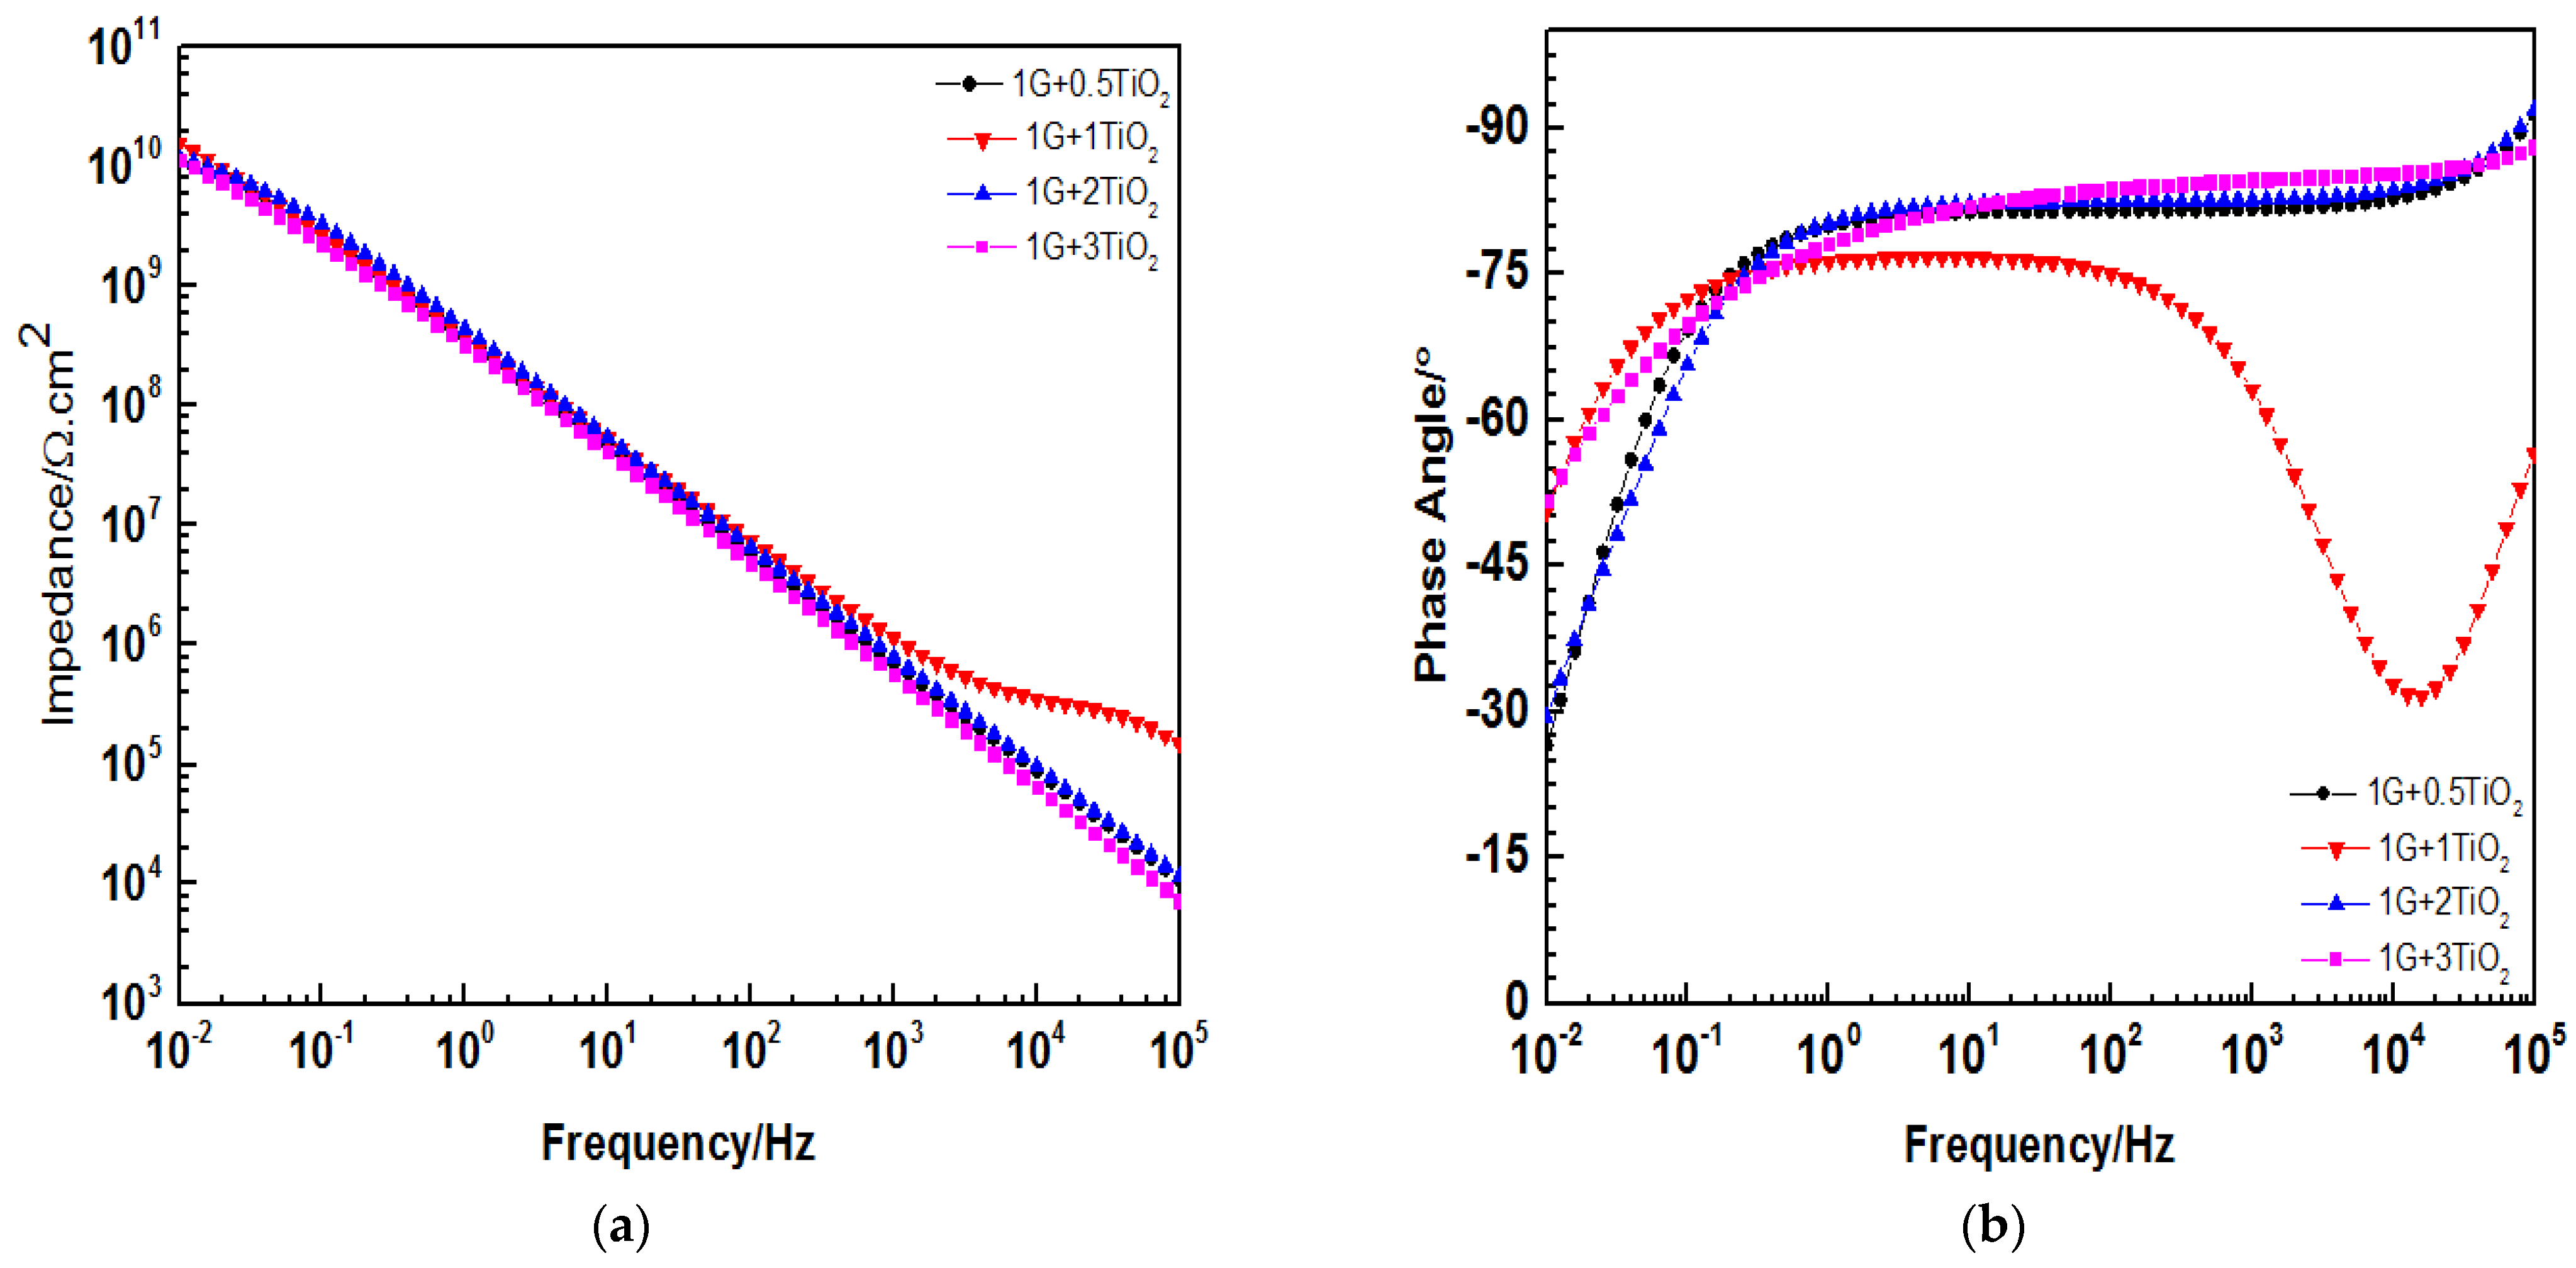
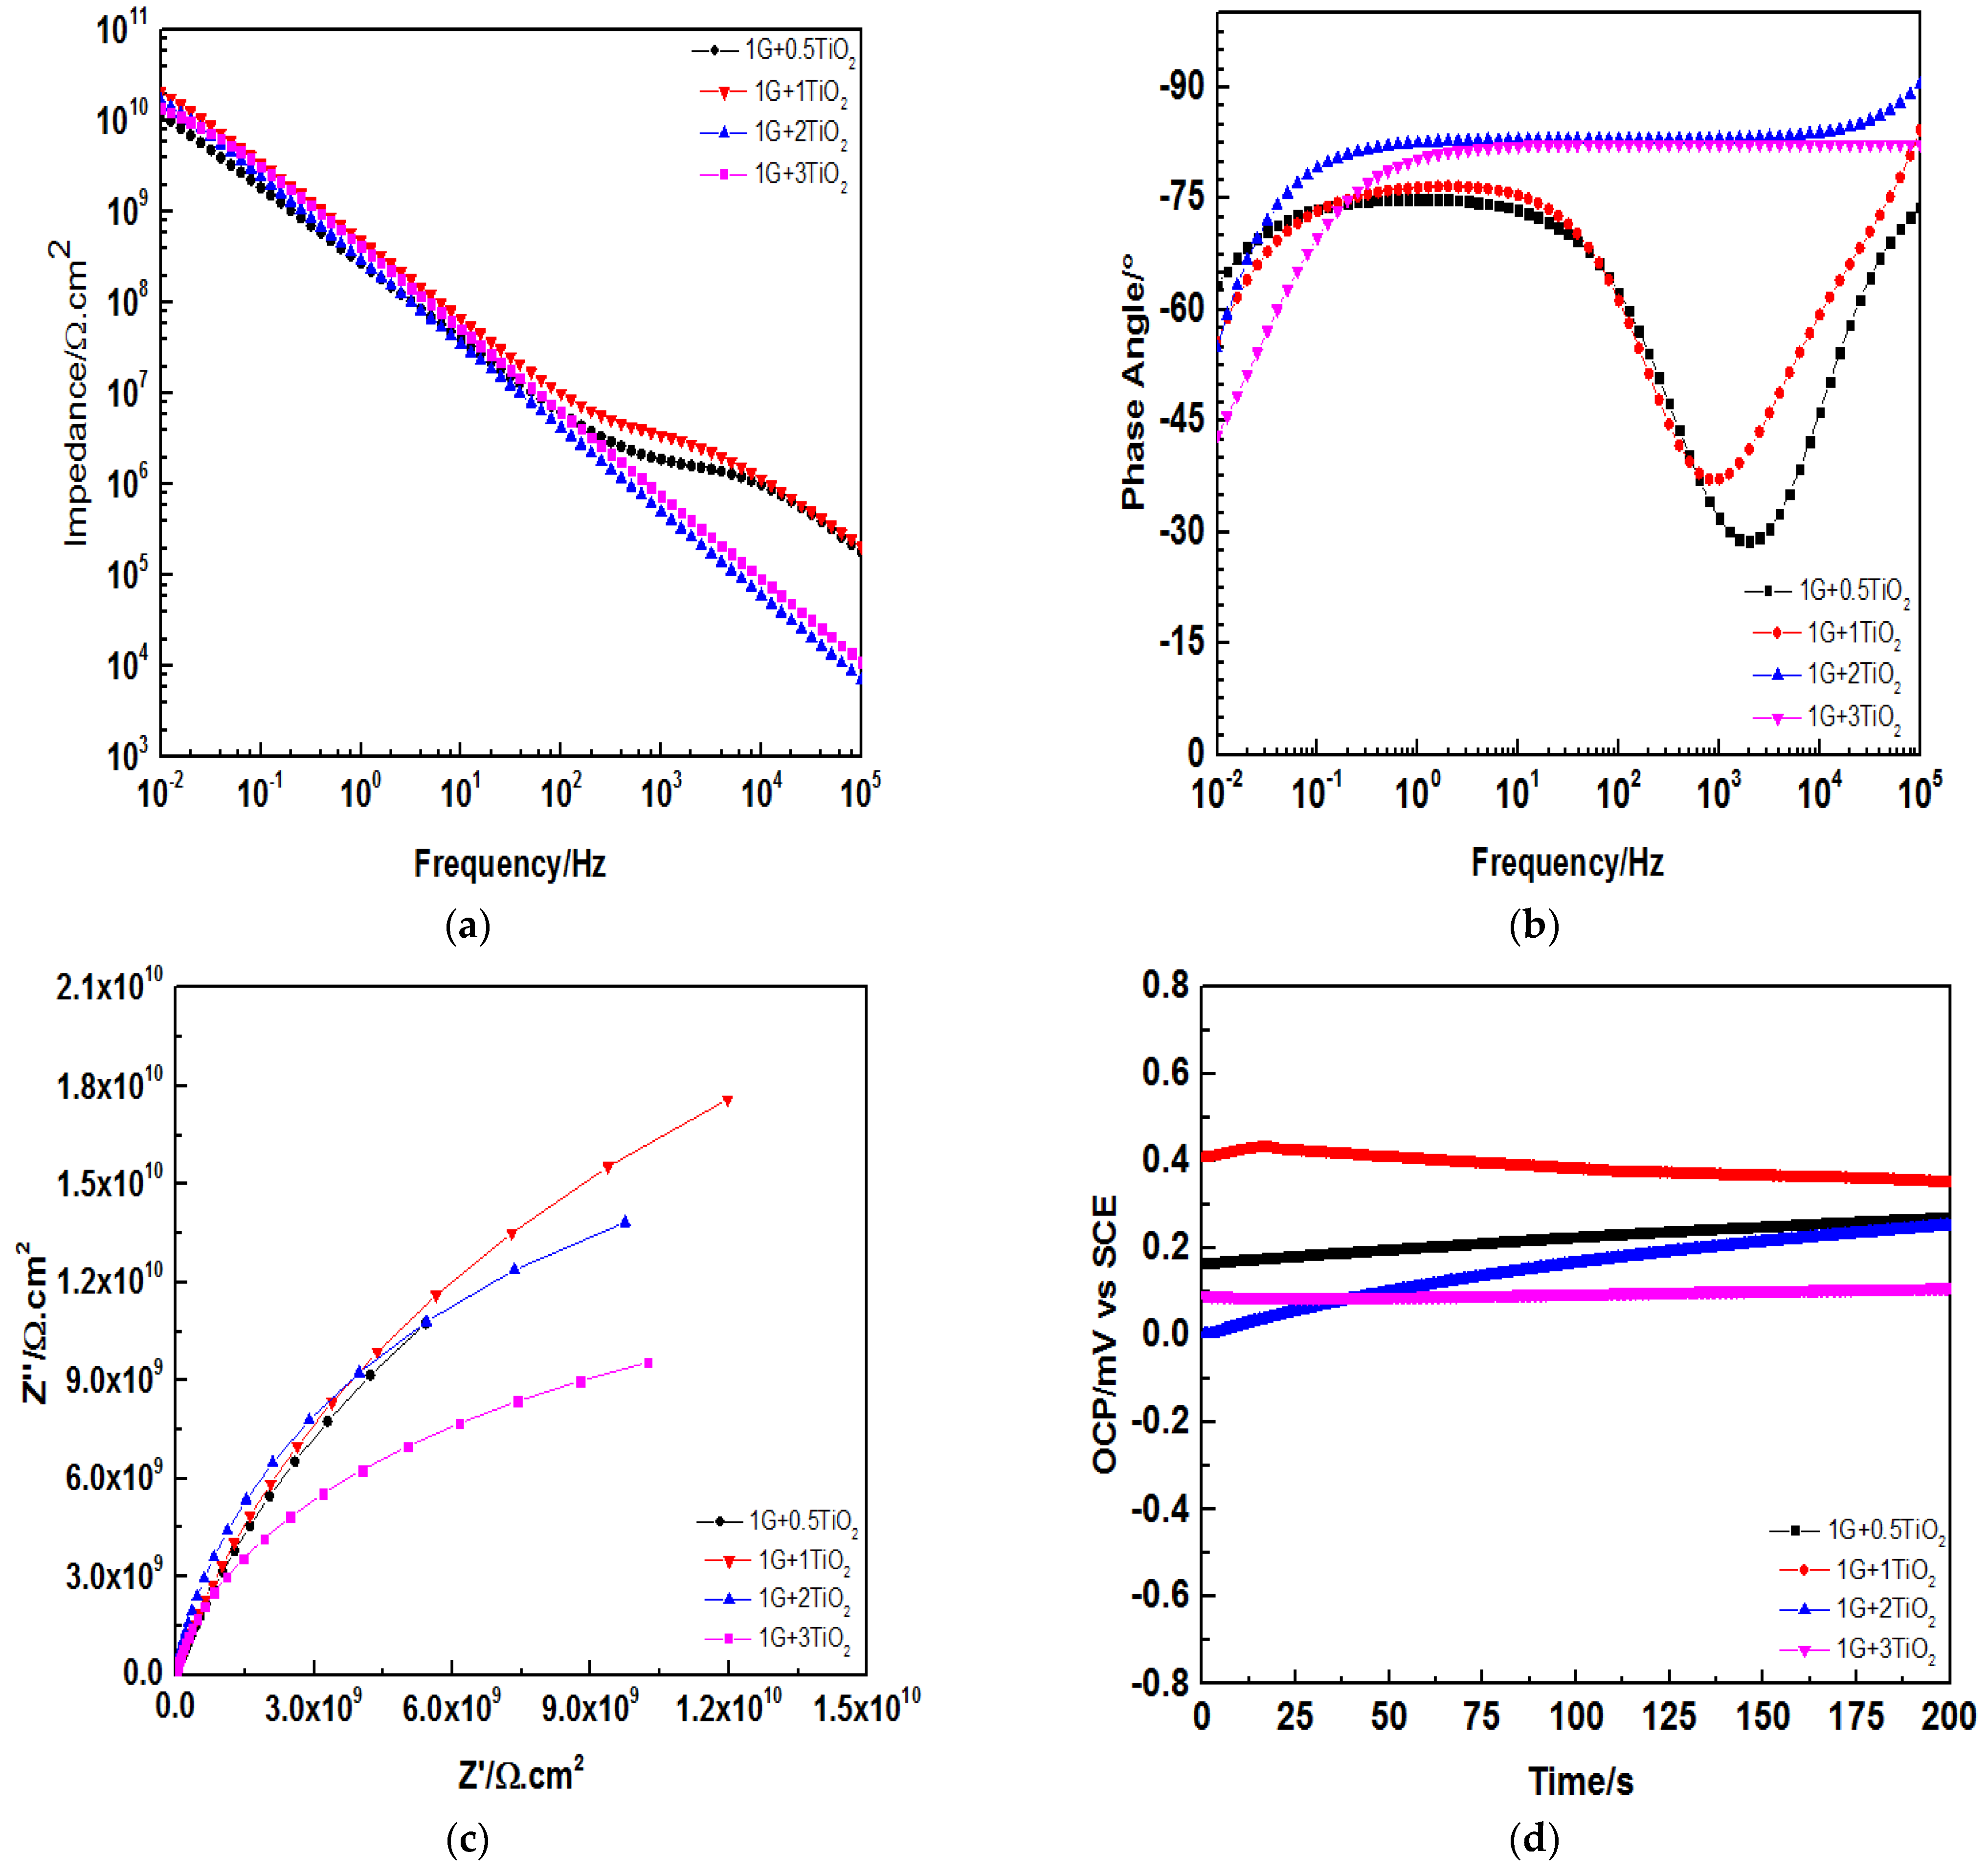
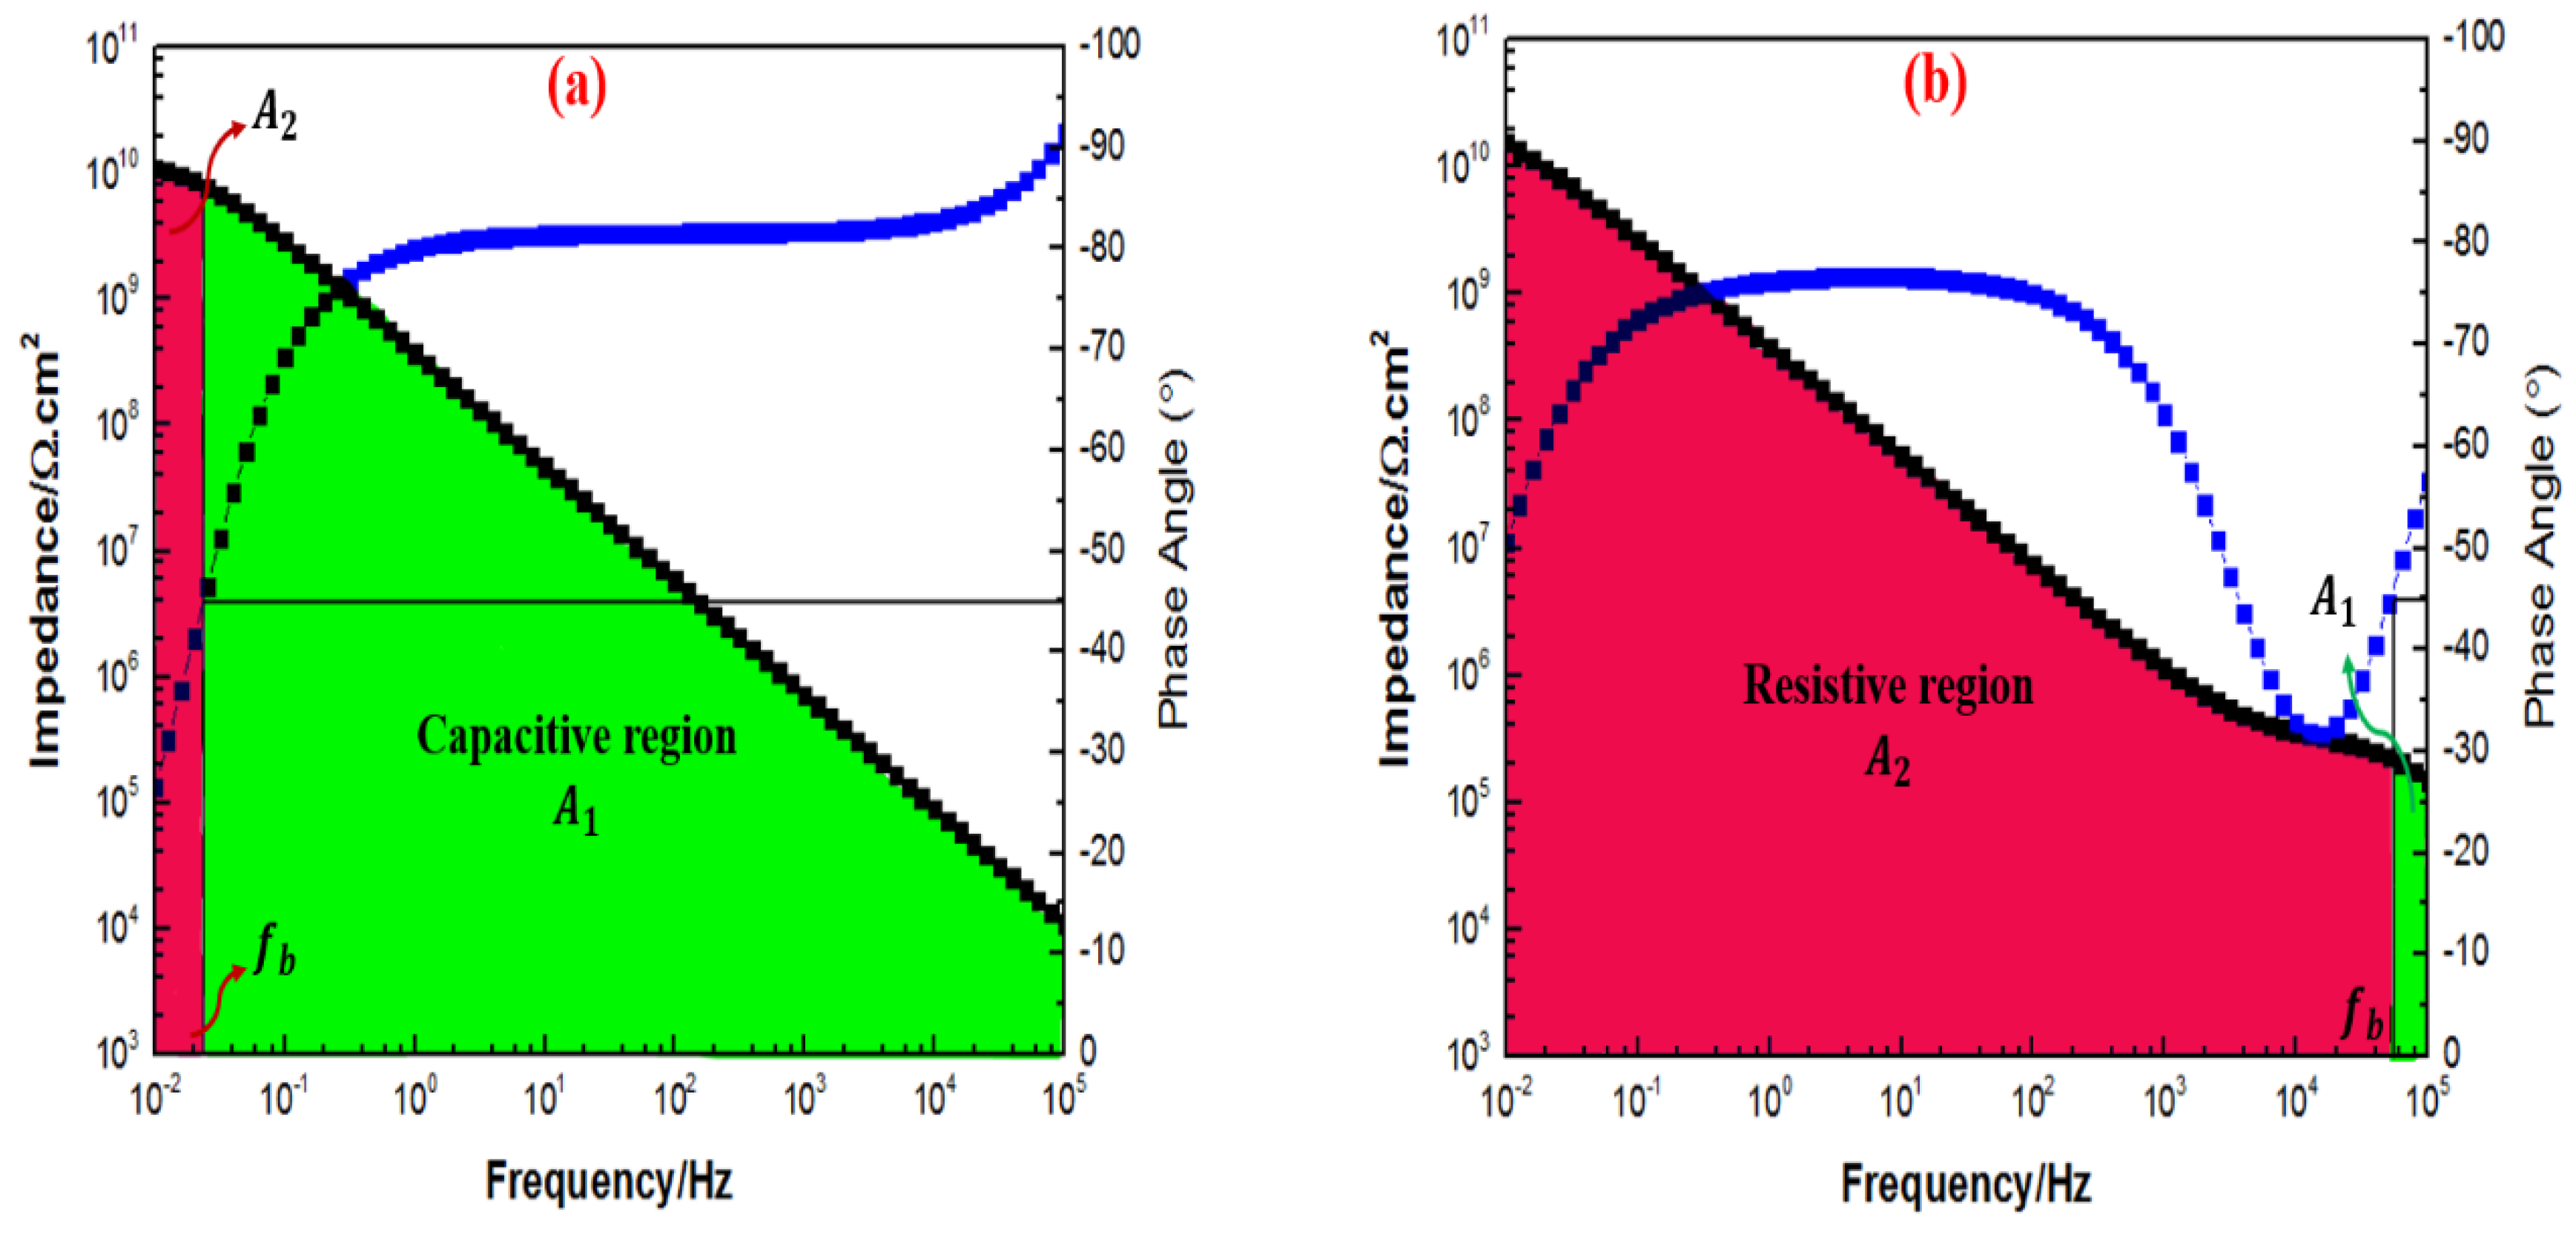
3.6. Electrochemical Impedance Spectroscopy Evaluations
3.7. Surface Morphology
4. Conclusions
Supplementary Materials
Author Contributions
Funding
Institutional Review Board Statement
Data Availability Statement
Acknowledgments
Conflicts of Interest
References
- Zhu, G.; Cui, X.; Zhang, Y.; Chen, S.; Dong, M.; Liu, H.; Shao, Q.; Ding, T.; Wu, S.; Guo, Z. Poly (vinyl butyral)/graphene oxide/poly (methylhydrosiloxane) nanocomposite coating for improved aluminum alloy anticorrosion. Polymer 2019, 172, 415–422. [Google Scholar] [CrossRef]
- Liu, J.; Zhang, J.; Tang, J.; Pu, L.; Xue, Y.; Lu, M.; Xu, L.; Guo, Z. Polydimethylsiloxane resin nanocomposite coating with alternating multilayer structure for corrosion protection performance. ES Mater. Manuf. 2020, 10, 29–38. [Google Scholar] [CrossRef]
- Gong, K.; Li, X.; Liu, H.; Cheng, X.; Sun, D.; Shao, Q.; Dong, M.; Liu, C.; Wu, S.; Ding, T.; et al. Residue metals and intrinsic moisture in excess sludge improve pore formation during its carbonization process. Carbon 2020, 156, 320–328. [Google Scholar] [CrossRef]
- Wang, P.; Lu, Z.; Zhang, D. Slippery liquid-infused porous surfaces fabricated on aluminum as a barrier to corrosion induced by sulfate reducing bacteria. Corros. Sci. 2015, 93, 159–166. [Google Scholar] [CrossRef]
- Hoche, H.; Rosenkranz, C.; Delp, A.; Lohrengel, M.; Broszeit, E.; Berger, C. Investigation of the macroscopic and microscopic electrochemical corrosion behaviour of PVD-coated magnesium die cast alloy AZ91. Surf. Coat. Technol. 2005, 193, 178–184. [Google Scholar] [CrossRef]
- Tong, Y.; Bohm, S.; Song, M. Graphene based materials and their composites as coatings. Austin J. Nanomed. Nanotechnol. 2013, 1, 1003–1019. [Google Scholar]
- Sun, W.; Wang, L.; Wu, T.; Wang, M.; Yang, Z.; Pan, Y.; Liu, G. Inhibiting the corrosion-promotion activity of graphene. Chem. Mater. 2015, 27, 2367–2373. [Google Scholar] [CrossRef]
- Zhou, F.; Li, Z.; Shenoy, G.J.; Li, L.; Liu, H. Enhanced room-temperature corrosion of copper in the presence of graphene. ACS Nano 2013, 7, 6939–6947. [Google Scholar] [CrossRef]
- Schriver, M.; Regan, W.; Gannett, W.J.; Zaniewski, A.M.; Crommie, M.F.; Zettl, A. Graphene as a long-term metal oxidation barrier: Worse than nothing. ACS Nano 2013, 7, 5763–5768. [Google Scholar] [CrossRef]
- Kim, H.; Miura, Y.; Macosko, C.W. Graphene/polyurethane nanocomposites for improved gas barrier and electrical conductivity. Chem. Mater. 2010, 22, 3441–3450. [Google Scholar] [CrossRef]
- Kim, H.; Abdala, A.A.; Macosko, C.W. Graphene/polymer nanocomposites. Macromolecules 2010, 43, 6515–6530. [Google Scholar] [CrossRef]
- Kim, H.; Macosko, C.W. Processing-property relationships of polycarbonate/graphene composites. Polymer 2009, 50, 3797–3809. [Google Scholar] [CrossRef]
- Kim, H.; Macosko, C.W. Morphology and properties of polyester/exfoliated graphite nanocomposites. Macromolecules 2008, 41, 3317–3327. [Google Scholar] [CrossRef]
- Potts, J.R.; Dreyer, D.R.; Bielawski, C.W.; Ruoff, R.S. Graphene-based polymer nanocomposites. Polymer 2011, 52, 5–25. [Google Scholar] [CrossRef] [Green Version]
- Kumar, S.S.A.; Bashir, S.; Ramesh, K.; Ramesh, S. New perspectives on Graphene/Graphene oxide based polymer nanocomposites for corrosion applications: The relevance of the Graphene/Polymer barrier coatings. Prog. Org. Coat. 2021, 154, 106215. [Google Scholar] [CrossRef]
- Zhang, Z.; Zhang, J.; Li, S.; Liu, J.; Dong, M.; Li, Y.; Lu, N.; Lei, S.; Tang, J.; Fan, J.; et al. Effect of graphene liquid crystal on dielectric properties of polydimethylsiloxane nanocomposites. Compos. Part B Eng. 2019, 176, 107338. [Google Scholar] [CrossRef]
- Cui, X.; Zhu, G.; Pan, Y.; Shao, Q.; Zhao, C.; Dong, M.; Zhang, Y.; Guo, Z. Polydimethylsiloxane-titania nanocomposite coating: Fabrication and corrosion resistance. Polymer 2018, 138, 203–210. [Google Scholar] [CrossRef]
- Novoselov, K.S.; Jiang, D.; Schedin, F.; Booth, T.J.; Khotkevich, V.V.; Morozov, S.V.; Geim, A.K. Two-dimensional atomic crystals. Proc. Natl. Acad. Sci. USA 2005, 102, 10451–10453. [Google Scholar] [CrossRef] [Green Version]
- Kumar, S.S.A.; Bashir, S.; Ramesh, K.; Ramesh, S. A comprehensive review: Super hydrophobic graphene nanocomposite coatings for underwater and wet applications to enhance corrosion resistance. FlatChem 2022, 31, 100326. [Google Scholar] [CrossRef]
- Kumar, S.S.A.; Bashir, S.; Ramesh, K.; Ramesh, S. Why is graphene an extraordinary material? A review based on a decade of research. Front. Mater. Sci. 2022, 16, 220603. [Google Scholar] [CrossRef]
- Ashok Kumar, S.S.; Bashir, S.; Ramesh, K.; Ramesh, S. A review on graphene and its derivatives as the forerunner of the two-dimensional material family for the future. J. Mater. Sci. 2022, 57, 12236–12278. [Google Scholar] [CrossRef]
- Sharma, S.S.A.; Bashir, S.; Kasi, R.; Subramaniam, R.T. The significance of graphene based composite hydrogels as smart materials: A review on the fabrication, properties, and its applications. FlatChem 2022, 33, 100352. [Google Scholar] [CrossRef]
- Kumar, S.S.A.; Bashir, S.; Pershaanaa, M.; Kamarulazam, F.; Saidi, N.M.; Goh, Z.L.; Ma, I.A.W.; Kunjunee, V.; Jamaluddin, A.; Ramesh, K.; et al. A review on the recent progress of the plant-based porous carbon materials as electrodes for high-performance supercapacitors. J. Mater. Sci. 2023, 58, 6516–6555. [Google Scholar] [CrossRef]
- Lin, L.-Y.; Kim, D.-E.; Kim, W.-K.; Jun, S.-C. Friction and wear characteristics of multi-layer graphene films investigated by atomic force microscopy. Surf. Coat. Technol. 2011, 205, 4864–4869. [Google Scholar] [CrossRef]
- Sun, W.; Wang, L.; Yang, Z.; Zhu, T.; Wu, T.; Dong, C.; Liu, G. A facile method for the modification of graphene nanosheets as promising anticorrosion pigments. Mater. Lett. 2018, 228, 152–156. [Google Scholar] [CrossRef]
- Yu, Z.; Di, H.; Ma, Y.; He, Y.; Liang, L.; Lv, L.; Ran, X.; Pan, Y.; Luo, Z. Preparation of graphene oxide modified by titanium dioxide to enhance the anti-corrosion performance of epoxy coatings. Surf. Coat. Technol. 2015, 276, 471–478. [Google Scholar] [CrossRef]
- Guan, L.-Z.; Wan, Y.-J.; Gong, L.-X.; Yan, D.; Tang, L.-C.; Wu, L.-B.; Jiang, J.-X.; Lai, G.-Q. Toward effective and tunable interphases in graphene oxide/epoxy composites by grafting different chain lengths of polyetheramine onto graphene oxide. J. Mater. Chem. A 2014, 2, 15058–15069. [Google Scholar] [CrossRef]
- Cao, L.; Liu, X.; Na, H.; Wu, Y.; Zheng, W.; Zhu, J. How a bio-based epoxy monomer enhanced the properties of diglycidyl ether of bisphenol A (DGEBA)/graphene composites. J. Mater. Chem. A 2013, 1, 5081–5088. [Google Scholar] [CrossRef]
- Shen, X.-J.; Pei, X.-Q.; Fu, S.-Y.; Friedrich, K. Significantly modified tribological performance of epoxy nanocomposites at very low graphene oxide content. Polymer 2013, 54, 1234–1242. [Google Scholar] [CrossRef]
- Wan, Y.-J.; Gong, L.-X.; Tang, L.-C.; Wu, L.-B.; Jiang, J.-X. Mechanical properties of epoxy composites filled with silane-functionalized graphene oxide. Compos. Part Appl. Sci. Manuf. 2014, 64, 79–89. [Google Scholar] [CrossRef]
- Jamkhande, P.G.; Ghule, N.W.; Bamer, A.H.; Kalaskar, M.G. Metal nanoparticles synthesis: An overview on methods of preparation, advantages and disadvantages, and applications. J. Drug. Deliv. Sci. Technol. 2019, 53, 101174. [Google Scholar] [CrossRef]
- Fankhänel, J.; Arash, B.; Rolfes, R. Elastic interphase properties of nanoparticle/epoxy nanocomposites: A molecular dynamics study. Compos. Part B Eng. 2019, 176, 107211. [Google Scholar] [CrossRef]
- Liu, J.; Yu, Q.; Yu, M.; Li, S.; Zhao, K.; Xue, B.; Zu, H. Silane modification of titanium dioxide-decorated graphene oxide nanocomposite for enhancing anticorrosion performance of epoxy coatings on AA-2024. J. Alloys Compd. 2018, 744, 728–739. [Google Scholar] [CrossRef]
- Das, M.R.; Sarma, R.K.; Borah, S.C.; Kumari, R.; Saikia, R.; Deshmukh, A.B.; Shelke, M.V.; Sengupta, P.; Szunerits, S.; Boukherroub, R. The synthesis of citrate-modified silver nanoparticles in an aqueous suspension of graphene oxide nanosheets and their antibacterial activity. Colloids Surf. B Biointerfaces 2013, 105, 128–136. [Google Scholar] [CrossRef] [PubMed]
- Yu, Z.; Di, H.; Ma, Y.; Lv, L.; Pan, Y.; Zhang, C.; He, Y. Fabrication of graphene oxide–alumina hybrids to reinforce the anti-corrosion performance of composite epoxy coatings. Appl. Surf. Sci. 2015, 351, 986–996. [Google Scholar] [CrossRef]
- Di, H.; Yu, Z.; Ma, Y.; Li, F.; Lv, L.; Pan, Y.; Lin, Y.; Liu, Y.; He, Y. Graphene oxide decorated with Fe3O4 nanoparticles with advanced anticorrosive properties of epoxy coatings. J. Taiwan Inst. Chem. Eng. 2016, 64, 244–251. [Google Scholar] [CrossRef]
- Yan, S.; Song, G.-L.; Li, Z.; Wang, H.; Zheng, D.; Cao, F.; Horynova, M.; Dargusch, M.S.; Zhou, L. A state-of-the-art review on passivation and biofouling of Ti and its alloys in marine environments. J. Mater. Sci. Technol. 2018, 34, 421–435. [Google Scholar] [CrossRef]
- Martins, P.M.; Ferreira, C.; Silva, A.; Magalhães, B.; Alves, M.M.; Pereira, L.; Marques, P.A.A.P.; Melle-Franco, M.; Lanceros-Méndez, S. TiO2/graphene and TiO2/graphene oxide nanocomposites for photocatalytic applications: A computer modeling and experimental study. Compos. Part B Eng. 2018, 145, 39–46. [Google Scholar] [CrossRef] [Green Version]
- Zhang, Q.; Bao, N.; Wang, X.; Hu, X.; Miao, X.; Chaker, M.; Ma, D. Advanced fabrication of chemically bonded graphene/TiO2 continuous fibers with enhanced broadband photocatalytic properties and involved mechanisms exploration. Sci. Rep. 2016, 6, 1–15. [Google Scholar] [CrossRef] [Green Version]
- Du, A.; Ng, Y.H.; Bell, N.J.; Zhu, Z.; Amal, R.; Smith, S.C. Hybrid graphene/titania nanocomposite: Interface charge transfer, hole doping, and sensitization for visible light response. J. Phys. Chem. Lett. 2011, 2, 894–899. [Google Scholar] [CrossRef]
- Ferrighi, L.; Fazio, G.; Valentin, C.D. Charge Carriers Separation at the Graphene/(101) Anatase TiO 2 Interface. Adv. Mater. Interfaces 2016, 3, 1500624. [Google Scholar] [CrossRef]
- Li, X.; Gao, H.; Liu, G. A LDA+ U study of the hybrid graphene/anatase TiO2 nanocomposites: Interfacial properties and visible light response. Comput. Theor. Chem. 2013, 1025, 30–34. [Google Scholar] [CrossRef]
- Ahmad, M.M.; Mushtaq, S.; Al Qahtani, H.S.; Sedky, A.; Alam, M.W. Investigation of TiO2 Nanoparticles Synthesized by Sol-Gel Method for Effectual Photodegradation, Oxidation and Reduction Reaction. Crystals 2021, 11, 1456. [Google Scholar] [CrossRef]
- Irfan, M.F.; Qurashi, A.; Alam, M.W. Metal oxide nanostructures and nanocomposites for selective catalytic reduction of NOx: A review. Arab. J. Sci. Eng. 2010, 35, 79–92. [Google Scholar]
- Alam, M.W.; Al Qahtani, H.S.; Souayeh, B.; Ahmed, W.; Albalawi, H.; Farhan, M.; Abuzir, A.; Naeem, S. Novel copper-zinc-manganese ternary metal oxide nanocomposite as heterogeneous catalyst for glucose sensor and antibacterial activity. Antioxidants 2022, 11, 1064. [Google Scholar] [CrossRef]
- Yuan, H.; Qi, F.; Zhao, N.; Wan, P.; Zhang, B.; Xiong, H.; Liao, B.; Ouyang, X. Graphene oxide decorated with titanium nanoparticles to reinforce the anti-corrosion performance of epoxy coating. Coatings 2020, 10, 129. [Google Scholar] [CrossRef] [Green Version]
- Ramesh, K.; Nor, N.; Ramesh, S.; Vengadaesvaran, B.; Arof, A. Studies on electrochemical properties and FTIR analysis of epoxy polyester hybrid coating system. Int. J. Electrochem. Sci. 2013, 8, 8422–8432. [Google Scholar]
- Castela, A.S.L.; Simões, A.M.; Ferreira, M.G.S. E.I.S. evaluation of attached and free polymer films. Prog. Org. Coat. 2000, 38, 1–7. [Google Scholar] [CrossRef]
- Wu, X.H.; Then, Y.Y. Fabrication and Characterization of Superhydrophobic Graphene/Titanium Dioxide Nanoparticles Composite. Polymers 2022, 14, 122. [Google Scholar] [CrossRef]
- Gao, Z.; Zhai, X.; Liu, F.; Zhang, M.; Zang, D.; Wang, C. Fabrication of TiO2/EP super-hydrophobic thin film on filter paper surface. Carbohydr. Polym. 2015, 128, 24–31. [Google Scholar] [CrossRef]
- Ba-Abbad, M.M.; Kadhum, A.A.H.; Mohamad, A.B.; Takriff, M.S.; Sopian, K. Synthesis and catalytic activity of TiO2 nanoparticles for photochemical oxidation of concentrated chlorophenols under direct solar radiation. Int. J. Electrochem. Sci. 2012, 7, 4871–4888. [Google Scholar]
- Duo, S.; Li, M.; Zhu, M.; Zhou, Y. Polydimethylsiloxane/silica hybrid coatings protecting Kapton from atomic oxygen attack. Mater. Chem. Phys. 2008, 112, 1093–1098. [Google Scholar] [CrossRef]
- Kumar, S.A.; Narayanan, T.S. Thermal properties of siliconized epoxy interpenetrating coatings. Prog. Org. Coat. 2002, 45, 323–330. [Google Scholar] [CrossRef]
- Ma, X.-Y.; Zhang, W.-D. Effects of flower-like ZnO nanowhiskers on the mechanical, thermal and antibacterial properties of waterborne polyurethane. Polym. Degrad. Stab. 2009, 94, 1103–1109. [Google Scholar] [CrossRef]
- Tomić, M.D.; Dunjić, B.; Likić, V.; Bajat, J.; Rogan, J.; Djonlagić, J. The use of nanoclay in preparation of epoxy anticorrosive coatings. Prog. Org. Coat. 2014, 77, 518–527. [Google Scholar] [CrossRef]
- Zeranska-Chudek, K.; Lapinska, A.; Wroblewska, A.; Judek, J.; Duzynska, A.; Pawlowski, M.; Witowski, A.M.; Zdrojek, M. Study of the absorption coefficient of graphene-polymer composites. Sci. Rep. 2018, 8, 9132. [Google Scholar] [CrossRef]
- Jalaukhan, A.H. Optical investigation of TiO2/graphene oxide thinfilm prepared by spin coating technique. IOP Conf. Ser. Mater. Sci. Eng. 2020, 871, 012087. [Google Scholar] [CrossRef]
- Zabihi, F.; Ahmadian-Yazdi, M.-R.; Eslamian, M. Photocatalytic graphene-TiO2 thin films fabricated by low-temperature ultrasonic vibration-assisted spin and spray coating in a sol-gel process. Catalysts 2017, 7, 136. [Google Scholar] [CrossRef] [Green Version]
- Huang, H.-C.; Hsieh, T.-E. Preparation and characterizations of highly transparent UV-curable ZnO-acrylic nanocomposites. Ceram. Int. 2010, 36, 1245–1251. [Google Scholar] [CrossRef]
- Wang, Q.; Sheng, B.; Wu, H.; Huang, Y.; Zhang, D.; Zhuang, S. Composite films of polydimethylsiloxane and micro-graphite with tunable optical transmittance. Appl. Sci. 2019, 9, 2402. [Google Scholar] [CrossRef] [Green Version]
- Kumar, S.S.A.; Ma, I.W.; Ramesh, K.; Ramesh, S. Development of graphene incorporated acrylic-epoxy composite hybrid anti-corrosion coatings for corrosion protection. Mater. Chem. Phys. 2023, 303, 127731. [Google Scholar]
- Nine, M.J.; Cole, M.A.; Johnson, L.; Tran, D.N.; Losic, D. Robust superhydrophobic graphene-based composite coatings with self-cleaning and corrosion barrier properties. ACS Appl. Mater. Interfaces 2015, 7, 28482–28493. [Google Scholar] [CrossRef] [PubMed]
- Chen, L.; Song, R.; Li, X.; Guo, Y.; Wang, C.; Jiang, Y. The improvement of corrosion resistance of fluoropolymer coatings by SiO2/poly (styrene-co-butyl acrylate) nanocomposite particles. Appl. Surf. Sci. 2015, 353, 254–262. [Google Scholar] [CrossRef]
- Zhou, C.; Lu, X.; Xin, Z.; Liu, J.; Zhang, Y. Polybenzoxazine/SiO2 nanocomposite coatings for corrosion protection of mild steel. Corros. Sci. 2014, 80, 269–275. [Google Scholar] [CrossRef]


| Sample Code | Acrylic Resin (wt.%) | Epoxy Resin (wt.%) | Graphene Nanoparticles (wt.%) | Nanoparticles (wt.%) | PDMS (wt.%) | Dry Coating Film Thickness, µm (Avg.) |
|---|---|---|---|---|---|---|
| 1G+0.5 | 90 | 10 | 1 | 0.5 | 1 | 80 |
| 1G+1 | 90 | 10 | 1 | 1 | 1 | 88 |
| 1G+2 | 90 | 10 | 1 | 2 | 1 | 99 |
| 1G+3 | 90 | 10 | 1 | 3 | 1 | 124 |
| Coating System | Initial Degradation Temperature, IDT (°C) | Residue Yield (%) at 700 °C | |
|---|---|---|---|
| 90A:10E | 293.23 | 399.82 | 0.041 |
| 1G | 280.41 | 388.81 | 2.177 |
| 1G+0.5TiO2 | 282.76 | 405.16 | 3.064 |
| 1G+1.0TiO2 | 280.43 | 406.71 | 2.748 |
| 1G+2.0TiO2 | 290.31 | 402.84 | 3.345 |
| 1G+3.0TiO2 | 288.57 | 403.62 | 3.942 |
| Coating System | ||||
|---|---|---|---|---|
| 1st Day | 30th Day | 60th Day | 90th Day | |
| 1G+0.5TiO2 | 1.03 × | 1.11 × | 9.10 × | 1.20 × |
| 1G+1TiO2 | 1.44 × | 1.56 × | 1.80 × | 2.13 × |
| 1G+2TiO2 | 1.12 × | 1.18 × | 1.52 × | 1.69 × |
| 1G+3TiO2 | 1.11 × | 1.16 × | 1.33 × | 1.40 × |
Disclaimer/Publisher’s Note: The statements, opinions and data contained in all publications are solely those of the individual author(s) and contributor(s) and not of MDPI and/or the editor(s). MDPI and/or the editor(s) disclaim responsibility for any injury to people or property resulting from any ideas, methods, instructions or products referred to in the content. |
© 2023 by the authors. Licensee MDPI, Basel, Switzerland. This article is an open access article distributed under the terms and conditions of the Creative Commons Attribution (CC BY) license (https://creativecommons.org/licenses/by/4.0/).
Share and Cite
Kumar, S.S.A.; Mohammed, N.B.; Alduhaish, O.; Ramesh, K.; Ramesh, S.; Khan, M.; Shaik, B.; Adil, S.F.
Anticorrosion, Thermal Degradation, and Hydrophobic Performances of Graphene/
Kumar SSA, Mohammed NB, Alduhaish O, Ramesh K, Ramesh S, Khan M, Shaik B, Adil SF.
Anticorrosion, Thermal Degradation, and Hydrophobic Performances of Graphene/
Kumar, Sachin Sharma Ashok, Nujud Badawi Mohammed, Osamah Alduhaish, Kasi Ramesh, Subramaniam Ramesh, Mujeeb Khan, Baji Shaik, and Syed. F. Adil.
2023. "Anticorrosion, Thermal Degradation, and Hydrophobic Performances of Graphene/