
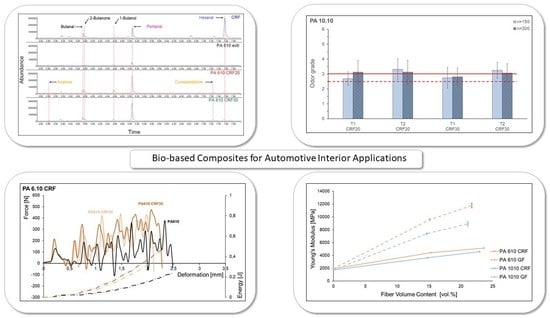
Emission and Mechanical Properties of Glass and Cellulose Fiber Reinforced Bio-Polyamide Composites


Abstract
:
1. Introduction
2. Materials and Methods
2.1. Origin and Characteristics of Materials
2.1.1. Polymer Matrix
2.1.2. Glass Fiber
2.1.3. Regenerated Cellulose Fiber
2.2. Preparation of Test Specimens
2.2.1. Drying Processes before Processing and Humidity Control
2.2.2. Storage and Packaging of the Composites and Test Specimens
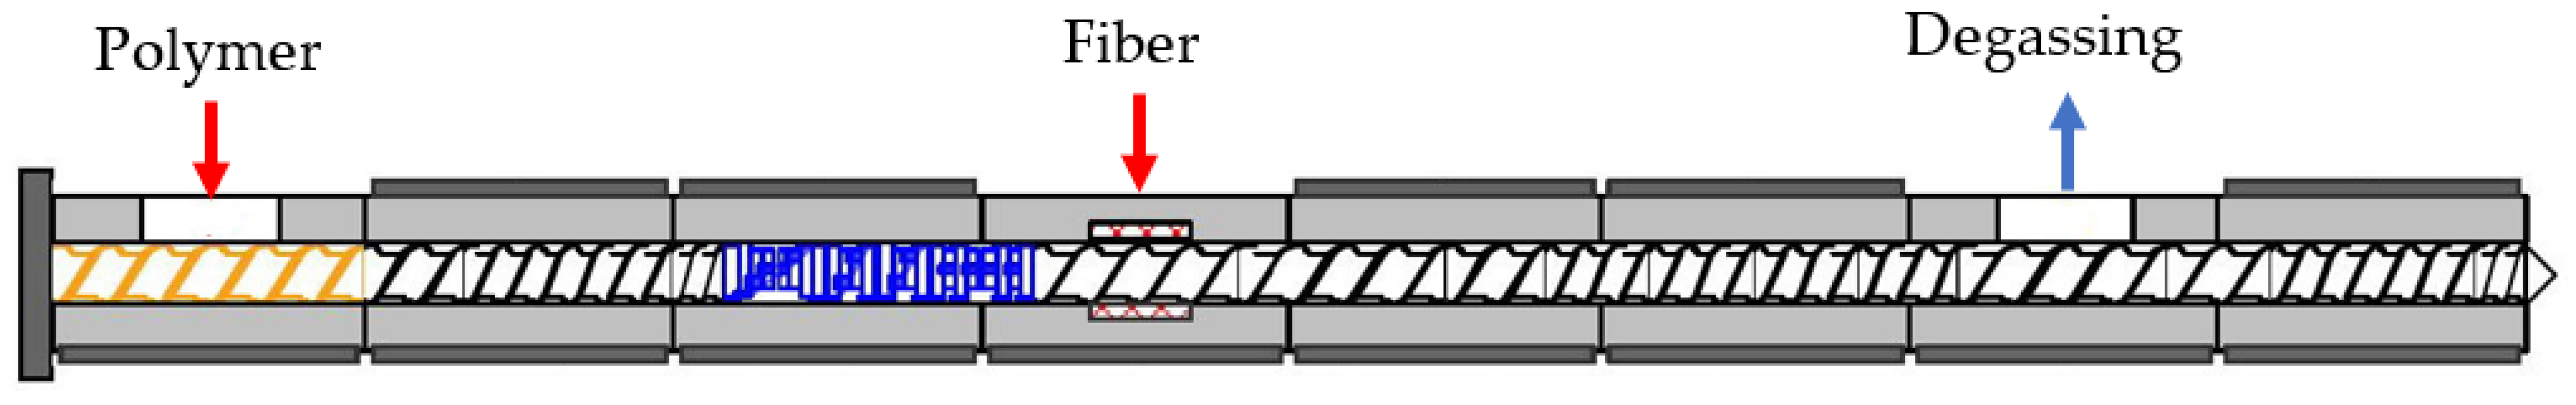
2.2.3. Compounding
2.2.4. Injection Molding
2.3. Characterization Techniques
2.3.1. Tensile Tests According to DIN EN ISO 527
2.3.2. Instrumented Impact Strength Test According to DIN EN ISO 179-2
2.3.3. Water Determination According to DIN EN ISO 15512
2.3.4. GC-MS Analysis
2.3.5. Sensory Evaluation According VDA 270
2.3.6. Sensory Evaluation According to EN 13725
3. Results and Discussion
3.1. Mechanical Properties
3.2. Moisture—Water Content of Specimens
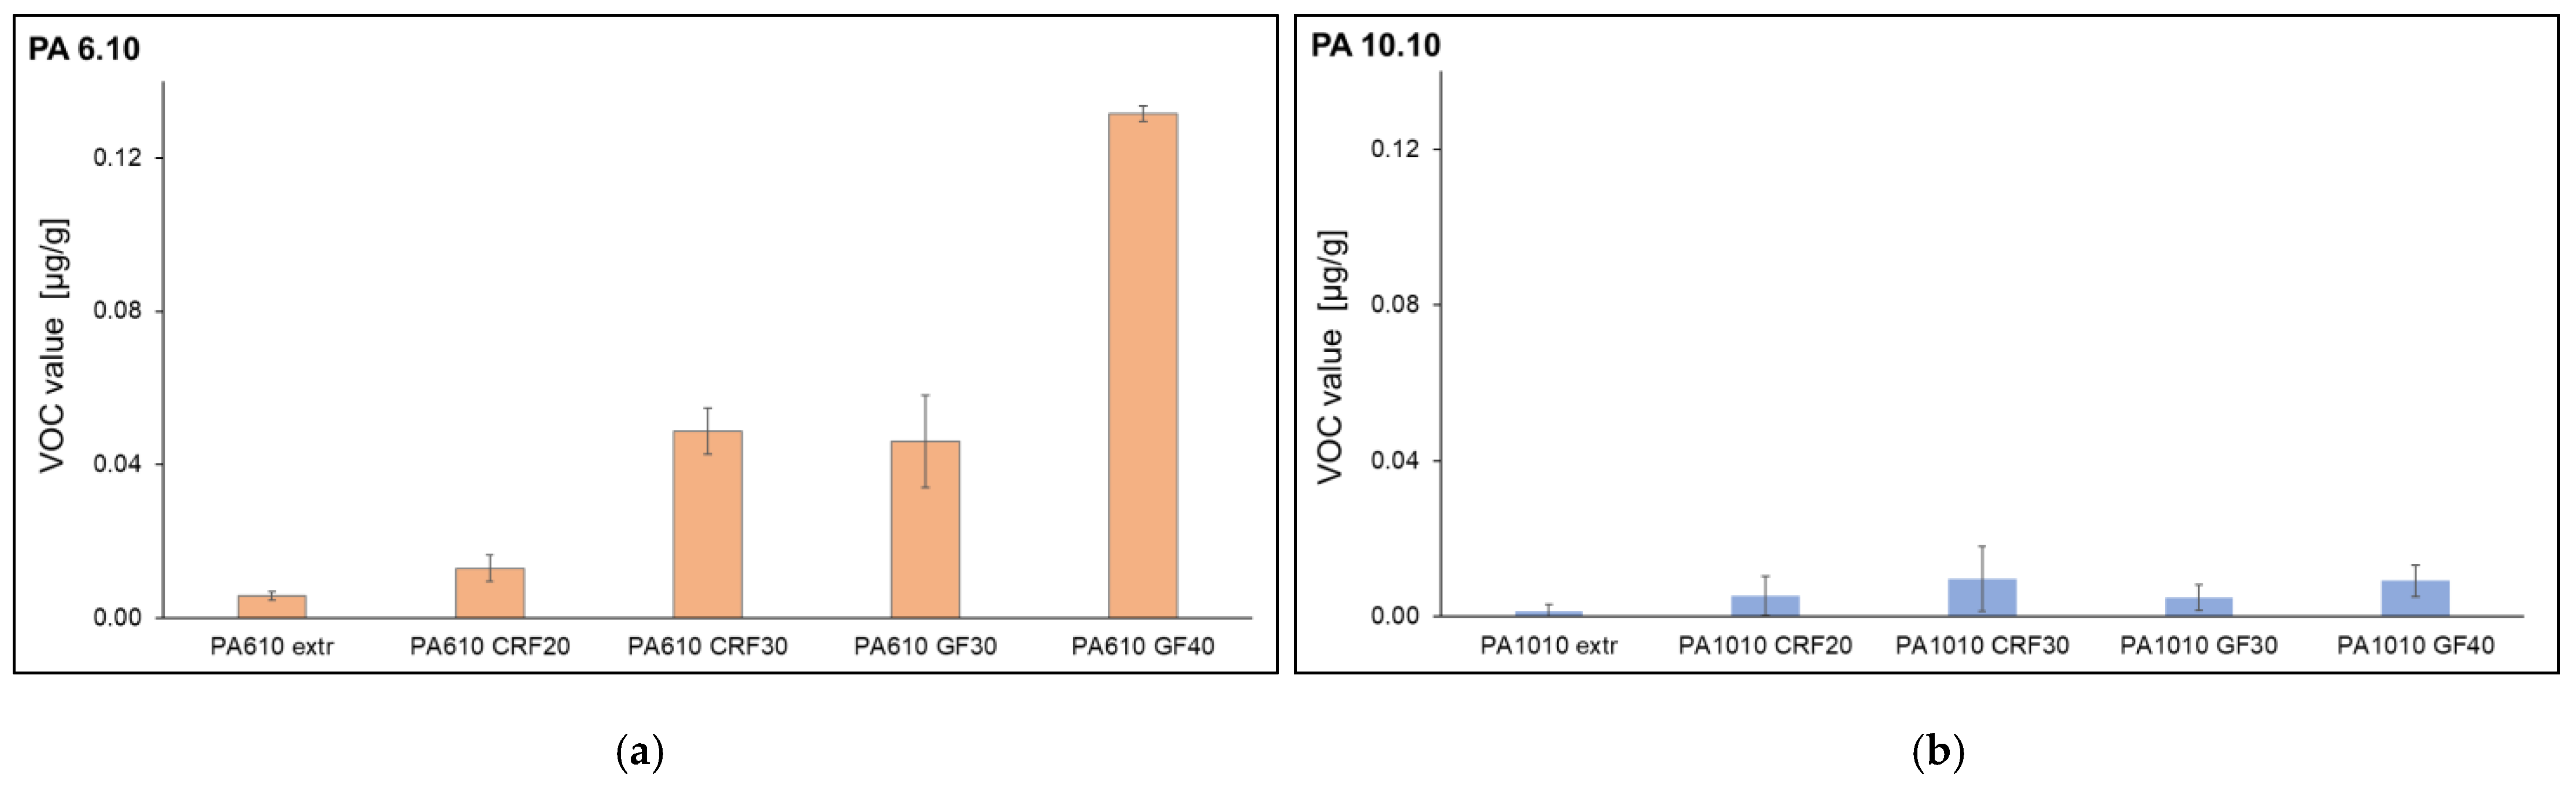
3.3. VOC Emission of Materials and Composites
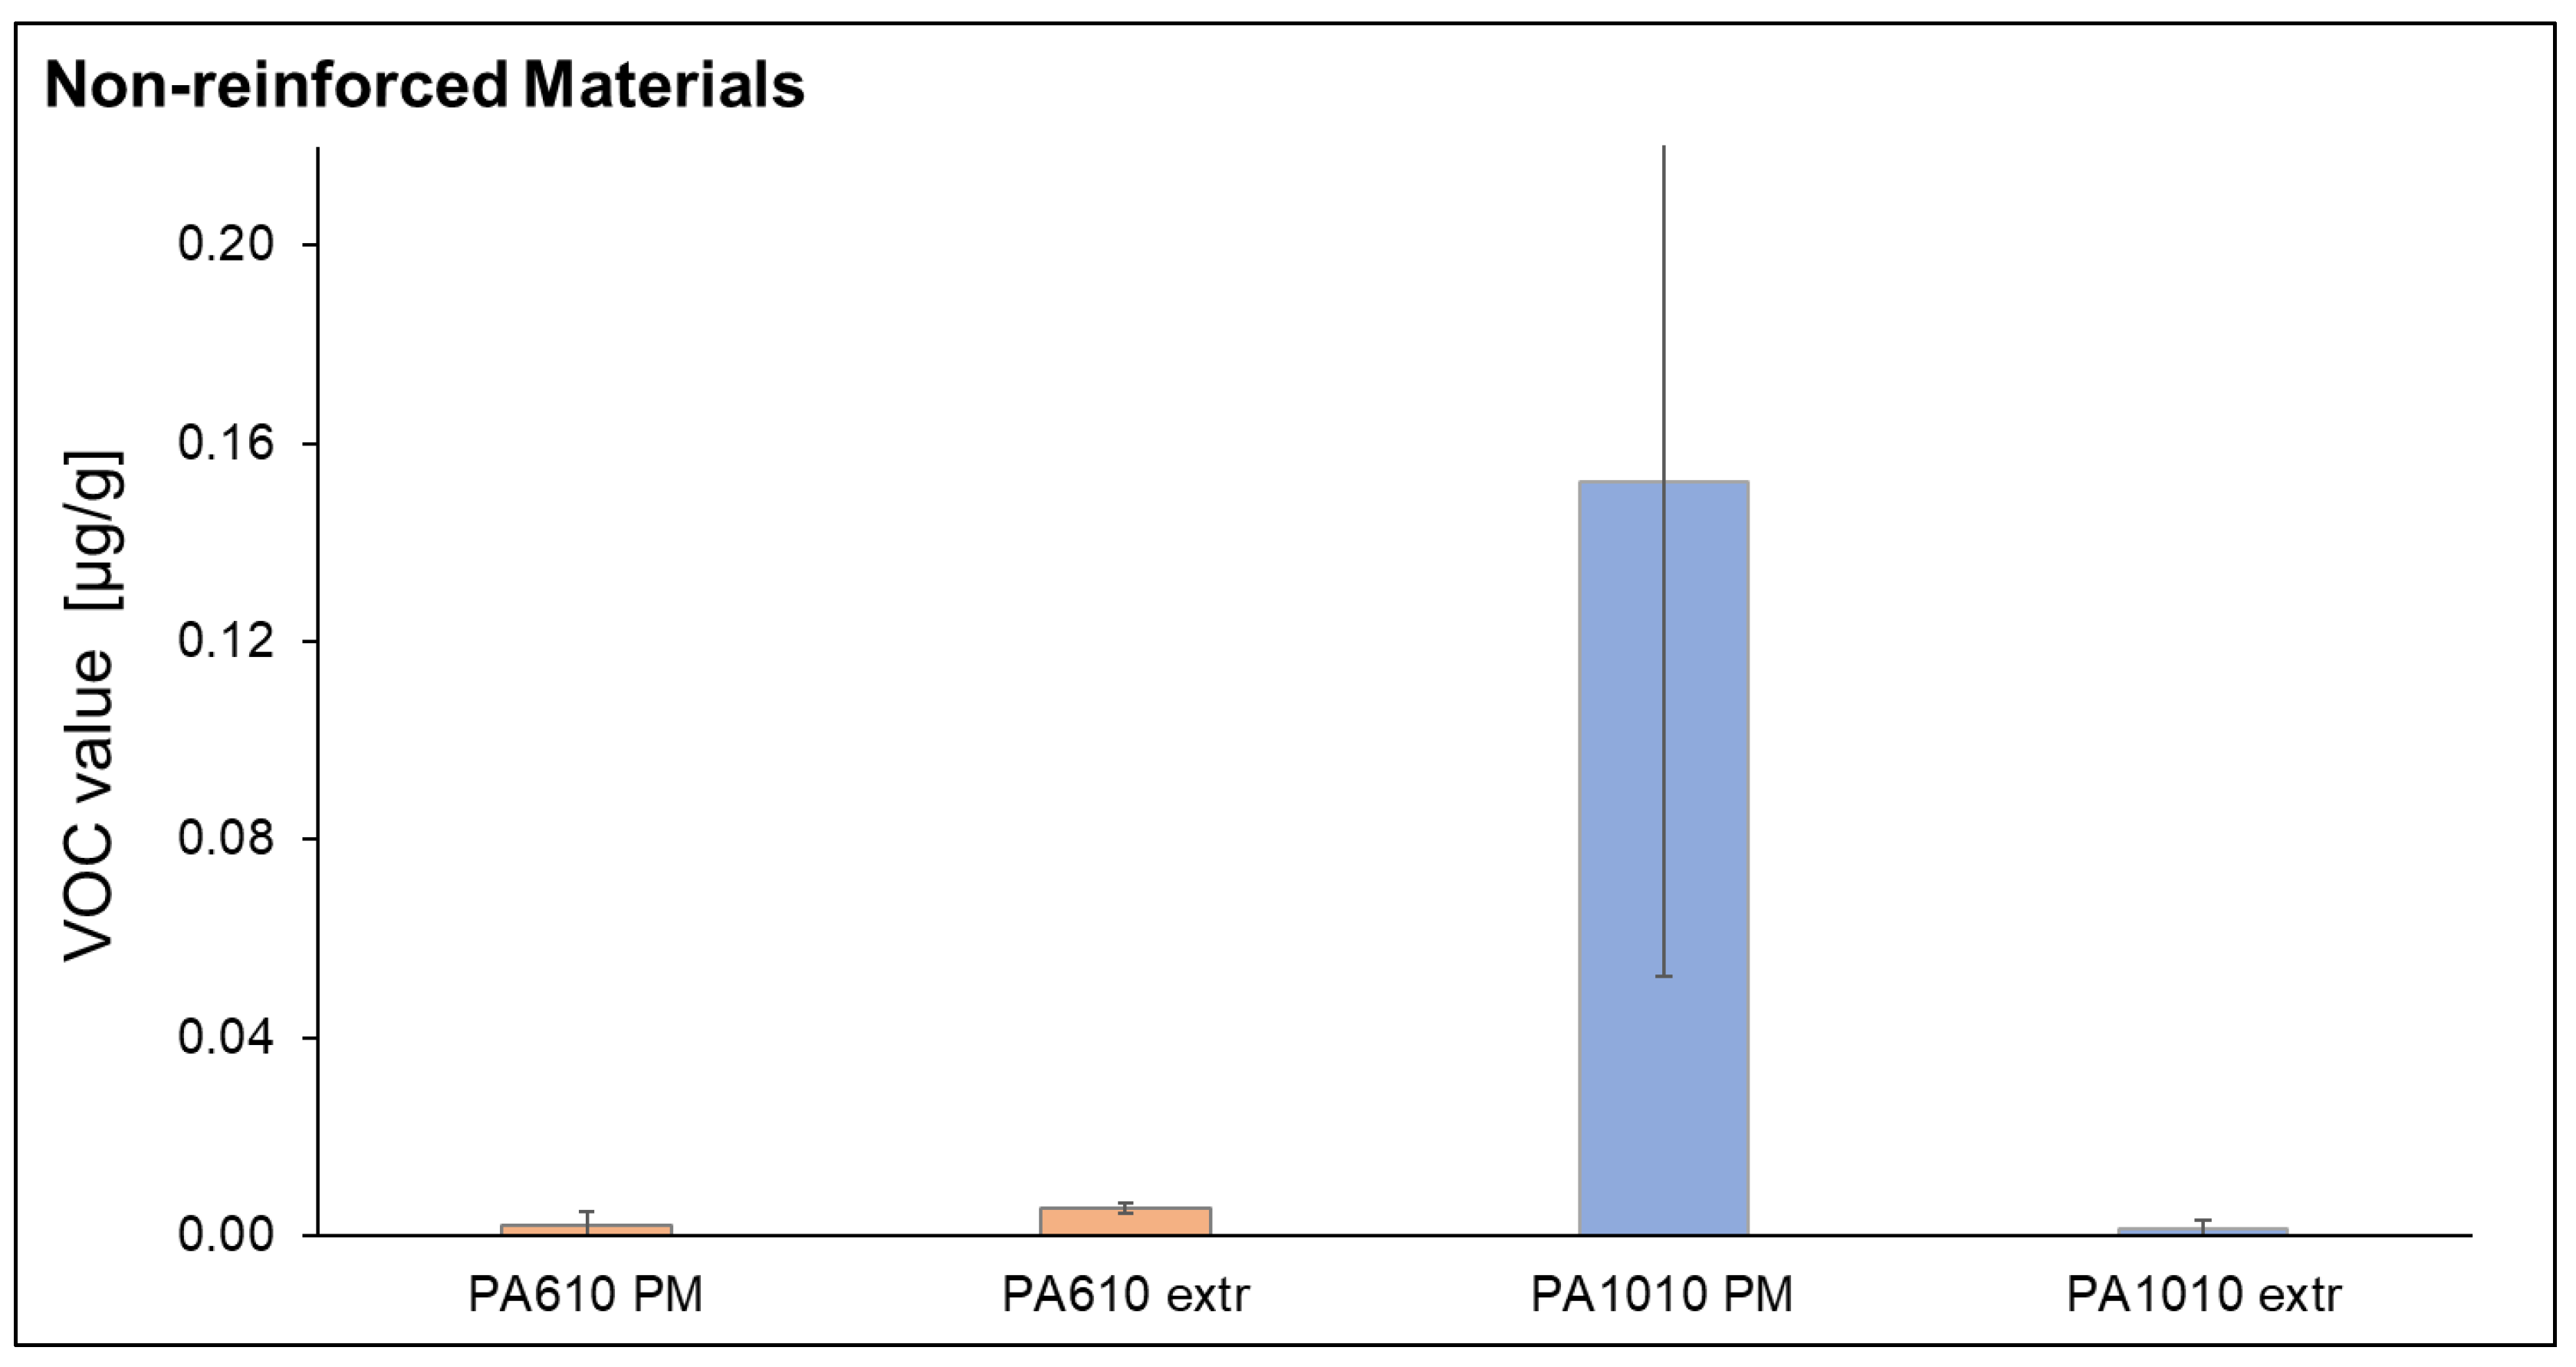
3.3.1. Quantitative Evaluation of the VOC Emission Values
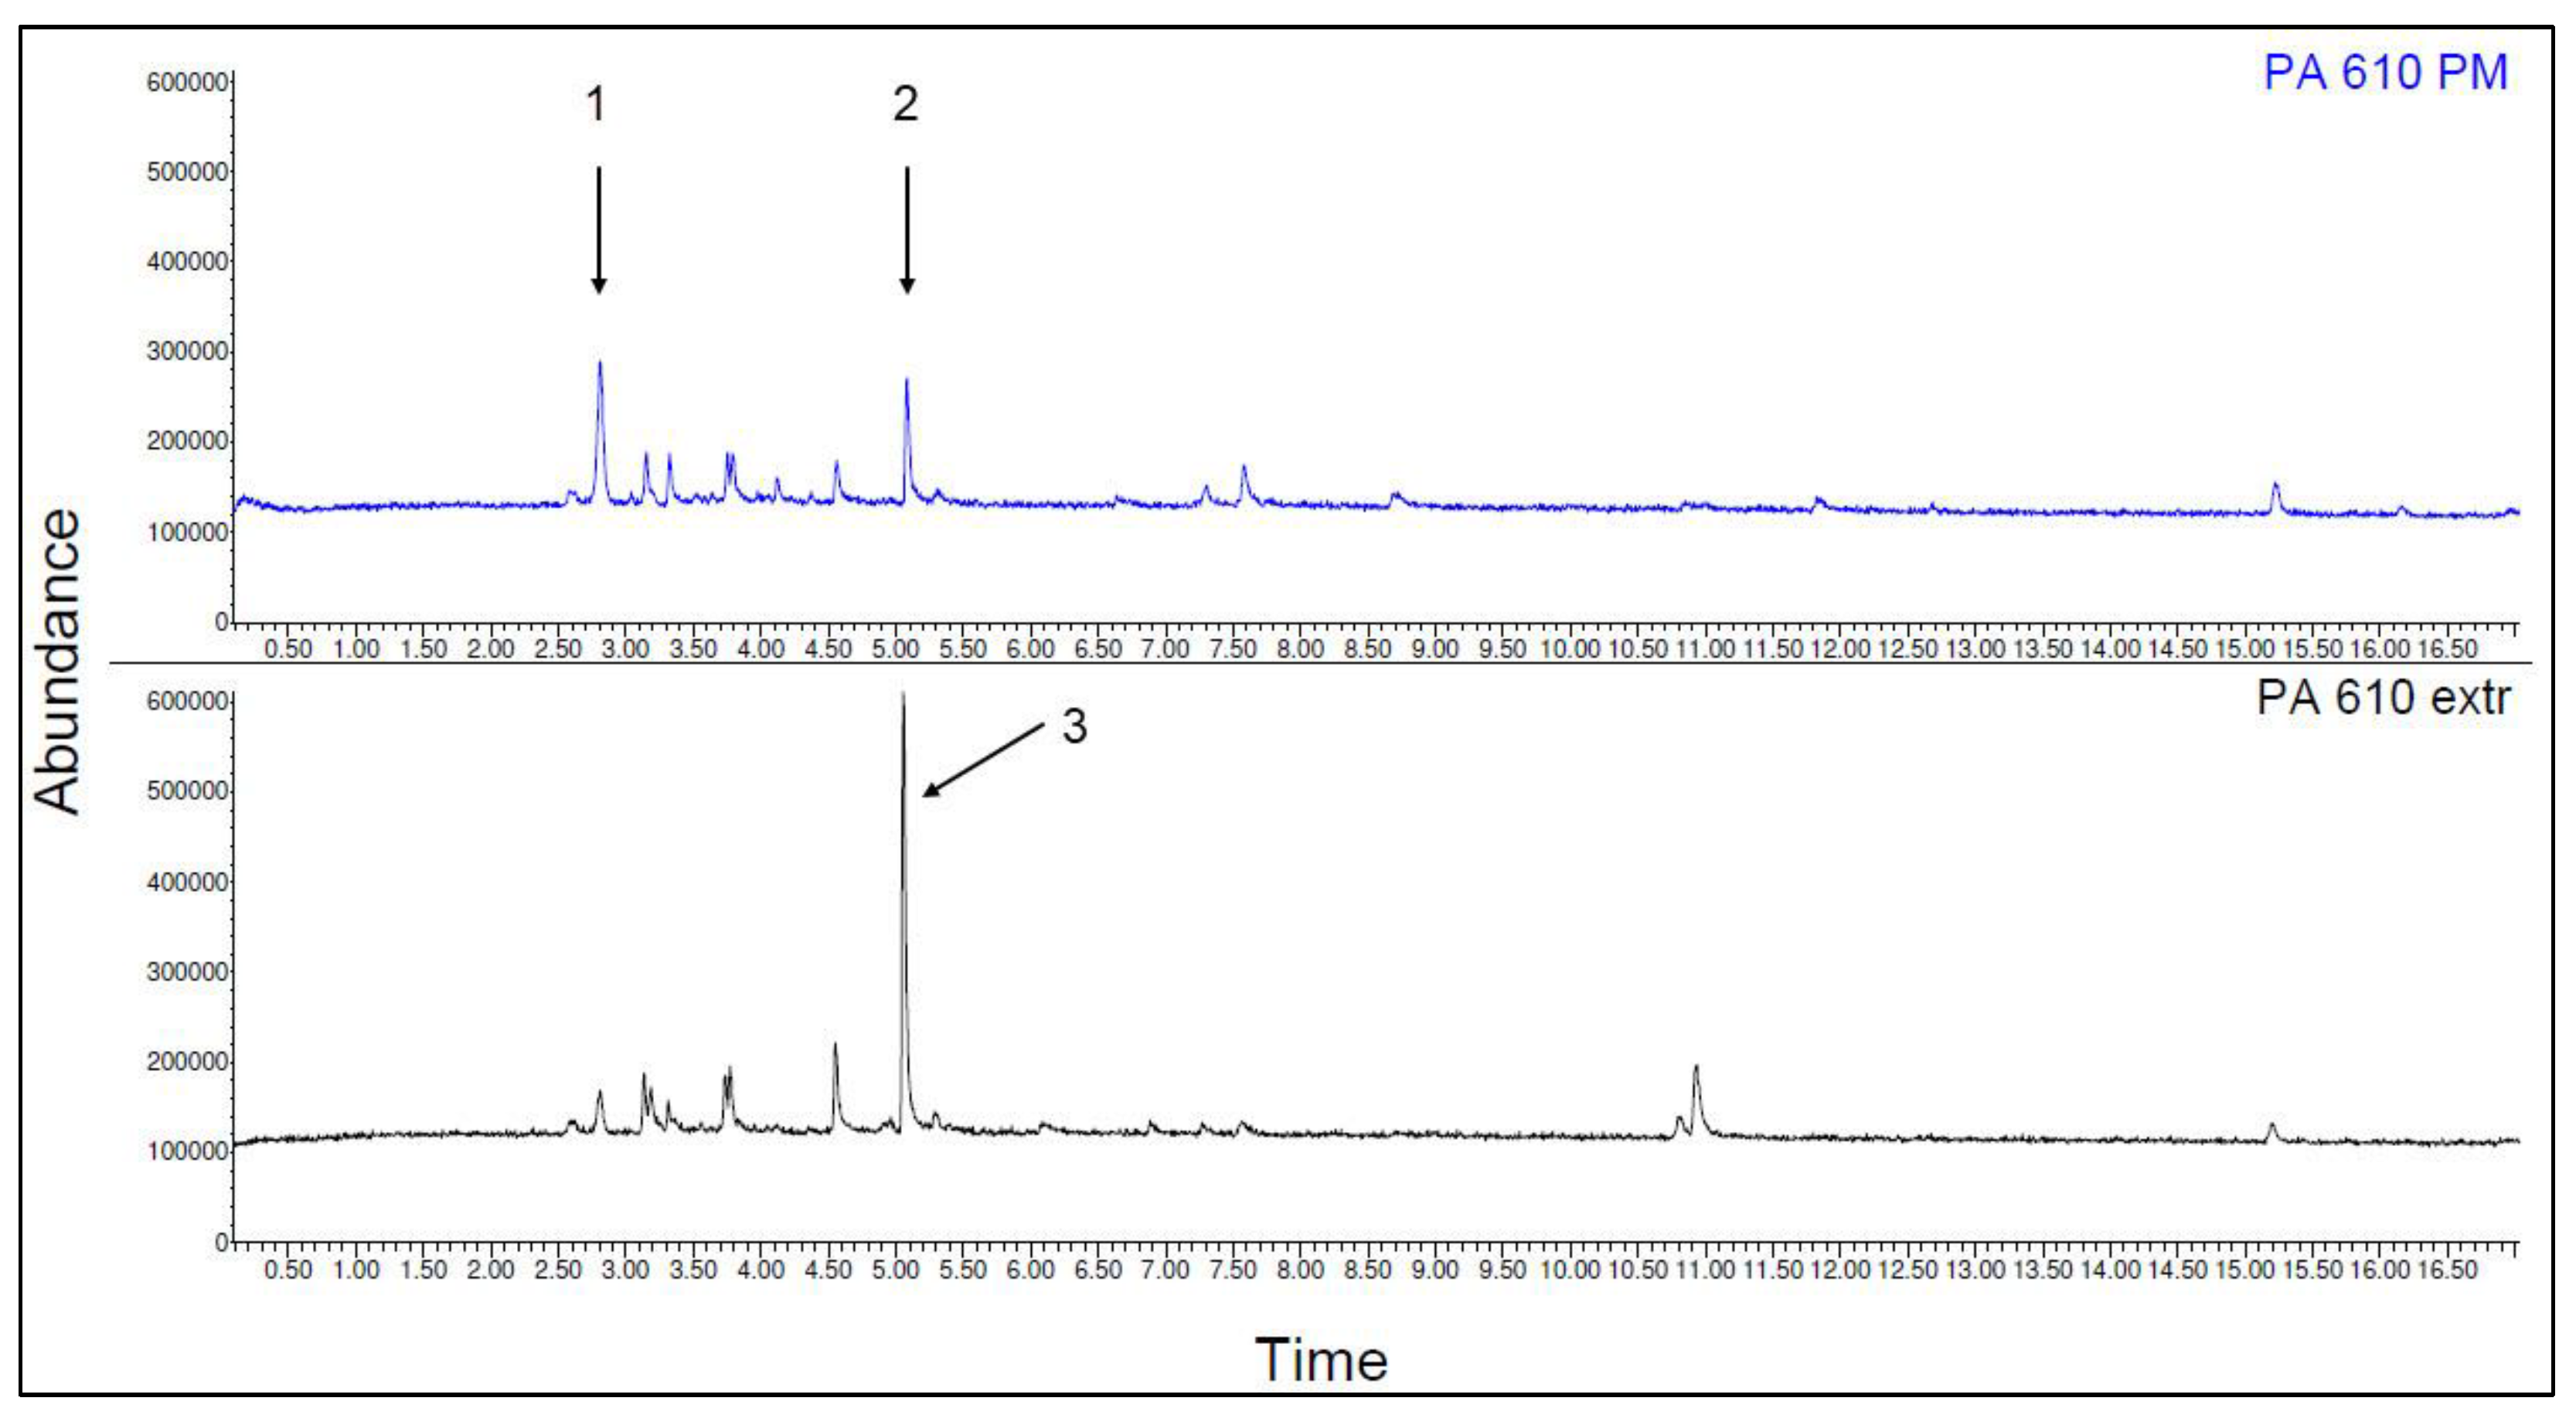
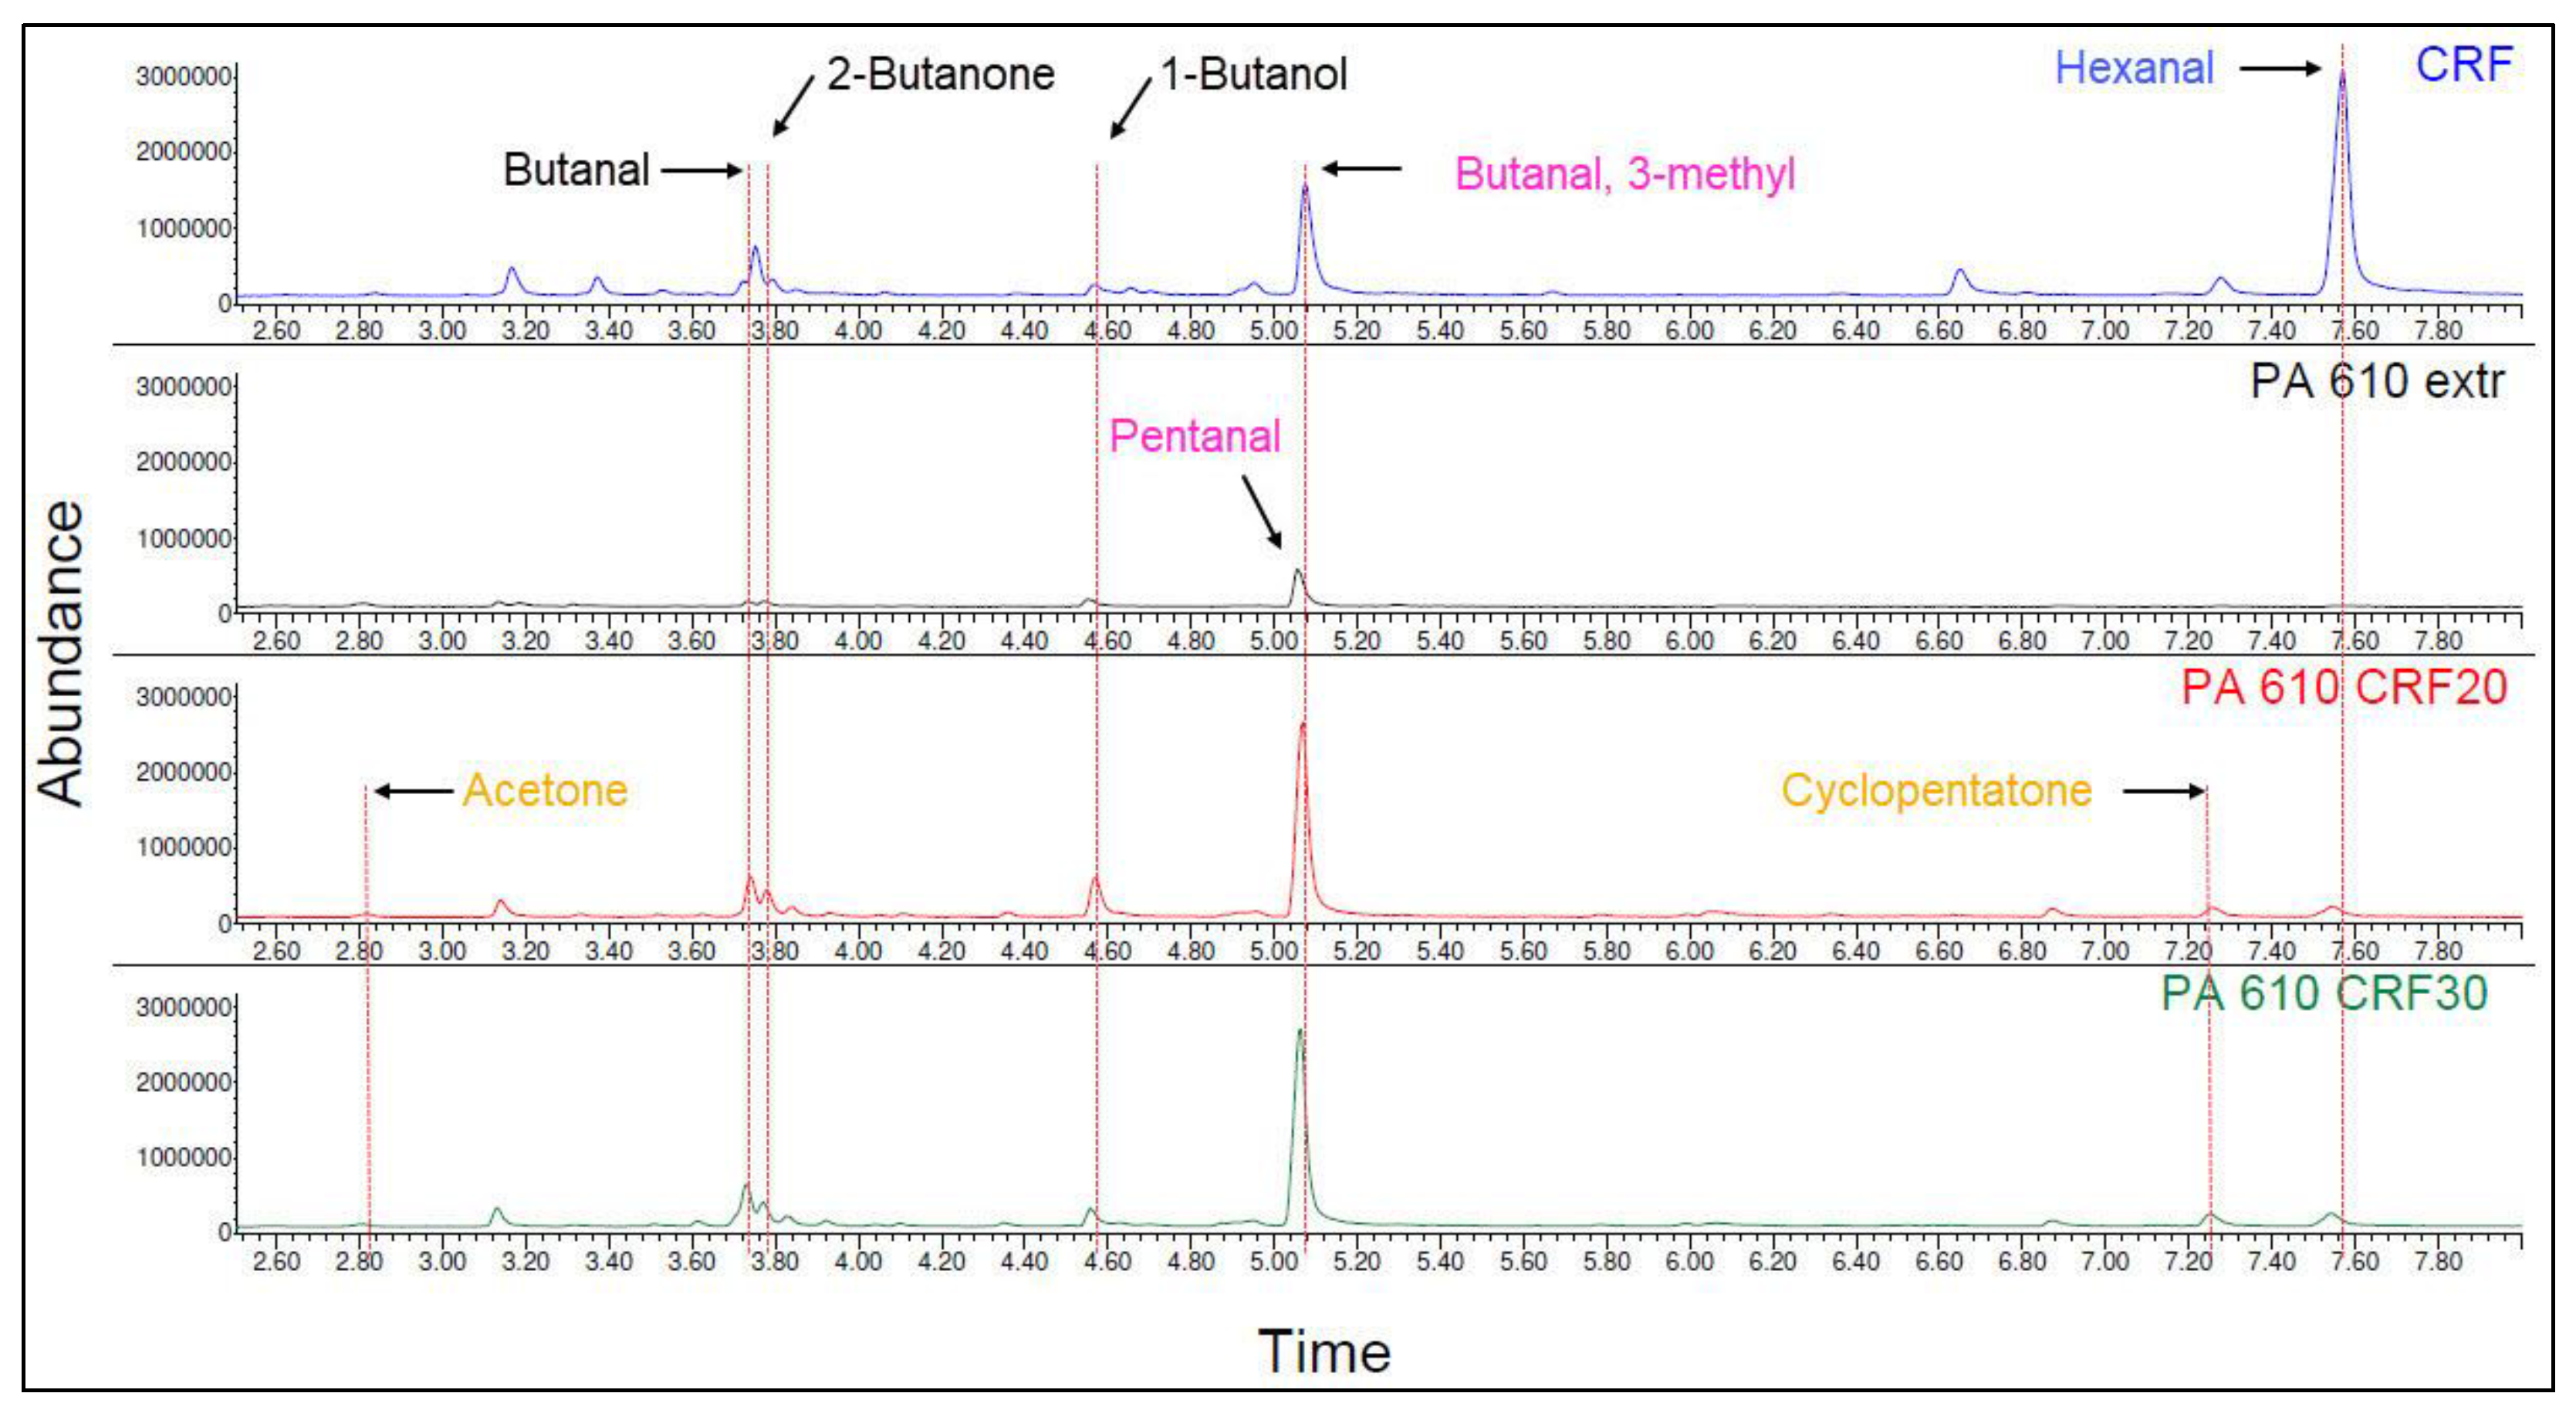
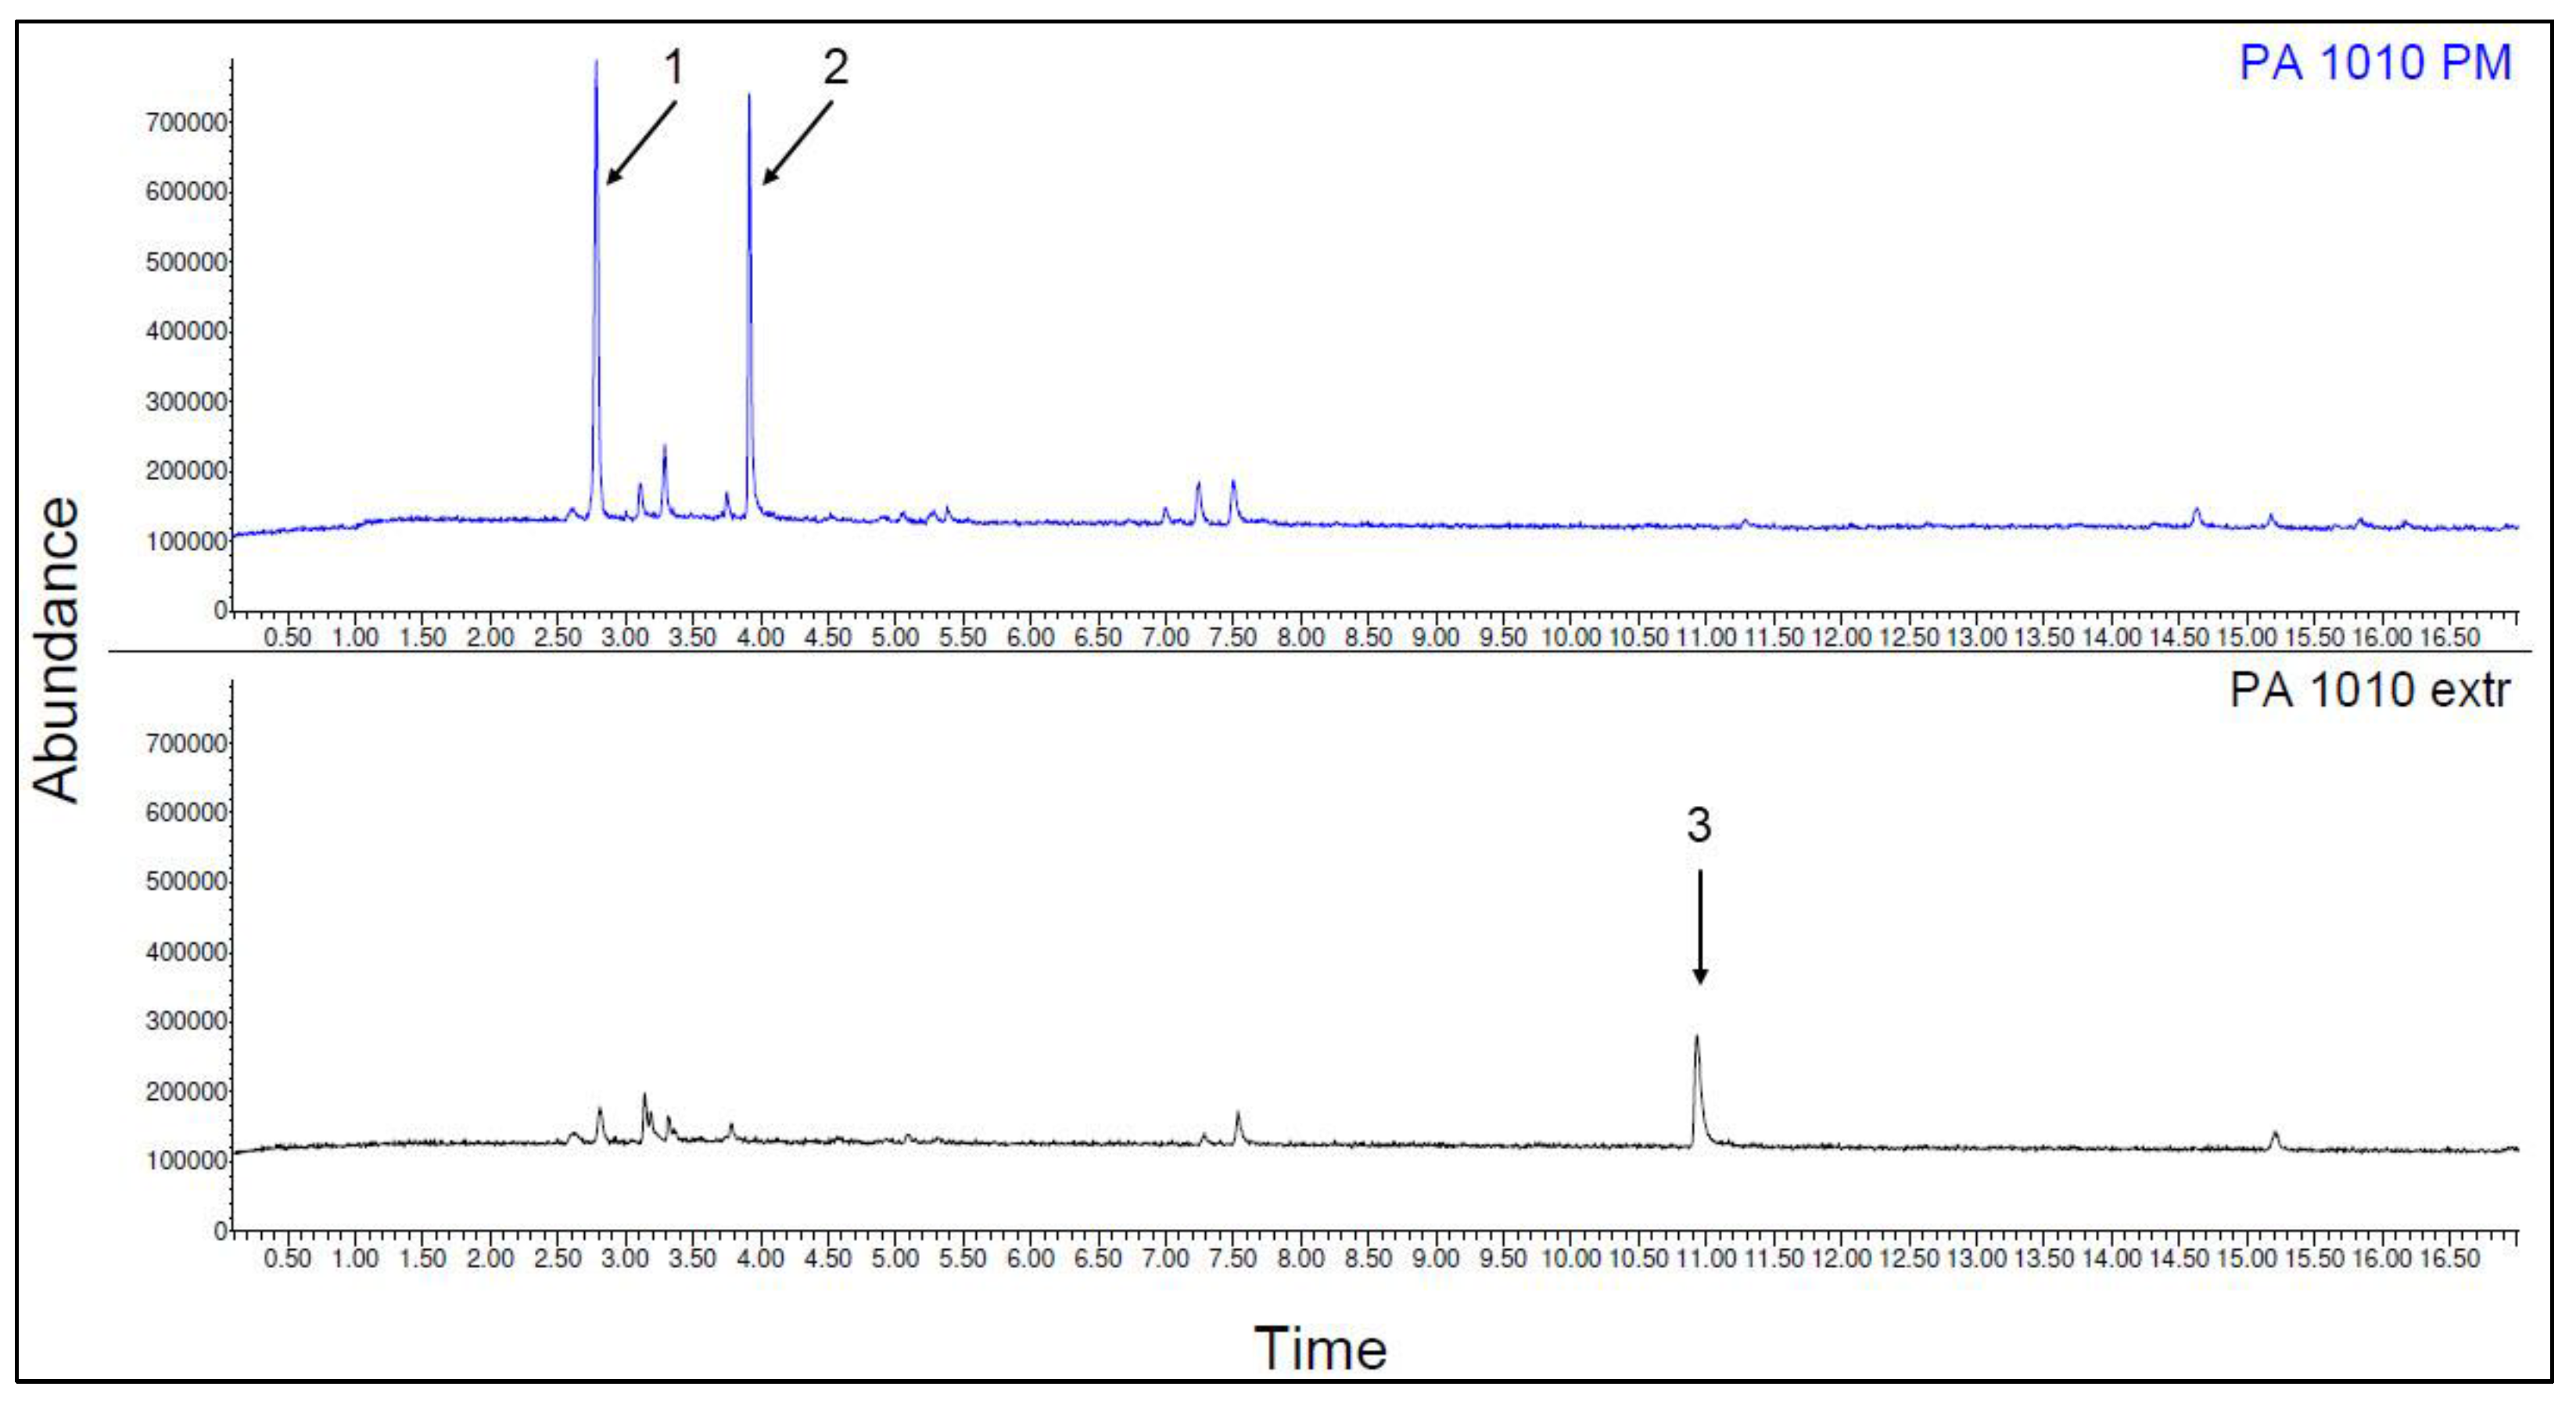
3.3.2. Qualitative Evaluation of the VOC Emissions
Glass Fiber and Regenerated Cellulose Fiber
Polymer Matrix PA 6.10 and PA 6.10 Composites
Polymer Matrix PA 10.10 and PA 10.10 Composites
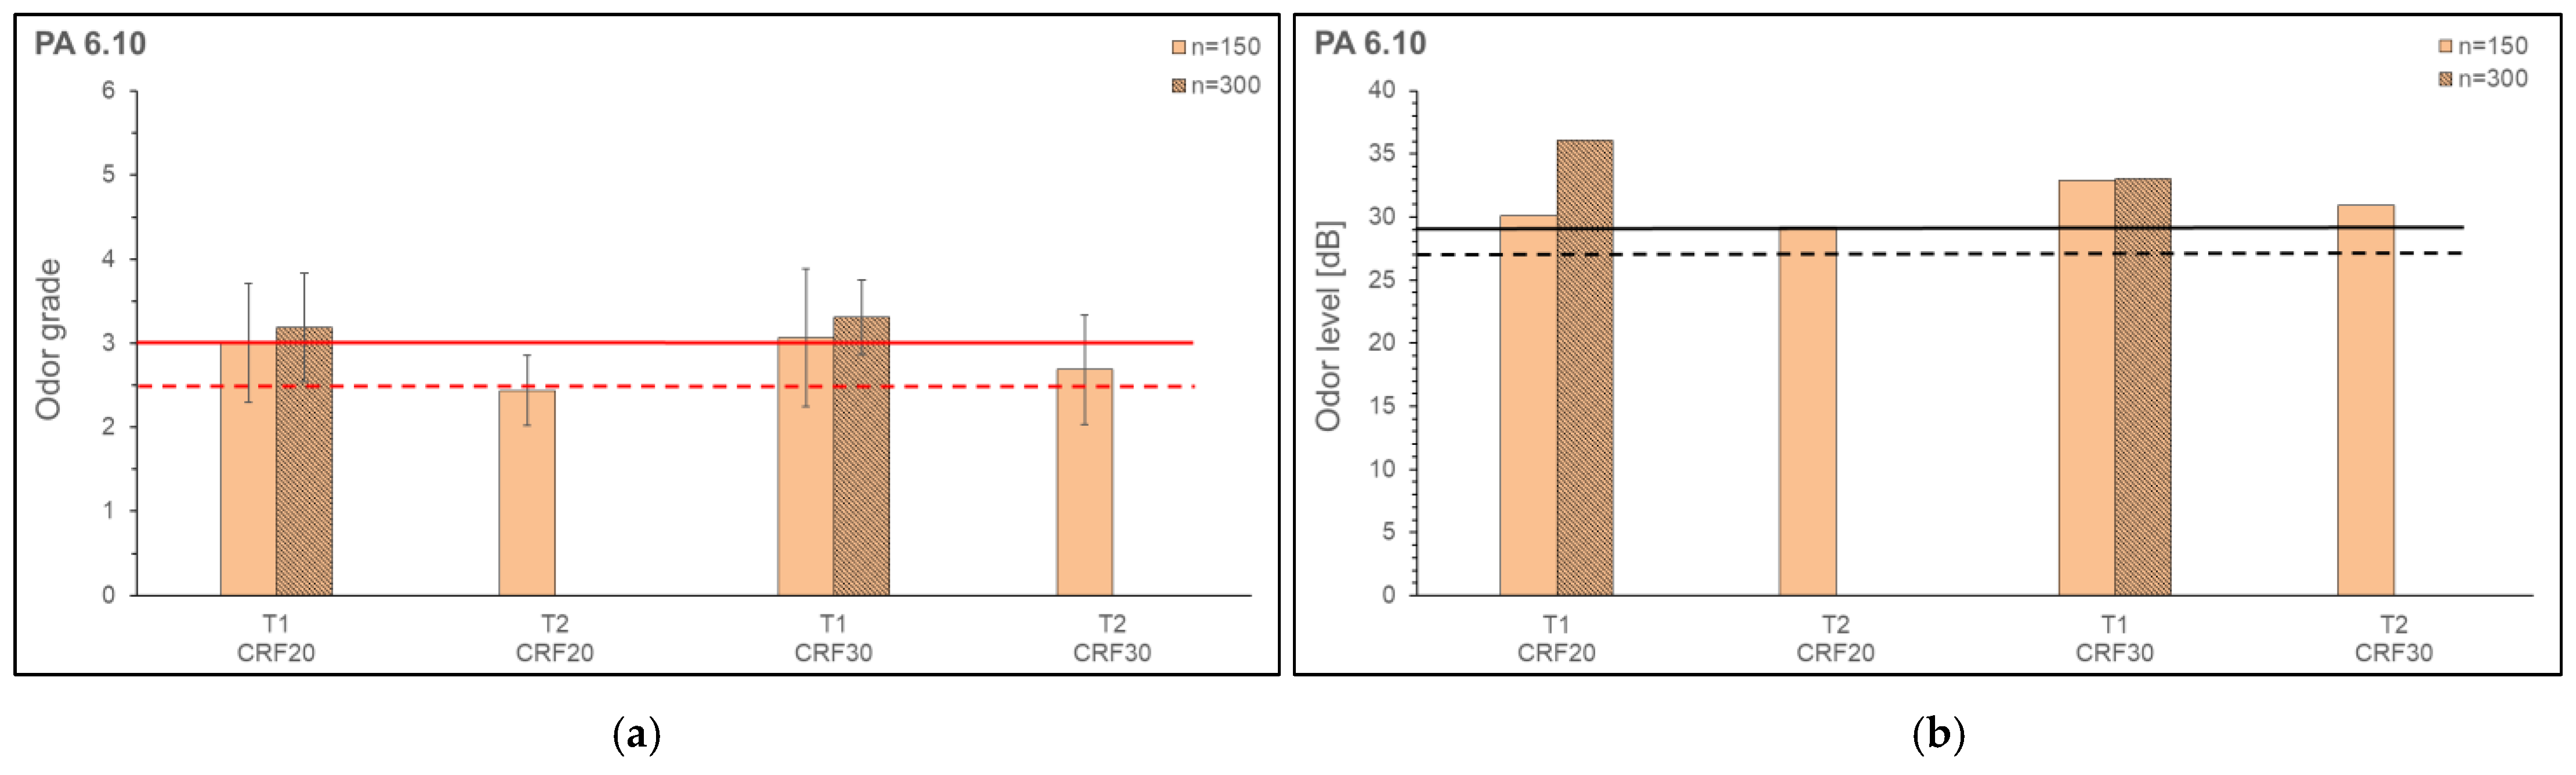
3.4. Odor Evaluation
4. Conclusions
- Compounding bio-based PA and regenerated cellulose fibers (Cordenka) with a conventional twin-screw extruder and gravimetric feeding system was realized with 20 wt.% and 30 wt.% fiber content;
- Compounding bio-based PA with glass fibers (30 wt.% and 40 wt.%) was used as a comparable volume share for comparisons;
- With the combination of the modified bag method (DIN ISO 12219-2) and TD-GC-MS according to VDA 278, substances can be successfully identified, and VOC emissions quantified;
- VOC emissions (quantitative) were at a low level compared to other studies (other materials and composites);
- The results of the odor tests showed values mostly above the required limit values;
- The Young’s Modulus and the Impact strength increase with increasing fiber content. PA 6.10 and PA 10.10 achieve significantly higher impact strengths with the regenerated cellulose fibers than the composites with glass fibers;
- Compared to glass fiber reinforced PA 6.10 and PA 10.10, a significantly higher elongation at break with regenerated cellulose fibers can be achieved;
- While a further increase in tensile strength was observed for PA 6.10 with the use of glass fibers, the glass fiber-reinforced PA 10.10 composites had significantly lower tensile strengths in comparison with regenerated cellulose fibers;
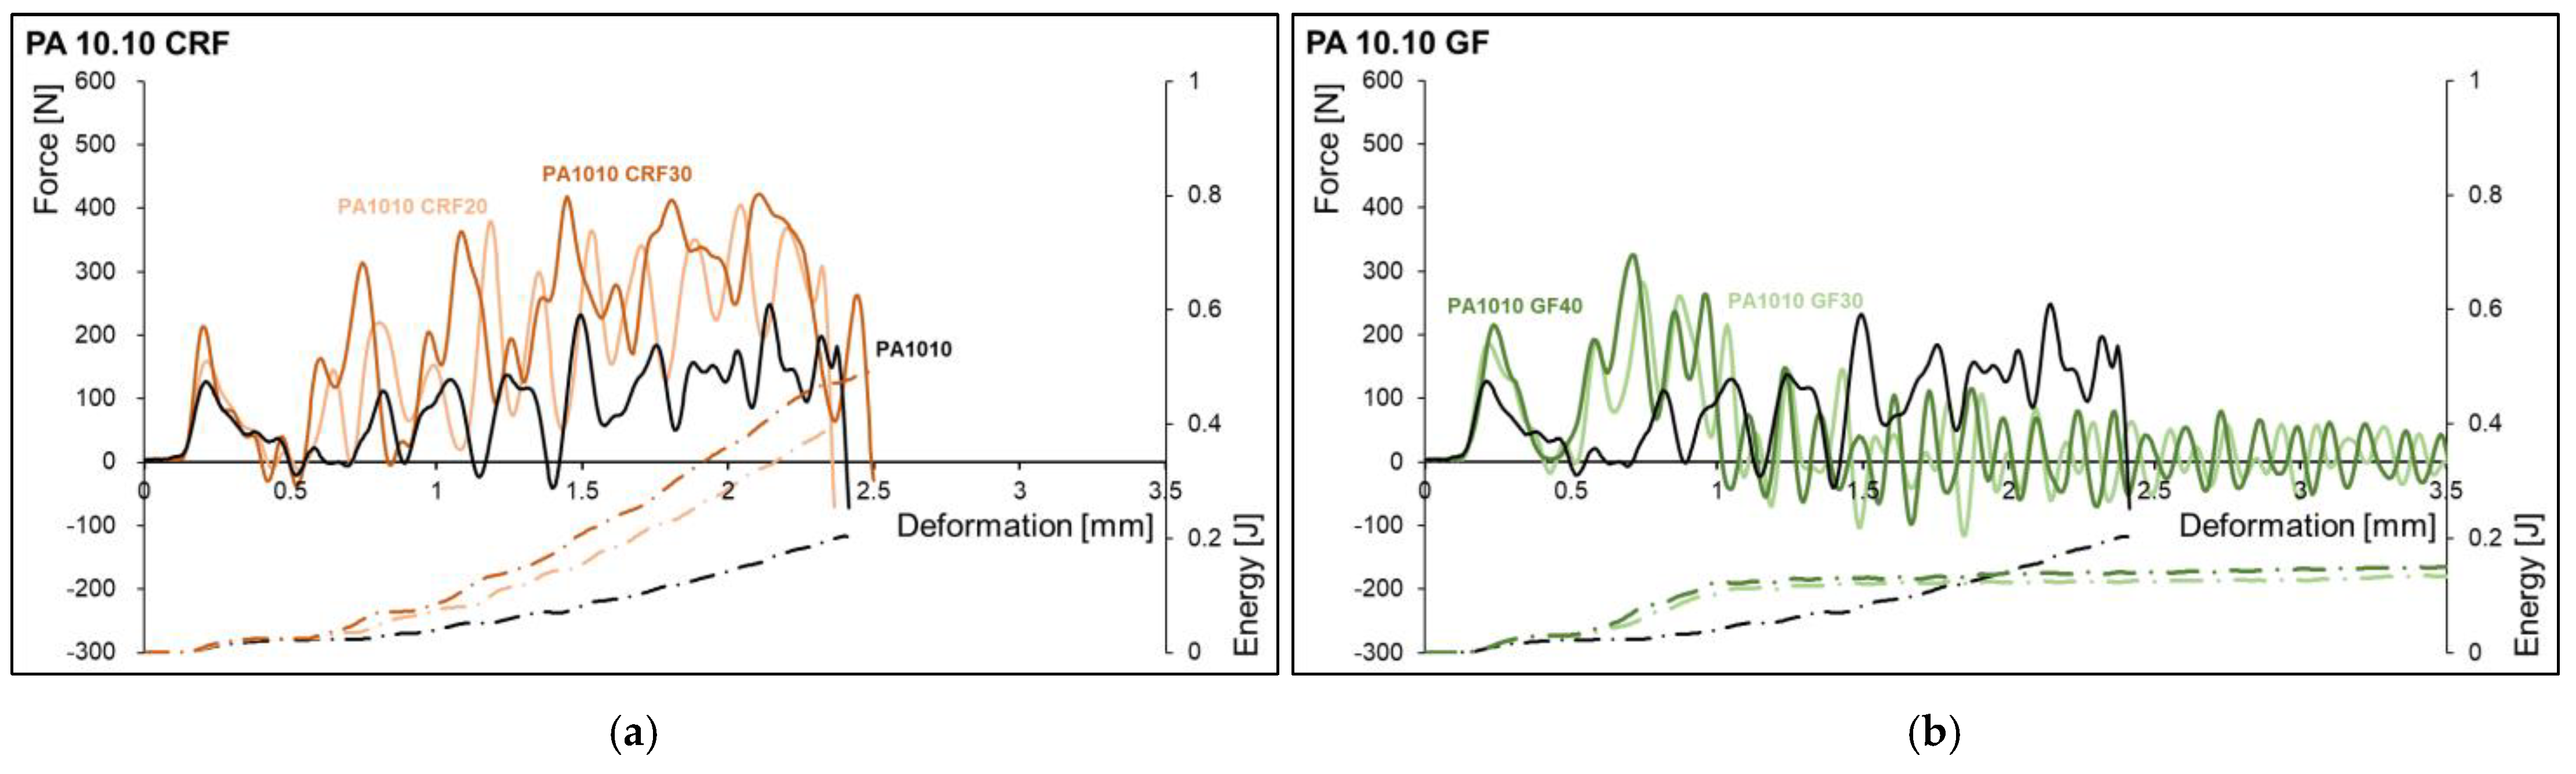
- The highest forces were studied for cellulosic fiber-reinforced composites. The significantly higher elongation at the break of the cellulose fiber leads to higher deformation and higher energy absorption.
- The investigations showed that the composites investigated can be used in automotive interiors due to their mechanical properties. Due to the high elongation at the break of the cellulose fiber, a significantly higher impact strength of the PA 6.10 and PA 10.10 composites was achieved. In the passenger compartment, cellulose fiber-reinforced bio polyamides can, thus, be used in particular for crash-relevant components. In view of the results of the odor tests, the values are not yet sufficient for use in automobile interiors.
- Further investigations to optimize the processing parameters in extrusion (optimization of the screw configuration, an adaptation of the process parameters, etc.) and in the injection molding process (residence time, process temperature, etc.) could provide solutions.
Author Contributions
Funding
Institutional Review Board Statement
Data Availability Statement
Conflicts of Interest
References
- Witten, E.; Mathes, V. Der europäische Markt für Faserverstärkte Kunststoffe/Composites 2021: Marktentwicklungen, Trends, Herausforderungen und Ausblicke; AVK-Industrieverband Verstärkter Kunststoffe: Frankfurt, Germany, 2022. [Google Scholar]
- Delli, E.; Giliopoulos, D.; Bikiaris, D.; Chrissafis, K. Fibre length and loading impact on the properties of glass fibre reinforced polypropylene random composites. Compos. Struct. 2021, 263, 113678. [Google Scholar] [CrossRef]
- Nuruzzaman, D.M.; Kusaseh, N.M.; Ismail, N.M.; Asif Iqbal, A.K.M.; Rahman, M.M.; Azhari, A.; Hamedon, Z.; Shin Yi, C. Influence of glass fiber content on tensile properties of polyamide-polypropylene based polymer blend composites. Mater. Today 2020, 29, 133–137. [Google Scholar] [CrossRef]
- Fang, J.; Zhang, L.; Li, C. The combined effect of impregnated rollers configuration and glass fibers surface modification on the properties of continuous glass fibers reinforced polypropylene prepreg composites. Compos. Sci. Technol. 2020, 197, 108259. [Google Scholar] [CrossRef]
- Jariyavidyanont, K.; Focke, W.; Androsch, R. Thermal Properties of Biobased Polyamide 11. In Thermal Properties of Bio-Based Polymers; Di Lorenzo, M.L., Androsch, R., Eds.; Springer: Cham, Switzerland, 2019. [Google Scholar] [CrossRef]
- Endres, H.-J.; Siebert-Raths, A. Technische Biopolymere Rahmenbedingungen, Marksituation, Herstellung, Aufbau und Eigenschaften; Carl Hnaser Verlag: Muenchen, Germany, 2009. [Google Scholar]
- Aaliya, B.; Sunooj, K.V.; Lackner, M. Biopolymer composites: A review. Int. J. Biobased Plast. 2021, 3, 40–84. [Google Scholar] [CrossRef]
- Feldmann, M.; Bledzki, A.-K.; Heim, H.-P. Technische Biokunststoffe mit Naturfaserverstärkung am Beispiel von Polyamid-Cellulosefasern als Alternative zu Glasfasern. In C.A.R.M.E.N-Jahrbuch 202010/2011: Technische Biokunststoffe mit Naturfasern; Centrales Agrar- Rohstoff- Marketing- und Entwicklungs-Netzwerk e.V, Ed.; Centrales Agrar-Rohstoff Marketing- und Energie-Netzwerk e. V.: Staubingen, Germany, 2011; pp. 513–520. [Google Scholar]
- Evonik Industries, AG. Material Data Sheet Vestamid® Terra. Available online: https://www.plastics-database.com (accessed on 1 February 2022).
- Gholampour, A.; Ozbakkaloglu, T. A review of natural fiber composites: Properties, modification and processing techniques, characterization, applications. J. Mater. Sci. 2020, 55, 829–892. [Google Scholar] [CrossRef]
- Han, X.; Ding, L.; Tian, Z.; Wu, W.; Jiang, S. Extraction and characterization of novel ultrastrong and tough natural cellulosic fiber bundles from manau rattan (Calamus manan). Ind. Crops Prod. 2021, 173, 114103. [Google Scholar] [CrossRef]
- Han, X.; Wang, J.; Wang, X.; Tian, W.; Dong, Y.; Jiang, S. Finite Element Analysis of Strengthening Mechanism of Ultrastrong and Tough Cellulosic Materials. Polymers 2022, 14, 4490. [Google Scholar] [CrossRef]
- Graupner, N.; Herrmann, A.S.; Müssig, J. Natural and man-made cellulose fibre-reinforced poly (lactic acid) (PLA) composites: An overview about mechanical char-acteristics and application areas. Compos. Part A Appl. Sci. Manuf. 2009, 40, 810–821. [Google Scholar] [CrossRef]
- Feldmann, M.; Heim, H.-P.; Zarges, J.-C. Influence of the process parameters on the mechanical properties of engineering biocomposites using a twin-screw extruder. Compos. Part A Appl. Sci. Manuf. 2016, 83, 113–119. [Google Scholar] [CrossRef]
- Klemm, D.; Heublein, B.; Fink, H.-P.; Bohn, A. Cellulose: Fascinating Biopolymer and Sustainable Raw Material. Angew. Chem. Int. Edit. 2005, 44, 3358–3393. [Google Scholar] [CrossRef]
- Richter, S.; Eikelenberg, N.; Magnani, M.; Müssig, J. Naturfaser-PP: Sisal als Verstärkung; Kunststoffe. Hanser Verlag: München, Germany, 2010; pp. 72–75. [Google Scholar]
- Ye, H.; Zhang, Y.; Yu, Z.; Mu, J. Effects of cellulose, hemicellulose, and lignin on the morphology and mechanical properties of metakaolin-based geopolymer. Constr. Build. Mater. 2018, 173, 10–16. [Google Scholar] [CrossRef]
- Helmke, P.; Endres, H.-J.; Nelles, M.; Koplin, T. Einfärben von zelluloseverstärktem Polypropylen; Kunststoffe. Hanser Verlag: München, Germany, 2012; pp. 36–40. [Google Scholar]
- Faruk, O.; Bledzki, A.K.; Fink, H.-P.; Sain, M. Progress report on natural fiber reinforced composites. Macrom. Mater. Eng. 2014, 299, 9–26. [Google Scholar] [CrossRef]
- Beg, M.D.H.; Pickering, K.L. The Effects of Residual Lignin Content on Wood Fibre Reinforced Polypropylene. Compos. Adv. Mater. Res. 2007, 29, 323–326. [Google Scholar] [CrossRef]
- Espert, A.; de las Heras, L.A.; Karlsson, S. Emission of possible odourous low molecular weight compounds in recycled biofibre/polypropylene composites monitored by head-space SPME-GC–MS. Polym. Degrad. Stab. 2005, 90, 555–562. [Google Scholar] [CrossRef]
- Yang, H.; Yan, R.; Chen, H.; Lee, D.H.; Zheng, C. Characteristics of hemicellulose, cellulose and lignin pyrolysis. Fuel 2007, 86, 1781–1788. [Google Scholar] [CrossRef]
- Feldmann, M.W. Biobasierte Polyamide Mit Cellulosefasern: Verfahren-Struktur-Eigenschaften; Kassel University Press GmbH: Kassel, Germany, 2013; ISBN 978-3-89958-599-5. [Google Scholar]
- Ganster, J.; Fink, H.-P. The structure of man-made cellulosic fibres. In Handbook of Textile Fibre Sturcture: Vol. 2: Natura, Regeneraterd, Inorganic and Specialist Fibres; Eichhorn, S.J., Hearle, J.W.S., Jaffe, M., Kikutanio, T., Eds.; CRC Press LLC: Boca Raton, FL, USA, 2009; pp. 201–229. [Google Scholar]
- Ganster, J.; Fink, H.-P. Man-Made Cellulose Short Fiber Reinforced Oil and Bio-Based Thermoplastics. In Cellulose Fibers: Bio- and Nano-Polymer Composites; Kalia, S., Kaith, B.S., Kaur, I., Eds.; Springer: Berlin/Heidelberg, Germany, 2011; pp. 479–505. [Google Scholar] [CrossRef]
- Jaszkiewicz, A.; Meljon, A.; Bledzki, A.K.; Radwanski, M. Gaining knowledge on the processability of PLA-based short-fibre compounds—A comprehensive comparison with their PP counterparts. Compos. Part A Appl. Sci. Manuf. 2016, 83, 140–151. [Google Scholar] [CrossRef]
- Ganster, J.; Fink, H.-P.; Uihlein, K.; Zimmerer, B. Cellulose man-made fibre reinforced polypropylene-correlations between fibre and composite properties. Cellulose 2008, 561–569. [Google Scholar] [CrossRef]
- Hariprasad, K.; Ravichandran, K.; Jayaseelan, V.; Muthuramalingam, T. Acoustic and mechanical characterisation of polypropylene composites reinforced by natural fibres for automotive applications. J. Mater. Res. Technol. 2020, 9, 14029–14035. [Google Scholar] [CrossRef]
- Zarges, J.-C.; Minkley, D.; Feldmann, M.; Heim, H.-P. Fracture toughness of injection molded, man-made cellulose fiber reinforced polypropylene. Compos. Part A Appl. Sci. Manuf. 2017, 98, 147–158. [Google Scholar] [CrossRef]
- Bax, B.; Müssig, J. Impact and tensile properties of PLA/Cordenka and PLA/flax composites. Compos. Sci. Technol. 2008, 68, 1601–1607. [Google Scholar] [CrossRef] [Green Version]
- Bledzki, A.K.; Jaskiewicz, A.; Scherzer, D. Mechanical properties of PLA composites with man-made cellulose and abaca fibres. Compos. Part A Appl. Sci. Manuf. 2009, 40, 404–412. [Google Scholar] [CrossRef]
- Erdmann, J. Biobasierte Kunststoffe Mit Cellulosefaserverstärkung-Zusammenhänge Zwischen Struktur, Haftung und Mechanischen Eigenschaften; Martin-Luther-Universität Halle-Wittenberg: Halle, Germany, 2017. [Google Scholar]
- Gemmeke, N.; Feldmann, M.; Heim, H.-P. Processing and characterization of engineering biocomposites based on polybutylenterephthalat (PBT) and polytri-methylentherephthalat (PTT) with regenerated cellulose fibers modified with maleic anhydride grafted polyethylene as a processing agent. Compos. Part A Appl. Sci. Manuf. 2019, 118, 327–335. [Google Scholar] [CrossRef]
- Beg, M.D.H.; Islam, M.R.; Mamun, A.A.; Heim, H.-P.; Feldmann, M.; Akindoyo, J.O. Characterization of polyamide 6.10 composites incorporated with microcrystalline cellulose fiber: Effects of fiber loading and impact modifier. Adv. Polym. Technol. 2018, 37, 3412–3420. [Google Scholar] [CrossRef]
- Feldmann, M. Bio-based Polyamides. In Industrial Applications of Biopolymers and Their Environmental Impact; Al Mamun, A., Chen, J.Y., Eds.; CRC Press: Boca Raton, FL, USA, 2022; pp. 94–112. [Google Scholar]
- Kuciel, S.; Kuzniar, P.; Liber-Knec, A. Polyamides from renewable sources as matrices of short fiber reinforced biocomposites. Polimery 2012, 57, 627–634. [Google Scholar] [CrossRef]
- Feldmann, M.; Bledzki, A.K. Bio-based polyamides reinforced with cellulosic fibres—Processing and properties. Compos. Sci. Technol. 2014, 100, 113–120. [Google Scholar] [CrossRef]
- Klason, C.; Kubát, J.; Strömvall, H.-E. The Efficiency of Cellulosic Fillers in Common Thermoplastics. Int. J. Polym. Mater. 1984, 10, 159–187. [Google Scholar] [CrossRef]
- DIN Deutsches Institut für Normung e. V. DIN ISO 12219-7; Innenraumluft von Straßenfahrzeugen-Teil 7: Geruchsbestimmung in der Innenraumluft von Straßenfahr-zeugen und der Emissionsprüfkammerluft von Bestandteilen der Innenausstattung durch olfaktorische Messungen. Beuth Verlag GmbH: Berlin, Germany, 2017. [Google Scholar]
- Ulker, O.; Hiziroglu, S. Volatile Organic Compounds (VOCs) Emitted from Coated Furniture Units. Coatings 2021, 11, 806. [Google Scholar] [CrossRef]
- Pratt, S. Understanding a Fog Testing System; Thermo Fisher Scientific Inc.: Newington, NH, USA, 2011. [Google Scholar]
- Kim, S.; Kim, H.-J.; Moon, S.-J. Evaluation of VOC Emissions from Building Finishing Materials Using a Small Chamber and VOC Analyser. Indoor Built Environ. 2006, 15, 511–523. [Google Scholar] [CrossRef]
- Lee, B.; Kim, H.; Kim, K.; Lee, S. Formaldehyde and TVOC Emission of Bio-Composites with Attached Fancy Veneer. J. Korean Wood Sci. Technol. 2008, 36, 46–55. [Google Scholar]
- Khoshnava, S.W.M.; Rostami, R.; Zin, R.M.; Streimikiene, D.; Mardani, A.; Ismail, M. The Role of Green Building Materials in Reducing Environmental and Human Health Impacts. Int. J. Environ. Res. Public Health 2020, 17, 2589. [Google Scholar] [CrossRef]
- Kriek, G.; Lazear, N.; Rhodes, V.; Barnes, J.; Bollmeier, J.; Chuang, J.C.; Holdren, M.W.; Wisbith, A.S.; Hayward, J.; Pietrzyk, D. Development of Emission Factors for Polyamide Processing. J. Air Waste Manag. Assoc. 2011, 51, 1001–1008. [Google Scholar] [CrossRef] [PubMed] [Green Version]
- Courgneau, C.; Rusu, D.; Henneuse, C.; Ducruet, V.; Lacrampe, M.-F.; Krawczak, P. Characterisation of low-odour emissive polylactide/cellulose fibre biocomposites for car interior. Express Polym. Lett. 2013, 7, 787–804. [Google Scholar] [CrossRef]
- Rüppel, A.; Wolff, S.; Heim, H.-P. The impact of accelerated aging on mechanical and thermal properties and VOC emission of polypropylene composites rein-forced with glass fibers. Int. Polym. Proc. 2022, 38, 111–125. [Google Scholar] [CrossRef]
- Cordenka GmbH & Co., KG. Technical Data Sheet Cordenka Rayon. Available online: https://cordenka.com/ (accessed on 1 February 2021).
- Ehrenstein, G.W.; Riedel, G.; Trawiel, P. Praxis der Thermischen Analyse von Kunststoffen, 2nd ed.; Hanser Verlag: München, Germany, 2003. [Google Scholar]
- Schwarzwälder Textil-Werke GmbH. Product Data Sheet Glass Fiber, Short Cut FGCS 3540; Schwarzwälder Textil-Werke GmbH: Schenkenzell, Germany, 2006. [Google Scholar]
- Schürmann, H. Konstruieren Mit Faser-Kunststoff-Verbunden; Springer: Berlin/Heidelberg, Germany, 2007. [Google Scholar]
- Kahl, C.; Zarges, J.C.; Heim, H.-P. Influence of Fiber Volume in Hybrid Short Glass/Cellulose Reinforced Thermoplastic Compounds. Polymers 2022, 14, 3929. [Google Scholar] [CrossRef]
- DIN Deutsches Institut für Normung e. V. DIN EN ISO 527; Kunststoffe-Bestimmung der Zugeigenschaften. Beuth Verlag GmbH: Berlin, Germany, 2012. [Google Scholar]
- DIN Deutsches Institut für Normung e. V. DIN EN ISO 179-2; Kunststoffe-Bestimmung der Charpy-Schlageigenschaften—Teil 2: Instrumentierte Schlagzähigkeitsprüfung. Beuth Verlag GmbH: Berlin, Germany, 2020. [Google Scholar]
- DIN Deutsches Institut für Normung e. V. DIN EN ISO 15512; Kunststoffe-Bestimmung des Wassergehalts. Beuth Verlag GmbH: Berlin, Germany, 2009. [Google Scholar]
- VDA Verband der Automobilindustrie e. V. VDA 278; Thermodesorptionsanalyse Organischer Emissionen zur Charakterisierung Nichtmetallischer KFZ-Werkstoffe. Beuth Verlag GmbH: Berlin, Germany, 2011. [Google Scholar]
- DIN Deutsches Institut für Normung e. V. DIN ISO 12219-2; Innenraumluft von Straßenfahrzeugen-Screeningverfahren für Die Bestimmung von Flüchtigenorgan-Ischen Verbindungen aus Fahrzeuginnenraumausstattungsteilen-Probenbeutel-Verfahren. Beuth Verlag GmbH: Berlin, Germany, 2012. [Google Scholar]
- VDA Verband der Automobilindustrie e. V. VDA 270; Determination of Odour Characteristics of Trim Materials in Motor Vehicles. Beuth Verlag GmbH: Berlin, Germany, 2018. [Google Scholar]
- DIN Deutsches Institut für Normung e. V. DIN EN 13725; Determination of Odour Concentration by Dynamic Olfactometry. Beuth Verlag GmbH: Berlin, Germany, 2003. [Google Scholar]
- Rhodes, V.L.; Crawford, J.; Toner, H.P. Emission Factors for Plastics Processing. In Proceedings of the Specialty Conference Emission Inventory: Living in a Global Environment, New Orleans, LA, USA, 8–10 December 1998; Volume 1. [Google Scholar]
- Moll, S. Untersuchung der Auswirkungen einer thermisch-oxidativen Beanspruchung auf das Emissionsverhalten von ABS und PP und der Korrelation Mit dem Alterungsgrad; Technische Fakultät der Friedrich-Alexander Universität, Erlangen Nürnberg: Erlangen, Germany, 2017. [Google Scholar]
- US Department of Commerce; National Institute of Standards and Technology. NIST Chemistry WebBook, SRD 69. Available online: https://webbook.nist.gov/chemistry/ (accessed on 1 January 2022).
- National Center for Biotechnology Information; National Library of Medicine. PubChem, National Library of Medicine, National Center for Biotechnology Information. Available online: https://pubchem.ncbi.nlm.nih.gov/ (accessed on 1 February 2022).
- Institut für Arbeitsschutz der Deutschen Gesetztlichen Unfallversicherung-GESTIS-Stoffdatenbank, Institut für Arbeitsschutz der Deutschen Gesetzlichen Unfallversicherung. Available online: https://gestis.dguv.de/ (accessed on 1 January 2023).
- Maiwald, B. Gerüche-Messen und Bewerten; Landesamt für Umweltschutz Sachsen-Anhalt: Magdeburg, Germany, 2016. [Google Scholar]


| Properties | PA 10.10 (DS16) Dry/Cond. | PA 6.10 (HS16) | Unit | Test Standard | Source |
|---|---|---|---|---|---|
| Share of renewable material | 100 | up to 62 | wt.% | - | [9] |
| Tensile Modulus | 1700/1250 | 2100 | MPa | ISO 527-1/-2 | [9] |
| Yield stress | 54/48 | 61 | MPa | ISO 527-1/-2 | [9] |
| Yield strain | 2/22 | % | ISO 527-1/-2 | [9] | |
| Density | 1.04/- | 1.08 | g/cm3 | ISO 1183 | [9] |
| Melting temperature | 200 | 222 | °C | ISO 11357-1/-3 | [9] |
| Glass transmission temperature | 54 | 60 | °C | DMA | [9] |
| Melt Flow Rate (230 °C/5 kg) | 90 | - | g/10 min | DIN EN ISO 1133 | [23] |
| Melt Flow Rate (250 °C/5 kg) | 130 | 131 | g/10 min | DIN EN ISO 1133 | [23] |
| Monomer content | 0.74 | 0.84 | % | by extraction | [23] |
| Relative viscosity | 1.64–1.77 | 1.64–1.77 | - | DIN EN ISO 307 | [23] |
| Properties | GF | CRF | Unit |
|---|---|---|---|
| Fiber length | 3 | 2 | mm |
| Fiber diameter | 10 | 12–15 | µm |
| Density | 2.5 | 1.5 | g/cm3 |
| Modulus | 73 | 20 | GPa |
| Strength | 3400 | 830 | MPa |
| Elongation at break | 3.5–4 | 13 | % |
| Decomposition temperature | - | from 175 | °C |
| Softening temperature | 840 | - | °C |
| Moisture content | max. 0.3 | * approx. 13 | % |
| Smell | odorless | odorless | - |
| Material and Composites | Fiber Type | Polymer Weight Content [wt.%] | Fiber Weight Content [wt.%] | Fiber Volume Content [vol.%] |
|---|---|---|---|---|
| CRF | Cellulose | 0 | 100 | 100 |
| GF | Glass | 0 | 100 | 100 |
| PA 610 PM (packaged material) | - | 100 | 0 | 0 |
| PA 610 extr (one time extruded) | - | 100 | 0 | 0 |
| PA 610 CRF20 | Cellulose | 80 | 20 | 15.2 |
| PA 610 CRF30 | Cellulose | 70 | 30 | 23.5 |
| PA 610 GF30 | Glass | 70 | 30 | 15.1 |
| PA 610 GF40 | Glass | 60 | 40 | 21.1 |
| PA 1010 PM (packaged material) | - | 100 | 0 | 0 |
| PA 1010 extr (one time extruded) | - | 100 | 0 | 0 |
| PA 1010 CRF20 | Cellulose | 80 | 20 | 14.7 |
| PA 1010 CRF30 | Cellulose | 70 | 30 | 22.9 |
| PA 1010 GF30 | Glass | 70 | 30 | 14.6 |
| PA 1010 GF40 | Glass | 60 | 40 | 21.7 |
| Temp. [°C] | Feeding Zone | Zone 1 | Zone 2 | Zone 3 | Zone 4 | Zone 5 | Zone 6 | Zone 7 | Nozzle |
|---|---|---|---|---|---|---|---|---|---|
| PA 610 | 50 | 240 | 240 | 230 | 230 | 230 | 220 | 210 | 220 |
| PA 1010 | 50 | 220 | 220 | 200 | 180 | 180 | 180 | 180 | 205 |
| Function | Feeding polymer | Melting | Melting | Feeding fiber | Mixing | Homo- genisation | Vacuum Degassing | Pressure Build-up | Sharping |
| Temp. [°C] | Feeding Zone | Zone 1 | Zone 2 | Zone 3 | Zone 4 | Zone 5 |
|---|---|---|---|---|---|---|
| PA 6.10 | 50 | 200 | 215 | 225 | 225 | 245 |
| PA 10.10 | 50 | 190 | 205 | 215 | 225 | 225 |
| Parameters | Values |
|---|---|
| TDU (Thermal Desorption Unit) | splitless, desorption flow 82.3 mL/min |
| 20 °C (0.5 min); 60 °C/min; | |
| 90 °C (30 min) | |
| 280 °C transfer heater | |
| CIS (Cooled Injection System) | split 100:1 |
| −150 °C (0.5 min); 12 °C/s; 280 °C (5 min) | |
| GC Column | HP-5 ms UI; 5% Phenyl Methyl Si |
| l = 30 m; di = 250 μm; df = 0.5 μm | |
| Pneumatics | He, constant flow = 3 mL/min |
| Oven | 40 °C (2 min); 10 °C/min; 280 °C (5 min) |
| MSD (Mass Spectrometry Device) | Scan, 29–450 amu |
| Grade 1 | Grade 2 | Grade 3 | Grade 4 | Grade 5 | Grade 6 |
|---|---|---|---|---|---|
| not perceptible | perceptible, not disturbing | clearly perceptible, but not disturbing | disturbing | strongly disturbing | not acceptable |
| Run | Ret. Time [min] | Peak Area [counts] | Start Time [min] | End Time [min] |
|---|---|---|---|---|
| 1 | 5.201 | 125,356,435 | 5.190 | 5.401 |
| 2 | 5.201 | 137,707,589 | 5.190 | 5.390 |
| Mean peak area | = 131,532,012 | |||
| Response factor | Rf,VOC = 0.015327 |
| Sample No. | Material and Composites | VOC Emission [µg/g] |
|---|---|---|
| 1 | PA 610 PM | 0.00200 |
| 2 | PA 610 extr | 0.00575 |
| 3 | PA 610 CRF20 | 0.01294 |
| 4 | PA 610 CRF30 | 0.04875 |
| 5 | PA 610 GF30 | 0.04598 |
| 6 | PA 610 GF40 | 0.13150 |
| 7 | PA 1010 PM | 0.15245 |
| 8 | PA 1010 extr | 0.00130 |
| 9 | PA 1010 CRF20 | 0.00535 |
| 10 | PA 1010 CRF30 | 0.00980 |
| 11 | PA 1010 GF30 | 0.00495 |
| 12 | PA 1010 GF40 | 0.00925 |
| 13 | Glass Fiber (GF) | 0.00000 |
| 14 | Regenerated Cellulose Fiber (CRF) | 0.16440 |
| No. | Substance | Rt [min] | CAS No. | Characteristic (Type; Odor; Use; VOC) |
|---|---|---|---|---|
| 1 | Butanal | 3.756 | 123-72-8 | aldehyde; characteristic, pungent, aldehydic odor; VOC |
| * | 2-Butanone | 3.796 | 078-93-3 | ketone, moderately sharp, mint- or acetone-like odor; VOC |
| * | 1-Butanol | 4.566 | 071-36-3 | alcohol, harsh fusel odor with banana, rancid, sweet; VOC |
| 2 | 1-Heptene | 4.952 | 592-76-7 | alkene; petroleum-like odor; VOC |
| 3 | Pentanal | 5.079 | 110-62-3 | aldehyde; strong, acrid, pungent odor, smells of bready, fruity, nutty, berry; VOC |
| 4 | Hexanal | 7.572 | 66-25-1 | aldehyde; smell of fresh lawn clippings or apple mash; VOC |
| 5 | 1-Heptanal | 11.324 | 111-71-7 | aldehyde; penetrating fruity to oily greasy odor; VOC |
| 6 | 1-Heptanol | 14.354 | 111-70-6 | alcohol, faint aromatic alcohol odor; VOC |
| 7 | Octanal | 15.875 | 124-13-0 | aldehyde; starting material for fragrance, rose oil, lemon oil; VOC |
| No. | Substance | Rt [min] | CAS No. | Characteristic (Type; Odor; Use; VOC) |
|---|---|---|---|---|
| 1 | 1-Propene, 2-methyl- | 2.811 | 115-11-7 | alkene, faint petroleum-like odor; VOC |
| 2 | Butanal, 3-methyl- | 5.084 | 590-86-3 | aldehyde; apple-like odor and a powerful penetrating, acrid odor; VOC |
| 3 | Pentanal | 5.060 | 110-62-3 | aldehyde; strong, acrid, pungent odor, smells of bready, fruity, nutty, berry; VOC |
| Substance | CAS No. | PA 610 PM PA 610 Extr | CRF | PA610 CRF 20 | PA610 CRF30 | Hydrocarbon Compounds | Other Atoms | |||||
|---|---|---|---|---|---|---|---|---|---|---|---|---|
| Rt [min] | Pa [%] | Rt [min] | Pa [%] | Rt [min] | Pa [%] | Rt [min] | Pa [%] | C- Atoms | H- Atoms | |||
| 1-Propene, 2-methyl- | 115-11-7 | 2.811 | 59.8 | C4 | H8 | |||||||
| Acetone | 067-64-1 | 3.142 | 4.34 | 3.132 | 4.79 | C3 | H6 | O | ||||
| Butanal | 123-72-8 | 3.756 | 3.73 | 3.742 | 8.16 | 3.732 | 10.50 | C4 | H8 | O | ||
| 2-Butanone | 078-93-3 | * 3.796 | * 0.85 | 3.786 | 4.91 | 3.771 | 4.49 | C4 | H8 | O | ||
| 1-Butanol | 071-36-3 | * 4.566 | * 0.81 | 4.571 | 10.88 | 4.562 | 3.73 | C4 | H10 | O | ||
| Pentanal | 110-62-3 | 5.060 | 100.0 | C5 | H10 | O | ||||||
| Butanal, 3-methyl- | 590-86-3 | 5.084 | 40.2 | 5.079 | 10.62 | 5.069 | 55.87 | 5.064 | 61.08 | C5 | H10 | O |
| Cyclopentanone | 120-92-3 | 7.260 | 3.12 | 7.255 | 4.60 | C5 | H8 | O | ||||
| Hexanal | 066-25-1 | 7.572 | 25.00 | 7.543 | 4.37 | 7.543 | 5.49 | C6 | H12 | O | ||
| Substance | CAS No. | PA 610 PM PA 610 Extr | GF | PA610 GF 30 | PA610 GF 40 | Hydrocarbon Compounds | Other Atoms | |||||
|---|---|---|---|---|---|---|---|---|---|---|---|---|
| Rt [min] | Pa [%] | Rt [min] | Pa [%] | Rt [min] | Pa [%] | Rt [min] | Pa [%] | C-Atoms | H-Atoms | |||
| 1-Propene, 2-methyl- | 115-11-7 | 2.811 | 59.8 | C4 | H8 | |||||||
| Acetone | 067-64-1 | 3.147 | 4.79 | 3.142 | 1.28 | C3 | H6 | O | ||||
| Butanal | 123-72-8 | 3.747 | 4.92 | 3.742 | 5.96 | C4 | H8 | O | ||||
| 2-Butanone | 078-93-3 | 3.786 | 3.04 | 3.786 | 2.91 | C4 | H8 | O | ||||
| 2-Propen-1-ol, 2-methyl- | 513-42-8 | 4.381 | 13.47 | 4.391 | 10.26 | C4 | H8 | O | ||||
| 1-Butanol | 071-36-3 | 4.601 | 9.60 | 4.605 | 10.63 | C4 | H10 | O | ||||
| Pentanal | 110-62-3 | 5.060 | 100.0 | C5 | H10 | O | ||||||
| Butanal, 3-methyl- | 590-86-3 | 5.084 | 40.2 | 5.084 | 45.16 | 5.084 | 53.37 | C5 | H10 | O | ||
| Pyridine | 110-86-1 | 6.069 | 5.04 | 6.050 | 6.84 | C5 | H5 | N | ||||
| Pentanenitrile | 110-59-8 | 6.889 | 3.58 | 6.889 | 3.52 | C5 | H9 | N | ||||
| Cyclopentanone | 120-92-3 | 7.280 | 2.29 | 7.265 | 2.26 | C5 | H8 | O | ||||
| No. | Substance | Retention Time [min] | CAS No. | Characteristic (Type; Odor; Use; VOC) |
|---|---|---|---|---|
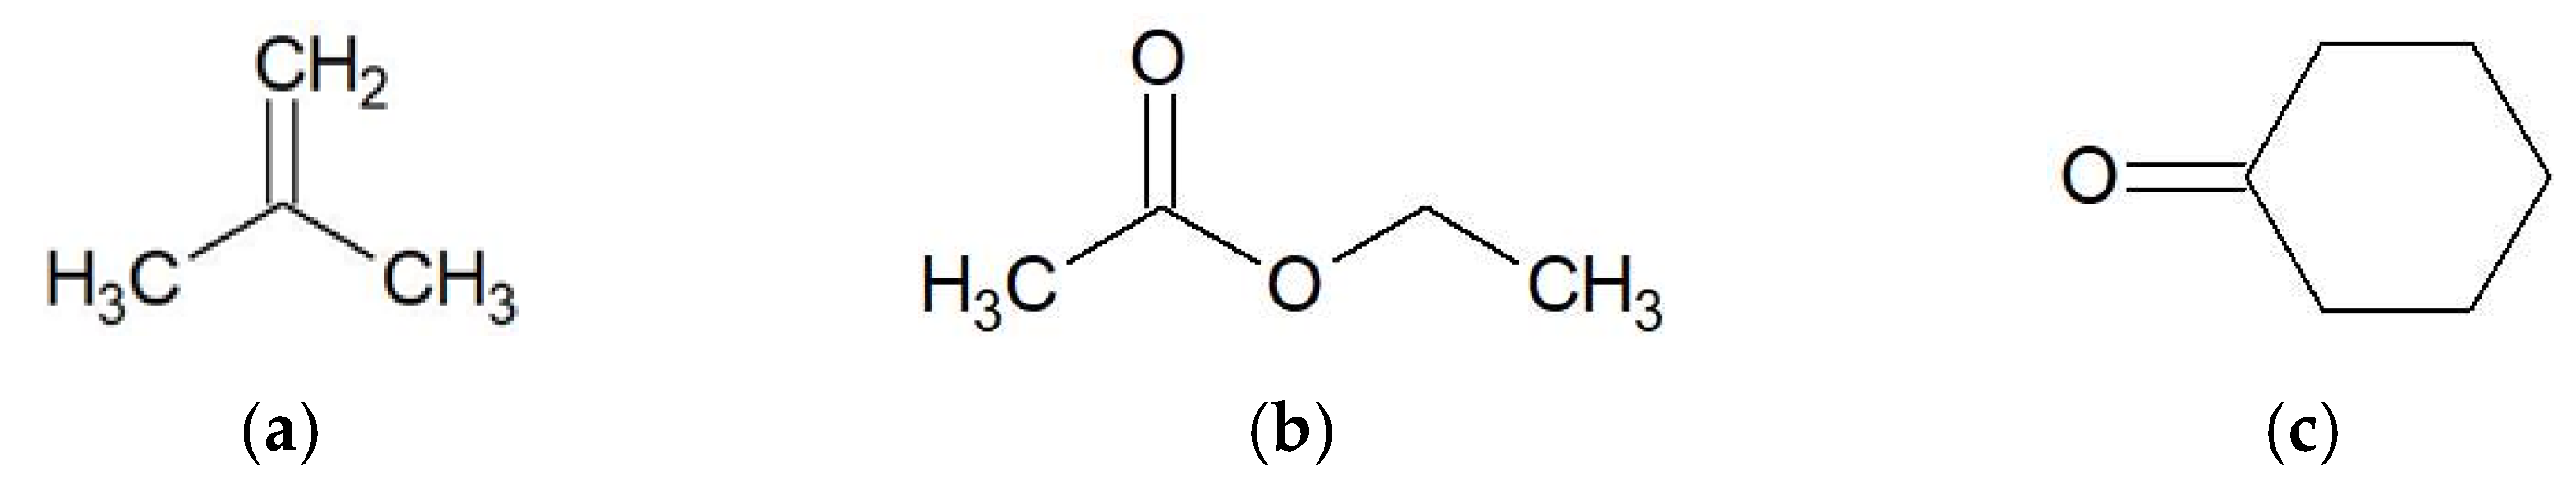
| 1 | 1-Propene, 2-methyl- | 2.785 | 115-11-7 | alkene, faint petroleum-like odor; VOC |
| 2 | Ethyl acetate | 3.917 | 141-78-6 | ester; fruity smell of pineapple; VOC |
| 3 | Cyclohexanone | 10.934 | 108-94-1 | ketone, peppermint or acetone-like odor; production of nylon, as a chemical reaction medium; VOC |
| Substance | CAS No. | PA 1010 PM PA 1010 Extr | CRF | PA1010 CRF 20 | PA1010 CRF30 | Hydrocarbon Compounds | Other Atoms | |||||
|---|---|---|---|---|---|---|---|---|---|---|---|---|
| Rt [min] | Pa [%] | Rt [min] | Pa [%] | Rt [min] | Pa [%] | Rt [min] | Pa [%] | C- Atoms | H- Atoms | |||
| 1-Propene, 2-methyl- | 115-11-7 | 2.785 | 58.4 | C4 | H8 | |||||||
| Acetone | 067-64-1 | 3.132 | 4.79 | C3 | H6 | O | ||||||
| Butanal | 123-72-8 | 3.756 | 3.73 | C4 | H8 | |||||||
| Ethyl acetate | 141-78-6 | 3.917 | 41.96 | C4 | H8 | O | ||||||
| Pentanal | 110-62-3 | 5.079 | 10.62 | C5 | H10 | O | ||||||
| Octane | 111-65-9 | 7.538 | 100.0 | 7.543 | 71.92 | C8 | H18 | |||||
| Hexanal | 066-25-1 | 7.572 | 25.00 | C6 | H12 | O | ||||||
| Cyclohexanone | 108-94-1 | 10.94 | 100.0 | C6 | H10 | O | ||||||
| Substance | CAS No. | PA 1010 PM PA 1010 Extr | GF | PA1010 GF 30 | PA1010 GF 40 | Hydrocarbon Compounds | Other Atoms | |||||
|---|---|---|---|---|---|---|---|---|---|---|---|---|
| Rt [min] | Pa [%] | Rt [min] | Pa [%] | Rt [min] | Pa [%] | Rt [min] | Pa [%] | C- Atoms | H- Atoms | |||
| 1-Propene, 2-methyl- | 115-11-7 | 2.785 | 58.4 | C4 | H8 | |||||||
| 2-Propanol, 2-methyl | 075-65-0 | 3.342 | 21.00 | 3.342 | 12.63 | C4 | H10 | O | ||||
| 2-Butanone | 078-93-3 | 3.801 | 9.75 | C4 | H8 | O | ||||||
| Ethyl acetate | 141-78-6 | 3.917 | 41.96 | C4 | H8 | O | ||||||
| 2-Propen-1-ol, 2-methyl- | 513-42-8 | 4.367 | 36.29 | C4 | H8 | O | ||||||
| Octane | 111-65-9 | 7.558 | 42.1 | 7.543 | 71.92 | C8 | H18 | |||||
| Cyclohexanone | 108-94-1 | 10.94 | 100.0 | C6 | H10 | O | ||||||
| PA-Type | Ratio CH2/CO-NH | Moisture [%] |
|---|---|---|
| PA 6.10 | 7 | 3.3 |
| PA 10.10 | 9 | 1.8 |
| Temp. [°C] | Feeding Zone | Zone 1 | Zone 2 | Zone 3 | Zone 4 | Zone 5 | Zone 6 | Zone 7 | Nozzle |
|---|---|---|---|---|---|---|---|---|---|
| PA 610 | 50 | 240 | 240 | 230 | 230 | 230 | 220 | 220 | 230 |
| PA 1010 | 50 | 240 | 240 | 230 | 230 | 230 | 220 | 210 | 220 |
| Function | Feeding polymer | Melting | Melting | Feeding fiber | Mixing | Homogenisation | Vacuum Degassing | Pressure Build-up | Sharping |
Disclaimer/Publisher’s Note: The statements, opinions and data contained in all publications are solely those of the individual author(s) and contributor(s) and not of MDPI and/or the editor(s). MDPI and/or the editor(s) disclaim responsibility for any injury to people or property resulting from any ideas, methods, instructions or products referred to in the content. |
© 2023 by the authors. Licensee MDPI, Basel, Switzerland. This article is an open access article distributed under the terms and conditions of the Creative Commons Attribution (CC BY) license (https://creativecommons.org/licenses/by/4.0/).
Share and Cite
Wolff, S.; Rüppel, A.; Rida, H.A.; Heim, H.-P. Emission and Mechanical Properties of Glass and Cellulose Fiber Reinforced Bio-Polyamide Composites. Polymers 2023, 15, 2603. https://doi.org/10.3390/polym15122603
Wolff S, Rüppel A, Rida HA, Heim H-P. Emission and Mechanical Properties of Glass and Cellulose Fiber Reinforced Bio-Polyamide Composites. Polymers. 2023; 15(12):2603. https://doi.org/10.3390/polym15122603
Chicago/Turabian StyleWolff, Susanne, Annette Rüppel, Hassan Ali Rida, and Hans-Peter Heim. 2023. "Emission and Mechanical Properties of Glass and Cellulose Fiber Reinforced Bio-Polyamide Composites" Polymers 15, no. 12: 2603. https://doi.org/10.3390/polym15122603