Upcycling of the Used Cigarette Butt Filters through Pyrolysis Process: Detailed Kinetic Mechanism with Bio-Char Characterization
Abstract
1. Introduction
2. Materials and Methods
2.1. Raw Material and Sample Preparation
2.2. The Pre-Carbonization Process Analysis Monitored by Simultaneous TG-DTG-DTA Measurements and Thermal Stability Tests
2.2.1. The Pre-Carbonization Performance Indices
2.2.2. Isoconversional Kinetic Analysis of Pre-Carbonization Process
2.2.3. Model-Based (Model-Fitting) Kinetic Analysis
2.3. Carbonization Process
Carbonization Experiment in the Horizontal Tube Furnace
2.4. Characterization of Raw Material and Derived Carbon Material
2.4.1. FTIR Analysis
2.4.2. X-ray Diffraction (XRD) Analysis
2.4.3. SEM-EDX Analysis
2.4.4. Nitrogen Adsorption-Desorption Experiments and BET Analysis
3. Results and Discussion
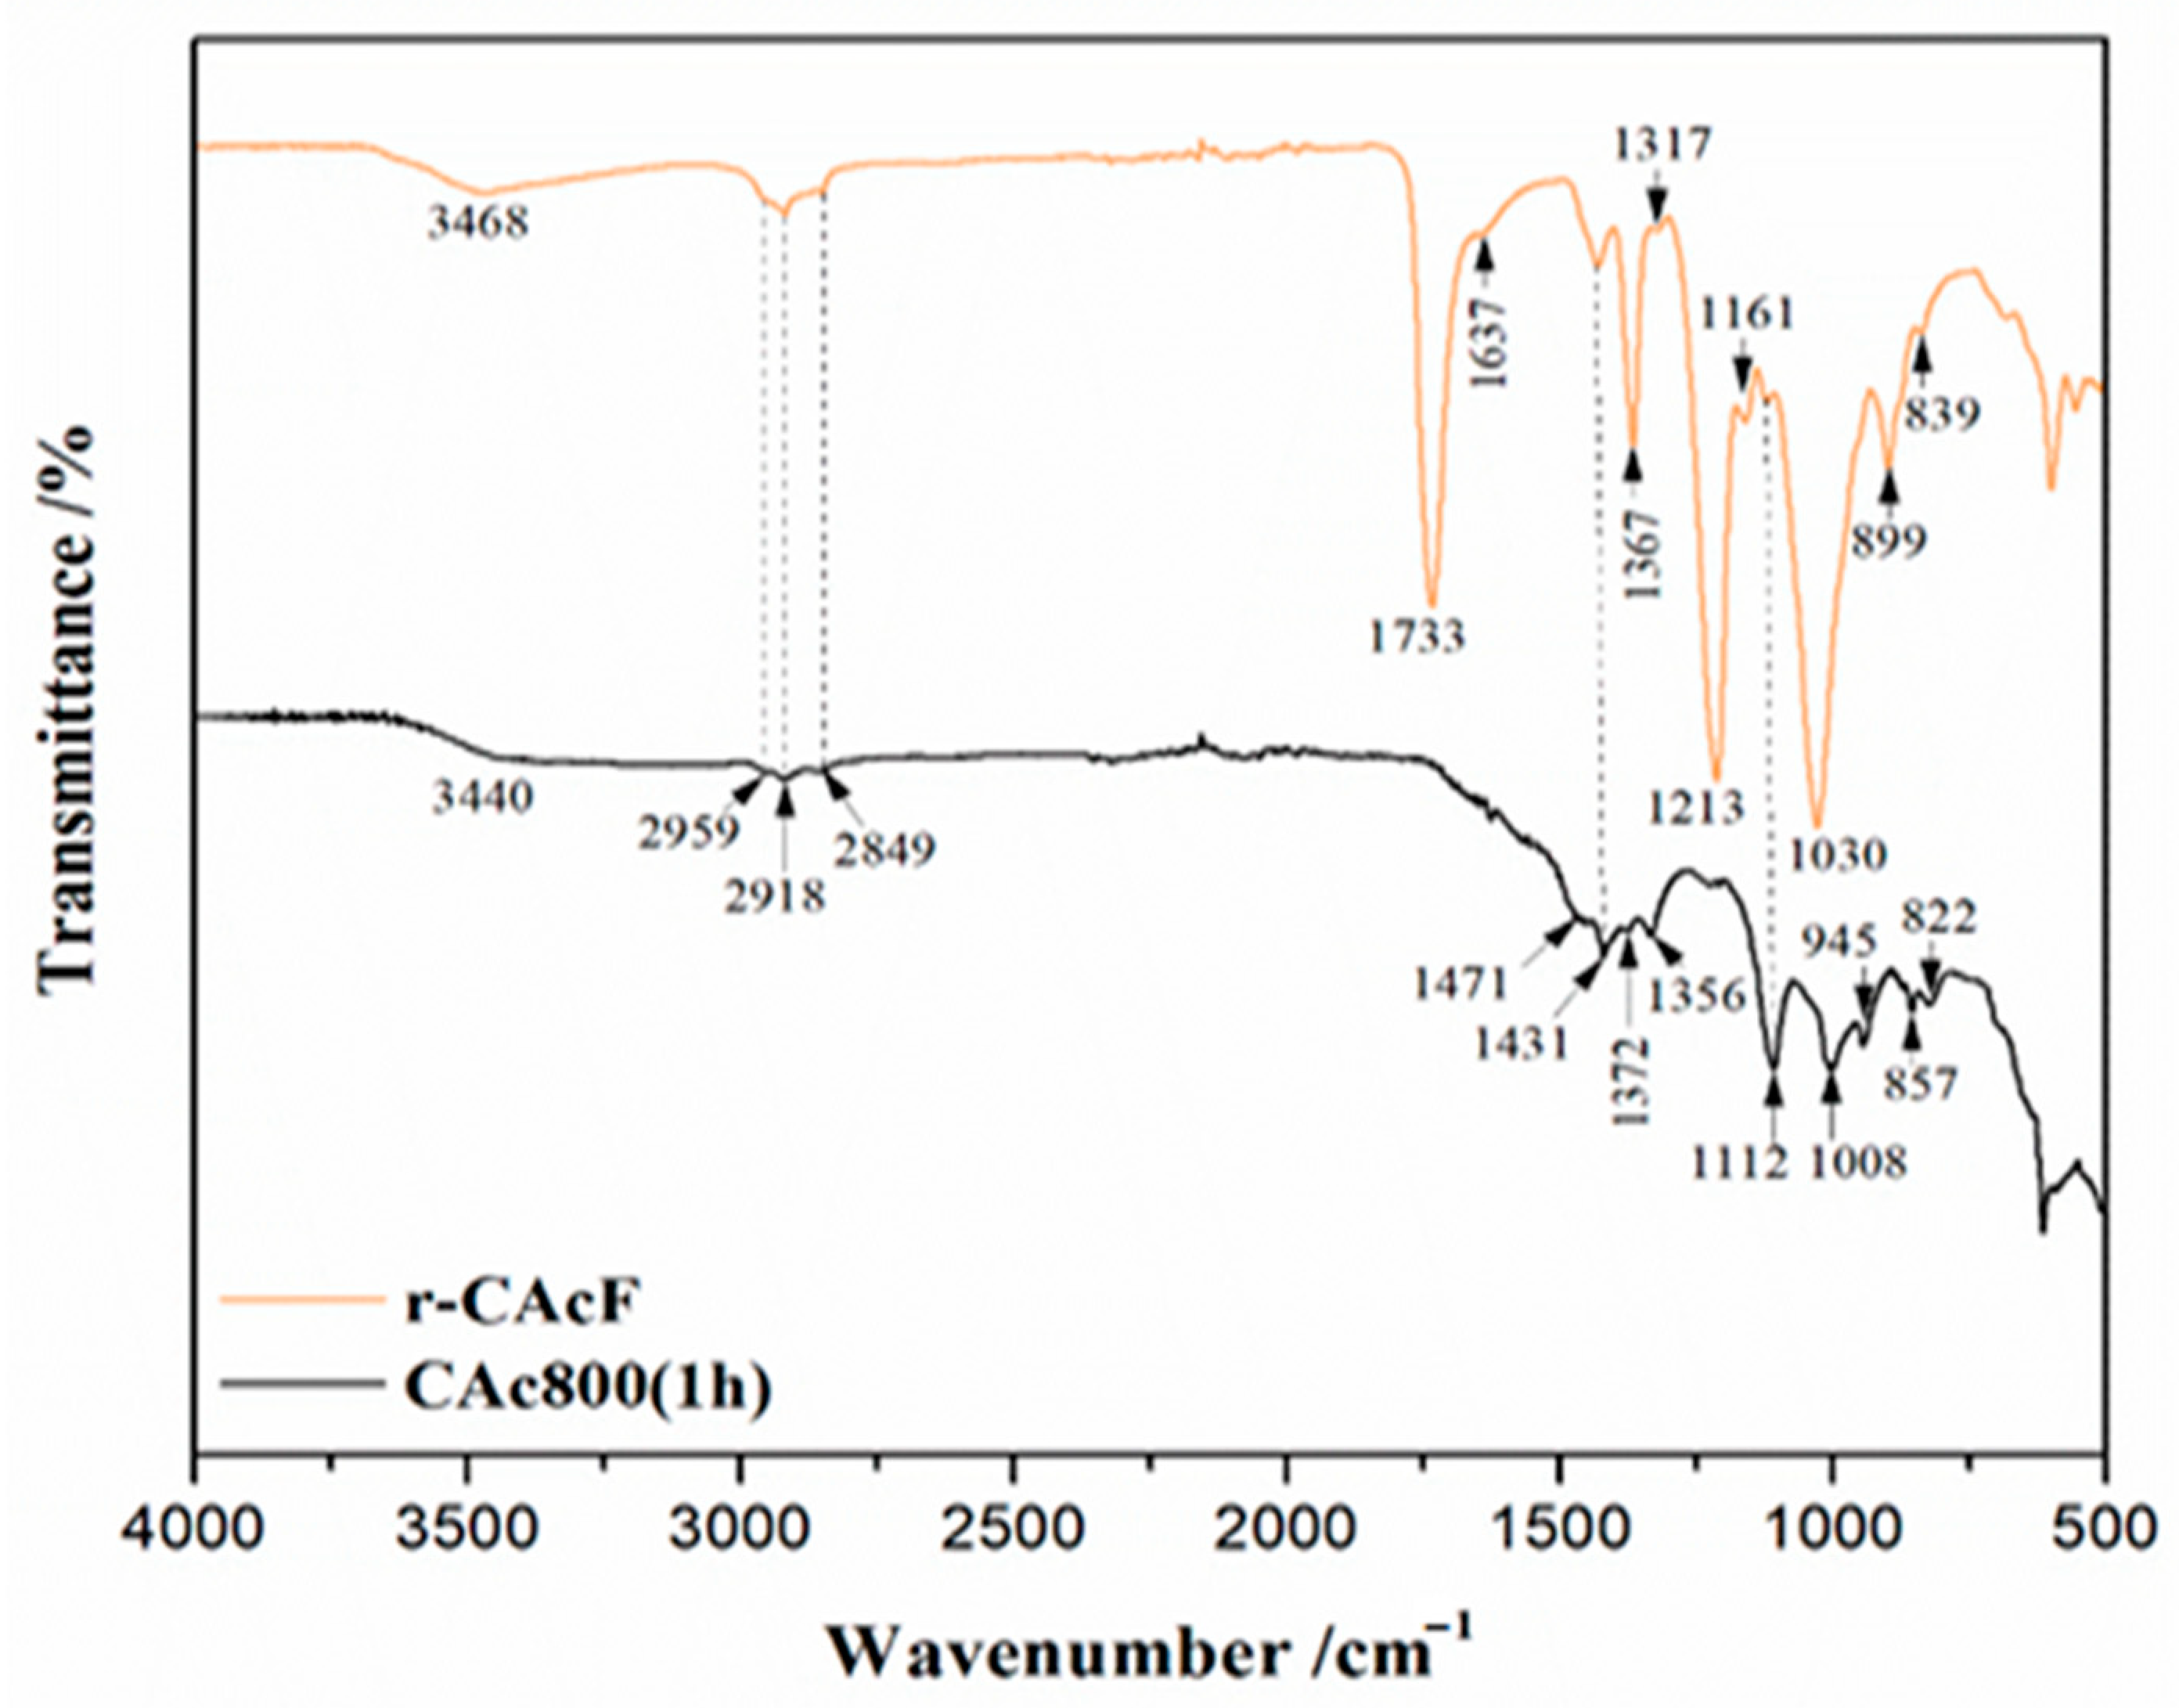
3.1. FTIR Results of Precursor (r-CAcF) and Carbonized Sample (CAc800(1h))
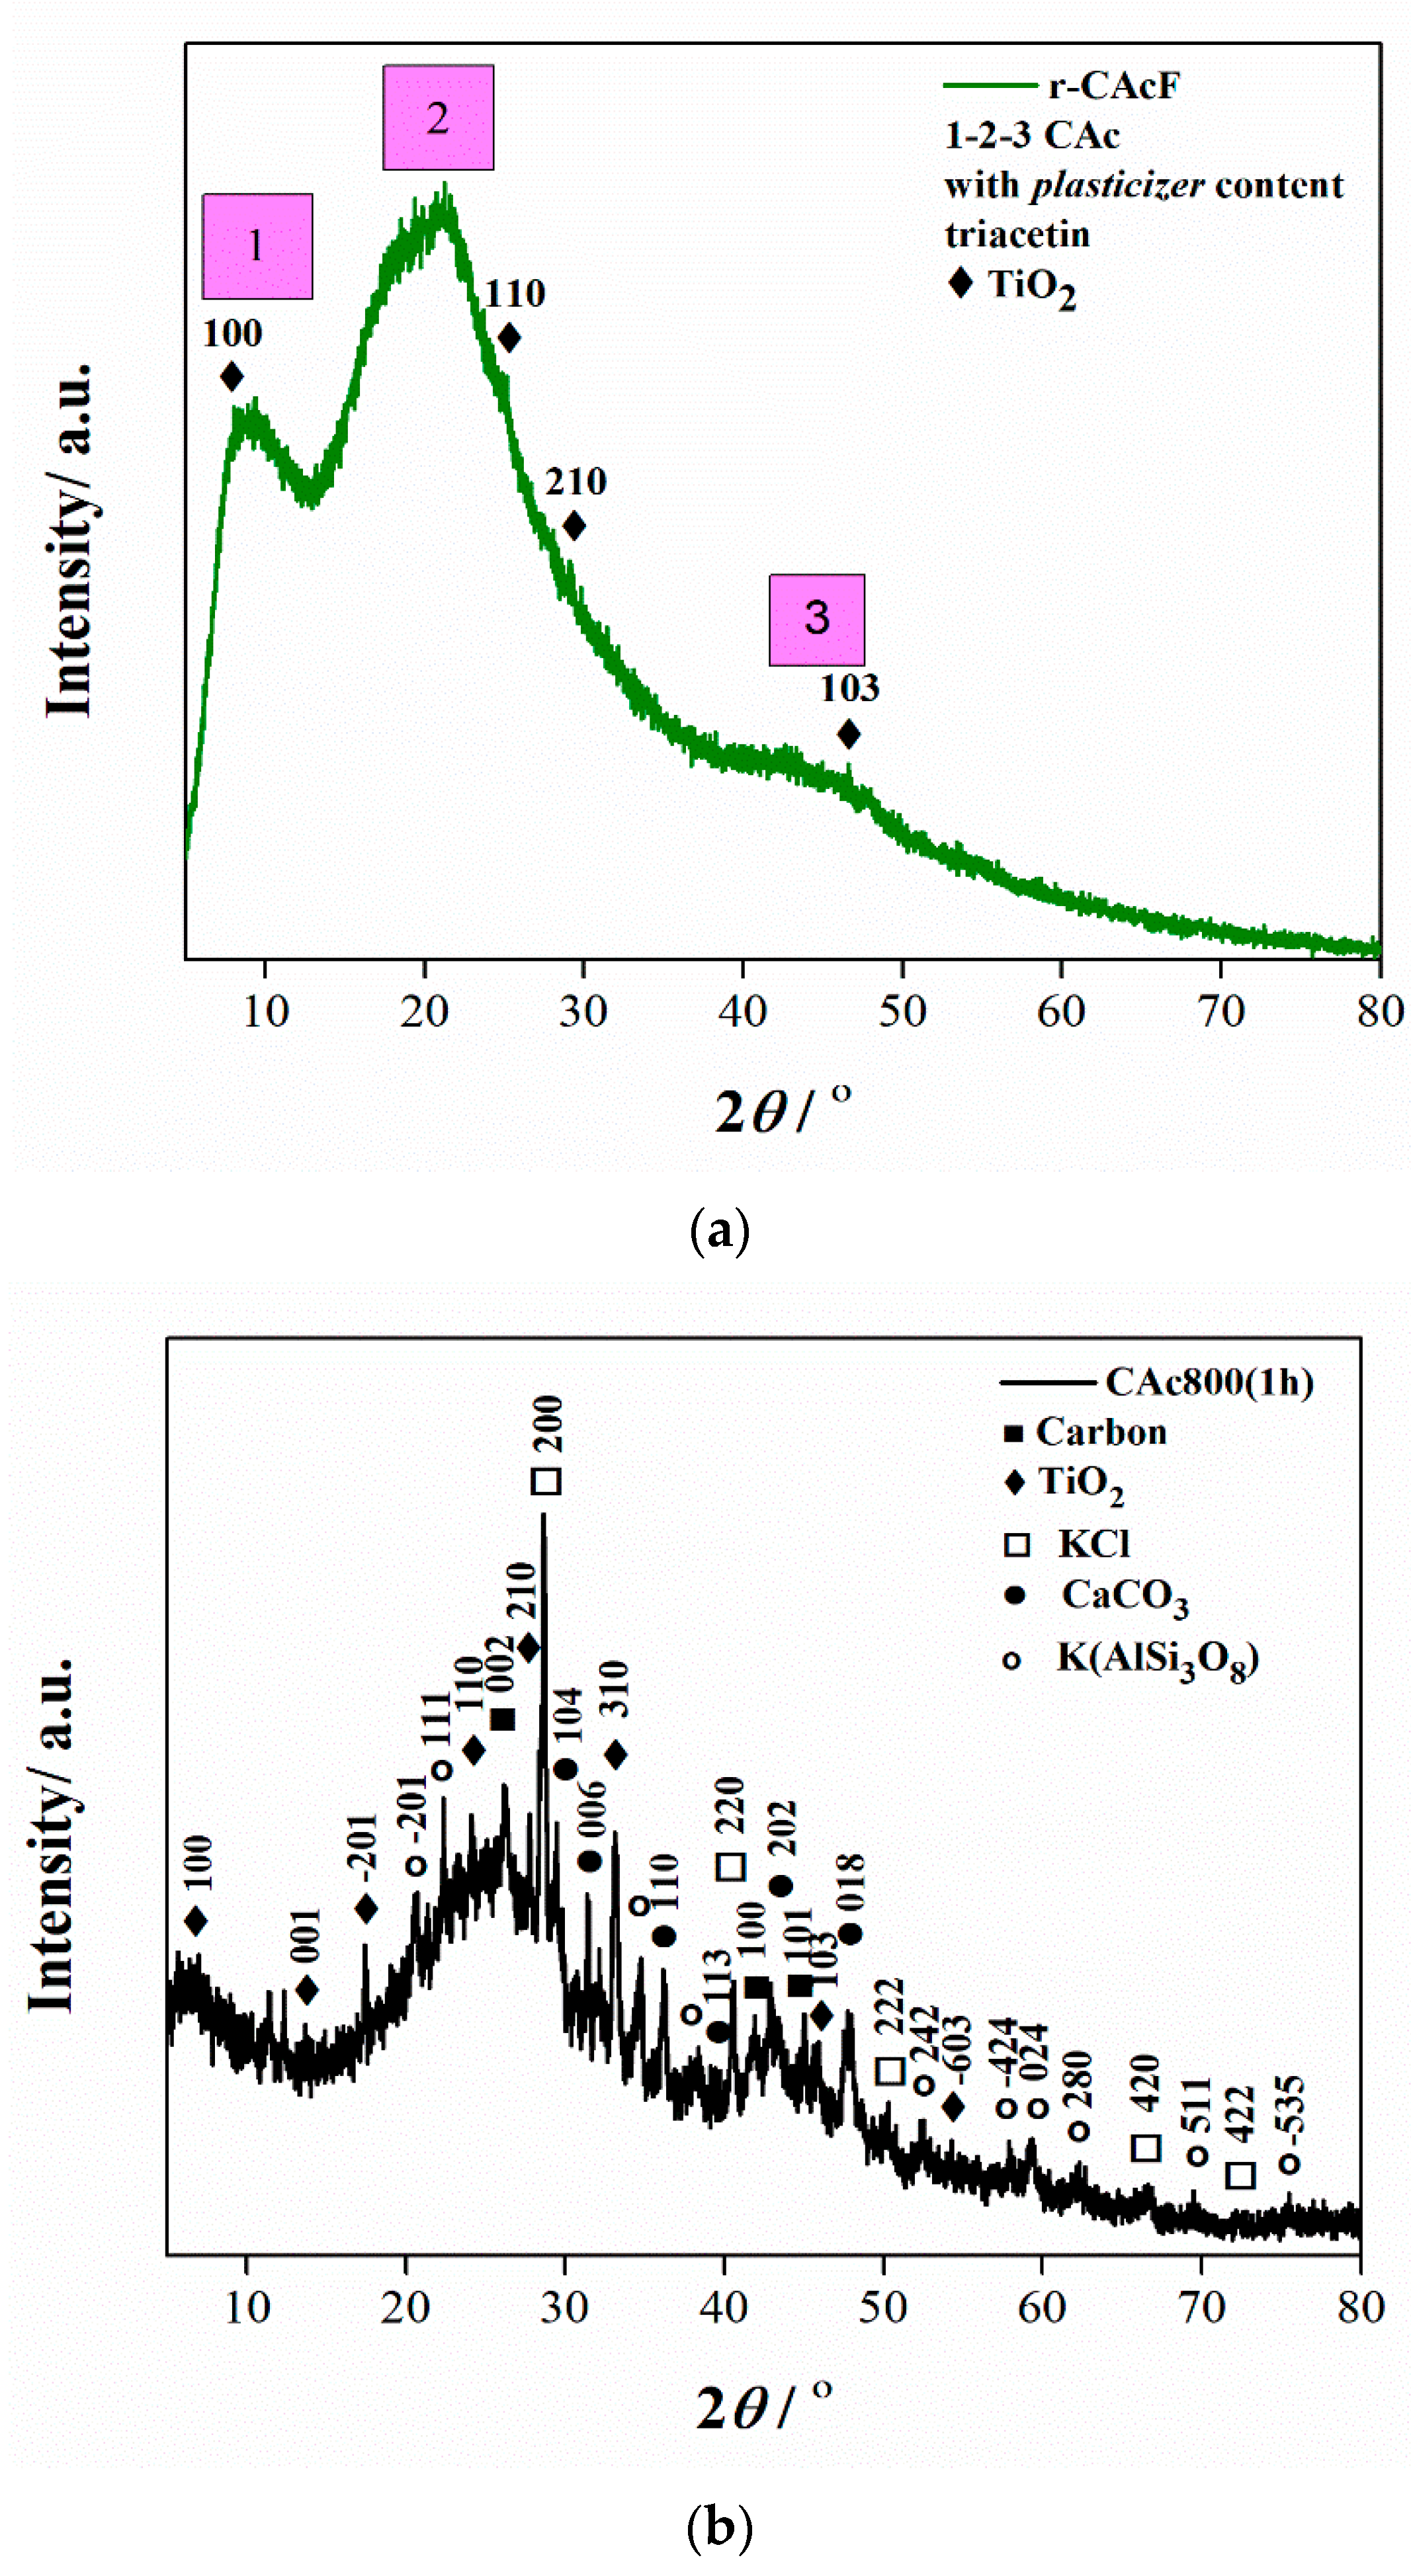
3.2. XRD Results
3.3. Thermal Stability of r-CAcF and Kinetic Analysis of Pre-Carbonization Stage (Devolatilization/Pyrolysis Kinetics Modeling)—Micro-Scale Experiments
3.3.1. TG-DTG-DTA Results
3.3.2. Determination of the Glass Transition Temperature (Tg) by the DSC Testing Probe
3.3.3. Thermal Stability and Devolatilization Indexes
3.3.4. Kinetic Analysis of Devolatilization Process
3.3.4.1. Model-Free (Isoconversional) Results
- (a)
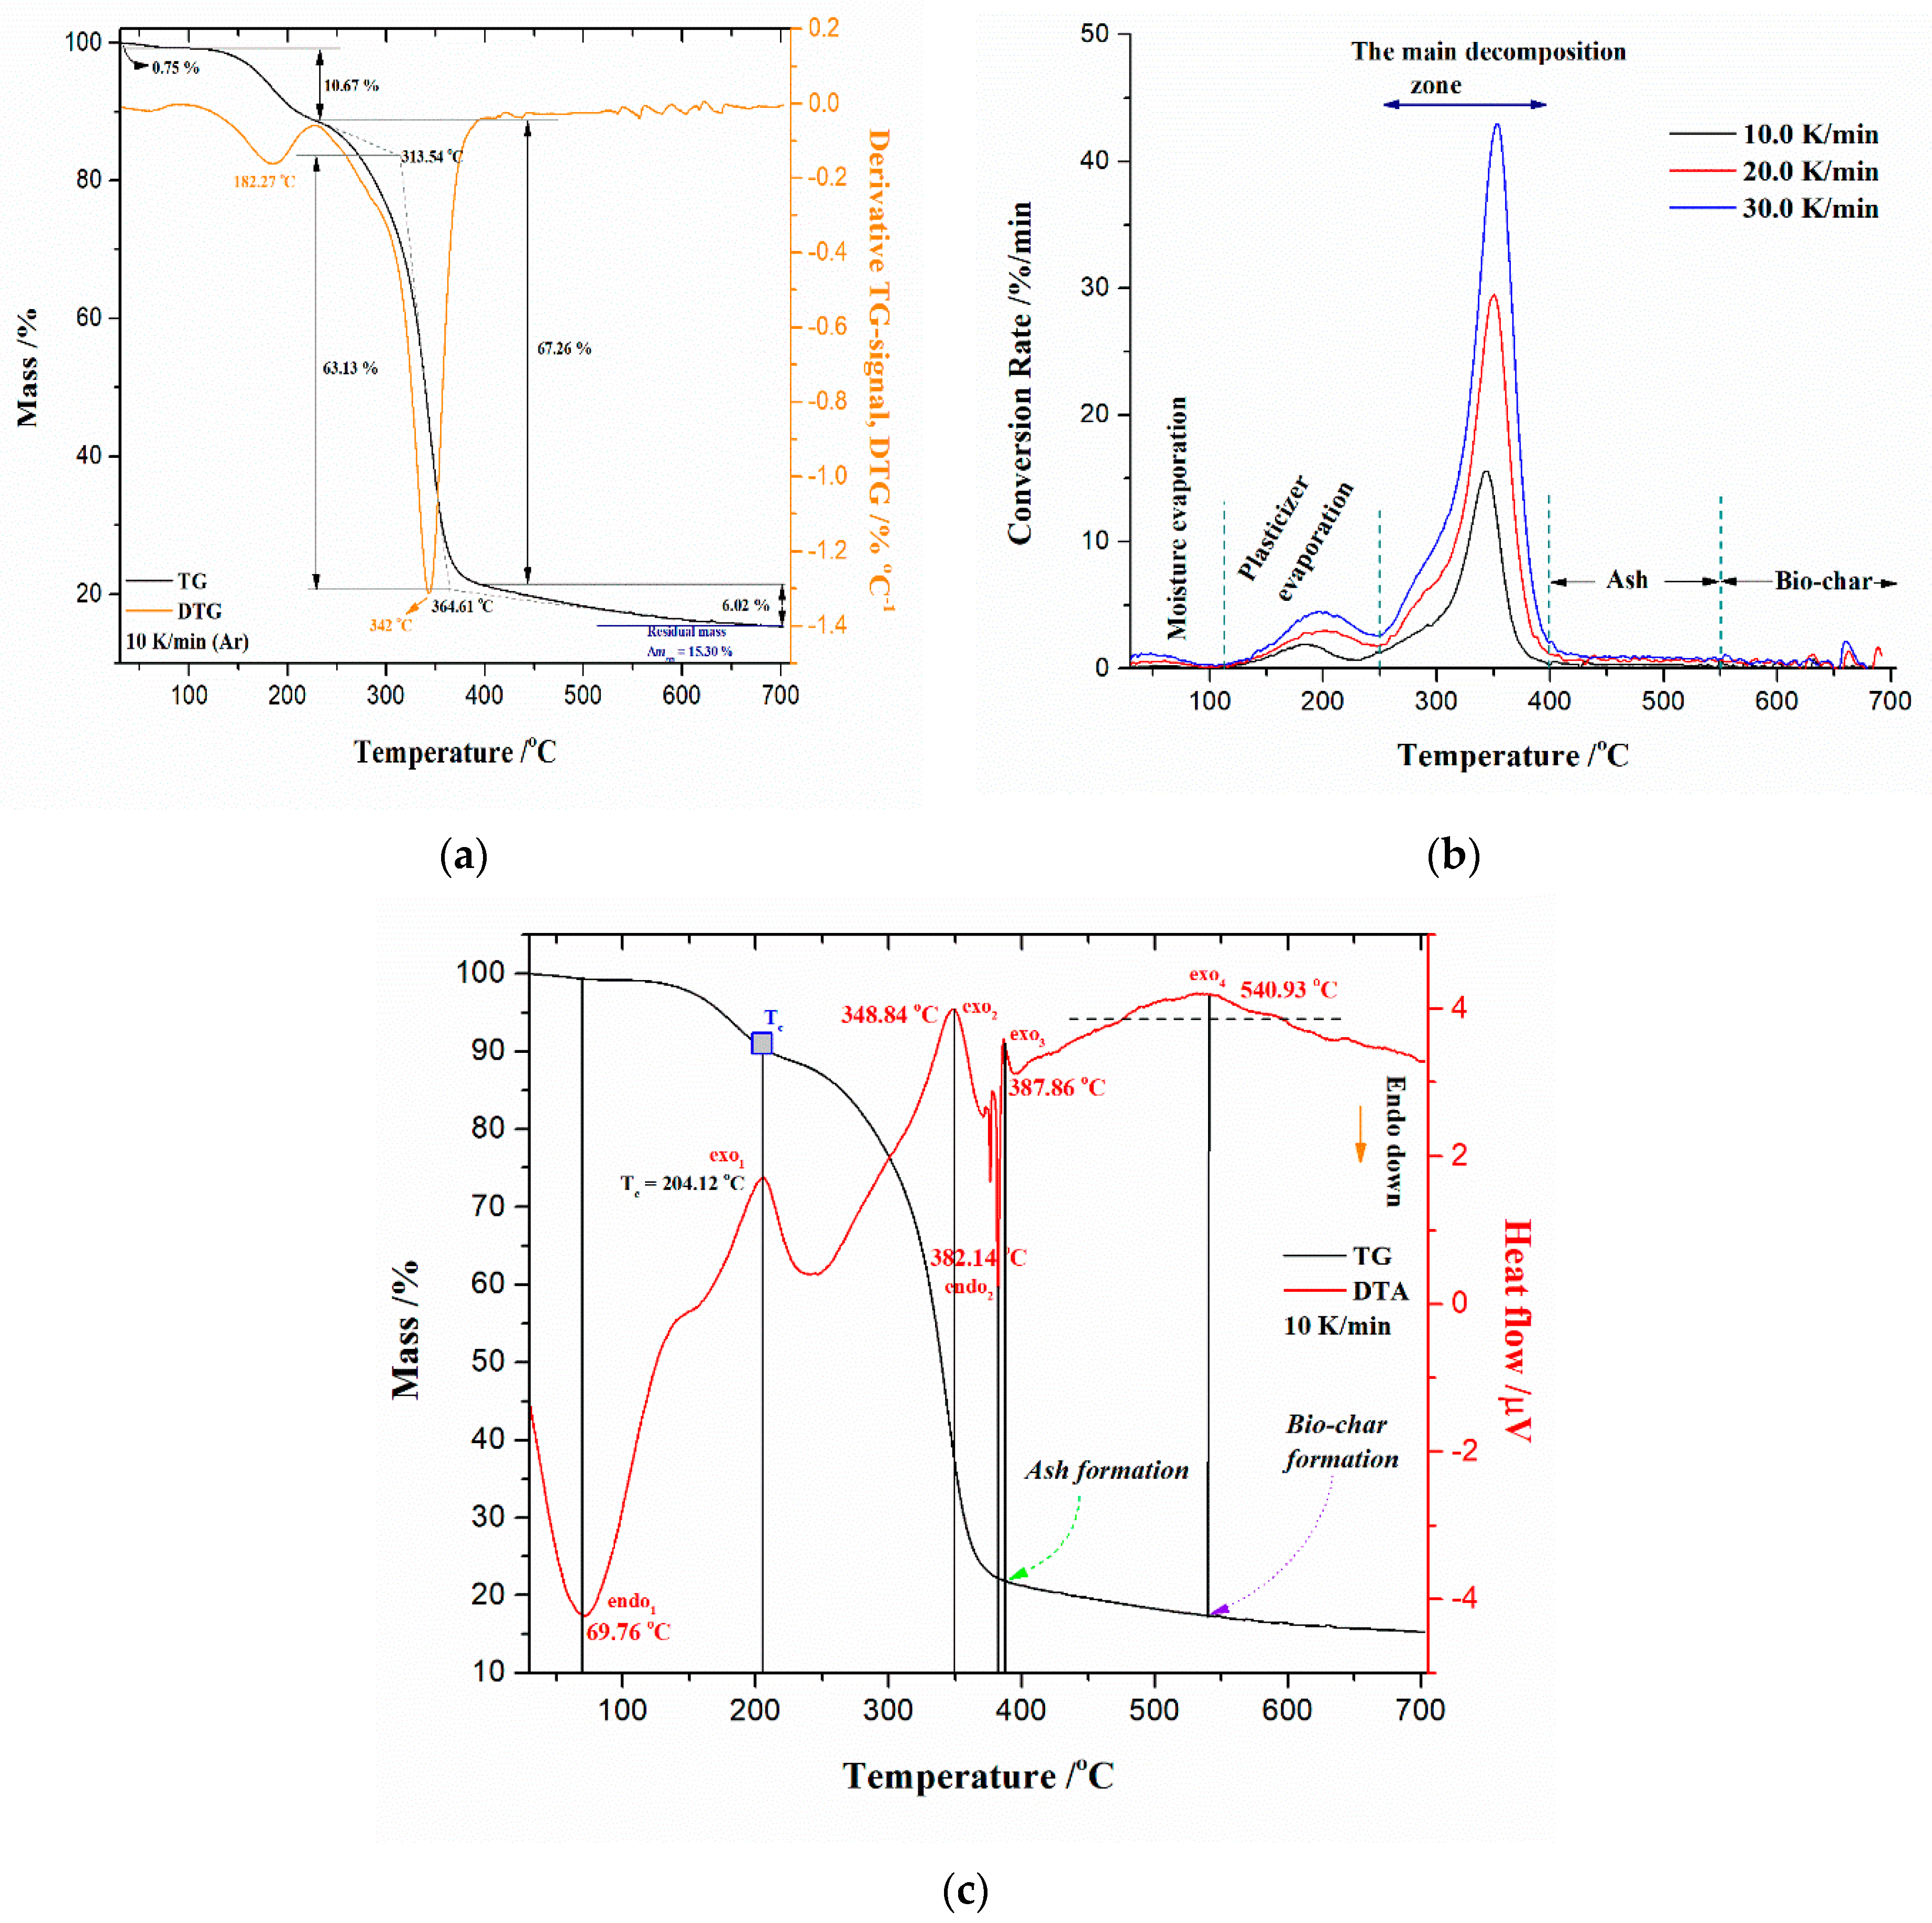
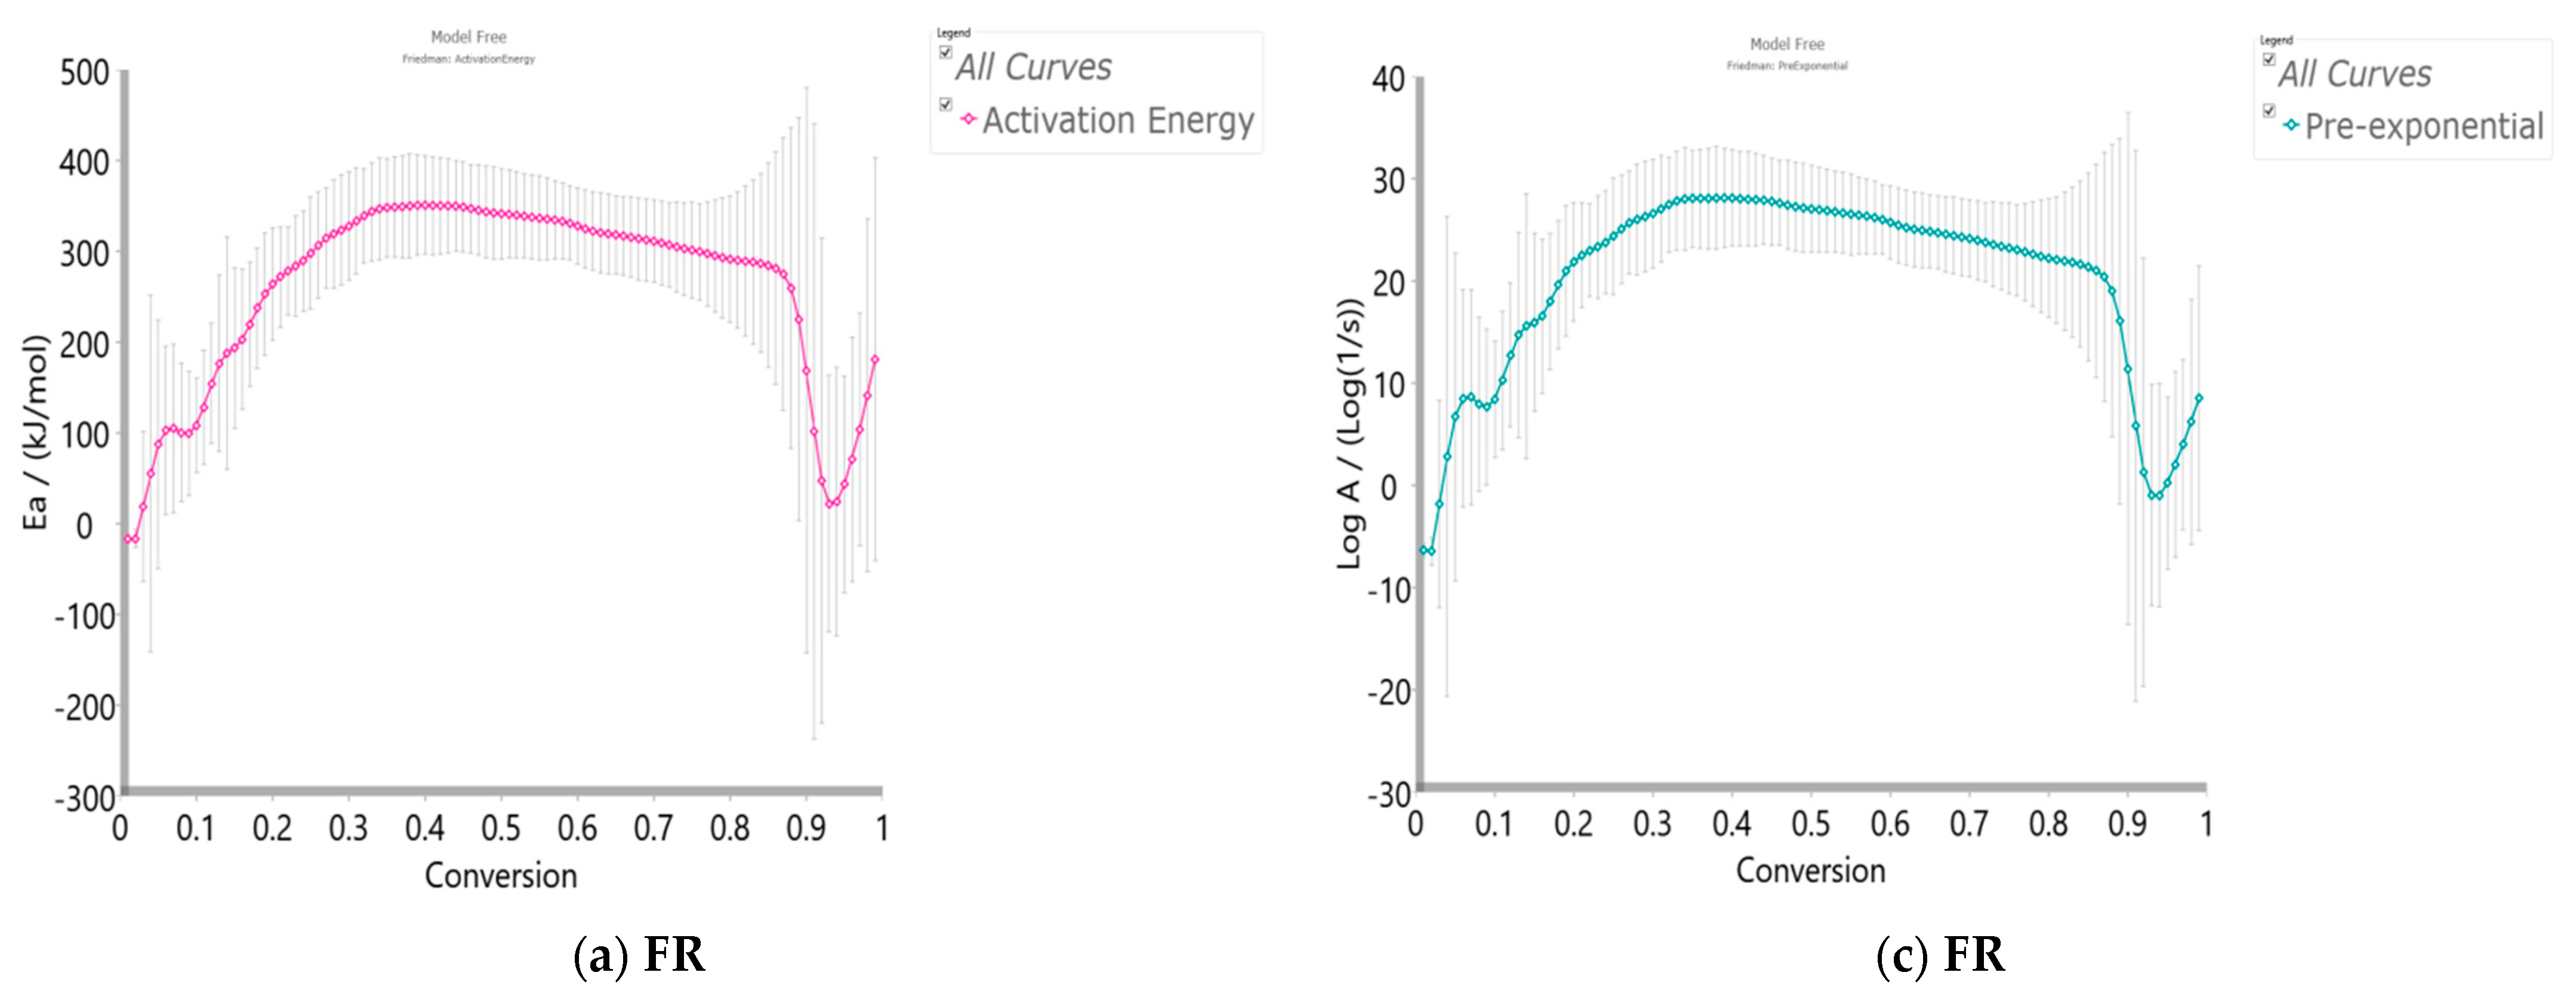
- At the very low conversion values (α = 0.01–0.02; ΔT = 76.66–133.77 °C), extremely low negative values of both Ea and logA were identified (Figure 5a–d). This behavior is not uncommon, considering that the surface binding moisture was released very quickly and there is almost no real potential barrier, which follows from an important fact: the first endothermic event visible at both, the DTA curve (Figure 4c) and the DSC curve (Figure S2) corresponds to water desorption. Namely, this event occurs at different temperatures depending on the degree of substitution (DS) of the sample. The variance in values of the desorption peak in polymers can be explained by the different water-holding capabilities and polymer-water interactions. Results clearly show that our sample with high DS has a low value of the desorption temperature (from Figure 4c, it is 69.76 °C, while from Figure S2, it is even 27 °C). By means of acetylation, the OH groups are replaced by the acetate groups, preventing the strong interaction of the hydroxyl groups present in the CAc chain via hydrogen bonds. In this way, the residual moisture seems to be isolated and leaves the system very quickly, without the existence of any energy barrier to slow it down. In contrast, for pure cellulose, these interactions would be exceptionally intensive.
- (b)
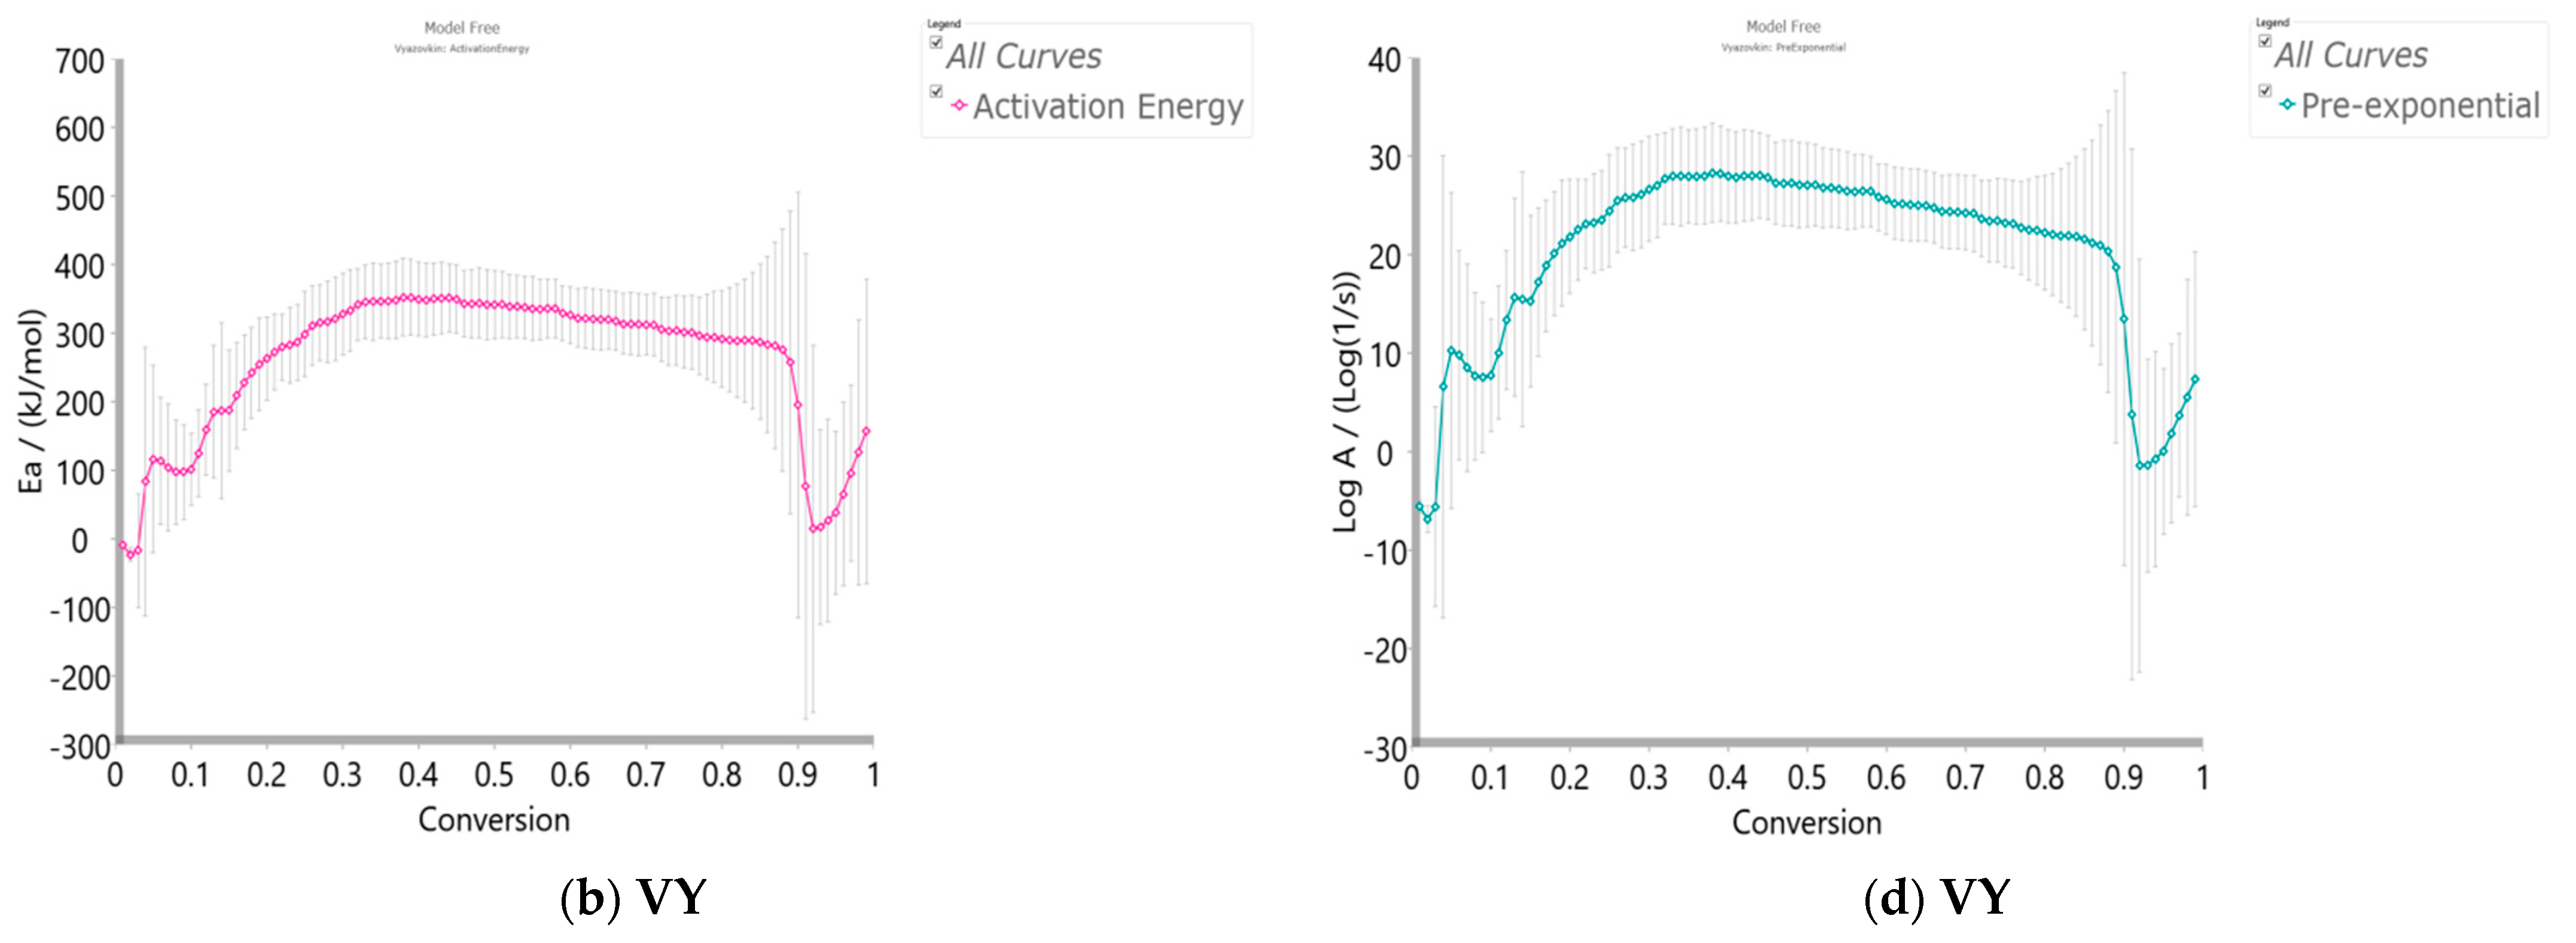
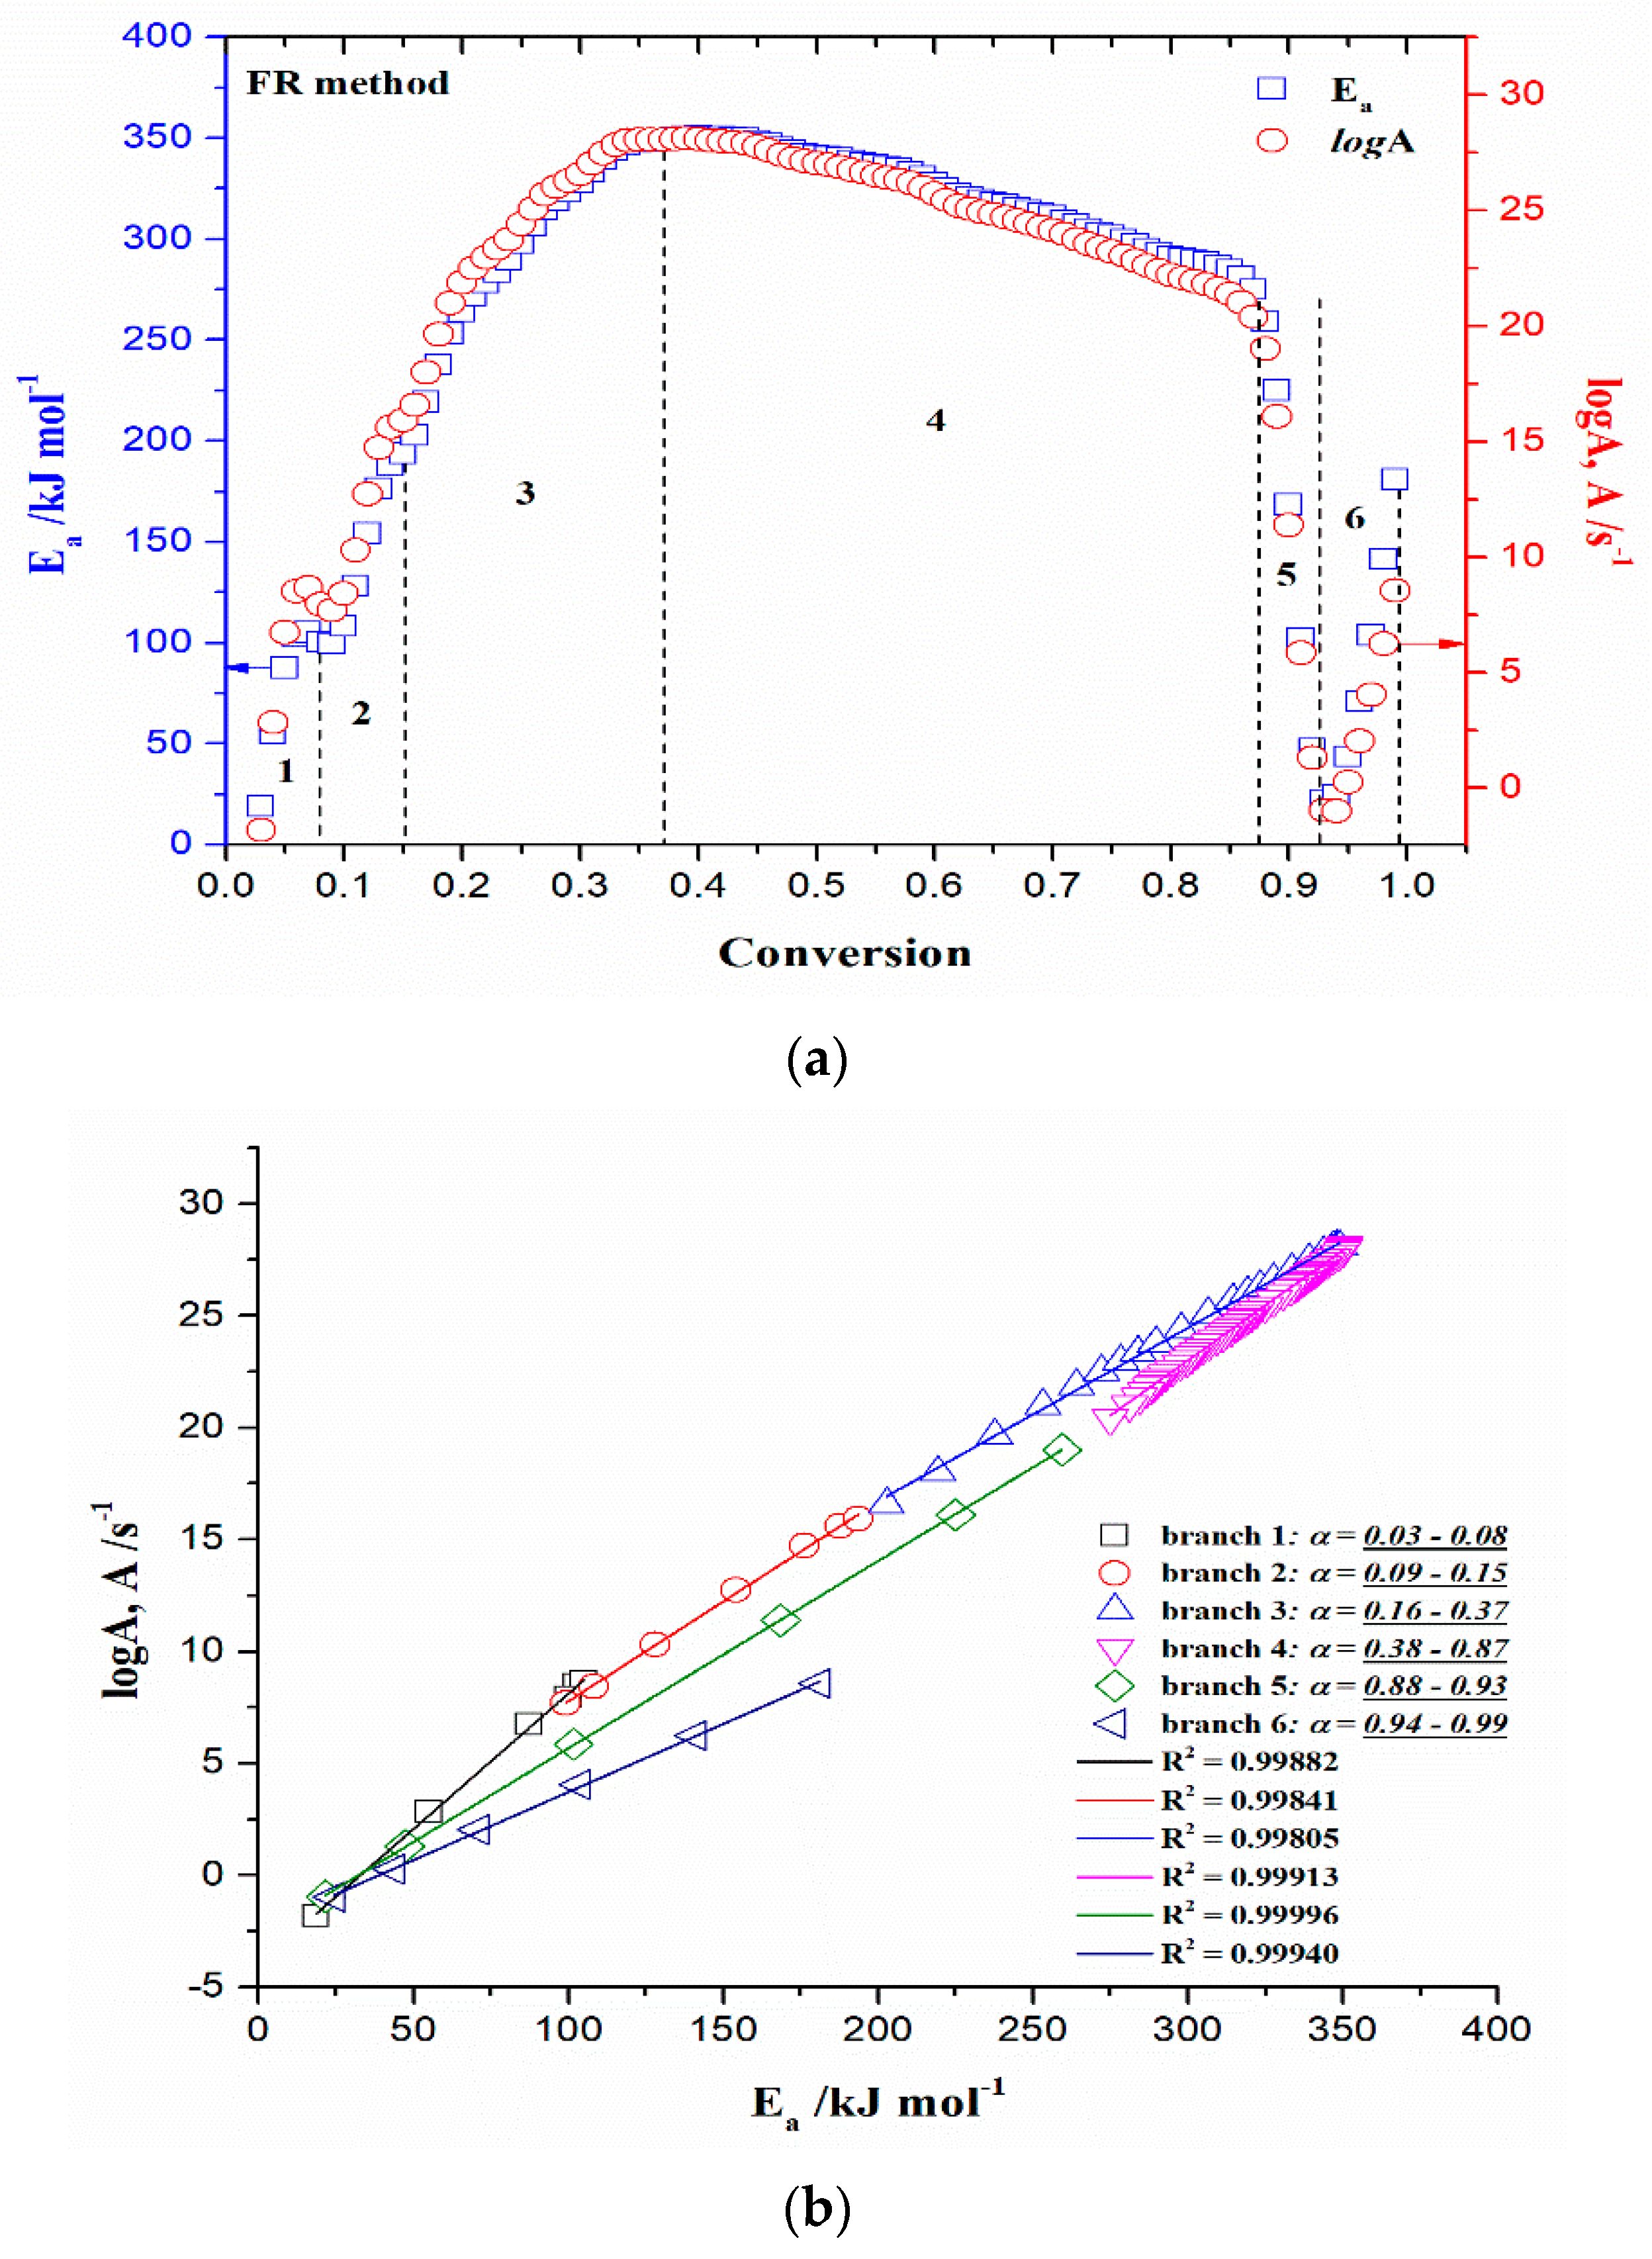
- With an increase in conversion and temperature (α = 0.03–0.08; ΔT = 147.46–185.20 °C), we enter the reaction zone, where the decomposition of the plasticizer takes place. In this conversion range, the Ea value (considering the FR method (Figure 5a)—a similar situation is valid for the VY method), increases from 18.685 kJ/mol to 100.054 kJ/mol, whereas for TA (triacetin) plasticizer, the activation energy for its evaporation is found to be 65.12 kJ/mol [67]. It should be mentioned that exposure of TA in CFs to the present metals may lead to a significant change in the rate-limiting steps of gas-phase decomposition of TA, turning them into an autocatalytic scenario while lowering the nominal activation energy and changing the barrier height;
- (c)
- By elevating the temperature and conversion values (ΔT = 189.31–250.66 °C, α = 0.09–0.15), it enters the reaction zone for obtaining the pyrolysis products from the thermal decomposition of TA, which takes place intensively in the gaseous phase. In the actual case, the activation energy increases from 99.311 kJ/mol up to 193.66 kJ/mol. The possible reaction pathway involving the decomposition of the TA structure is the one that represents triacetin decomposition by elimination of the acetic acid [68]. The energy required for this disruption amounts to 192.9 kJ/mol [68], which is in agreement with our results (Figure 5a). In such a reaction scheme, acetic acid can be eliminated from TA, forming prop-1-ene-1,3-diyl diacetate (note: this compound may exist in two stereoisomers (cis and trans)). However, this intermediate can further react via internal rearrangement of prop-1-ene-1,3-diyl diacetate into 2-formyl-3-oxobutyl acetate, with an Ea value of 202.09 kJ/mol [68], where in our case, this value corresponds to the Ea value of 202.702 kJ/mol at α = 0.16 (~254.61 °C). Also, it is possible that the intermediate decomposed into acetic anhydride and acrolein (acrolein is a notorious air pollutant) [69], with slightly higher activation energy (210.04 kJ/mol) [68]. For our data, it is the value of Ea = 219.265 kJ/mol at α = 0.17 (~261.16 °C);
- (d)
- The next reaction zone includes the thermal decomposition of the cellulose triacetate (CTA) (approx. from α 0.16 to α 0.37 for the temperature range of ΔT ~254.61–319.25 °C), including a raise in the activation energy (Ea) from approx. 202.702/219.265 kJ/mol up to 349.922 kJ/mol (Figure 5a). Since those acetate groups can make the cellulose more stable, this requires higher energy input in order to remove them from the cellulose skeleton, so we have an increase in activation energies. Unlike cellulose, in the case of CTA, the presence of acetate substituents may influence the course of decomposition considerably by blocking the formation of 1–6 glucosan linkages. It was found that as the DS value increases, the activation energy increases progressively, requiring higher energy input to start the deacetylation process [70]. It is most probable that the first acetate group to be removed from a particular ring unit will be attached either to positions C2 or C3. If the elimination of the first acetate group was followed by the elimination of that attached to position C6, a peripheral olefinic linkage in the 5,6-position would be formed, which, being outside the ring, would not necessarily confer its instability. At this stage, we can assume that the elimination of acetate groups takes place without the disintegration of the ring unit;
- (e)
- The next, slightly wider reaction zone of the change of Ea with conversion (α) encompasses α range between α = 0.38 and α = 0.87 (ΔT = 320.51–363.07 °C), where there is a gradual decrease in the activation energy value, from Ea = 350.603 kJ/mol to Ea = 274.857 kJ/mol (Figure 5a). This phase probably includes thermally induced reactions on the skeletal chain segment via the chain-scission process. In the initial stage of this process, the tar formation may dominate, including an appearance of some kind of unsaturation arising from the loss of acetate substituents (the previous stage), which is a necessary precursor to the chain-scission process in CTA. In this case, it is most likely that the scission of β(1→4) glycosidic bond (the glycosidic scission) [71] between two rings may give 1,2-unsaturated species, which can react with phenylhydrazine molecules (formed within the tar fraction) [72]. In this case, the formation of a stable product is expected over the double bond shift and a hydro-ring closure;
- (f)
- With further intensification of the process, in the conversion range of α = 0.88–0.93 and ΔT = 364.29–401.22 °C, there is a sudden drop in the activation energy value, from approx. Ea = 259.279 kJ/mol up to Ea = 21.664 kJ/mol (Figure 5a). In this phase, there is the formation of carbonaceous residue. Namely, in this reaction zone, the chemical fragment formed by the scission process on the glycosidic bond would probably be an oxygenated species, such as pyrylium (C5H5O), where the decarbonylation reaction dominates (releasing CO gas) [73]. These transformations probably occur above 360 °C and terminated an extensive mass loss stage in the decomposition process (Figure 4);
- (g)
- At the very end of the decomposition process above α = 0.93 (T > 402 °C), there is an increase in the activation energy value (from Ea = 24.245 kJ/mol up to Ea = 180.950 kJ/mol (at α = 0.99)). The reason for this behavior lies in the fact that secondary decomposition of tarry material occurs, which also significantly contributes to the formation of the residue. We can assume that oxygen is present in the condensing species, so the solid residue has such features as non-graphitizing material. This can be clearly seen from the XRD analysis presented in Figure 3b for the carbonized sample, considering the appearance of planes (002), (100), and (101).
3.3.4.2. Model-Based (Model-Fitting) Results
- (a)
- The consecutive reaction steps occurring via Equation (14), include the r-CAcF pyrolytic stage in the temperature range of approximately ΔT 30–260 °C, where the reaction step 3.1 is described by Nakamura crystallization kinetics, with a concentration equation in the form:where A is the pre-exponential factor, n is the Avrami dimension parameter, U* is the activation energy of the segmental jump (the activation energy necessary for the macromolecules to diffuse to the crystal phase in the melting state) (this parameter has universal value of 6.300 kJ mol−1), (Tg − 30) = T∞ represents the hypothetical temperature below which the molecular chain ceases motion, which is commonly defined as (Tg − 30) (K) (taken 30 K below the glass transition temperature, Tg), KG is the nucleation parameter (in a function of the surface free energy; represents an activation energy of the nucleation for a crystal with the critical size), which relate to the fold and lateral surface energies. In the second exponent term on the right-hand side of Equation (15), there are marking terms that must be disclosed, such as ΔT = Tm − T which represents the undercooling, while f = 2T/(T + Tm) is the correction factor [80].The Nk (Nakamura) reaction model contains a combination of the Avrami nucleation model inside the Arrhenius behavior, and non-Arrhenius behavior expressed through the Lauritzen–Hoffman (L-H) nucleation theory. Since Equation (15) has two exponents, the temperature dependence of the growth rate is obviously non-Arrheniusian. The proposed kinetic model can be expressed in the general rate–law equation form via conversion (α) quantity (Section SI, Supplementary Materials), such as:where this model is approximately defined for the temperature range between T∞ and Tm. The non-Arrhenius approach based on the Hoffman–Lauritzen theory works for the complete crystallization range, where the temperature-dependent rate constant K(T) may involve the rate constant in the form K(T) = A·exp(−Ea/RT), which obeys the Arrhenius approach, with even negative values of the activation energy (Ea < 0) (works in the small T-range, below a melting temperature).If we look at the experimental heating temperature range of the examined sample, which is approximately between 30 °C and 260 °C, and consider results from the model-free analysis, the above-established model encompasses water desorption, plasticizer initial vaporization, formation of plasticizer decomposition products, as well as parts of the deacetylation process (items under (a), (b), (c), and (d) in Section 3.3.4.1). In that case, kinetic parameters obtained from model-free analysis but related to the actual interpretation of the proposed kinetic model in the considered T-range should be taken as apparent, as should the parameters related to the Arrhenius approach, because it is limited in the small temperature range, just below melting temperature (as if we were to observe that part of the process under isothermal conditions). Consequently, Nk parameters listed in Table 3 for reaction step E → F, can be considered to have their own effective values independent of those from the model-free analysis.In the current state of the process, considering reaction step E → F, in the case of plasticized CAc, it should be assumed that there is a two-phase system, namely, a CTA-rich phase and a plasticizer-rich phase. The volume fractions of separated phases can be strongly related to the plasticizer content of the CAc system. Since CAc represents a semi-flexible polymer, it has a large persistence length. Consequently, it may be that a specific concentration fluctuation exists, which can be related to the main cellulosic chain; apropos, the plasticizer is expelled from a localized CAc-rich domain, e.g., the bundle of cellulose chains, and then dispersed in another localized domain because of the main chain behavior. The final result can be linked to a degree of plasticizer expulsion. Namely, if the plasticized CAc is a partially miscible system, then the phase domain will be either a CTA-rich phase or a plasticizer-rich phase. We previously ruled out this possibility based on the observation of results in Section 3.3.2, supposing a heterogeneous dispersion of components. Based on the higher DS value (~2.8), it can be assumed that the present amount of plasticizer improves segmental mobility substantially, making crystal perfection and the formation of new crystals easier, favoring the crystallization process. Hence, in the above-indicated temperature region, the development of crystallinity in thermally treated CTA induced by plasticizer can be expected.The reaction step E → F within the consecutive sequence described by Equation (14), can be attributed to the isophase transitions of cellulose occurring below thermal decomposition temperature [81]. These transitions depend on the estimated glass transition temperature values. Namely, it was also found here as the “second” Tg value (Tg = 10 °C (Table 3)), which differs from the experimentally confirmed value (Tg = 182.68 °C (Figure S3)), and its determination was difficult because it is outside the given experimental range, so it was founded theoretically. This is to be expected because linear amorphous polymers with a simple structure typically have one glass transition temperature, but polymers with complicated structures can have multiple isophase transitions. In a concrete situation, these transitions are linked with abrupt changes in the relaxation state of non-crystalline domains. Considering these facts, we have two Tg’s, one located at Tg = 10 °C and the other located at Tg = 182.68 °C, both below the expected temperature of the thermal decomposition. This “second” Tg value is typical for a plasticized cellulose derivative sample. With an increase in plasticizer content (wt.%), the Tg can be drastically lowered. The detection of isophase transition can be performed through the ratio Tg/Tm = 0.66 [82,83], connected to the cellulose macromolecule. In our case, the ratio of Tg/Tm = 0.71 was obtained (deviation for 0.05), which is the characteristic value for cellulose derivative, so Tg = 182.68 °C represents the primary glass temperature (Tg1) for the r-CAcF sample. For pure cellulose, this glass temperature lies in the range of 217–227 °C [84]. For cellulose, this refers to the primary α1 glass transition [85]. In the actual case, the “second” Tg (Tg2) occurs at a much lower temperature, indicating the strong plasticization effect of triacetin (TA), which is manifested via an important decrease of Tg2. So, the decrement of Tg’s (ΔTg) is very important in the DS series with a higher value of the degree of substitution and a high content of plasticizer.In the considered situation, with a significant increase in the plasticizer amount, the probability of the occurrence of α transition (α-relaxation) is extremely large, moving it towards lower temperatures [51]. Therefore, the considered step E → F can be attributed to the glass-to-rubber transition of the sample, and it is linked with motions of the CTA-rich phase in a partially miscible system (so, anyway, the partially miscible system is not excluded (Section 3.3.2), because there are two Tg’s (for TA (wt.%) ≥ 40%)). The occurrence of Tg at low temperatures for plasticized CAc sample (Tg ~10 °C) is proof of α transition phenomenon, which may suppress β-transition [52].Considering parameters in Table 3 for the Nk model, there is a negative value of KG making the second exponential term in Equation (16) (the nucleation term) increase (the nucleation control during transformation), where Avrami’s dimension parameter of n = 0.404 suggests the one-dimensional growth of nuclei, controlled by diffusion (primary crystallization). This event may occur at temperatures up to T ≈ 150 °C, where the influential presence of the plasticizer can accelerate the dynamics of CTA crystallization (CTA nucleation is influenced by the presence of plasticizer acting as “diluent” for the CTA-TA blend). It should be noted that nucleation is an initial step in this process, in which crystalline structures begin to form within the polymer matrix. It is a crucial step in the crystallization process because it determines the number and size of crystalline domains that will form. Crystalline domains are regions within a material that are composed of regularly arranged and organized molecules. The number and size of these domains can dictate the properties of a given material. When nucleation is the rate-determining step, the activation energy is expected to be negative (Table 3). This is because the nucleation rate is sensitive to undercooling (the difference between the temperature of the polymer and its crystallization temperature), and the activation energy for nucleation is typically lower than that for growth.In addition, within the spherulites growth process, the presence of metal particles in the r-CAcF sample could act as the nucleating center of CTA and create crystal interfaces, which reduced the spherulite nucleus size and accelerated the crystallization process of CTA. The negative and large value of the nucleation parameter (KG) (Table 3) supports the presence of metal particles, reducing the energy needed to create a new crystal surface and accelerating the crystallization rate of CTA. However, if the amount of metals present in the r-CAcF sample is large, then the particles can easily produce aggregates (they aggregated together), thus reducing the number of nucleating centers and new crystal surfaces, which can have a certain inhibitory action on the crystallization process. On the other hand, logA has a negative value (=−1.233), giving a negative sign over the entire right-hand side of Equation (15) (and also Equation (16)), so this quantity may control the temperature dependence of the nucleation rate, related to structural dynamics. In that context, the overall crystallization rate then decreases with temperature, so as the temperature progresses, the concentration of the “crystallized” product (intermediate “F” (Equation (14))) can decrease. Consequently, this negative value is in agreement with the anti-Arrhenian behavior observed for melt crystallization, i.e., the crystallization rate decreases with an increase in temperature [86]. Therefore, the Ea—conversion dependency obtained with the model-free isoconversional methods (Figure 5a,b) is close to the calculated data for the next reaction step (F → G (Table 3)), but some discrepancy for the E → F step is attributable to an additional mechanism, which is not taken into account in the Lauritzen-Hoffman (L-H) theory (this additional mechanism represents n-dimensional Avrami’s nucleation and growth model (An)). Considering the reaction step E → F, the contribution of this step to the entire pyrolysis process of the r-CAcF sample is 7.3% (Table 3).
- (b)
- The next reaction in a consecutive series represents step 3.2 (Equation (14)), described by the phase boundary-controlled reaction and presented through the concentration equation in the form:This model represents changes in the crystallization mechanism, which is dependent on the temperature, elucidating the transition from a less ordered (usually called α’-transition) into an ordered crystalline phase (usually called α-transition). Namely, the first one is formed at lower temperatures (Tc < 204.12 °C), and the second one is formed at higher temperatures (Tc > 204.12 °C). Since the change in the crystallization rate can be generally correlated with the change in crystallization mechanism, in that case, an atypical depression of the crystal growth can appear on the occasion of this transition. Namely, the Ea,α – T dependence computed from the model-free (FR) approach (FR) (Figure 8) shows a break at the temperature near the critical temperature (Tc), indicating the assumption of the change in crystallization mechanism, very close to Tc. The observed Ea,α(T) variation is possible only when the parameter n (Table 3) is replaced as the fitting parameter, which is a function of temperature (n(T)). Only in that case, the combination of An + L-H models is valid for the physicochemical description of the previously considered reaction step (E → F).The transition that describes the previously analyzed reaction step (E → F) includes the transformation of cellulose I crystallites (described by the Nk (An + L-H) model (Equation (15)) (slower crystallization (impact of L-H linear growth rate) with less ordered crystallites)) into a more stable form, cellulose II, which has a more ordered structure (formation of ordered crystallites) [87]. This is described by the reaction model expressed in Equation (17). The actual process occurs rapidly (or ‘faster’) on the surface of the solid product. The reaction is controlled by the resulting reaction interface progressing toward the center. As the reactant (in this case, the “intermediate product” F (Equation (14))) is transformed, the crystal volume must grow at a rate proportional to the velocity of the phase boundary, raised to the power of dimensionality of the crystal growth (n = 3 (Equation (17)), three-dimensional shape). In the current case, the dimensionality of cellulose crystallites probably rises into the cylindrical features, which obviously indicates a change in the reactant particle sizes, and this will alter the transformation reaction rate. With the increase in the rate of transformation of cellulose I into cellulose II, the presence of alkali metals [88] and the deacetylation process can be strongly affected. This step is characterized by an activation energy of 101.876 kJ mol−1 (Table 3) (this value obtained by model-based analysis was marked in Figure 8 with a horizontal solid line). Considering the reaction step F → G, the contribution of this step to the entire pyrolysis process of the r-CAcF sample is 6.8% (Table 3). Confirmation of these transformations is shown by the results in Table 2, where negative activation entropies were obtained, indicating that a much more organized structure is formed. In this context, the reaction pathway described by the Equation (14) represents the synthesis route for the production of cellulose allomorph (cellulose II), where the main intrachain hydrogen bond represents an H-bond with O6–H•••O2 position [89]. The major driving force in the actual case represents the entropy, where, if we pay attention to the results presented in Table 2, the high negative values of ΔS° (for temperatures between 447.18 K and 471.63 K) affect the decrease in the values of ΔH°, because the higher the temperature, the greater the product T·ΔS° will be.
- (c)
- The single-step reaction pathway described by Equation (12) (step 1.1) is characterized by an n-dimensional nucleation model (Avrami-Erofeev (Table S1, Supplementary Materials)), through concentration equation in the form:which takes place in the temperature range of approximately ΔT ~260–400 °C, with kinetic parameters values of Ea = 335.470 kJ mol−1, logA = 27.079 and a dimensionality parameter of n = 0.339 (Table 3). The observed reaction step occurs in the high-temperature region, where the start of the parallel reaction step 2.1 (Equation (13)) also takes place in this region. These steps probably manifest a partial overlap in behavior. The reaction step described by the mechanism via Equation (18) can be attributed to the main decomposition stage, where the breaking of important bonds in the CAc structure occurs. In the above-indicated temperature range, the main decomposition of cellulose appears [90], where we have the largest mass loss of the sample (Figure 4).The An model indicates an “acceleratory” type of model, such as nucleation related to the scission mechanism. This mechanism includes the chain scission and volatilization of fragments to obtain gaseous products. The obtained activation energy (for the reaction step described by Equation (18)) of 335.470 kJ mol−1 was obtained (Table 3) and corresponds to levoglucosan (LG) production (~327.47 kJ mol−1 of absorption of the heat) according to the optimal pathway [91]. The mechanism involves the hydrogen atom of the C6–OH hydroxyl group transferring to the glycosidic bond in cellobiose, and the glycosidic bond cooperatively cleaves. At the same time, C6–O• connects to C1 to produce LG. It should be noted that the scission of glucosidic linkages may lead to mono- and di-functional radicals. This stadium produces H2O and CO2 gas by cracking [92], while the cellulose structure contains abundant—HCOH fragments, whose cracking may generate many radicals such as •H, •CO, or •CH and •OH, which can further react to form gaseous products. The analyzed step represents the formation of the major fraction of volatile tar (LG, 1,6-anhydroglucose). Equally, transglycosylation can yield cellobiosan and cellotriosan with considerably lower yields compared to the LG [93]. The compounds consisting of two or more pyranose rings are the components of non-volatile tar. The derived kinetic parameters for step 1.1 are in good agreement with the results of model-free analysis (Figure 5 and Figure 6a), but this reaction segment of the process is the slowest, so the high values of kinetic parameters (Table 3) can also be elucidated by the accumulation of nuclei in the cellulose. Since the rate of pyrolysis increases with increasing surface area of the interface between the phase of cellulose polymer and the phase of products, even a few nuclei of larger sizes can cause the pyrolysis rate to lag. The contribution of this step to the entire pyrolysis process of the r-CAcF sample is 54.8% (Table 3).
- (d)
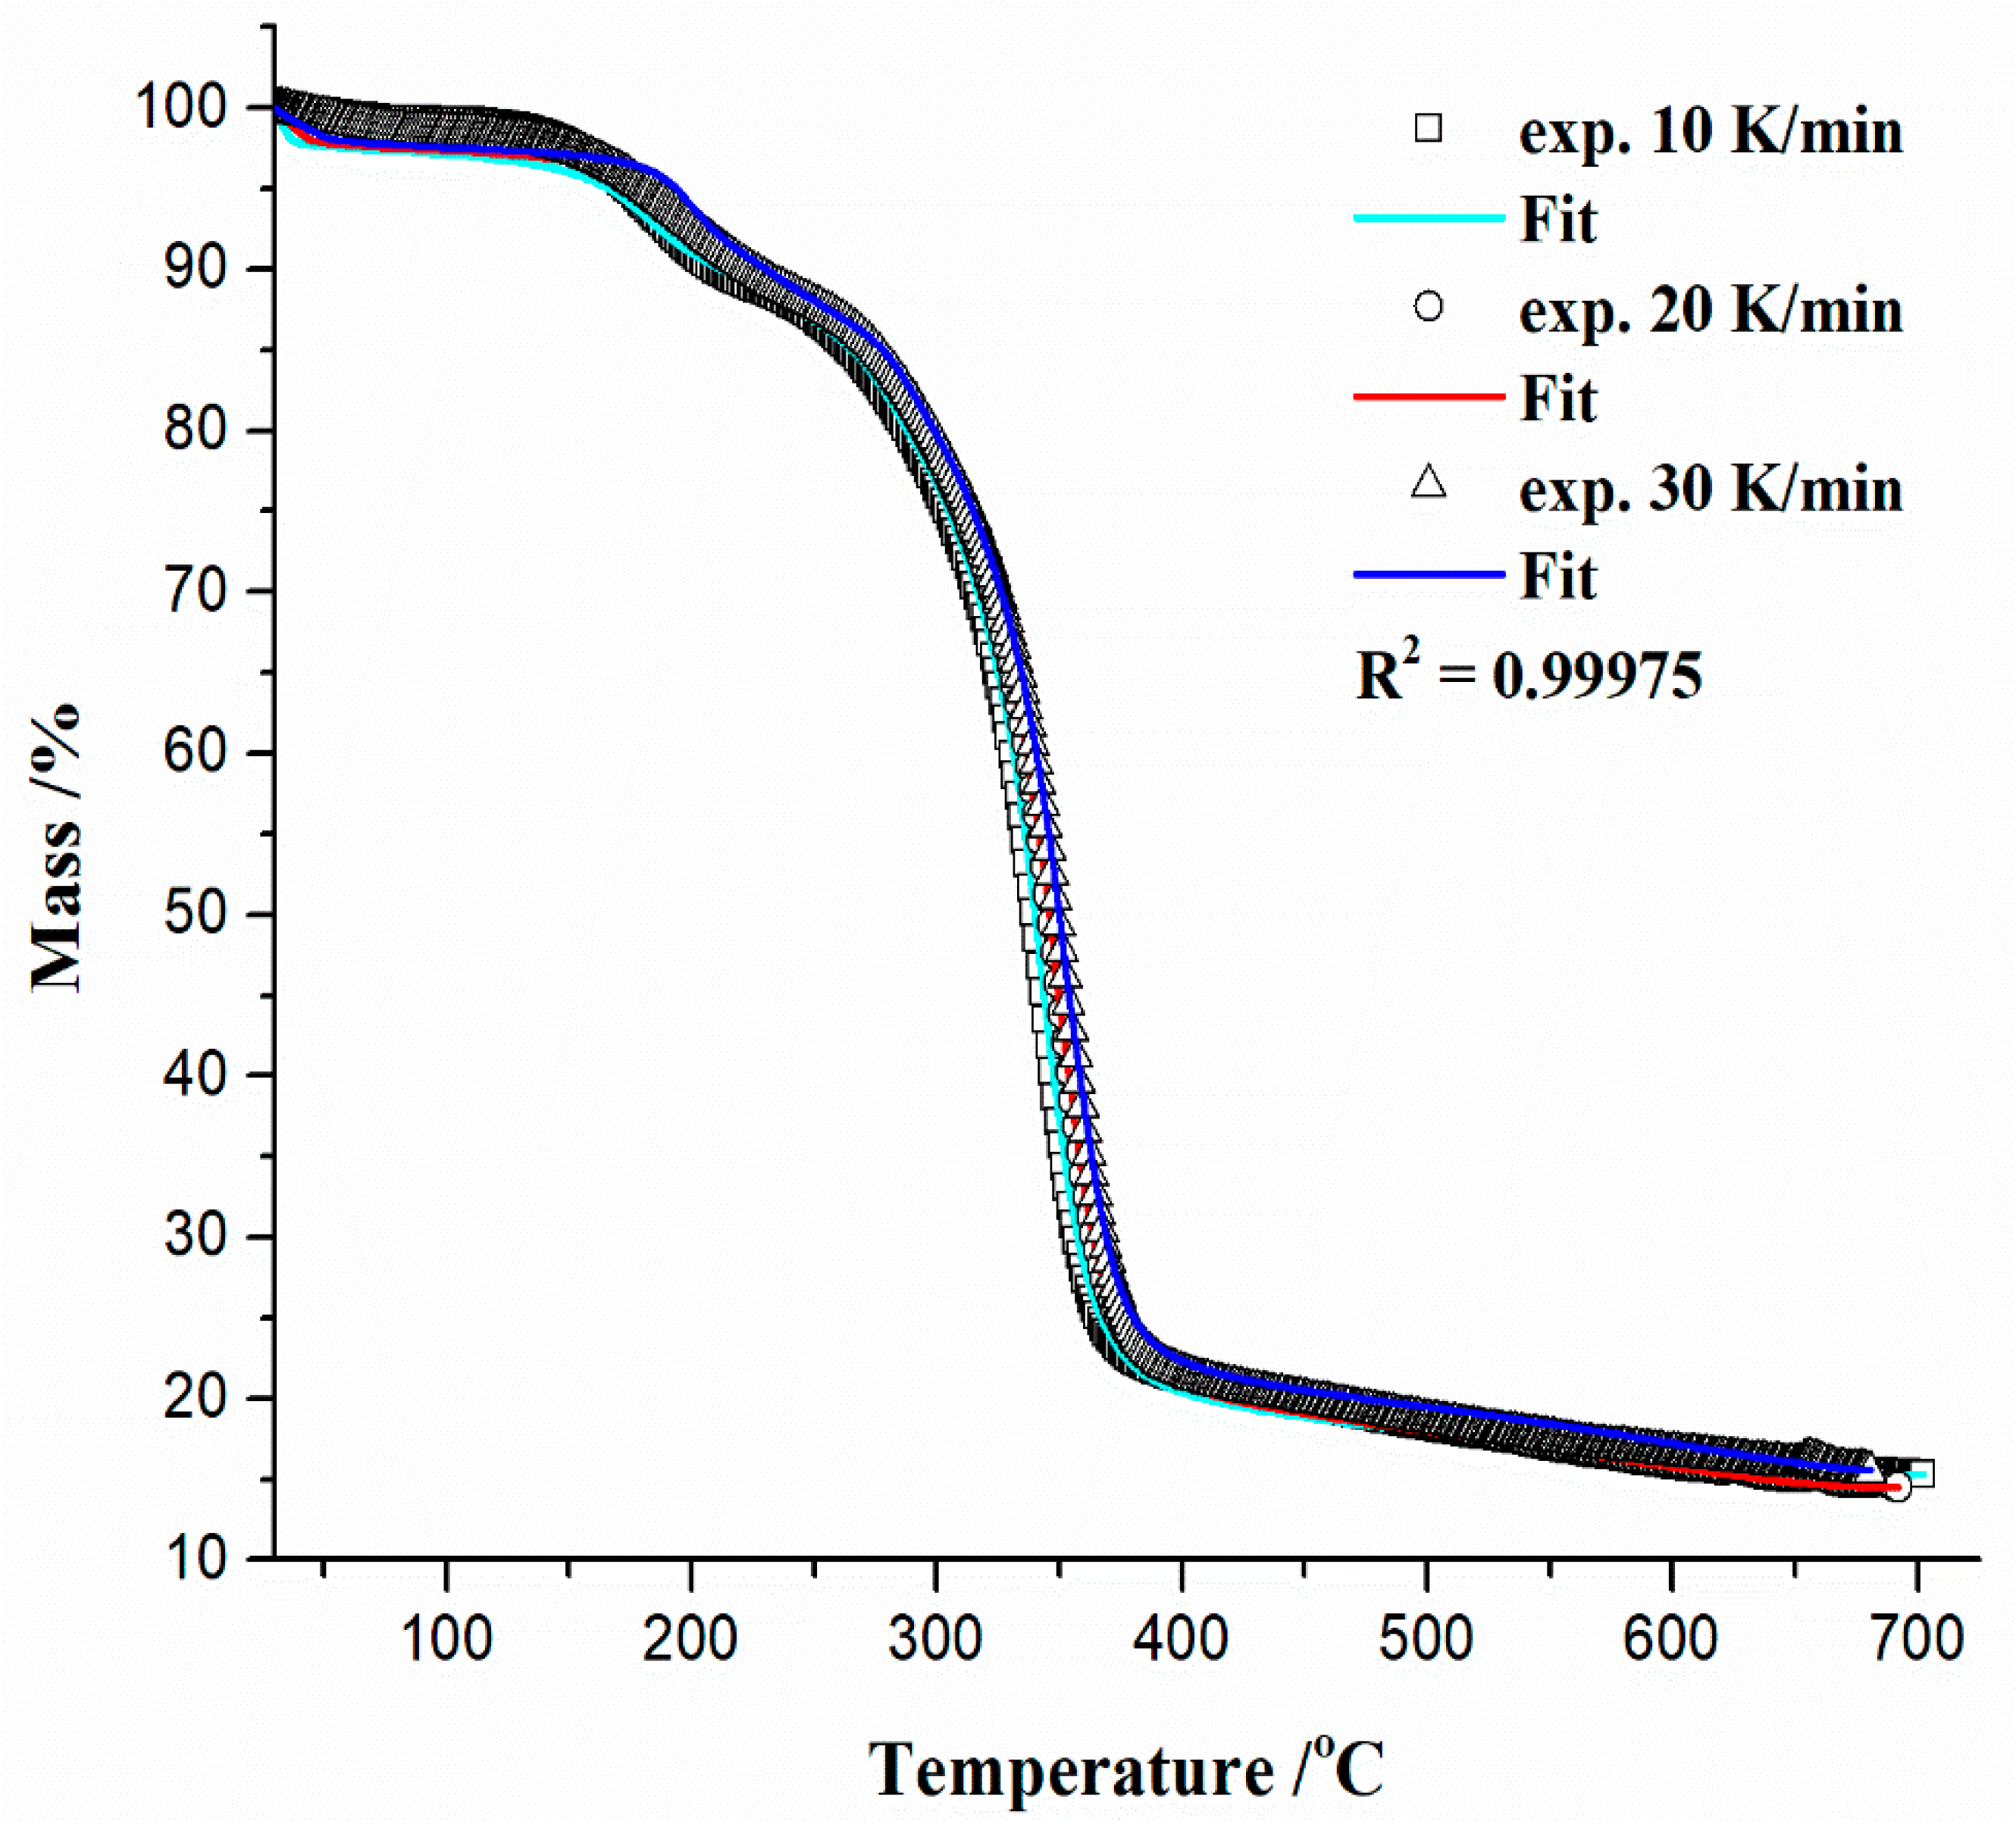
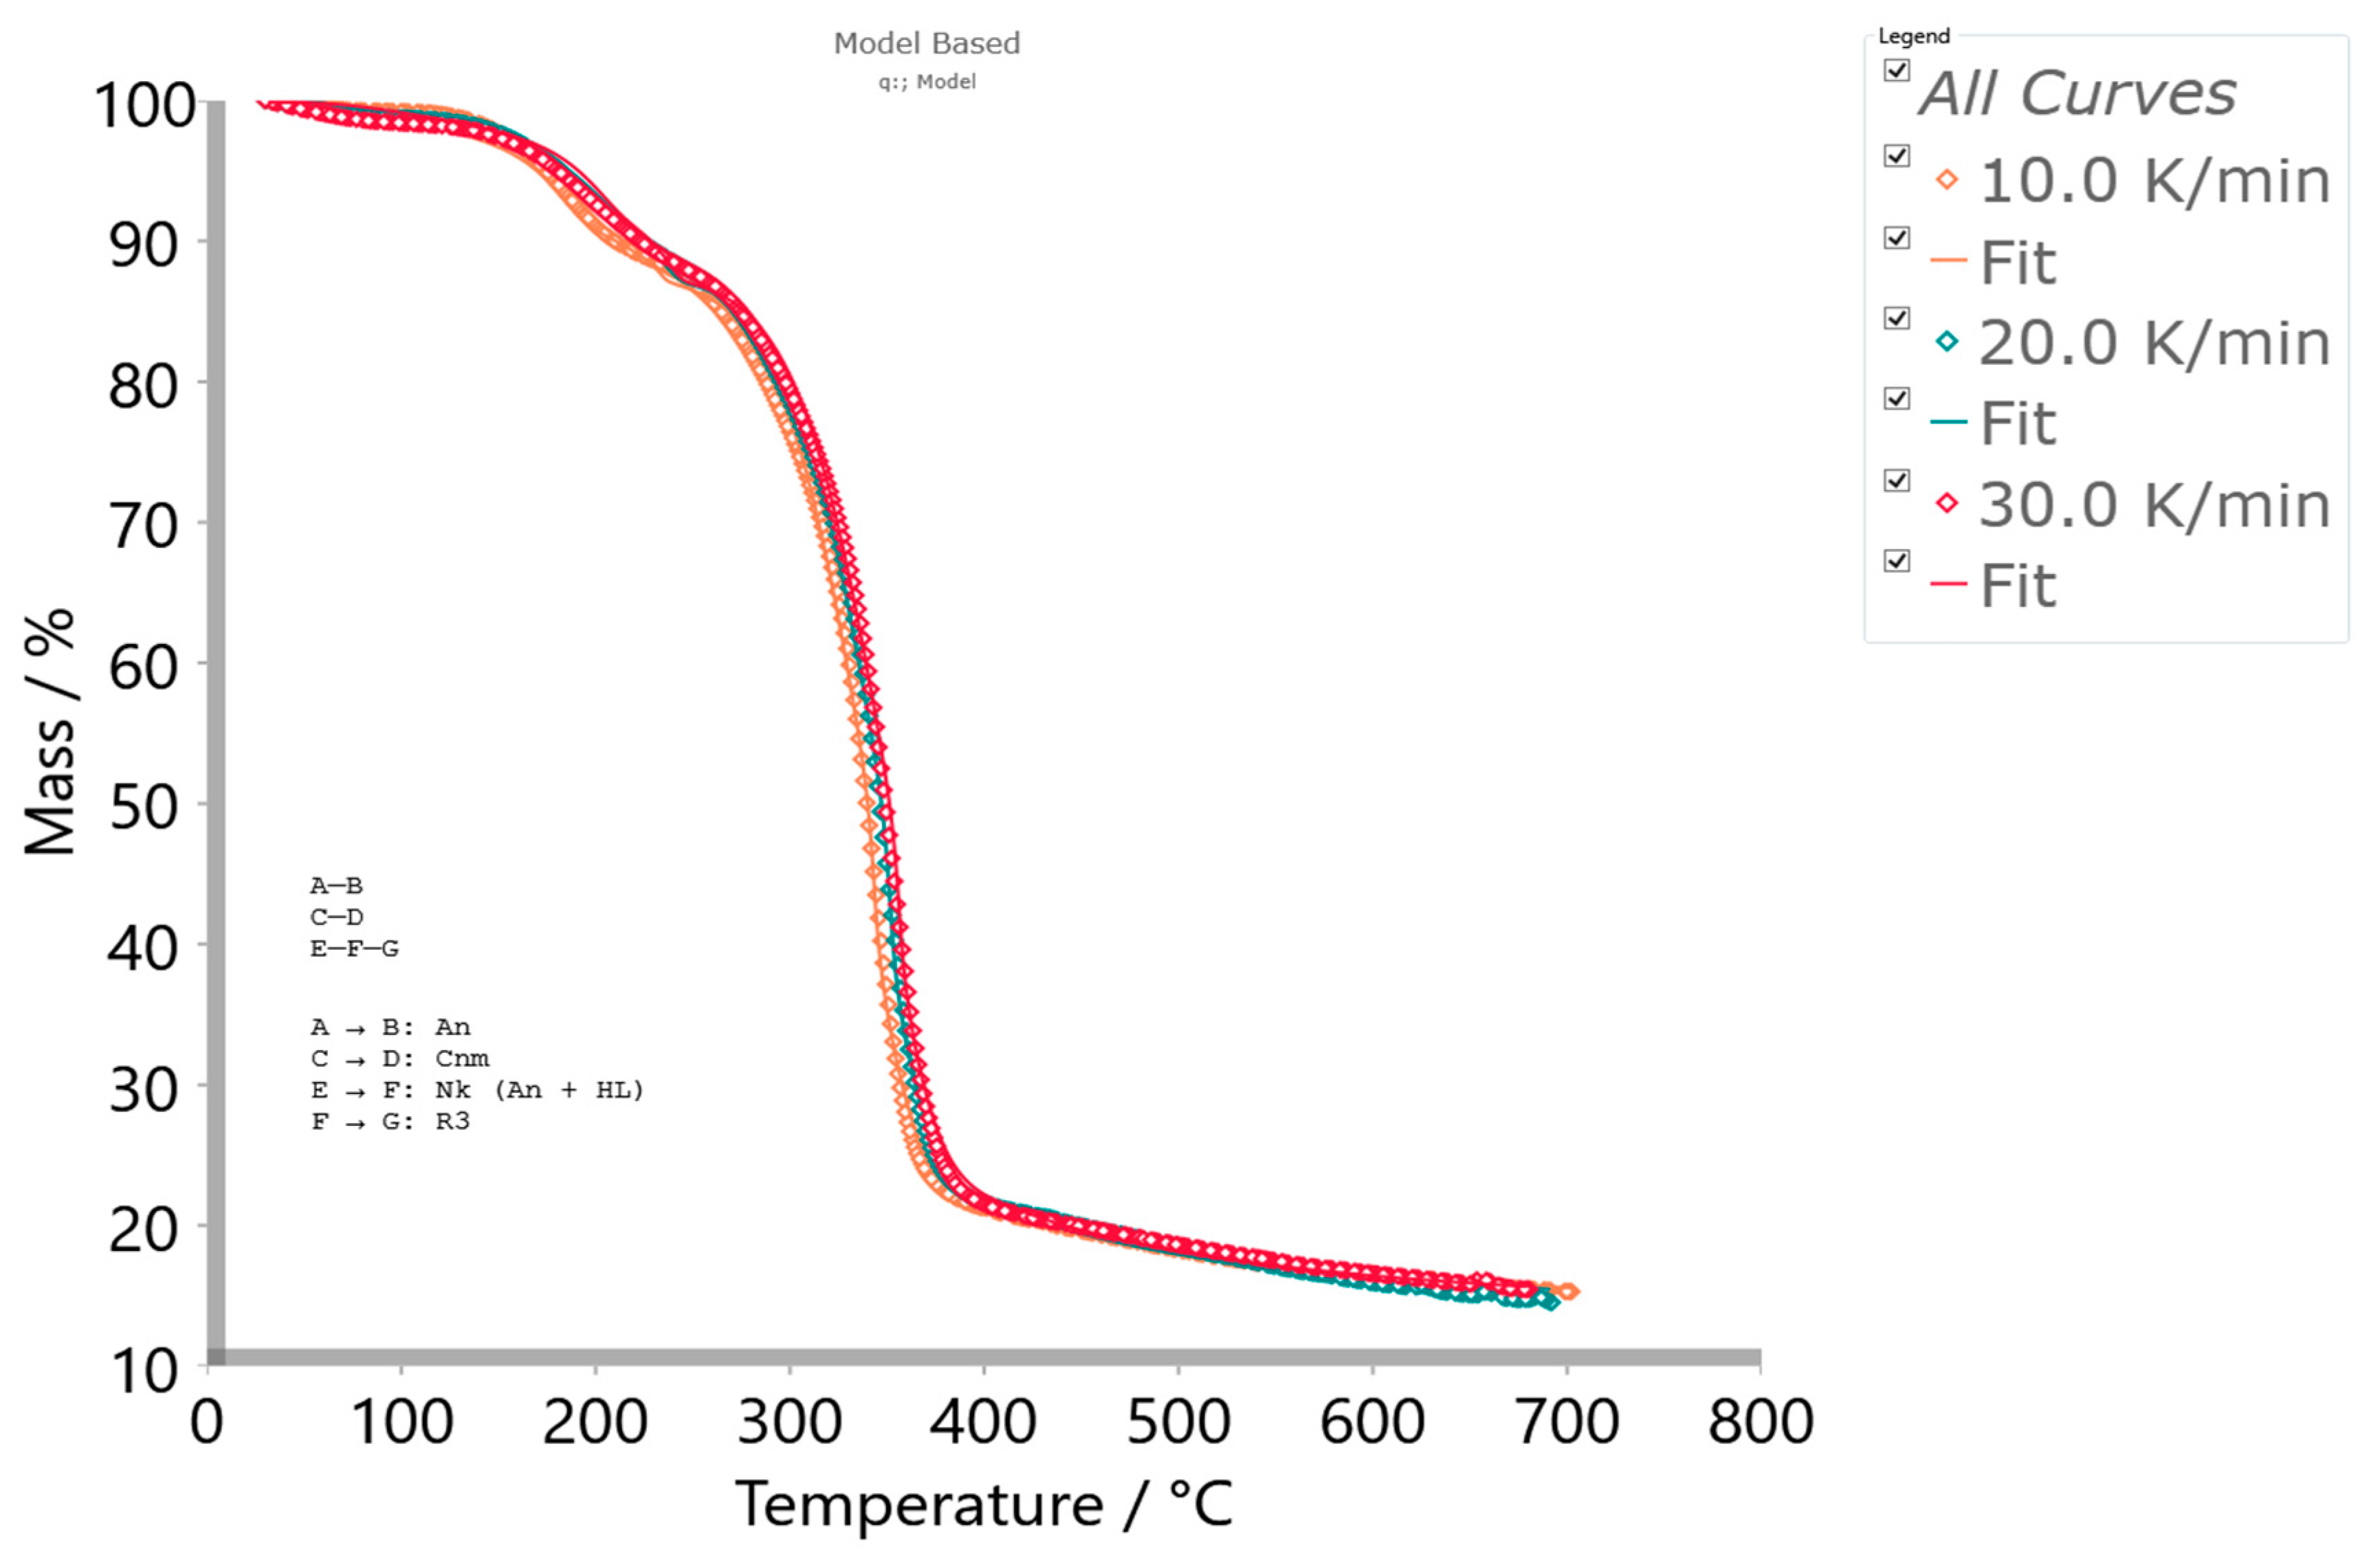
- The next single-step reaction pathway described by the Equation (13) (step 2.1) is characterized by an n-th order and m-power mechanism with autocatalysis (Table S1, Supplementary Materials), which takes place in the temperature range of approximately ΔT ~300–700 °C and can be presented with a concentration equation in the form:with kinetic parameters of Ea = 265.076 kJ mol−1, logA = 20.278, the reaction order of n = 13.969, log(A)Autocat. = 4.877, and an autocatalytic power exponent of m = 4.908 (Table 3). The current reaction step overlaps with the previously analyzed one, where an exothermic peak (exo2 (Figure 4c)) at 348.84 °C occurs. This can be related to the random dissociation of the bonds in the cellulosic chains along a fiber axis—1,4-β-glycosidic linkages. Further, a very important fact that should be emphasized is the following: the catalytic reaction step C → D represents the hydrolytic decomposition of cellulose by the catalytic cleavage of the glycosidic bonds because the glycosidic linkage in the cellulose molecules is very sensitive to acid-catalyzed hydrolysis [94]. Namely, the degree of this sensitivity varies according to accessibility (amorphous or crystalline region), type of acid and concentration, and also temperature. In our considered case, the process is characterized by a very high value of reaction order (~13.969, referring to the large number of reactive centers in the chains), as well as a higher value of power exponent (m ~4.908), which is directly related to the abundant production of products of the reaction.In this case, an acid trigger represents the subsistence of titanium dioxide (TiO2) (see results above) in the reaction system, which acts as a water-tolerant acid catalyst for biomass conversion [95]. The influence of temperature and humidity (the presence of water vapor traces) on the TiO2-catalyzed decomposition of cellulose derivatives can have a large impact. Namely, the higher temperatures and particularly high participation of H2O will enhance the decomposition [96]. However, this step was spread until the end of the entire pyrolysis process (the high-temperature region), which includes the formation of aromatic compounds (bio-char production). The aromatization of volatiles is initiated at approximately 380 °C, but an important fact that should be emphasized is that the structural reconstruction of the reacted system may occur at a temperature around 400 °C (Figure 4c), forming abundant C=O or (O)C–O chemical functionalities (Figure 2) in the bio-char [97]. With the increase in temperature above T ~500 °C, the stable stage of the formed carbon has been achieved. Established results are in good agreement with those obtained from model-free analysis (Figure 5 and Figure 6a), near the end of the considered process (around conversion of α ~0.90).Considering that melting (see Tm value in Table 3) and decomposition processes are partially overlapped, the proposed model scheme coded by q:, (with reaction steps and the kinetic models presented via Equations (12)–(14)) describes very successfully the complete pyrolysis kinetics of the examined initial material (precursor’s). The validity of the proposed model can be seen in Figure 9, where a comparison between experimental and simulated (calculated) TG-curves for an established mechanistic scheme (Equations (12)–(14)) is shown.It can be seen from the obtained results (Figure 9) that there is a high reliability and accuracy of the r-CAcF pyrolysis optimized values extracted from model-based (model-fitting) analysis through the proposed q:, model scheme (the high value of R2 (quality of fit)). In addition to the current analysis, Figure 10a shows absolute reaction rates (in s−1) of individual steps as a function of pyrolysis temperature (T in °C), where the occurrence of each individual step according to the given heating rate is also indicated.
3.4. Results of Carbonization Stage—Macro-Scale Experiments
3.4.1. Results of Characterization of CAc800(1h) Sample by SEM-EDX Analysis
3.4.2. BET Analysis and Porosity Investigation Results
4. Conclusions
- It was assumed that acetyl groups of plasticizer (triacetin (TA)) interact with CAc through dipolar interactions and hydrogen bondings. The influence of these polar interactions may affect the position of the glass transition temperature (Tg) of r-CAcF. However, weak H-bonded OH groups appear in the concert mainly due to structural changes in intrachain hydrogen bonds. It was established that sufficient thermal motion of cellulose chains may cause certain concurrent alignment of the small segment of cellulose at the primary nucleation site, which was formed by hydrogen bonding at the initial stage of the process;
- Based on the estimated value of Tg from the DSC analysis, it was found that CAc present in r-CAcF has a degree of substitution (DS) equal to 2.8 (DS = 2.8). The increase in DS leads to a decline in crystallinity. A decline in crystallinity was observed, which indicates a reduction of hydroxyl groups leading to less organized chains and a decrease in intermolecular interactions via hydrogen bonding;
- The mechanistic scheme of the pre-carbonization stage of r-CAcF was kinetically complex, consisting of two reactions in the consecutive step (described by a combination of n-dimensional (Avrami–Erofeev) nucleation (An) and Lauritzen–Hoffman (L-H) nucleation models (Nakamura (Nk) crystallization), with a three-dimensional phase-boundary model (R3), respectively), and two single-step reactions (described by n-dimensional nucleation (Avrami–Erofeev) (An) and the autocatalytic Cnm models, respectively);
- It was established that the first reaction within a consecutive stage can be attributed to the isophase transition of cellulose which occurs below thermal decomposition temperature. The detection of isophase transition was strongly influenced by estimated glass transition temperature (Tg) values, whereby two Tg’s are found: Tg1 = 182.68 °C and Tg2 = 10 °C. These results are related to motions of the CTA-rich phase in a partially miscible system with a high content of plasticizer. The occurrence of Tg at low temperatures (Tg ~10 °C) was proof of the α transition phenomenon. The transformation from nucleation to phase-boundary mechanism identified a change in crystallization mechanism, depending on the temperature, pointing to a transition from a less ordered (α’-transition) into an ordered crystalline phase (α-transition). Kinetic analysis of this process stage revealed a transformation of cellulose I into cellulose II (polymorphic transformation) in the presence of alkali metals in r-CAcF (which affect the increase in the rate of transformation);
- A single-step reaction that occurs in the temperature range of ΔT ~260–400 °C was attributed to the mechanism, including chain scission and volatilization of fragments, to obtain gaseous products. This reaction step was characterized by the formation of levoglucosan (LG) (the reaction step attached to the formation of the major fraction of volatile tar), with the release of a large number of radical species;
- Another single-step reaction (occurring in the T-range of ΔT ~300–700 °C) was attributed to the hydrolytic decomposition of cellulose by the catalytic cleavage of glycosidic bonds in the presence of an acidic catalyst (TiO2-catalyzed decomposition). It was found that at higher temperatures in the presence of the catalyst and with high participation of H2O, the decomposition can be significantly enhanced (producing value-added chemicals). This stage also permits the aromatization of volatiles through reinforcement of the previous stage because it was established that both single-step reactions show significant overlapping behavior. It was found that, through the identified kinetic scheme, abundant C=O and/or (O)C–O chemical functionalities are to be expected in the bio-char.
- ▪
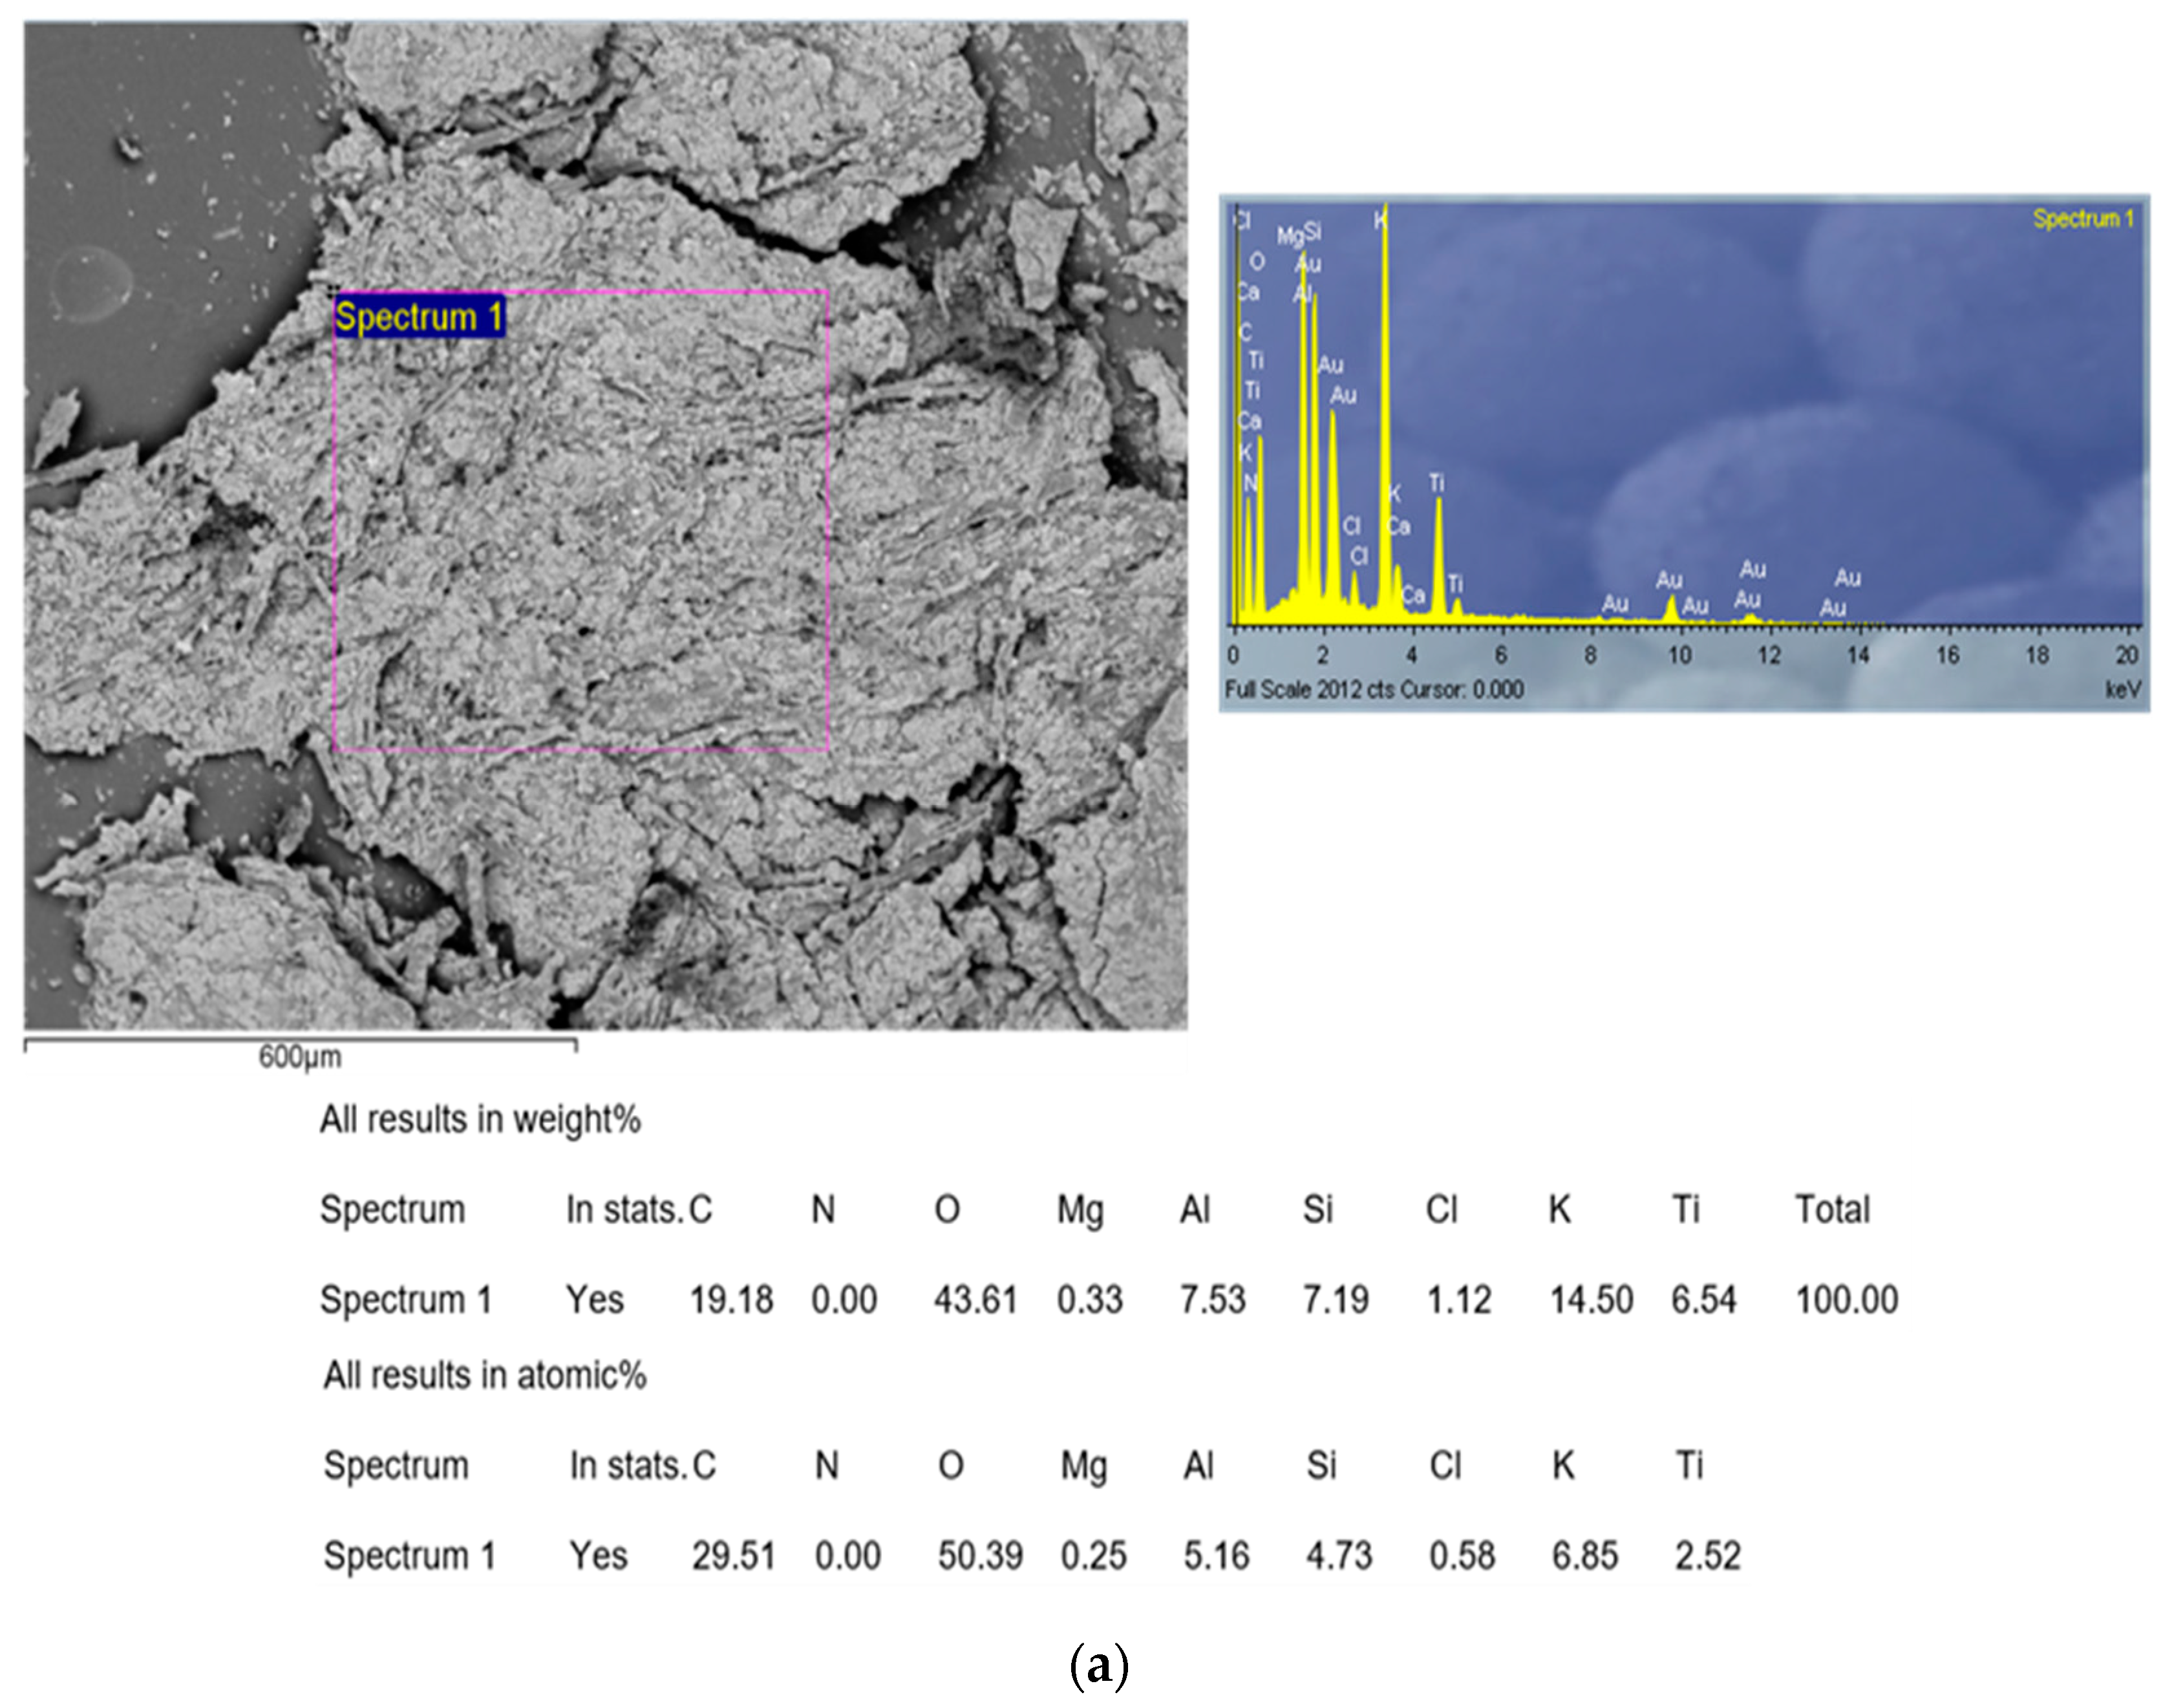
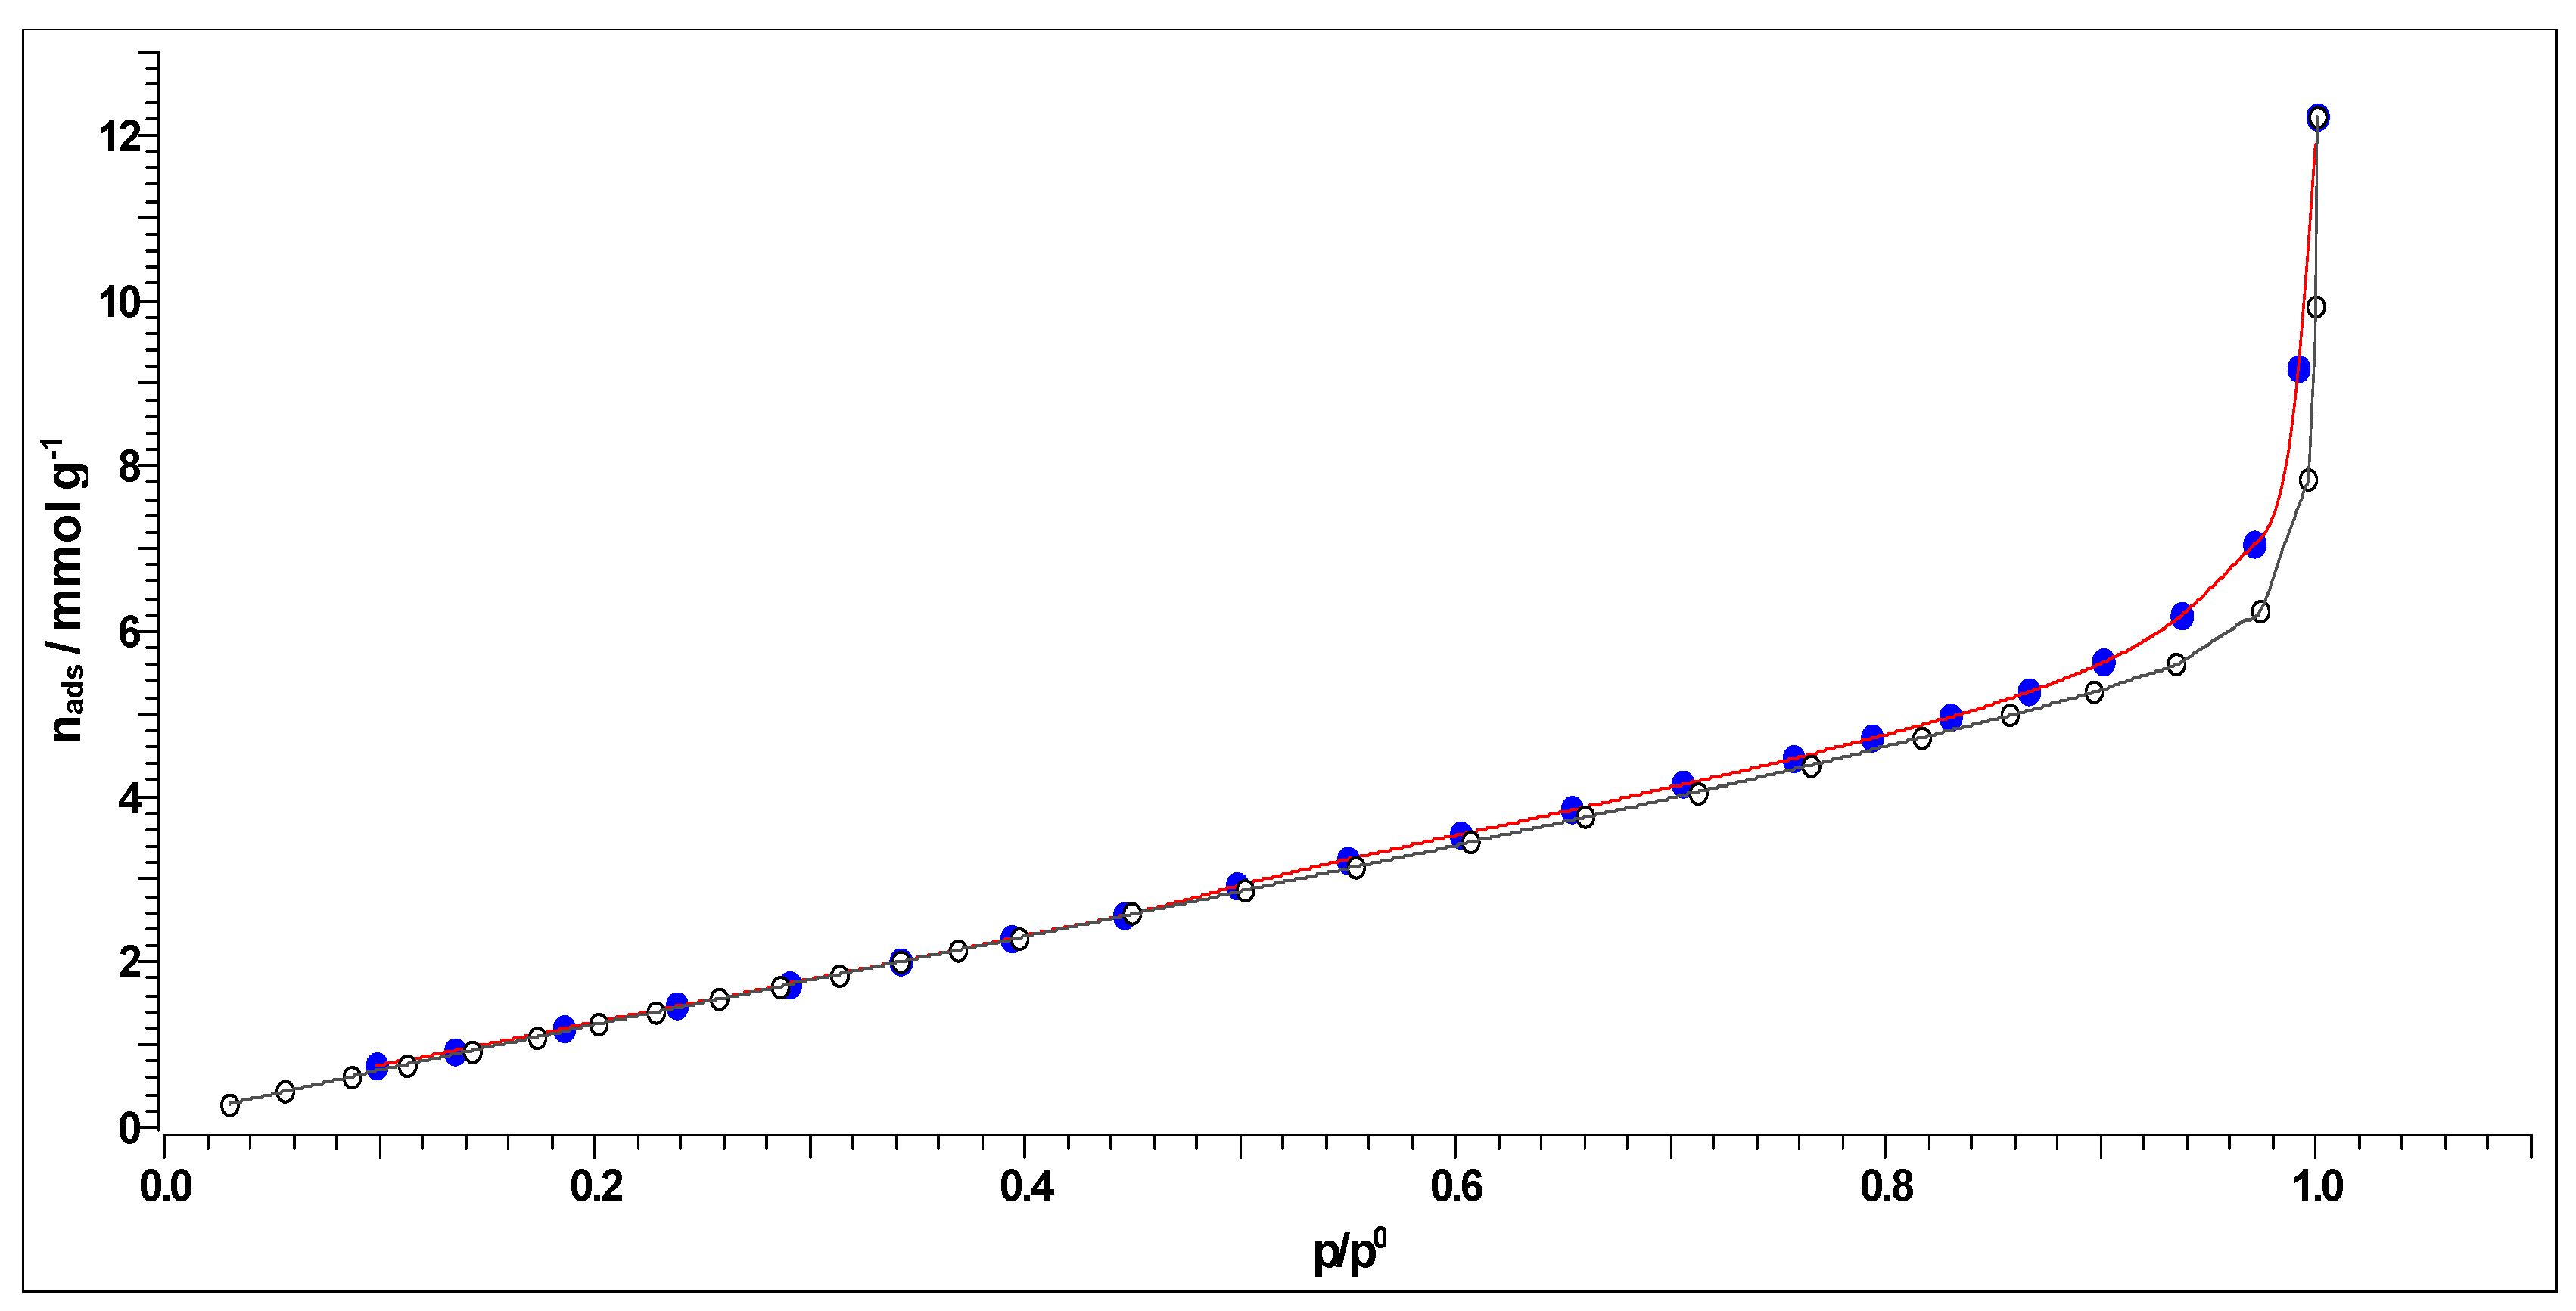
- The synthesized carbon (CAc800(1h)) showed characteristics of a macroporous material with developed mesoporosity. EDX analysis showed a certain amount of the ash, e.g., Ti, Al, and K, which were present in the final carbon product. Additionally, CAc800(1h) is highly enriched by oxygen, making it an oxygen-rich material. It was concluded that the ash integrity of CAc800(1h) may be improved by a rising content of K, and it can be weakened by chloride content;
- ▪
- It was established that CAc800(1h) can be used for wastewater treatment. However, this should be taken with an extremely cautions approach, given the presence of heavy metals such as Al and Ti. Therefore, appropriate washing measures would then have to be taken, with the aim of removing heavy metal traces, for its sensitive applications;
- ▪
- The production costs of CAc800(1h) are low, considering that the costs do not include chemicals because no kind of chemical or physical activation is used. Therefore, it is a fact that the production of CAc800(1h) requires little processing and consequently represents a low-cost carbon sorbent. For further applications, the increase in specific surface area through various activation techniques could be included.
Supplementary Materials
Author Contributions
Funding
Institutional Review Board Statement
Informed Consent Statement
Data Availability Statement
Conflicts of Interest
Nomenclature
| Abbreviations | |
| CB | cigarette butt |
| CAc | cellulose acetate |
| CTA | cellulose triacetate |
| CF | cigarette filter |
| CFs | cigarette filters |
| ACs | activated carbons |
| ATR | Attenuated total reflectance |
| BDEs | bond dissociation energies |
| CBFs | cigarette butt filters |
| HPC | highly porous carbon |
| TG | thermogravimetry |
| DTG | derivative thermogravimetry |
| DTA | differential thermal analysis |
| DSC | differential scanning calorimetry |
| XRD | X-ray diffraction |
| XRPD | X-ray powder diffraction |
| FTIR | Fourier-transform infrared |
| SEM | scanning electron microscopy |
| SEM | EDX-scanning electron microscopy–energy dispersive X-ray |
| BET | Brunauer–Emmett–Teller |
| TA | triacetin |
| FR | Friedman method |
| VY | Vyazovkin method |
| KCE | kinetic compensation effect |
| ICTAC | International Confederation for Thermal Analysis and Calorimetry |
| r-CAcF | raw-cellulose acetate filter |
| S-BET | specific surface area determined by BET |
| BJH | Barrett–Joyner–Halenda |
| ICSD | International Crystal Structure Database |
| ICDD | International Centre for Diffraction Data |
| DS | degree of substitution |
| ASTM | American Society for Testing and Materials |
| MW | molecular weight |
| DMA | dynamic mechanical analysis |
| AGU | anhydroglucose units |
| CTA | cellulose triacetate |
| An | n-dimensional nucleation, Avrami–Erofeev |
| Cnm | n-th order and m-power with autocatalysis |
| R3 | phase-boundary controlled reaction |
| Nk | Nakamura |
| MVarNLRM | multivariate non-linear regression method |
| L–H | Lauritzen–Hoffman |
| LG | levoglucosan (organic compound) |
| VOCs | volatile organic components |
| C | the BET constant |
| Di | devolatilization index (% min−1 °C−3) |
| Rmax | the maximum decomposition rate (% min−1) |
| Tin | initial devolatilization temperature (°C) |
| Tmax | maximum mass loss temperature (°C) |
| ΔT1/2 | temperature interval when the instantaneous mass loss rate equals half of the Rmax (°C) |
| THRI | the heat-resistance index (°C) |
| T5 | temperature at 5% of mass loss (from TG) (°C) |
| T30 | temperature at 30% of mass loss (from TG) (°C) |
| k(T) | decomposition rate constant (min−1) |
| A | pre-exponential (frequency) factor (s−1) |
| Ea | activation energy (kJ mol−1) |
| Ea,α | activation energy at a conversion α (kJ mol−1) |
| Aα | pre-exponential (frequency) factor at a conversion α (s−1) |
| Tα | the temperature at a conversion α (K) |
| Tα,i | the temperature at a conversion α and i-th heating rate (K) |
| R | the universal gas constant (8.314 J K−1 mol−1) |
| T | the absolute temperature (K) |
| t | the time (min/s) |
| dT/dt | heating rate (°C min−1) |
| dα/dt | non-isothermal (dynamic) decomposition rate (min−1/s−1) |
| Δmres | the residual mass (%) |
| Tg | glass transition temperature (°C) |
| Tm | melting temperature (°C) |
| Tc | crystallization temperature (°C) |
| ΔH° | change of standard activation enthalpy (kJ mol−1) |
| ΔS° | change of standard activation entropy (J mol−1 K−1) |
| ΔG° | change of standard Gibbs free energy (kJ mol−1) |
| kB | Boltzmann constant (1.381 × 10⁻²³ J K−1) |
| h | Planck constant (6.626 × 10⁻³⁴ J s−1) |
| n | Avrami’s dimension parameter (//or referred to as reaction orders) |
| m | autocatalytic parameter |
| (A)Autocat. | the autocatalytic pre-exponential factor (s−1) |
| K(T) | temperature-dependent rate constant (Nakamura’s rate constant) (s−1) |
| U* | activation energy of the segmental jump (kJ mol−1) |
| T∞ | the hypothetical temperature below which the molecular chain ceases motion (K) |
| KG | the nucleation parameter (K2) |
| f | the correction factor in Equation (16) |
| Greek letters | |
| α | conversion (-) |
| f(α) | differential form of the kinetic (reaction) model (-) |
| β | heating rate (experimental) (K min−1) |
| φ | gas flowing rate (mL min−1) |
| Subscripts | |
| i, j | refer to independent experimental runs, performed at different heating rates |
References
- United Nations Environment Programme. Single-Use Plastics: A Roadmap for Sustainability (Rev. 2). Knowledge Repository—UNEP. 2018. Available online: https://wedocs.unep.org/20.500.11822/25496 (accessed on 22 April 2023).
- Liu, M.; Lu, S.; Chen, Y.; Cao, C.; Bigalke, M.; He, D. Analytical Methods for Microplastics in Environments: Current Advances and Challenges. In Microplastics in Terrestrial Environments-Emerging Contaminants and Major Challenges; He, D., Luo, Y., Eds.; Part of the Book Series: The Handbook of Environmental Chemistry (HEC); Springer Nature: Basel, Switzerland, 2020; Volume 95, pp. 3–24. ISBN 978-3-030-56270-0. [Google Scholar]
- Kurmus, H.; Mohajerani, A. The toxicity and valorization options of cigarette butts. Waste Manag. 2020, 104, 104–118. [Google Scholar] [CrossRef] [PubMed]
- Finster, P.; Hollweg, J.; Seehofer, F. Determination of triacetin in cigarette filters by pulsed nuclear magnetic resonance spectroscopy-Bestimmung von triacetin in zigarettenfiltern mit hilfe der gepulsten kernresonanzspektroskopie. Beiträge Zur Tabak. Int. 1986, 13, 255–264. [Google Scholar] [CrossRef]
- Bonanomi, G.; Maisto, G.; De Marco, A.; Cesarano, G.; Zotti, M.; Mazzei, P.; Libralato, G.; Staropoli, A.; Siciliano, A.; De Filippis, F.; et al. The fate of cigarette butts in different environments: Decay rate, chemical changes and ecotoxicity revealed by a 5-years decomposition experiment. Environ. Pollut. 2020, 261, 114108. [Google Scholar] [CrossRef] [PubMed]
- Araújo, M.C.B.; Costa, M.F. A critical review of the issue of cigarette butt pollution in coastal environments. Environ. Res. 2019, 172, 137–149. [Google Scholar] [CrossRef] [PubMed]
- Bao, C. Cellulose Acetate/Plasticizer Systems: Structure, Morphology and Dynamics, Polymers. Université Claude Bernard-Lyon I, Villeurbanne, France. 2015. Available online: https://theses.hal.science/tel-01186696 (accessed on 28 April 2023).
- Slaughter, E.; Gersberg, R.M.; Watanabe, K.; Rudolph, J.; Stransky, C.; Novotny, T.E. Toxicity of cigarette butts, and their chemical components, to marine and freshwater fish. Tob. Control 2011, 20 (Suppl. 1), i25–i29. [Google Scholar] [CrossRef]
- Dahlawi, S.; Abdulrahman, A.M.; Saifullah, A.; Salama, K.; Labib, O.A.; Tawfiq, A.M.; Akhtar, A.; Asghar, W.; Faraj, T.K.; Khalid, N. Assessment of different heavy metals in cigarette filler and ash from multiple brands retailed in Saudi Arabia. J. King Saud. Univ. -Sci. 2021, 33, 101521. [Google Scholar] [CrossRef]
- Kurmus, H.; Mohajerani, A. Recycling of cigarette butts in fired clay bricks: A new laboratory investigation. Materials 2020, 13, 790. [Google Scholar] [CrossRef]
- Rahman, M.T.; Mohajerani, A.; Giustozzi, F. Possible recycling of cigarette butts as fiber modifier in bitumen for asphalt concrete. Materials 2020, 13, 734. [Google Scholar] [CrossRef]
- Maderuelo-Sanz, R.; Escobar, V.G.; Meneses-Rodríguez, J.M. Potential use of cigarette filters as sound porous absorber. Appl. Acoust. 2018, 129, 86–91. [Google Scholar] [CrossRef]
- Zhang, X.; Yu, M.; Li, Y.; Cheng, F.; Liu, Y.; Gao, M.; Liu, G.; Hu, L.; Liang, Y. Effectiveness of discarded cigarette butts derived carbonaceous adsorbent for heavy metals removal from water. Microchem. J. 2021, 168, 106474. [Google Scholar] [CrossRef]
- Ranjkes, Z.; Mousavi, F.S.; Nasouri, K. Structural engineering of activated carbon fibers derived from cigarette butts for fast oily materials adsorption. Environ. Water Eng. 2023, 9, 15–28. [Google Scholar] [CrossRef]
- Medellín-Castillo, N.A.; Ocampo-Pérez, R.; Forgionny, A.; Labrada-Delgado, G.J.; Zárate-Guzmán, A.I.; Cruz-Briano, S.A.; Flores-Ramírez, R. Insights into equilibrium and adsorption rate of phenol on activated carbon pellets derived from cigarette butts. Processes 2021, 9, 934. [Google Scholar] [CrossRef]
- Rahman, M.T.; Mohajerani, A. Thermal conductivity and environmental aspects of cigarette butt modified asphalt. Case Stud. Const. Mater. 2021, 15, e00569. [Google Scholar] [CrossRef]
- Yu, C.; Hou, H.; Liu, X.; Han, L.; Yao, Y.; Dai, Z.; Li, D. The recovery of the waste cigarette butts for N-doped carbon anode in lithium ion battery. Front. Mater. 2018, 5, 63. [Google Scholar] [CrossRef]
- Li, L.; Jia, C.; Zhu, X.; Zhang, S. Utilization of cigarette butt waste as functional carbon precursor for supercapacitors and adsorbents. J. Clean. Prod. 2020, 256, 120326. [Google Scholar] [CrossRef]
- Li, W.; Tian, X.; Li, X.; Liu, J.; Li, C.; Feng, X.; Shu, C.; Yu, Z.-Z. An environmental energy-enhanced solar steam evaporator derived from MXene-decorated cellulose acetate cigarette filter with ultrahigh solar steam generation efficiency. J. Coll. Inter. Sci. 2022, 606, 748–757. [Google Scholar] [CrossRef]
- Zhou, Z.; Liu, X.; Li, C.; Yang, Y.; Xu, J.; Xu, M. Flaming combustion and smoldering of active impregnated cigarette butts: A novel method for synthesis of nanostructured MnOx catalysts for NOx reduction. Fuel 2020, 277, 118230. [Google Scholar] [CrossRef]
- Li, H.; Sun, J.; Jiang, Q.; Xia, H.; Cheng, S.; Zhou, Z.; Nie, X.; Zhao, C. Facile, time-saving cigarette butt-assisted combustion synthesis of modified CaO-based sorbents for high-temperature CO2 capture. Fuel 2023, 337, 126868. [Google Scholar] [CrossRef]
- Jaya, M.A.T.; Harun, W.M.H.F.W.; Ahmad, M.A. Influence of pyrolysis temperature and heating rate in the fabrication of carbon membrane: A review. J. Appl. Sci. 2014, 14, 1359–1364. [Google Scholar] [CrossRef]
- Mattevi, C.; Kim, H.; Chhowalla, M. A review of chemical vapour deposition of graphene on copper. J. Mater. Chem. 2011, 21, 3324–3334. [Google Scholar] [CrossRef]
- Sharma, S. Glassy carbon: A promising materials for micro- and nanomanufacturing. Materials 2018, 11, 1857. [Google Scholar] [CrossRef] [PubMed]
- Ferreira, G.M.; da Silva Herdi, D.; da Silveira, K.C.; Gonçalves, M.C.; de Andrade, M.C. Evaluation of thermal degradation kinetics of hybrid cellulose acetate membranes using isoconversional methods. Vetor 2022, 32, 52–61. [Google Scholar] [CrossRef]
- Meng, H.; Wang, S.; Chen, L.; Wu, Z.; Zhao, J. Thermal behavior and the evolution of char structure during co-pyrolysis of platanus wood blends with different rank coals from northern China. Fuel 2015, 158, 602–611. [Google Scholar] [CrossRef]
- Hafiezal, M.R.M.; Khalina, A.; Zurina, Z.A.; Azaman, M.D.M.; Hanafee, Z.M. Thermal and flammability characteristics of blended Jatropha bio-epoxy as matrix in carbon fiber-reinforced polymer. J. Compos. Sci. 2019, 3, 6. [Google Scholar] [CrossRef]
- Friedman, H.L. Kinetic of thermal degradation of char-forming plastics from thermogravometry. Application to a phenolic plastic. J. Polym. Sci. Polym. Symp. 1964, 6, 183–195. [Google Scholar] [CrossRef]
- Vyazovkin, S. Evaluation of activation energy of thermally stimulated solid-state reactions under arbitrary variation of temperature. J. Comput. Chem. 1997, 18, 393–402. [Google Scholar] [CrossRef]
- Mianowski, A.; Sciazko, M.; Radko, T. Vyazovkin’s isoconversional method as a universal approach. Thermochim. Acta 2021, 696, 178822. [Google Scholar] [CrossRef]
- Wang, X.; Wang, Y.; Guo, J.; Zhao, Y.; Wang, X.; Zhang, X.; Chen, Z. Behaviors and non-isothermal kinetics of Chlorella pyrenoidosa fodder pyrolysis by a modified kinetic compensation effects and a parallel two-step reaction model. Biomass Conver. Bioref. 2022. [Google Scholar] [CrossRef]
- What Is Model Free Numerical Optimization Method? NETZSCH Kinetics Neo Software, Kinetics Neo Team: Valley Cottage, NY, USA. Available online: https://kinetics.netzsch.com/en/f-a-q/what-is-model-free-numerical-optimization-method (accessed on 29 April 2023).
- Vyazovkin, S.; Chrissafis, K.; Di Lorenzo, M.L.; Koga, N.; Pijolat, M.; Roduit, B.; Sbirrazzuoli, N.; Suñol, J.J. ICTAC Kinetics Committee recommendations for collecting experimental thermal analysis data for kinetic computations. Thermochim. Acta 2014, 590, 1–23. [Google Scholar] [CrossRef]
- International Crystallographical Database (ICDD). PDF-2 Release 2023. Available online: https://www.icdd.com/pdf-2/ (accessed on 7 March 2023).
- Kraus, W.; Nolze, G. POWDER CELL-a program for the representation and manipulation of crystal structures and calculation of the resulting X-ray powder patterns. J. Appl. Cryst. 1996, 29, 301–303. [Google Scholar] [CrossRef]
- Barrett, E.P.; Joyner, L.G.; Halenda, P.P. The determination of pore volume and area distributions in porous substances. I. Computations from nitrogen isotherms. J. Am. Chem. Soc. 1951, 73, 373–380. [Google Scholar] [CrossRef]
- Lippens, B.C.; Linsen, B.G.; de Boer, J.H. Studies on pore systems in catalysts I. The adsorption of nitrogen, apparatus and calculation. J. Catal. 1964, 3, 32–37. [Google Scholar] [CrossRef]
- Lippens, B.C.; de Boer, J.H. Studies on pore systems in catalysts: V. The t method. J. Catal. 1965, 4, 319–323. [Google Scholar] [CrossRef]
- Glugoski, L.P.; de Jesus Cubas, P.; Fujiwara, S.T. Reactive Black 5 dye degradation using filters of smuggled cigarette modified with Fe3+. Environ. Sci. Pollut. Res. 2017, 24, 6143–6150. [Google Scholar] [CrossRef]
- Guo, Y.; Wu, P. Investigation of the hydrogen-bond structure of cellulose diacetate by two-dimensional infrared correlation spectroscopy. Carbohyd. Polym. 2008, 74, 509–513. [Google Scholar] [CrossRef]
- Marchessault, R.H.; Liang, C.Y. Infrared spectra of crystalline polysaccharides. III. Mercerized cellulose. J. Polym. Sci. 1960, 43, 71–84. [Google Scholar] [CrossRef]
- Homem, N.C.; Amorim, M.T.P. Synthesis of cellulose acetate using as raw material textile wastes. Mater. Today Proceed. 2020, 31 (Suppl. 2), S315–S317. [Google Scholar] [CrossRef]
- Lyu, Y.; Asoh, T.-A.; Uyama, H. Fabrication of inorganic oxide fiber using a cigarette filter as a template. ACS Omega 2021, 6, 15374–15381. [Google Scholar] [CrossRef]
- Arroyo, F.D.; Castro-Guerrero, C.F.; León-Silva, U. Thin films of cellulose acetate nanofibers from cigarette butt waste. Prog. Rubber Plast. Recyc. Technol. 2020, 36, 3–17. [Google Scholar] [CrossRef]
- Sharma, A.; Sharma, V. Forensic analysis of cigarette filter using non-destructive ATR-FTIR spectroscopy and chemometric methods. Foren. Chem. 2023, 32, 100465. [Google Scholar] [CrossRef]
- Manríquez-Ramírez, M.E.; Elizalde, I.; Ramírez-López, R.; Trejo Valdez, M.; Estrada Flores, M. Acetylation of glycerol using MgO-CaO catalysts with different CaO loadings. React. Kinet. Mechan. Cat. 2020, 130, 417–431. [Google Scholar] [CrossRef]
- Page, M.I. Mechanism and Catalysis in the Hydrolysis of Some Acetals and Esters. Ph.D. Thesis, University of Glasgow, Glasgow, UK, 1970; pp. 1–359. [Google Scholar]
- Chen, D.; Cen, K.; Zhuang, X.; Gan, Z.; Zhou, J.; Zhang, Y.; Zhang, H. Insight into biomass pyrolysis mechanism based on cellulose, hemicellulose, and lignin: Evolution of volatiles and kinetics, elucidation of reaction pathways, and characterization of gas, biochar and bio-oil. Comb. Flame 2022, 242, 112142. [Google Scholar] [CrossRef]
- Dumanlı, A.G.; Windle, A.H. Carbon fibres from cellulosic precursors: A review. J. Mater. Sci. 2012, 47, 4236–4250. [Google Scholar] [CrossRef]
- Tatzber, M.; Stemmer, M.; Spiegel, H.; Katzlberger, C.; Haberhauer, G.; Mentler, A.; Gerzabek, M.H. FTIR spectroscopic characterization of humic acids and humin fractions obtained by advanced NaOH, Na4P2O7, and Na2CO3 extraction procedures. J. Plant Nutrit. Soil Sci. 2007, 170, 522–529. [Google Scholar] [CrossRef]
- Dreux, X.; Majesté, J.C.; Carrot, C.; Argoud, A.; Vergelati, C. Viscoelastic behaviour of cellulose acetate/triacetin blends by rheology in the melt state. Carbohydr. Polym. 2019, 222, 114973. [Google Scholar] [CrossRef]
- Erdmann, R.; Kabasci, S.; Heim, H.-P. Thermal properties of plasticized cellulose acetate and its β-relaxation phenomenon. Polymers 2021, 13, 1356. [Google Scholar] [CrossRef]
- Wan Daud, R.W.; Djuned, F.M. Cellulose acetate from oil palm empty fruit bunch via a one step heterogeneous acetylation. Carbohyd. Polym. 2015, 132, 252–260. [Google Scholar] [CrossRef]
- Nilsson, R.; Olsson, M.; Westman, G.; Matic, A.; Larsson, A. Screening of hydrogen bonds in modified cellulose acetates with alkyl chain substitutions. Carbohyd. Polym. 2022, 285, 119188. [Google Scholar] [CrossRef]
- Alabadi, A.; Razzaque, S.; Yang, Y.; Chen, S.; Tan, B. Highly porous activated carbon materials from carbonized biomass with high CO2 capturing capacity. Chem. Eng. J. 2015, 281, 606–612. [Google Scholar] [CrossRef]
- Wu, Y.F.; Hsiao, Y.-C.; Ou, Y.-J.; Kubendhiran, S.; Huang, C.-Y.; Yougbaré, S.; Lin, L.-Y. Synthesis of cigarette filter-derived activated carbon using various activating agents for flexible capacitive supercapacitors. J. Energy Storage 2022, 54, 105379. [Google Scholar] [CrossRef]
- Yousef, S.; Eimontas, J.; Striūgas, N.; Praspaliauskas, M.; Abdelnaby, M.A. Pyrolysis kinetic behaviour; TG-FTIR, and GC/MS analysis of cigarette butts and their components. Biomass Conv. Bioref. 2022. [Google Scholar] [CrossRef]
- De Fenzo, A.; Giordano, M.; Sansone, L. A clean process for obtaining high-quality cellulose acetate from cigarette butts. Materials 2020, 13, 4710. [Google Scholar] [CrossRef]
- Barud, H.S.; de Araújo Júnior, A.M.; Santos, D.B.; de Assunção, R.M.N.; Meireles, C.S.; Cerqueira, D.A.; Filho, G.R.; Ribeiro, C.A.; Messaddeq, Y.; Ribeiro, S.J.L. Thermal behavior of cellulose acetate produced from homogeneous acetylation of bacterial cellulose. Thermochim. Acta 2008, 471, 61–69. [Google Scholar] [CrossRef]
- Hatakeyama, T.; Hatakeyama, H. Thermal Properties of Cellulose and its Derivatives–Chapter 3. In Thermal Properties of Green Polymers and Biocomposites; Part of the Book Series: Hot Topics in Thermal Analysis and Calorimetry (HTTC); Springer: Berlin/Heidelberg, Germany; Kluwer Academic Publishers: Alphen aan den Rijn, The Netherlands, 2004; Volume 4, pp. 39–130. [Google Scholar]
- Watanabe, A.; Morita, S.; Ozaki, Y. Study on temperature-dependent changes in hydrogen bonds in cellulose Iβ by infrared spectroscopy with perturbation-correlation moving-window two-dimensional correlation spectroscopy. Biomacromolecules 2006, 7, 3164–3170. [Google Scholar] [CrossRef]
- Quintana, R.; Persenaire, O.; Lemmouchi, Y.; Sampson, J.; Martin, S.; Bonnaud, L.; Dubois, P. Enhancement of cellulose acetate degradation under accelerated weathering by plasticization with eco-friendly plasticizers. Polym. Degrad. Stab. 2013, 98, 1556–1562. [Google Scholar] [CrossRef]
- Rambaldi, D.C.; Suryawanshi, C.; Eng, C.; Preusser, F.D. Effect of thermal and photochemical degradation strategies on the deterioration of cellulose diacetate. Polym. Degrad. Stab. 2014, 107, 237–245. [Google Scholar] [CrossRef]
- Wolfs, J.; Meier, M.A.R. A more sustainable synthesis approach for cellulose acetate using the DBU/CO2 switchable solvent system. Green Chem. 2021, 23, 4410–4420. [Google Scholar] [CrossRef]
- Kamide, K.; Saito, M. Thermal analysis of cellulose acetate solids with total degrees of substitution of 0.49, 1.75, 2.46, and 2.92. Polym. J. 1985, 17, 919–928. [Google Scholar] [CrossRef]
- De Freitas, R.R.M.; Senna, A.M.; Botaro, V.R. Influence of degree of substitution on thermal dynamic mechanical and physicochemical properties of cellulose acetate. Ind. Crops Prod. 2017, 109, 452–458. [Google Scholar] [CrossRef]
- Tatavarti, A.S.; Dollimore, D.; Alexander, K.S. A thermogravimetric analysis of non-polymeric pharmaceutical plasticizers: Kinetic analysis, method validation, and thermal stability evaluation. AAPS PharmSci. 2002, 4, 231–242. [Google Scholar] [CrossRef]
- Laino, T.; Tuma, C.; Moor, P.; Martin, E.; Stolz, S.; Curioni, A. Mechanisms of propylene glycol and triacetin pyrolysis. J. Phys. Chem. A 2012, 116, 4602–4609. [Google Scholar] [CrossRef] [PubMed]
- Vreeke, S.; Peyton, D.H.; Strongin, R.M. Triacetin enhances levels of acrolein, formaldehyde hemiacetals, and acetaldehyde in electronic cigarette aerosols. ACS Omega 2018, 3, 7165–7170. [Google Scholar] [CrossRef] [PubMed]
- Morgado, D.L.; Frollini, E. Thermal decomposition of mercerized linter cellulose and its acetates obtained from a homogeneous reaction. Polímeros 2011, 21, 111–117. [Google Scholar] [CrossRef]
- Sousa, M.; Brás, A.R.; Veiga, H.I.M.; Ferreira, F.C.; de Pinho, M.N.; Correia, N.T.; Dionísio, M. Dynamical characterization of a cellulose acetate polysaccharide. J. Phys. Chem. B 2010, 114, 10939–10953. [Google Scholar] [CrossRef] [PubMed]
- Scotney, A. The thermal degradation of cellulose triacetate-I. The reaction products. Eur. Polym. J. 1972, 8, 163–174. [Google Scholar] [CrossRef]
- Scotney, A. The thermal degradation of cellulose triacetate-II. The carbonaceous residue. Eur. Polym. J. 1972, 8, 175–183. [Google Scholar] [CrossRef]
- Yang, R.; Lu, X.; Gu, X. Pyrolysis kinetics of a lignin-modified cellulose composite film. ACS Omega 2021, 6, 35584–35592. [Google Scholar] [CrossRef]
- Janković, B.; Manić, N.; Popović, M.; Cvetković, S.; Dželetović, Ž.; Stojiljković, D. Kinetic and thermodynamic compensation phenomena in C3 and C4 energy crops pyrolysis: Implications on reaction mechanisms and product distributions. Ind. Crops Prod. 2023, 194, 116275. [Google Scholar] [CrossRef]
- Wang, W.; Luo, G.; Zhao, Y.; Tang, Y.; Wang, K.; Li, X.; Xu, Y. Kinetic and thermodynamic analyses of co-pyrolysis of pine wood and polyethylene plastic based on Fraser-Suzuki deconvolution procedure. Fuel 2022, 322, 124200. [Google Scholar] [CrossRef]
- Kissinger, H.E. Variation of peak temperature with heating rate in differential thermal analysis. J. Res. Natl. Bur. Stand. 1956, 57, 217–221. [Google Scholar] [CrossRef]
- Palmay, P.; Puente, C.; Barzallo, D.; Bruno, J.C. Determination of the thermodynamic parameters of the pyrolysis process of post-consumption thermoplastics by non-isothermal thermogravimetric analysis. Polymers 2021, 13, 4379. [Google Scholar] [CrossRef]
- Gupta, S.; Mondal, P. Catalytic pyrolysis of pine needles with nickel doped gamma-alumina: Reaction kinetics, mechanism, thermodynamics and products analysis. J. Clean. Prod. 2021, 286, 124930. [Google Scholar] [CrossRef]
- Khoshkava, V.; Ghasemi, H.; Kamal, M.R. Effect of cellulose nanocrystals (CNC) on isothermal crystallization kinetics of polypropylene. Thermochim. Acta 2015, 608, 30–39. [Google Scholar] [CrossRef]
- Ioelovich, M. Cellulose: Nanostructured Natural Polymer; LAP LAMBERT Academic Publishing: Sunnyvale, CA, USA, 2014; pp. 1–100. ISBN 13:978-36591743772014. [Google Scholar]
- Boyer, R.F. Transition and Relaxation in Polymers; Wiley & Sons: New York, NY, USA, 1967. [Google Scholar]
- Van Krevelen, D.W.; Nijenhuis, K.T. Properties of Polymers. Their Correlation with Chemical Structure: Their Numerical Estimation and Prediction from Additive Group Contributions, 1st ed.; Elsevier: Amsterdam, The Netherlands; London, UK; New York, NY, USA, 1972; pp. 129–189. [Google Scholar]
- Nordin, S.; Nyren, J.; Back, E. Note on molten cellulose produced in a laser beam. Svensk Papperstidn. 1973, 76, 609–610. [Google Scholar]
- Alfthan, E.; de Ruvo, A.; Brown, W. Glass transition temperatures of oligosaccharides. Polymer 1973, 14, 329–330. [Google Scholar] [CrossRef]
- Stanford, V.L.; McCulley, C.M.; Vyazovkin, S. Isoconversional kinetics of nonisothermal crystallization of salts from solutions. J. Phys. Chem. B 2016, 120, 5703–5709. [Google Scholar] [CrossRef]
- Duchemin, B.J.C.; Newman, R.H.; Staiger, M.P. Phase transformations in microcrystalline cellulose due to partial dissolution. Cellulose 2007, 14, 311–320. [Google Scholar] [CrossRef]
- Dinand, E.; Vignon, M.; Chanzy, H.; Heux, L. Mercerization of primary wall cellulose and its implication for the conversion of cellulose I → cellulose II. Cellulose 2002, 9, 7–18. [Google Scholar] [CrossRef]
- Zuber, M.; Zia, K.M.; Bhatti, I.A.; Ali, Z.; Arshad, M.U.; Saif, M.J. Modification of cellulosic fibers by UV-irradiation. Part II: After treatments effects. Int. J. Biol. Macromol. 2012, 51, 743–748. [Google Scholar] [CrossRef]
- Parthasarathy, P.; Narayanan, K.S.; Arockiam, L. Study on kinetic parameters of different biomass samples using thermo-gravimetric analysis. Biomass Bioenergy 2013, 58, 58–66. [Google Scholar] [CrossRef]
- Wang, Q.; Song, H.; Pan, S.; Dong, N.; Wang, X.; Sun, S. Initial pyrolysis mechanism and product formation of cellulose: An Experimental and Density functional theory (DFT) study. Sci. Rep. 2020, 10, 3626. [Google Scholar] [CrossRef] [PubMed]
- Mettler, M.S.; Mushrif, S.H.; Paulsen, A.D.; Javadekar, A.D.; Vlachos, D.G.; Dauenhauer, P.J. Revealing pyrolysis chemistry for biofuels production: Conversion of cellulose to furans and small oxygenates. Energy Environ. Sci. 2012, 5, 5414–5424. [Google Scholar] [CrossRef]
- Mamleev, V.; Bourbigot, S.; Le Bras, M.; Yvon, J. The facts and hypotheses relating to the phenomenological model of cellulose pyrolysis; Interdependence of the steps. J. Anal. Appl. Pyrolysis 2009, 84, 1–17. [Google Scholar] [CrossRef]
- Jian, Y.; Meng, Y.; Li, H. Selectivity control of C-O bond cleavage for catalytic biomass valorization. Front. Energy Res. 2022, 9, 827680. [Google Scholar] [CrossRef]
- Sudarsanam, P.; Li, H.; Sagar, T.V. TiO2-based water-tolerant acid catalysis for biomass-based fuels and chemicals. ACS Catal. 2020, 10, 9555–9584. [Google Scholar] [CrossRef]
- Puls, J.; Wilson, S.A.; Hölter, D. Degradation of cellulose acetate-based materials: A review. J. Polym. Environ. 2011, 19, 152–165. [Google Scholar] [CrossRef]
- Zhang, C.; Chao, L.; Zhang, Z.; Zhang, L.; Li, Q.; Fan, H.; Zhang, S.; Liu, Q.; Qiao, Y.; Tian, Y.; et al. Pyrolysis of cellulose: Evolution of functionalities and structure of bio-char versus temperature. Renew. Sustain. Energy Rev. 2021, 135, 110416. [Google Scholar] [CrossRef]
- Li, X.; He, F.; Su, X.; Behrendt, F.; Gao, Z.; Wang, H. Evaporation rate of potassium chloride in combustion of herbaceous biomass and its calculation. Fuel 2019, 257, 116021. [Google Scholar] [CrossRef]
- László, K.; Bóta, A.; Nagy, L.G. Comparative adsorption study on carbons from polymer precursors. Carbon 2000, 38, 1965–1976. [Google Scholar] [CrossRef]
- Fowles, J.; Bates, M. The Chemical Constituents in Cigarettes and Cigarette Smoke: Priorities for Harm Reduction; New Zealand Ministry of Health, Epidemiology and Toxicology Group ESR; Kenepuru Science Centre: Porirua, New Zealand, 2000. [Google Scholar]
- Brunauer, S.; Emmett, P.H.; Teller, E. Adsorption of gases in multimolecular layers. J. Am. Chem. Soc. 1938, 60, 309–319. [Google Scholar] [CrossRef]
- Thommes, M.; Kaneko, K.; Neimark, A.V.; Olivier, J.P.; Rodriguez-Reinoso, F.; Rouquerol, J.; Sing, K.S.W. Physisorption of gases, with special reference to the evaluation of surface area and pore size distribution (IUPAC Technical Report). Pure Appl. Chem. 2015, 87, 1051–1069. [Google Scholar] [CrossRef]
- Landers, J.; Gor, G.Y.; Neimark, A.V. Density functional theory methods for characterization of porous materials. Coll. Surf. A Physicochem. Eng. Asp. 2013, 437, 3–32. [Google Scholar] [CrossRef]
- Cychosz, K.A.; Thommes, M. Progress in the physisorption characterization of nanoporous gas storage materials. Engineering 2018, 4, 559–566. [Google Scholar] [CrossRef]
- Johansson, E.M. Controlling the Pore Size and Morphology of Mesoporous Silica; Linköping Studies in Science and Technology Licentiate Thesis No. 1451; Nanostructured Materials Division, Department of Physics, Chemistry and Biology (IFM); Linköping University: Linköping, Sweden, 2010; pp. 3–4. [Google Scholar]
- Wang, W.; Wang, M.; Huang, J.; Li, X.; Cai, L.; Sheldon, Q.S.; Cui, Y.; Chen, L.; Ni, Y. High efficiency pyrolysis of used cigarette filters for ester-rich bio-oil through microwave-assisted heating. J. Clean. Prod. 2020, 257, 120596. [Google Scholar] [CrossRef]
- Conte, P.; Bertani, R.; Sgarbossa, P.; Bambina, P.; Schmidt, H.-P.; Raga, R.; Papa, G.L.; Chillura Martino, D.F.; Lo Meo, P. Recent developments in understanding biochar’s-Physical-Chemistry. Agronomy 2021, 11, 615. [Google Scholar] [CrossRef]
- Opfermann, J. Kinetic analysis using multivariate non-linear regression I. Basic concepts. J. Therm. Anal. Calorim. 2000, 60, 641–658. [Google Scholar] [CrossRef]
- Moukhina, E. Determination of kinetic mechanisms for reactions measured with thermoanalytical instruments. J. Therm. Anal. Calorim. 2012, 109, 1203–1214. [Google Scholar] [CrossRef]
- Moukhina, E. Comparison of isothermal predictions based on model-free and model-based kinetic methods. J. Test. Eval. 2014, 42, 1377–1386. [Google Scholar] [CrossRef]
- Moukhina, E. Initial kinetic parameters for the model-based kinetic method. High Temp. High Press. 2013, 42, 287–302. [Google Scholar]
- Janković, B.; Manić, N.; Radović, I.; Janković, M.; Rajačić, M. Model-free and model-based kinetics of the combustion process of low rank coals with high ash contents using TGA-DTG-DTA-MS and FTIR techniques. Thermochim. Acta 2019, 679, 178337. [Google Scholar]
- NETZSCH, Kinetics Neo Software, Product Version 2.6.0.1, Kinetic Analysis Software for Thermal Measurements of Chemical Reactions. Model-free and Model-based methods. 2022. Available online: https://kinetics.netzsch.com (accessed on 10 January 2023).






| β (K/min) | Rmax (%/min) a | Tin (°C) a | ΔT1/2 (°C) a | Di (%·min−1·°C−3) | T5 (°C) | T30 (°C) | THRI (°C) |
|---|---|---|---|---|---|---|---|
| 10 | 15.5 | 226.52 | 37.58 | 5.324 × 10⁻⁶ | 172.62 | 315.77 | 126.67 |
| 20 | 29.6 | 245.62 | 39.70 | 8.673 × 10⁻⁶ | 179.99 | 322.17 | 130.00 |
| 30 | 43.0 | 249.46 | 43.00 | 1.136 × 10⁻⁵ | 181.94 | 325.14 | 131.25 |
| 1st Group of Peaks b | ||||
|---|---|---|---|---|
| β (K/min) | Tmax (°C) | ΔH° (kJ mol−1) | ΔG° (kJ mol−1) | ΔS° (J mol−1 K−1) |
| 10 | 174.03(447.18) a | 66.97 | 129.46 | −139.74 |
| 20 | 189.87(463.02) a | 66.84 | 131.67 | −140.03 |
| 30 | 198.48(471.63) a | 66.77 | 132.88 | −140.18 |
| Average | 187.46(460.61) a | 66.86 | 131.34 | −139.98 |
| 2nd group of peaks c | ||||
| β (K/min) | Tmax (°C) | ΔH° (kJ mol−1) | ΔG° (kJ mol−1) | ΔS° (J mol−1 K−1) |
| 10 | 342.00(615.15) a | 295.23 | 175.63 | +194.41 |
| 20 | 350.00(623.15) a | 295.16 | 174.08 | +194.30 |
| 30 | 353.00(626.15) a | 295.13 | 173.50 | +194.26 |
| Average | 348.33(621.48) a | 295.17 | 174.40 | +194.32 |
| Model Scheme (q: model code): | |
|---|---|
| A—B | |
| C—D | |
| E—F—G | |
| Model Reaction Steps: | |
| A → B | |
| C → D | |
| E → F | |
| F → G | |
| Step: A → B | |
| Reaction Type: An | |
| Activation Energy (kJ mol−1) | 335.470 |
| Log(PreExp) (s−1) | 27.079 |
| Dimension, n | 0.339 |
| Contribution | 0.548 |
| Step: C → D | |
| Reaction Type: Cnm | |
| Activation Energy (kJ mol−1) | 265.076 |
| Log(PreExp), A (s−1) | 20.278 |
| Reaction order, n | 13.969 |
| Log(AutocatPreExp) | 4.877 |
| Autocatalytic power, m | 4.908 |
| Contribution | 0.311 |
| Step: E → F | |
| Reaction Type: Nakamura | |
| KG (×1000) (K2) | −58.613 |
| Log(PreExp), A (s−1) | −1.233 |
| Dimension, n | 0.404 |
| Melting temperature, Tm (°C) | 258.500 |
| Temperature of Glass, Tg (°C) a | 10.000 |
| U* (kJ mol−1) | 6.300 |
| Contribution | 0.073 |
| Step: F → G | |
| Reaction Type: R3 | |
| Activation Energy (kJ mol−1) | 101.876 |
| Log(PreExp), A (s−1) | 9.214 |
| Contribution | 0.068 |
| Physicochemical Characteristics of CAc800(1h) Received by the BET Analysis | |
|---|---|
| Monolayer volume (cm3 g−1) | 12.784 ± 0.266 |
| Monolayer amount (mmol g−1) | 0.570 ± 0.012 |
| C | 4.563 |
| Surface area (m2 g−1) | 55.646 ± 1.156 |
| CAc800(1h) Pore Characteristics from BJH Model | ||
|---|---|---|
| Median pore radius (nm) | 3.1695 | |
| Maximum pore radius (nm) | 1.4191 | |
| Cumulative pore volume (cm3 g−1) | 0.0644 | |
| Cumulative pore area (m2 g−1) | 42.6680 | |
| Pore class | Vpore (cm3 g−1) (Figure 15) | Vpore (%) |
| From 0 [nm] to 50 [nm] classified as mesoporous material by pore classes | 0.0374 | 58.1 |
| Sample | SBET (m2 g−1) | PBJH (nm) | Reference |
|---|---|---|---|
| UCF-1 | 379.89 | 3.57 | [106] |
| UCF-2 | 322.40 | 3.96 | |
| CF-1 | 376.29 | 2.45 | |
| CF-2 | 376.84 | 2.67 | |
| CAc800(1h) | 55.65 | 3.17 | This work |
Disclaimer/Publisher’s Note: The statements, opinions and data contained in all publications are solely those of the individual author(s) and contributor(s) and not of MDPI and/or the editor(s). MDPI and/or the editor(s) disclaim responsibility for any injury to people or property resulting from any ideas, methods, instructions or products referred to in the content. |
© 2023 by the authors. Licensee MDPI, Basel, Switzerland. This article is an open access article distributed under the terms and conditions of the Creative Commons Attribution (CC BY) license (https://creativecommons.org/licenses/by/4.0/).
Share and Cite
Janković, B.; Kojić, M.; Milošević, M.; Rosić, M.; Waisi, H.; Božilović, B.; Manić, N.; Dodevski, V. Upcycling of the Used Cigarette Butt Filters through Pyrolysis Process: Detailed Kinetic Mechanism with Bio-Char Characterization. Polymers 2023, 15, 3054. https://doi.org/10.3390/polym15143054
Janković B, Kojić M, Milošević M, Rosić M, Waisi H, Božilović B, Manić N, Dodevski V. Upcycling of the Used Cigarette Butt Filters through Pyrolysis Process: Detailed Kinetic Mechanism with Bio-Char Characterization. Polymers. 2023; 15(14):3054. https://doi.org/10.3390/polym15143054
Chicago/Turabian StyleJanković, Bojan, Marija Kojić, Milena Milošević, Milena Rosić, Hadi Waisi, Bojana Božilović, Nebojša Manić, and Vladimir Dodevski. 2023. "Upcycling of the Used Cigarette Butt Filters through Pyrolysis Process: Detailed Kinetic Mechanism with Bio-Char Characterization" Polymers 15, no. 14: 3054. https://doi.org/10.3390/polym15143054
APA StyleJanković, B., Kojić, M., Milošević, M., Rosić, M., Waisi, H., Božilović, B., Manić, N., & Dodevski, V. (2023). Upcycling of the Used Cigarette Butt Filters through Pyrolysis Process: Detailed Kinetic Mechanism with Bio-Char Characterization. Polymers, 15(14), 3054. https://doi.org/10.3390/polym15143054


