
Post-Cracking Properties of Concrete Reinforced with Polypropylene Fibers through the Barcelona Test


Abstract
:
1. Introduction
2. Materials and Methods
2.1. Research Design
2.2. Specimen
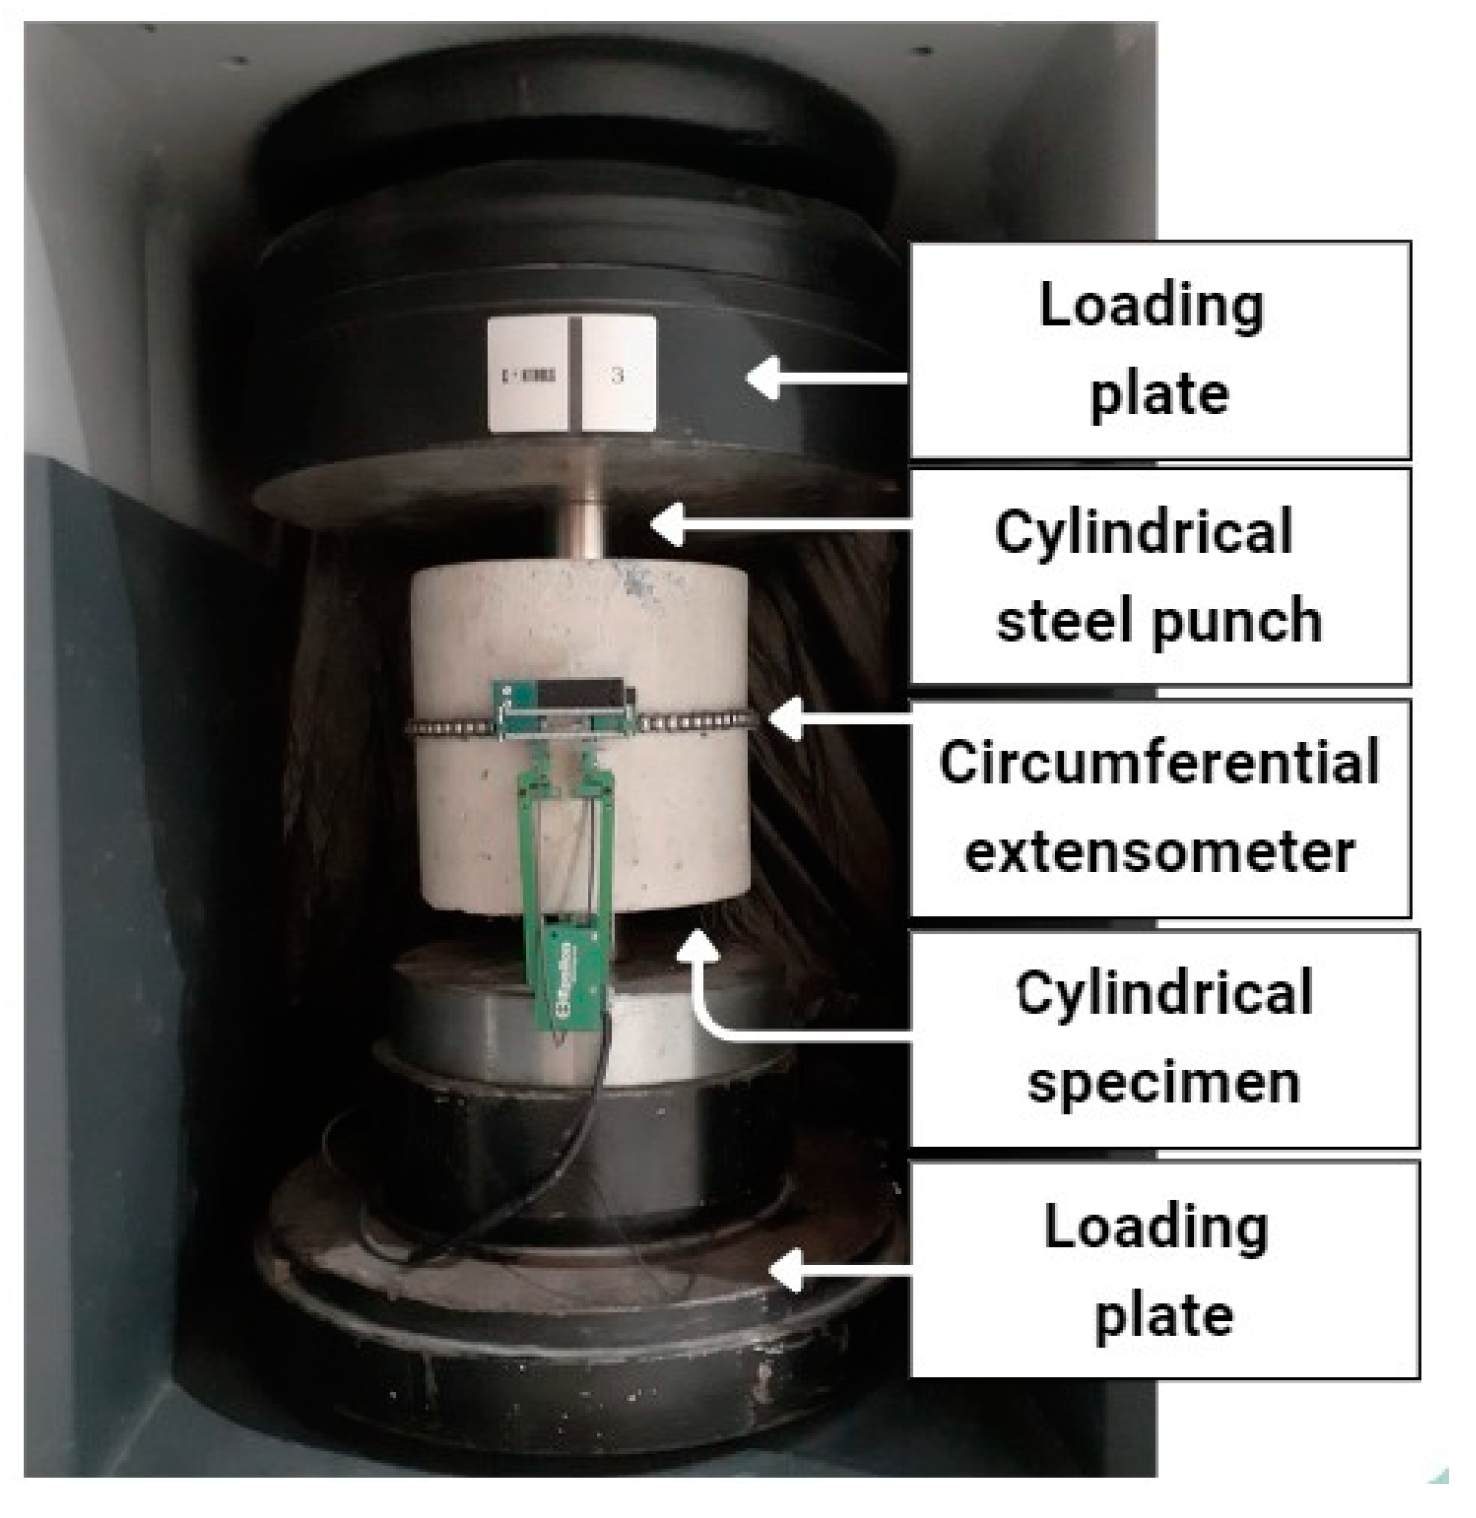
2.3. Barcelona Test
2.4. Mixing Procedure
2.5. Hypothesis Test
3. Results and Analysis
3.1. Post-Cracking Properties
3.1.1. Toughness
3.1.2. Residual Strength
3.2. Comparative Analysis of Toughness as a Function of RI
3.3. Variance Analysis
4. Conclusions
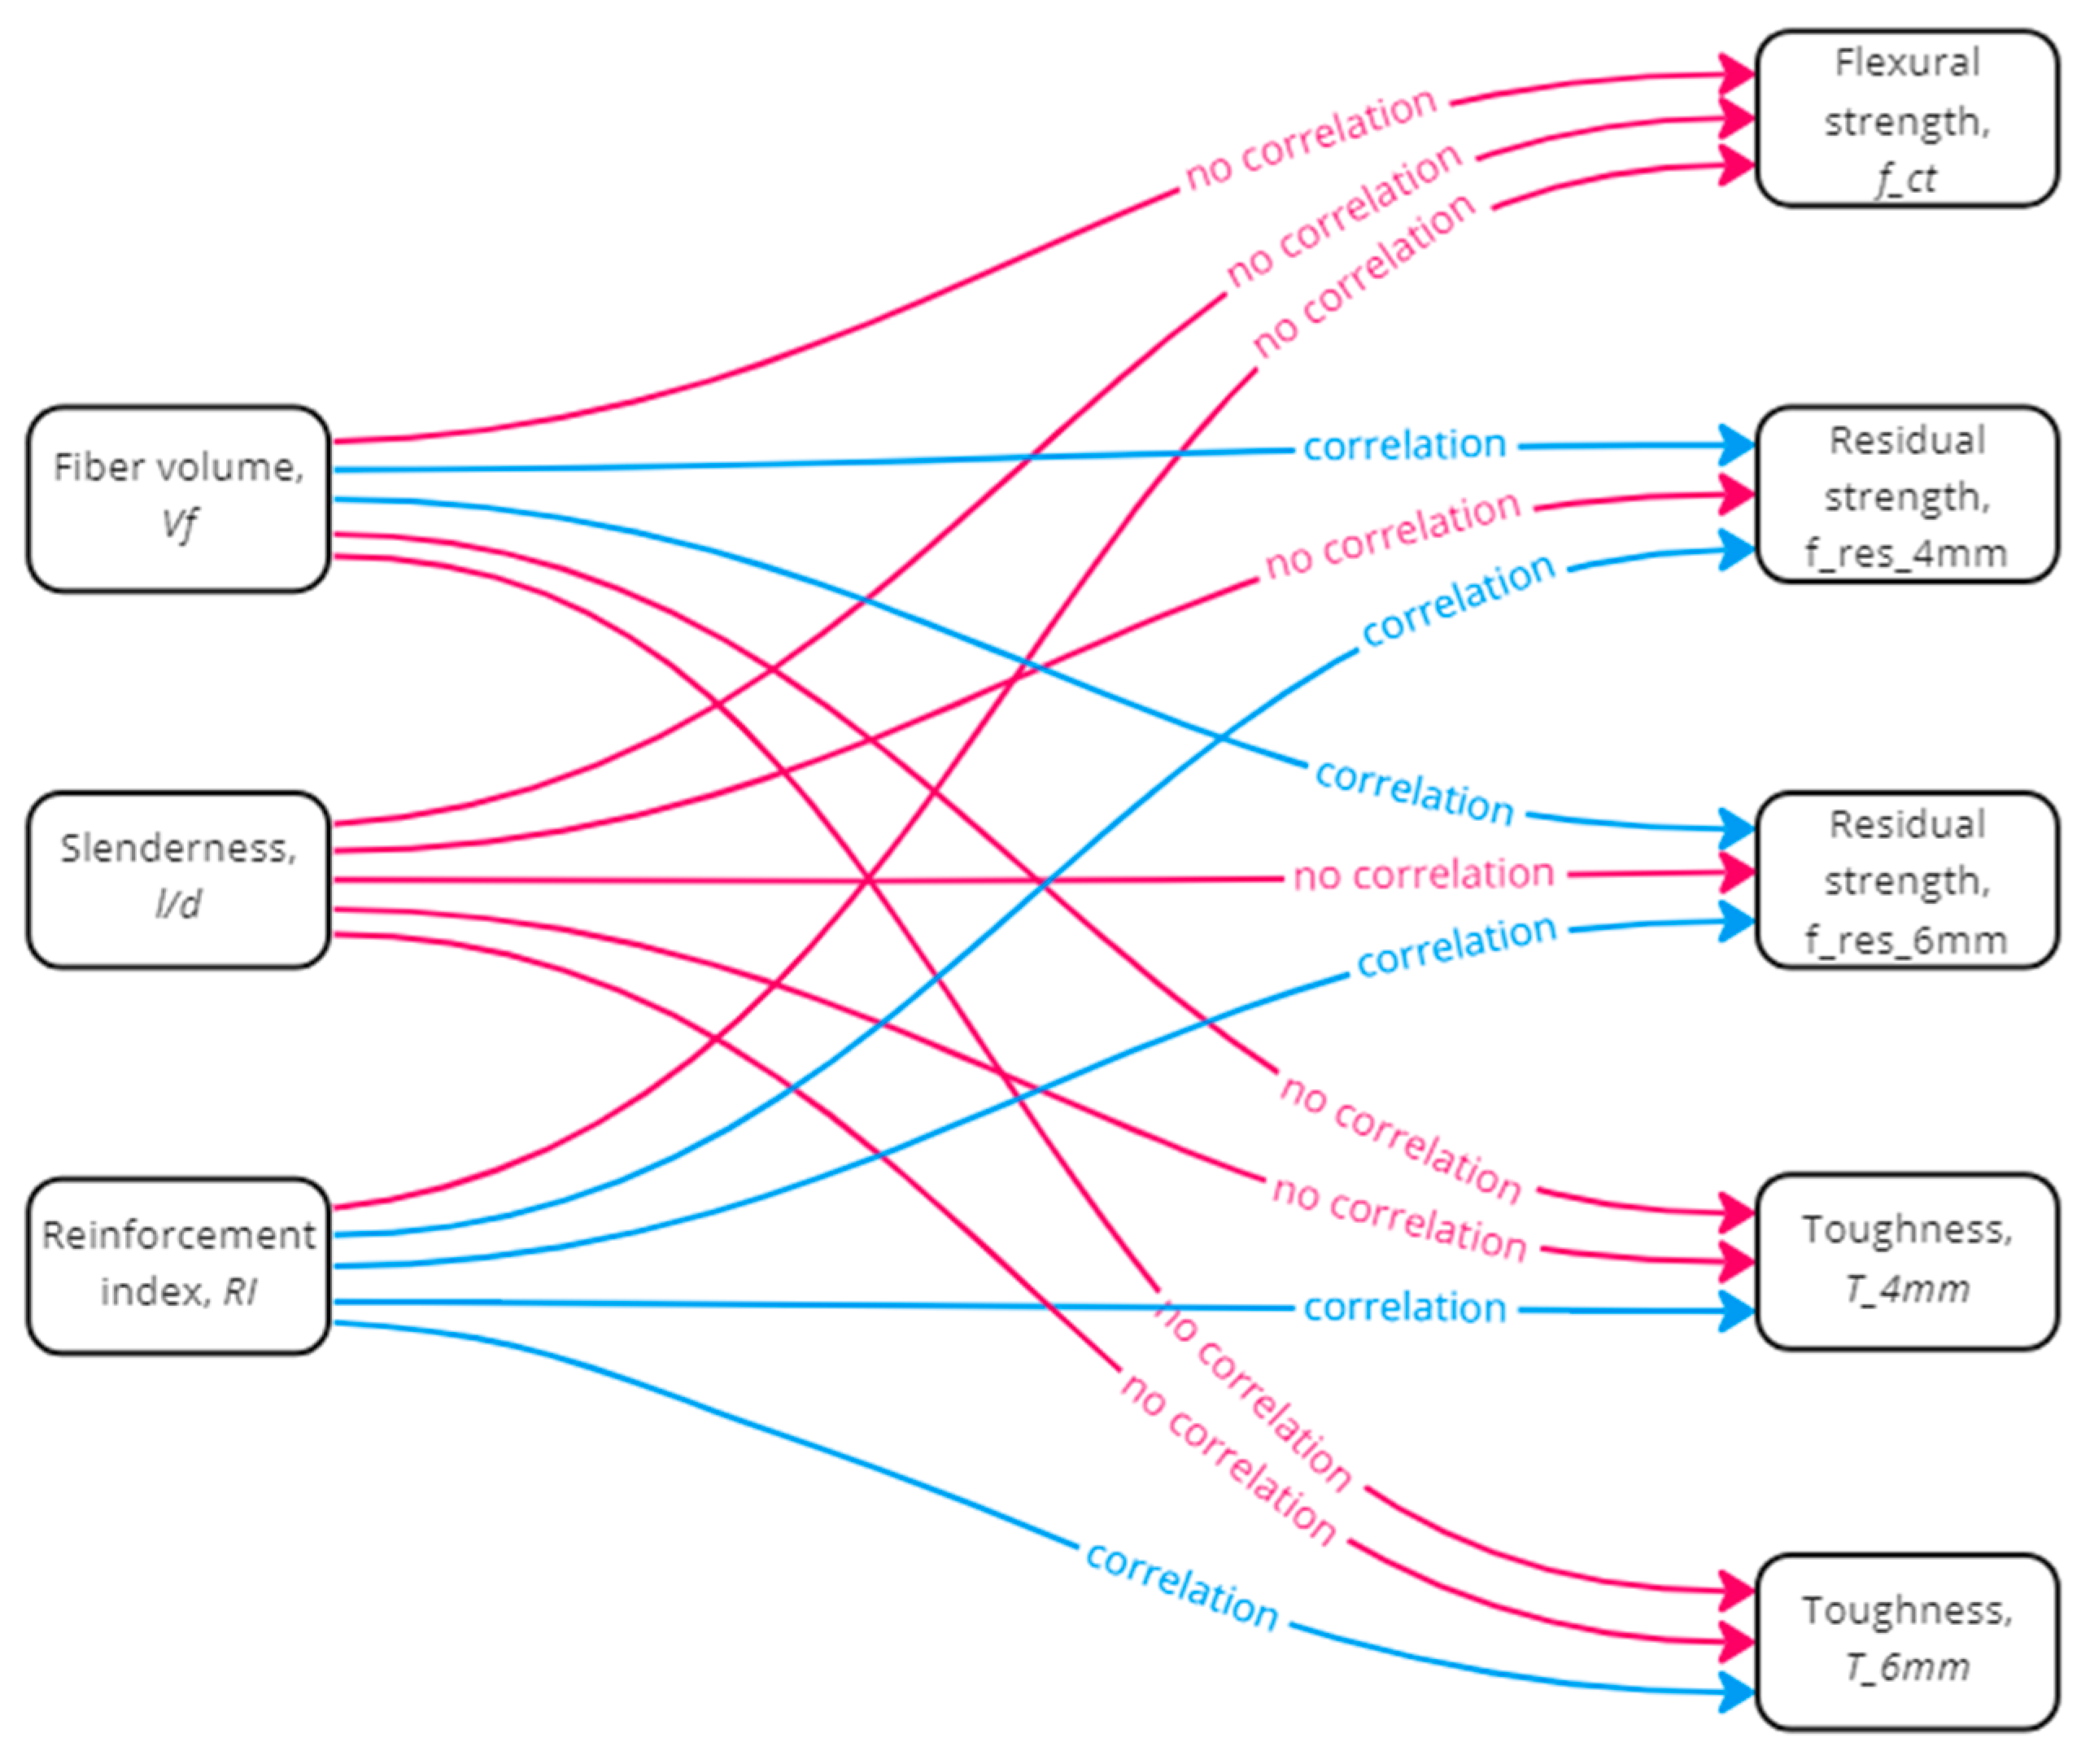
- There was a correlation between fiber volume and residual strength, with a Pearson correlation coefficient of 0.82 showing a strong relationship. On the other hand, in this method, the null hypothesis that proposed no correlation between fiber volume and toughness cannot be rejected. However, there was a correlation between the reinforcement index with toughness and residual strengths; the RI was the product of the slenderness with the volume of fibers.
- Four empirical equations were developed to predict the toughness of concrete as a function of the RI. Equations (2) and (3) predicted the toughness of concrete reinforced with polypropylene fibers, measured at 6 and 4 mm TCOD. Pearson’s correlation coefficient is 0.68 and 0.69, respectively. Equations (4) and (5) predicted the residual strength, measured at 6 and 4 mm TCOD. Finally, these equations can be used for concrete with compressive strength of 40 to 45 MPa, slump ranging from 46 to 240 mm, elaborated with aggregates with a maximum nominal size of 25.4 mm.
- The coefficient of variation of the toughness calculated by the Barcelona method varies depending on the material and the pouring location. The COV of FRC with metallic fibers is 11.11% and 10.71% for mine and laboratory-made concrete, respectively. The COV of FRC with synthetic fibers is 18.81% and 15.05% for mine and laboratory-made concrete, respectively.
Author Contributions
Funding
Data Availability Statement
Acknowledgments
Conflicts of Interest
References
- Ganta, J.K.; Seshagiri Rao, M.V.; Mousavi, S.S.; Srinivasa Reddy, V.; Bhojaraju, C. Hybrid Steel/Glass Fiber-Reinforced Self-Consolidating Concrete Considering Packing Factor: Mechanical and Durability Characteristics. Structures 2020, 28, 956–972. [Google Scholar] [CrossRef]
- Yew, M.K.; Bin Mahmud, H.; Ang, B.C.; Yew, M.C. Influence of Different Types of Polypropylene Fibre on the Mechanical Properties of High-Strength Oil Palm Shell Lightweight Concrete. Constr. Build. Mater. 2015, 90, 36–43. [Google Scholar] [CrossRef]
- Choumanidis, D.; Badogiannis, E.; Nomikos, P.; Sofianos, A. Barcelona Test for the Evaluation of the Mechanical Properties of Single and Hybrid FRC, Exposed to Elevated Temperature. Constr. Build. Mater. 2017, 138, 296–305. [Google Scholar] [CrossRef]
- Yousefi, M.; Khandestani, R.; Gharaei-Moghaddam, N. Flexural Behavior of Reinforced Concrete Beams Made of Normal and Polypropylene Fiber-Reinforced Concrete Containing Date Palm Leaf Ash. Structures 2022, 37, 1053–1068. [Google Scholar] [CrossRef]
- Yoo, D.-Y.; Kim, S.-W.; Park, J.-J. Comparative Flexural Behavior of Ultra-High-Performance Concrete Reinforced with Hybrid Straight Steel Fibers. Constr. Build. Mater. 2017, 132, 219–229. [Google Scholar] [CrossRef]
- Carmona, S.; Molins, C.; Aguado, A. Correlation between Bending Test and Barcelona Tests to Determine FRC Properties. Constr. Build. Mater. 2018, 181, 673–686. [Google Scholar] [CrossRef]
- Fu, Q.; Xu, W.; Bu, M.; Guo, B.; Niu, D. Effect and Action Mechanism of Fibers on Mechanical Behavior of Hybrid Basalt-Polypropylene Fiber-Reinforced Concrete. Structures 2021, 34, 3596–3610. [Google Scholar] [CrossRef]
- Qin, Y.; Li, Y.; Zhang, X.; Zhou, H. Constitutive Model of Polypropylene-Fiber-Fabric-Reinforced Concrete under Uniaxial Compression and Index Conversion of Mechanical Properties. Constr. Build. Mater. 2022, 347, 128508. [Google Scholar] [CrossRef]
- Cifuentes, H.; García, F.; Maeso, O.; Medina, F. Influence of the Properties of Polypropylene Fibres on the Fracture Behaviour of Low-, Normal- and High-Strength FRC. Constr. Build. Mater. 2013, 45, 130–137. [Google Scholar] [CrossRef]
- Del Savio, A.A.; La Torre, D.; Cedrón, J.P. Experimental Volume Incidence Study and the Relationship of Polypropylene Macrofiber Slenderness to the Mechanical Strengths of Fiber-Reinforced Concretes. Appl. Sci. 2022, 12, 9126. [Google Scholar] [CrossRef]
- Moreira de Alencar Monteiro, V.; de Andrade Silva, F. The Use of the Barcelona Test as Quality Control of Fiber Reinforced Shotcrete for Underground Mining. Constr. Build. Mater. 2020, 262, 120719. [Google Scholar] [CrossRef]
- Carmona, S.; Aguado, A.; Molins, C. Characterization of the Properties of Steel Fiber Reinforced Concrete by Means of the Generalized Barcelona Test. Constr. Build. Mater. 2013, 48, 592–600. [Google Scholar] [CrossRef]
- Nogueira, A.B.; de Carvalho Ribeiro Simão, L.; Monte, R.; Salvador, R.P.; de Figueiredo, A.D. Evaluation of the Repeatability and Reproducibility of the Double Punch Test. Constr. Build. Mater. 2021, 268, 121145. [Google Scholar] [CrossRef]
- Pujadas, P.; Blanco, A.; Cavalaro, S.H.P.; De La Fuente, A.; Aguado, A. Multidirectional Double Punch Test to Assess the Post-Cracking Behaviour and Fibre Orientation of FRC. Constr. Build. Mater. 2014, 58, 214–224. [Google Scholar] [CrossRef]
- BSI Standards Publication EN 14651+A1; Test Method for Metallic Fibre Concrete—Measureing the Flexural Tensile Strength (Limit of Proportionality (LOP), Residual). European Standard: Brussels, Belgium, 2008.
- ASTM International ASTM C1609/C1609M; 19 Standard Test Method for Flexural Performance of Fiber-Reinforced Concrete (Using Beam with Third-Point Loading). ASTM Special Technical Publication: West Conshohocken, PA, USA, 2019.
- UNE-EN UNE-EN 14488-5:2007 Ensayos de Hormigón Proyectado. Parte 5: D. Available online: https://www.aenor.com/normas-y-libros/buscador-de-normas/une/?c=N0038687 (accessed on 8 May 2020).
- ASTM International ASTM C1550; Standard Test Methos for Flexural Toughness of Fiber Reinforced Concrete (Using Centrally Loaded Round Panel). ASTM Special Technical Publication: West Conshohocken, PA, USA, 2005.
- Molins, C.; Aguado, A.; Saludes, S. Double Punch Test to Control the Energy Dissipation in Tension of FRC (Barcelona Test). Mater. Struct. 2009, 42, 415–425. [Google Scholar] [CrossRef]
- Galeote, E.; Blanco, A.; Cavalaro, S.H.P.; de la Fuente, A. Correlation between the Barcelona Test and the Bending Test in Fibre Reinforced Concrete. Constr. Build. Mater. 2017, 152, 529–538. [Google Scholar] [CrossRef]
- European Committee for Standardization UNE 83515; Detreminación de La Resistencia a Fisuración, Tenacidad y Resistencia Residual a Tracción “Método Barcelona”. AENOR: Madrid, España, 2010.
- Carmona, S.; Molins, C.; García, S. Application of Barcelona Test for Controlling Energy Absorption Capacity of FRS in Underground Mining Works. Constr. Build. Mater. 2020, 246, 118458. [Google Scholar] [CrossRef]
- Kim, D.J.; Park, S.H.; Ryu, G.S.; Koh, K.T. Comparative Flexural Behavior of Hybrid Ultra High Performance Fiber Reinforced Concrete with Different Macro Fibers. Constr. Build. Mater. 2011, 25, 4144–4155. [Google Scholar] [CrossRef]
- Lanzoni, L.; Nobili, A.; Tarantino, A.M. Performance Evaluation of a Polypropylene-Based Draw-Wired Fibre for Concrete Structures. Constr. Build. Mater. 2012, 28, 798–806. [Google Scholar] [CrossRef]
- Carmona, S.; Aguado de Cea, A.; Molins Borrell, C. Generalization of the Barcelona Test for the Toughness Control of FRC. Mater. Struct. 2012, 45, 1053–1069. [Google Scholar] [CrossRef]
- Aire, C.; Molins, C.; Aguado, A. Ensayo de Doble Punzonamiento Para Concreto Reforzado Con Fibra: Efecto Del Tamaño y Origen de La Probeta. Concreto Y Cem. Investig. Y Desarro. 2013, 5, 17–31. [Google Scholar]
- Del Savio, A.A.; Esquivel, D.L.T.; de Andrade Silva, F.; Agreda Pastor, J. Influence of Synthetic Fibers on the Flexural Properties of Concrete: Prediction of Toughness as a Function of Volume, Slenderness Ratio and Elastic Modulus of Fibers. Polymers 2023, 15, 909. [Google Scholar] [CrossRef] [PubMed]
- Del Savio, A.A.; La Torre Esquivel, D.; Carrillo, J.; Chi Yep, E. Determination of Polypropylene Fiber-Reinforced Concrete Compressive Strength and Elasticity Modulus via Ultrasonic Pulse Tests. Appl. Sci. 2022, 12, 10375. [Google Scholar] [CrossRef]
- ASTM International ASTM C150/C150M; Standard Specification for Portland Cement. ASTM Special Technical Publication: West Conshohocken, PA, USA, 2022.
- ASTM International ASTM C33; Standard Specification for Concrete Aggregates. ASTM Special Technical Publication: West Conshohocken, PA, USA, 1999.
- ASTM International ASTM C494; Standard Specification for Chemical Admixtures for Concrete. ASTM Special Technical Publication: West Conshohocken, PA, USA, 2008.
- ACI Committee 211; Standard Practice for Selecting Proportions for Normal, Heavyweight, and Mass Concrete. Academia: Detroit, MI, USA, 1991.
- Gill, D.E.; Corthésy, R.; Leite, M.H. Determining the Minimal Number of Specimens for Laboratory Testing of Rock Properties. Eng. Geol. 2005, 78, 29–51. [Google Scholar] [CrossRef]
- Hernandez Sampieri, R. Metodología de La Investigación; Sexta; Mc Graw Hil: Mexico City, Mexico, 2014. [Google Scholar]
- Almeida Del Savio, A.; La Torre, D.; Gamboa, B.; Zuñiga, J. Experimental Research on the Influence of Polypropylene Macrofiber Thickness in Fiber-Reinforced Concrete Mechanical Strengths. In Advances in Mechanics of Materials for Environmental and Civil Engineering; dell’Isola, F., Barchiesi, E., León Trujillo, F.J., Eds.; Advanced Structured Materials; Springer: Cham, Switzerland, 2023; Volume 197, Chapter 1; pp. 1–17. [Google Scholar] [CrossRef]
- Pujadas, P.; Blanco, A.; Cavalaro, S.; De La Fuente, A.; Aguado, A. New Analytical Model to Generalize the Barcelona Test Using Axial Displacement. J. Civ. Eng. Manag. 2013, 19, 259–271. [Google Scholar] [CrossRef]
- Galobardes, I.; Figueiredo, A. Correlation between Beam and Barcelona Tests for FRC Quality Control for Structural Applications. In Proceedings of the International Conference FIBRE CONCRETE, Leipzig, Germany, 5–7 October 2015; Volume 1, pp. 149–158. [Google Scholar]


| Type | PP Fibers 40 mm | PP Fibers 50 mm | PP Fibers 60 mm | Water | Cement | Fine Aggregate | Coarse Aggregate | Water Reducer |
|---|---|---|---|---|---|---|---|---|
| Pattern | - | - | - | 226.6 | 502.8 | 721.1 | 891.2 | 7.1 |
| D:0.4–40 | 3.6 | - | - | 226.6 | 502.8 | 721.1 | 891.2 | 7.1 |
| D:0.4–50 | - | 3.6 | - | 226.6 | 502.8 | 721.1 | 891.2 | 7.1 |
| D:0.4–60 | - | - | 3.6 | 226.6 | 502.8 | 721.1 | 891.2 | 7.1 |
| D:0.8–40 | 7.2 | - | - | 226.6 | 502.8 | 721.1 | 891.2 | 7.1 |
| D:0.8–50 | - | 7.2 | - | 226.6 | 502.8 | 721.1 | 891.2 | 7.1 |
| D:0.8–60 | - | - | 7.2 | 226.6 | 502.8 | 721.1 | 891.2 | 7.1 |
| D:1.2–40 | 10.8 | - | - | 226.6 | 502.8 | 721.1 | 891.2 | 7.1 |
| D:1.2–50 | - | 10.8 | - | 226.6 | 502.8 | 721.1 | 891.2 | 7.1 |
| D:1.2–60 | - | - | 10.8 | 226.6 | 502.8 | 721.1 | 891.2 | 7.1 |
| Batch | V_f (%) | l/d (-) | RI (V_f × l/d) | f_c (MPa) | COV (%) | f_t (MPa) | COV (%) | Slump (mm) |
|---|---|---|---|---|---|---|---|---|
| Pattern | 0.0 | 0.0 | 0.0 | 42.2 | 4.7% | 5.6 | 16.4% | 240 |
| D:0.4–40 | 0.4 | 46.5 | 18.6 | 41.2 | 3.0% | 5.9 | 18.7% | 210 |
| D:0.4–50 | 0.4 | 58.1 | 23.3 | 42.9 | 4.3% | 5.8 | 13.8% | 210 |
| D:0.4–60 | 0.4 | 69.8 | 27.9 | 39.6 | 2.6% | 5.9 | 11.0% | 140 |
| D:0.8–40 | 0.8 | 46.5 | 37.2 | 39.6 | 4.1% | 6.7 | 9.6% | 175 |
| D:0.8–50 | 0.8 | 58.1 | 46.5 | 41.2 | 7.4% | 7.2 | 7.4% | 70 |
| D:0.8–60 | 0.8 | 69.8 | 55.8 | 42.9 | 3.6% | 5.5 | 7.4% | 125 |
| D:1.2–40 | 1.2 | 46.5 | 55.8 | 42.6 | 1.2% | 6.5 | 9.2% | 95 |
| D:1.2–50 | 1.2 | 58.1 | 69.8 | 41.0 | 8.6% | 5.5 | 15.5% | 46 |
| D:1.2–60 | 1.2 | 69.8 | 83.7 | 43.6 | 18.8% | 5.2 | 11.7% | 111 |
| Batch | RI (V_f × l/d) | Pmax (kN) | COV (%) | f_ct (MPa) | P_4 mm (kN) | COV (%) | f_res_4 mm (MPa) | T_4 mm (N × m) | COV (%) | P_6 mm (kN) | COV (%) | f_res_6 mm (MPa) | T_6 mm (N × m) | COV (%) |
|---|---|---|---|---|---|---|---|---|---|---|---|---|---|---|
| Pattern | 0.0 | 128.3 | 8.1% | 8.1 | - | - | - | - | - | - | - | - | - | - |
| D:0.4–40 | 18.6 | 123.2 | 6.4% | 7.7 | 24.9 | 14.6% | 1.56 | 152.8 | 33.1% | 18.6 | 16.6% | 1.2 | 177.3 | 29.8% |
| D:0.4–50 | 23.3 | 134.2 | 4.1% | 8.4 | 25.1 | 29.6% | 1.58 | 174.6 | 17.4% | 18.4 | 36.4% | 1.2 | 221.3 | 19.1% |
| D:0.4–60 | 27.9 | 133.2 | 6.8% | 8.4 | 29.8 | 24.1% | 1.88 | 197.0 | 15.2% | 16.3 | 48.7% | 1.0 | 260.1 | 16.5% |
| D:0.8–40 | 37.2 | 133.3 | 4.0% | 8.4 | 30.7 | 25.6% | 1.93 | 200.5 | 16.2% | 24.6 | 32.4% | 1.5 | 257.8 | 18.9% |
| D:0.8–50 | 46.5 | 131.3 | 10.2% | 8.3 | 38.0 | 13.0% | 2.39 | 227.1 | 15.4% | 29.1 | 10.3% | 1.8 | 302.8 | 10.6% |
| D:0.8–60 | 55.8 | 121.2 | 6.8% | 7.6 | 28.2 | 13.7% | 1.77 | 186.0 | 11.4% | 22.3 | 13.7% | 1.4 | 235.9 | 11.2% |
| D:1.2–40 | 55.8 | 117.1 | 6.6% | 7.4 | 35.3 | 13.1% | 2.22 | 173.9 | 24.0% | 27.4 | 15.7% | 1.7 | 229.9 | 23.1% |
| D:1.2–50 | 69.8 | 126.6 | 4.8% | 8.0 | 39.6 | 13.5% | 2.49 | 226.9 | 10.6% | 29.7 | 19.1% | 1.9 | 295.9 | 11.7% |
| D:1.2–60 | 83.7 | 126.3 | 4.3% | 7.9 | 38.9 | 9.8% | 2.45 | 230.1 | 10.7% | 29.1 | 25.9% | 1.8 | 298.7 | 9.3% |
| Item | MV | IV | DV | R2 | R | p | Null Hypothesis |
|---|---|---|---|---|---|---|---|
| 1 | l/d = 47 | V_f | f_ct | 18.96% | 43.54% | 0.565 | no rejection |
| 2 | l/d = 58 | V_f | f_ct | 9.04% | 30.07% | 0.699 | no rejection |
| 3 | l/d = 70 | V_f | f_ct | 21.75% | 46.64% | 0.534 | no rejection |
| 4 | 0.4 | l/d | f_ct | 67.25% | 82.01% | 0.388 | no rejection |
| 5 | 0.8 | l/d | f_ct | 86.95% | 93.25% | 0.235 | no rejection |
| 6 | 1.2 | l/d | f_ct | 5.41% | 23.26% | 0.767 | no rejection |
| 7 | - | RI | f_ct | 11.92% | 34.53% | 0.329 | no rejection |
| 8 | l/d = 47 | V_f | f_res_4 mm | 84.03% | 91.67% | 0.083 | rejected |
| 9 | l/d = 58 | V_f | f_res_4 mm | 86.30% | 92.90% | 0.071 | rejected |
| 10 | l/d = 70 | V_f | f_res_4 mm | 77.90% | 88.26% | 0.117 | no rejection |
| 11 | 0.4 | l/d | f_res_4 mm | 78.83% | 88.79% | 0.304 | no rejection |
| 12 | 0.8 | l/d | f_res_4 mm | 6.18% | 24.86% | 0.840 | no rejection |
| 13 | 1.2 | l/d | f_res_4 mm | 60.41% | 77.72% | 0.433 | no rejection |
| 14 | - | RI | f_res_4 mm | 67.66% | 82.26% | 0.006 | rejected |
| 15 | l/d = 47 | V_f | f_res_6 mm | 85.19% | 92.30% | 0.077 | rejected |
| 16 | l/d = 58 | V_f | f_res_6 mm | 86.24% | 92.87% | 0.071 | rejected |
| 17 | l/d = 70 | V_f | f_res_6 mm | 93.12% | 96.50% | 0.035 | rejected |
| 18 | 0.4 | l/d | f_res_6 mm | 75.21% | 86.72% | 0.332 | no rejection |
| 19 | 0.8 | l/d | f_res_6 mm | 5.89% | 24.27% | 0.844 | no rejection |
| 20 | 1.2 | l/d | f_res_6 mm | 24.79% | 49.79% | 0.668 | no rejection |
| 21 | - | RI | f_res_6 mm | 71.54% | 84.58% | 0.002 | rejected |
| 22 | l/d = 47 | V_f | T_4 mm | 66.70% | 81.67% | 0.183 | no rejection |
| 23 | l/d = 58 | V_f | T_4 mm | 77.34% | 87.94% | 0.121 | no rejection |
| 24 | l/d = 70 | V_f | T_4 mm | 71.28% | 84.43% | 0.156 | no rejection |
| 25 | 0.4 | l/d | T_4 mm | 100.00% | 100.00% | 0.003 | rejected |
| 26 | 0.8 | l/d | T_4 mm | 12.25% | 35.00% | 0.772 | no rejection |
| 27 | 1.2 | l/d | T_4 mm | 65.89% | 81.17% | 0.397 | no rejection |
| 28 | - | RI | T_4 mm | 47.98% | 69.27% | 0.039 | rejected |
| 29 | l/d = 47 | V_f | T_6 mm | 73.79% | 85.90% | 0.141 | no rejection |
| 30 | l/d = 58 | V_f | T_6 mm | 78.12% | 88.39% | 0.116 | no rejection |
| 31 | l/d = 70 | V_f | T_6 mm | 69.57% | 83.41% | 0.166 | no rejection |
| 32 | 0.4 | l/d | T_6 mm | 99.85% | 99.92% | 0.025 | rejected |
| 33 | 0.8 | l/d | T_6 mm | 10.46% | 32.34% | 0.790 | no rejection |
| 34 | 1.2 | l/d | T_6 mm | 77.84% | 88.23% | 0.312 | no rejection |
| 35 | - | RI | T_6 mm | 46.20% | 67.97% | 0.044 | rejected |
| Item | Author | Material | Place | E_fib (GPa) | V_f (%) | L (mm) | d (mm) | l/d (-) | RI (V_f × l/d) | fres_4 mm (MPa) | COV (%) | T_4 mm (N × m) | COV (%) |
|---|---|---|---|---|---|---|---|---|---|---|---|---|---|
| 1 | [25] | steel | Laboratory | 200 | 0.32 | 35 | 0.55 | 64 | 20 | - | - | 241.8 | 4.8% |
| steel | Laboratory | 200 | 0.64 | 35 | 0.55 | 64 | 41 | - | - | 350.6 | 6.2% | ||
| steel | Laboratory | 200 | 0.96 | 35 | 0.55 | 64 | 61 | - | - | 293.0 | 14.4% | ||
| 2 | [12] | steel | Laboratory | 200 | 0.50 | 35 | 1.00 | 35 | 18 | 0.74 | 26.2% | 186.6 | 14.4% |
| steel | Laboratory | 200 | 1.00 | 35 | 1.00 | 35 | 35 | 0.95 | 9.9% | 235.6 | 5.6% | ||
| steel | Laboratory | 200 | 0.50 | 50 | 1.00 | 50 | 25 | 0.59 | 2.4% | 193.6 | 8.5% | ||
| steel | Laboratory | 200 | 1.00 | 50 | 1.00 | 50 | 50 | 1.30 | 10.1% | 326.8 | 5.7% | ||
| 3 | [26] | steel | Laboratory | 210 | 0.38 | 35 | 0.55 | 64 | 25 | 1.09 | 19.2% | 301.4 | 5.7% |
| steel | Laboratory | 210 | 0.38 | 42 | 0.61 | 69 | 26 | 0.90 | 21.0% | 232.2 | 10.5% | ||
| steel | Laboratory | 210 | 0.38 | 49 | 0.72 | 68 | 26 | 0.99 | 8.8% | 259.3 | 5.8% | ||
| steel | Laboratory | 210 | 0.38 | 60 | 0.84 | 72 | 27 | 1.14 | 19.3% | 301.8 | 13.2% | ||
| 4 | [36] | syn | Laboratory | 10 | 0.55 | 48 | - | - | - | - | - | 259.4 | 13.2% |
| syn | Laboratory | 10 | 0.99 | 48 | - | - | - | - | - | 265.8 | 11.6% | ||
| steel | Laboratory | 210 | 0.76 | 50 | 0.62 | 81 | 62 | - | - | 352.8 | 15.9% | ||
| steel | Laboratory | 210 | 0.51 | 50 | 0.62 | 81 | 41 | - | - | 310.6 | 2.2% | ||
| 5 | [19] | syn | Laboratory | - | 0.55 | 48 | 0.91 | 53 | 29 | - | - | 230.0 | 13.6% |
| syn | Laboratory | - | 0.71 | 48 | 0.91 | 53 | 38 | - | - | 233.8 | 22.5% | ||
| steel | Laboratory | 200 | 0.32 | 50 | 0.75 | 67 | 21 | - | - | 236.0 | 13.1% | ||
| 6 | [11] | syn | Laboratory | 7 | 0.46 | 54 | 0.87 | 62 | 29 | 0.35 | 11.4% | 89.2 | 10.4% |
| syn | Laboratory | 7 | 0.46 | 54 | 0.87 | 62 | 29 | 0.22 | 18.2% | 66.6 | 14.6% | ||
| syn | Laboratory | 7 | 0.46 | 54 | 0.87 | 62 | 29 | 0.34 | 50.0% | 62.6 | 10.3% | ||
| syn | Laboratory | 7 | 0.46 | 54 | 0.87 | 62 | 29 | 0.34 | 17.6% | 117.4 | 5.7% | ||
| steel | Laboratory | 210 | 0.32 | 35 | 0.54 | 65 | 21 | 0.49 | 30.6% | 94.3 | 18.5% | ||
| steel | Laboratory | 210 | 0.32 | 35 | 0.54 | 65 | 21 | 0.59 | 30.5% | 93.8 | 7.4% | ||
| steel | Laboratory | 210 | 0.32 | 35 | 0.54 | 65 | 21 | 0.58 | 36.2% | 86.4 | 18.7% | ||
| steel | Laboratory | 210 | 0.32 | 35 | 0.54 | 65 | 21 | 0.57 | 7.0% | 105.1 | 18.6% | ||
| steel | Laboratory | 210 | 0.51 | 35 | 0.54 | 65 | 33 | 0.82 | 17.1% | 114.0 | 4.2% | ||
| steel | Laboratory | 210 | 0.76 | 35 | 0.54 | 65 | 50 | 0.91 | 17.6% | 125.1 | 13.8% | ||
| 7 | [37] | steel | Laboratory | 200 | 0.51 | - | - | 70 | 36 | - | - | 283.80 | 17.7% |
| 8 | [22] | syn | Tunnel | - | - | 54 | 0.84 | 64 | - | - | - | 254.96 | 18.8% |
| syn | Laboratory | - | 0.44 | 54 | 0.84 | 64 | 28 | 175.0 | - | ||||
| syn | Laboratory | - | 0.88 | 54 | 0.84 | 64 | 57 | 230.0 | - | ||||
| syn | Laboratory | - | 1.32 | 54 | 0.84 | 64 | 85 | 260.0 | - | ||||
| 9 | [6] | steel | Tunnel | 200 | 0.38 | 50 | 1.05 | 47 | 18 | 0.85 | 15.0% | 248.2 | 10.8% |
| steel | Tunnel | 200 | 0.64 | 50 | 1.05 | 47 | 31 | 0.95 | 19.0% | 277.7 | 11.6% | ||
| steel | Tunnel | 200 | 0.51 | 60 | 0.71 | 85 | 43 | 1.74 | 11.0% | 391.2 | 6.8% | ||
| steel | Tunnel | 200 | 0.77 | 60 | 0.71 | 85 | 65 | 1.73 | 6.0% | 389.3 | 8.3% | ||
| steel | Tunnel | 200 | 0.39 | 35 | 0.55 | 64 | 25 | 0.97 | 21.0% | 314.0 | 6.0% | ||
| steel | Tunnel | 200 | 0.51 | 60 | 0.71 | 85 | 43 | 1.7 | 14.0% | 433.6 | 9.7% | ||
| steel | Tunnel | 200 | 0.51 | 60 | 0.71 | 85 | 43 | 2.14 | 13.0% | 461.3 | 8.6% | ||
| steel | Tunnel | 200 | 0.32 | 35 | 0.55 | 64 | 20 | 0.59 | 32.0% | 176.9 | 19.8% | ||
| steel | Tunnel | 200 | 0.51 | 35 | 0.55 | 64 | 33 | 0.72 | 22.0% | 198.3 | 18.4% |
Disclaimer/Publisher’s Note: The statements, opinions and data contained in all publications are solely those of the individual author(s) and contributor(s) and not of MDPI and/or the editor(s). MDPI and/or the editor(s) disclaim responsibility for any injury to people or property resulting from any ideas, methods, instructions or products referred to in the content. |
© 2023 by the authors. Licensee MDPI, Basel, Switzerland. This article is an open access article distributed under the terms and conditions of the Creative Commons Attribution (CC BY) license (https://creativecommons.org/licenses/by/4.0/).
Share and Cite
Del Savio, A.A.; La Torre Esquivel, D.; García Landeo, J.M. Post-Cracking Properties of Concrete Reinforced with Polypropylene Fibers through the Barcelona Test. Polymers 2023, 15, 3718. https://doi.org/10.3390/polym15183718
Del Savio AA, La Torre Esquivel D, García Landeo JM. Post-Cracking Properties of Concrete Reinforced with Polypropylene Fibers through the Barcelona Test. Polymers. 2023; 15(18):3718. https://doi.org/10.3390/polym15183718
Chicago/Turabian StyleDel Savio, Alexandre Almeida, Darwin La Torre Esquivel, and Joaquín M. García Landeo. 2023. "Post-Cracking Properties of Concrete Reinforced with Polypropylene Fibers through the Barcelona Test" Polymers 15, no. 18: 3718. https://doi.org/10.3390/polym15183718