
Polycaprolactone/Starch/Agar Coatings for Food-Packaging Paper: Statistical Correlation of the Formulations’ Effect on Diffusion, Grease Resistance, and Mechanical Properties

 , ,
, ,
Abstract
:
1. Introduction
2. Materials and Methods
2.1. Materials
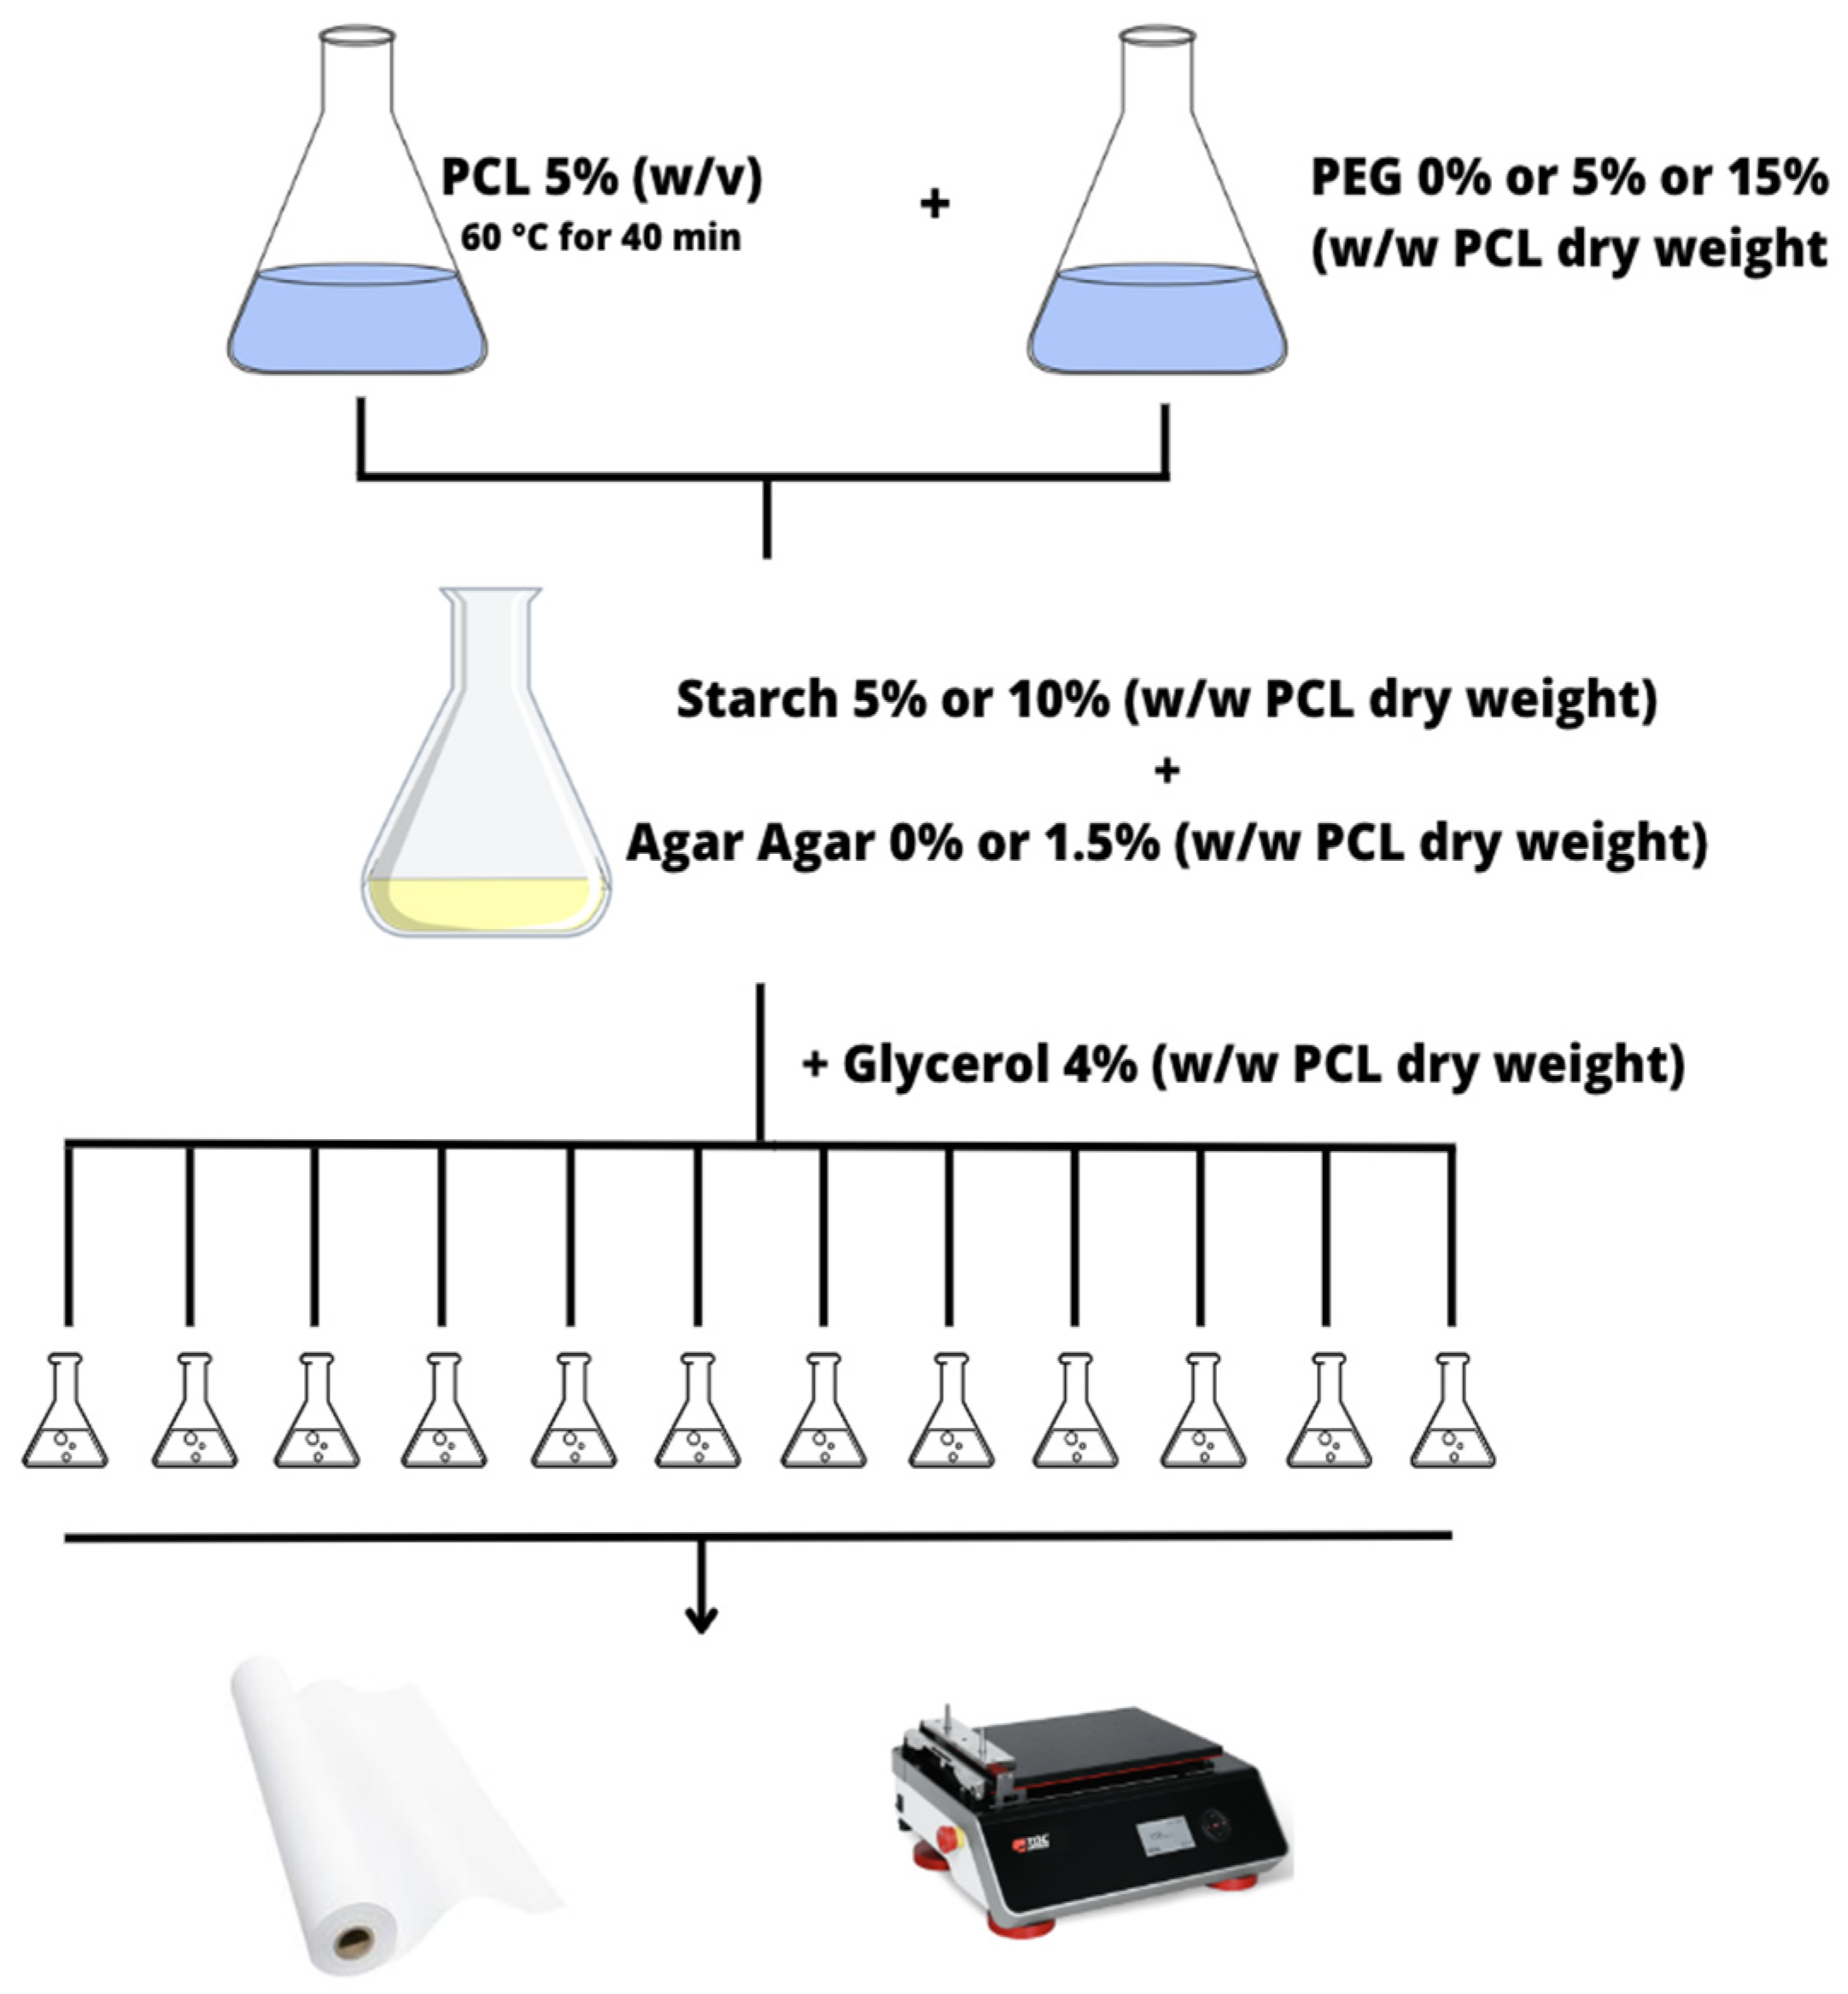
2.2. Coating Preparations
2.3. Characterizations
2.3.1. Grammage and Thickness Determination
2.3.2. SEM Analysis
2.3.3. Contact Angle Determination
2.3.4. Grease Resistance Determination
2.3.5. Water Vapor Transmission Rate (WVTR)
2.3.6. Mechanical Properties
2.4. Statistical Analysis
3. Results
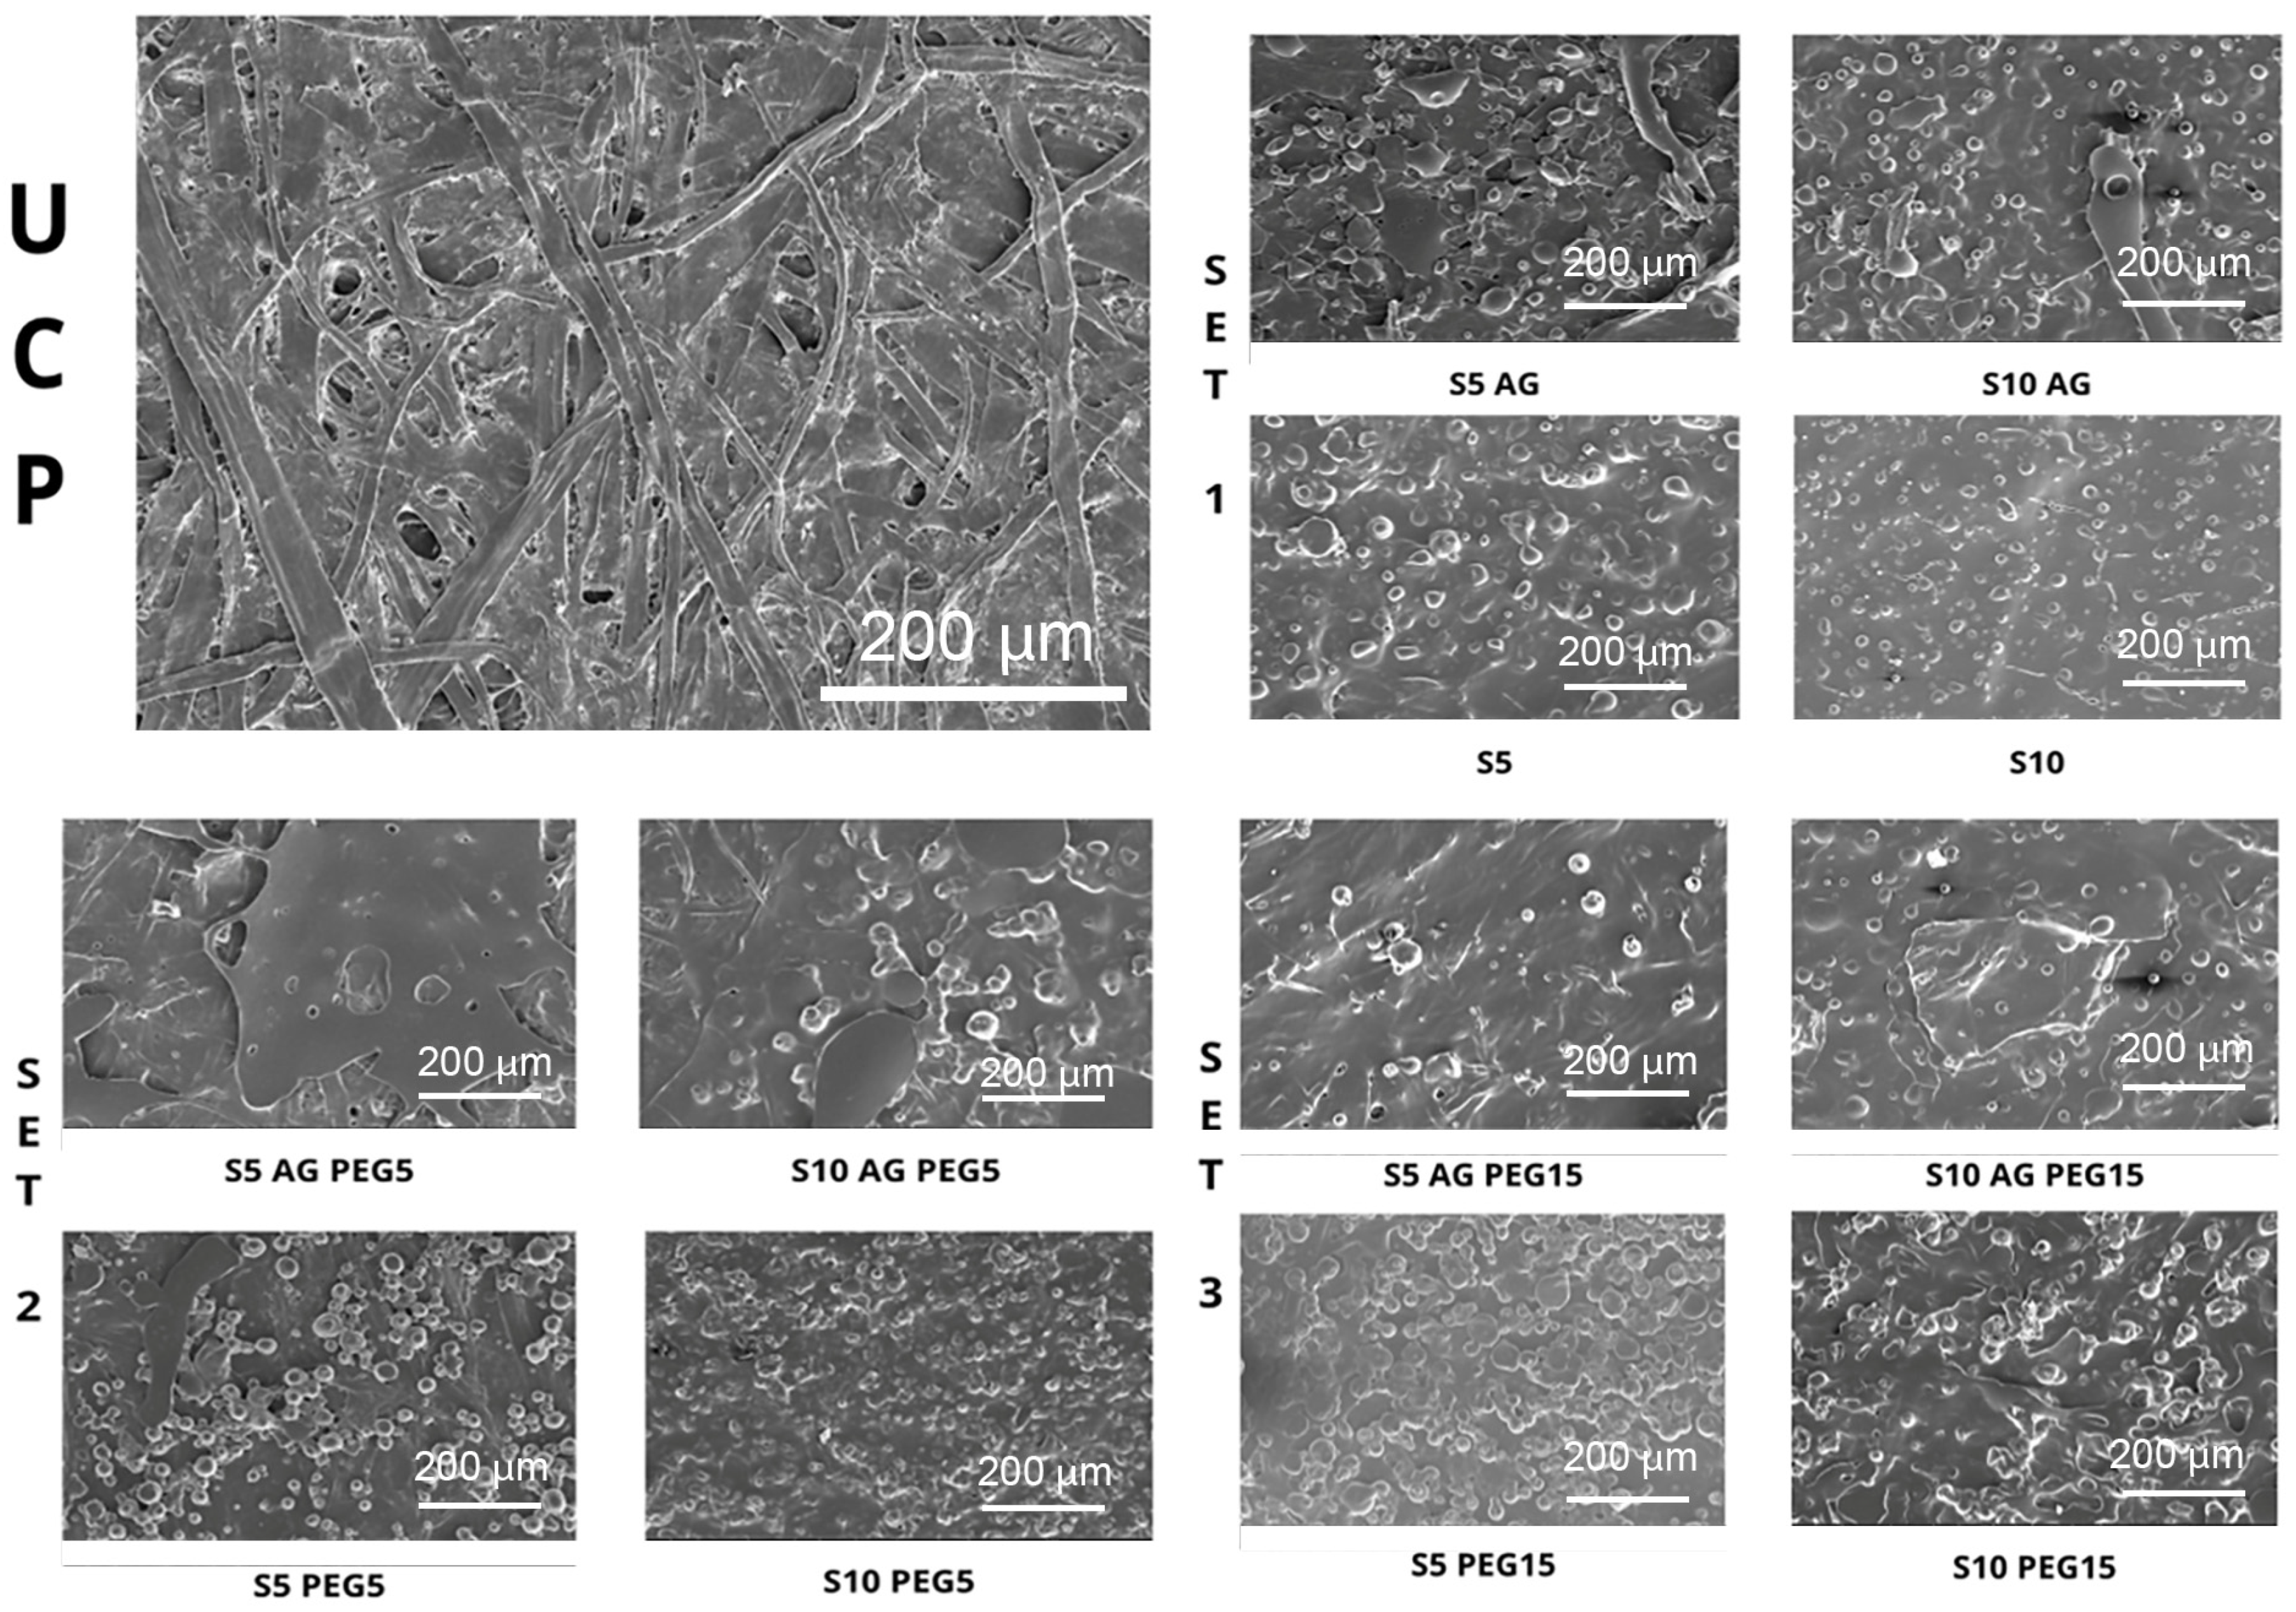
3.1. SEM Analysis
3.2. Grammage and Thickness
3.3. Oil Contact Angle
3.4. Grease Resistance
3.5. Behavior of Samples with Water
3.5.1. WVTR
3.5.2. Water Contact Angle
3.6. Mechanical Properties
4. Discussion
5. Conclusions
Supplementary Materials
Author Contributions
Funding
Institutional Review Board Statement
Data Availability Statement
Conflicts of Interest
References
- Ruiz-Real, J.L.; Uribe-Toril, J.; Valenciano, J.D.P.; Gázquez-Abad, J.C. Worldwide Research on Circular Economy and Environment: A Bibliometric Analysis. Int. J. Environ. Res. Public Health 2018, 15, 2699. [Google Scholar] [CrossRef]
- Vila-Lopez, N.; Küster-Boluda, I. A Bibliometric Analysis on Packaging Research: Towards Sustainable and Healthy Packages. Br. Food J. 2021, 123, 684–701. [Google Scholar] [CrossRef]
- Deshwal, G.K.; Panjagari, N.R.; Alam, T. An Overview of Paper and Paper Based Food Packaging Materials: Health Safety and Environmental Concerns. J. Food Sci. Technol. 2019, 56, 4391–4403. [Google Scholar] [CrossRef] [PubMed]
- Oloyede, O.O.; Lignou, S. Sustainable Paper-Based Packaging: A Consumer’s Perspective. Foods 2021, 10, 1035. [Google Scholar] [CrossRef] [PubMed]
- Soergel, B.; Kriegler, E.; Weindl, I.; Rauner, S.; Dirnaichner, A.; Ruhe, C.; Hofmann, M.; Bauer, N.; Bertram, C.; Bodirsky, B.L.; et al. A Sustainable Development Pathway for Climate Action within the UN 2030 Agenda. Nat. Clim. Chang. 2021, 11, 656–664. [Google Scholar] [CrossRef]
- Kopacic, S.; Walzl, A.; Zankel, A.; Leitner, E.; Bauer, W. Alginate and Chitosan as a Functional Barrier for Paper-Based Packaging Materials. Coatings 2018, 8, 235. [Google Scholar] [CrossRef]
- Nair, A.; Kansal, D.; Khan, A.; Rabnawaz, M. New Alternatives to Single-use Plastics: Starch and Chitosan- Graft -polydimethylsiloxane-coated Paper for Water- and Oil-resistant Applications. Nano Select. 2022, 3, 459–470. [Google Scholar] [CrossRef]
- Khwaldia, K.; Arab-Tehrany, E.; Desobry, S. Biopolymer Coatings on Paper Packaging Materials. Compr. Rev. Food Sci. Food Saf. 2010, 9, 82–91. [Google Scholar] [CrossRef]
- Reis, A.B.; Yoshida, C.M.P.; Reis, A.P.C.; Franco, T.T. Application of Chitosan Emulsion as a Coating on Kraft Paper. Polym. Int. 2011, 60, 963–969. [Google Scholar] [CrossRef]
- Adibi, A.; Trinh, B.M.; Mekonnen, T.H. Recent progress in sustainable barrier paper coating for food packaging applications. Prog. Org. Coat. 2023, 181, 107566. [Google Scholar] [CrossRef]
- Lo Faro, E.; Menozzi, C.; Licciardello, F.; Fava, P. Improvement of Paper Resistance against Moisture and Oil by Means Coatings with Poly(-3-Hydroxybutyrate-Co-3-Hydroxyvalerate) (Phbv) and Polycaprolactone (Pcl). Appl. Sci. 2021, 11, 8058. [Google Scholar] [CrossRef]
- Sogut, E.; Seydim, A.C. Development of Chitosan and Polycaprolactone Based Active Bilayer Films Enhanced with Nanocellulose and Grape Seed Extract. Carbohydr. Polym. 2018, 195, 180–188. [Google Scholar] [CrossRef] [PubMed]
- Sundar, N.; Keerthana, P.; Kumar, S.A.; Kumar, G.A.; Ghosh, S. Dual Purpose, Bio-Based Polylactic Acid (PLA)-Polycaprolactone (PCL) Blends for Coated Abrasive and Packaging Industrial Coating Applications. J. Polym. Res. 2020, 27, 386. [Google Scholar] [CrossRef]
- Bota, J.; Vukoje, M.; Brozovic, M.; Hrnjak-Murgic, Z. Reduced Water Permeability of Biodegradable PCL Nanocomposite Coated Paperboard Packaging. Chem. Biochem. Eng. Q. 2018, 31, 417–424. [Google Scholar] [CrossRef]
- Chi, K.; Wang, H.; Catchmark, J.M. Sustainable Starch-Based Barrier Coatings for Packaging Applications. Food Hydrocoll. 2020, 103, 105696. [Google Scholar] [CrossRef]
- Guo, Y.; Zhang, B.; Zhao, S.; Qiao, D.; Xie, F. Plasticized Starch/Agar Composite Films: Processing, Morphology, Structure, Mechanical Properties and Surface Hydrophilicity. Coatings 2021, 11, 311. [Google Scholar] [CrossRef]
- Roy, S.; Rhim, J.W. Starch/Agar-Based Functional Films Integrated with Enoki Mushroom-Mediated Silver Nanoparticles for Active Packaging Applications. Food Biosci. 2022, 49, 101867. [Google Scholar] [CrossRef]
- Ewender, J.; Franz, R.; Welle, F. Permeation of Mineral Oil Components from Cardboard Packaging Materials through Polymer Films. Packag. Technol. Sci. 2013, 26, 423–434. [Google Scholar] [CrossRef]
- Dobrovszky, K.; Ronkay, F. Effects of Phase Inversion on Molding Shrinkage, Mechanical and Burning Properties of Injection Molded PET/HDPE and PS/HDPE Polymer Blends. Polym. Plast. Technol. Eng. 2017, 56, 1147–1157. [Google Scholar] [CrossRef]
- Mahuwala, A.A.; Hemant, V.; Meharwade, S.D.; Deb, A.; Chakravorty, A.; Grace, A.N.; Raghavan, V. Synthesis and Characterisation of Starch/Agar Nanocomposite Films for Food Packaging Application. IET Nanobiotechnol. 2020, 14, 809–814. [Google Scholar] [CrossRef]
- Choi, I.; Lee, J.Y.; Lacroix, M.; Han, J. Intelligent PH Indicator Film Composed of Agar/Potato Starch and Anthocyanin Extracts from Purple Sweet Potato. Food Chem. 2017, 218, 122–128. [Google Scholar] [CrossRef] [PubMed]
- Ortega-Toro, R.; Muñoz, A.; Talens, P.; Chiralt, A. Improvement of Properties of Glycerol Plasticized Starch Films by Blending with a Low Ratio of Polycaprolactone and/or Polyethylene Glycol. Food Hydrocoll. 2016, 56, 9–19. [Google Scholar] [CrossRef]
- Singh, R.P.; Pandey, J.K.; Rutot, D.; Degée, P.; Dubois, P. Biodegradation of Poly(ε-Caprolactone)/Starch Blends and Composites in Composting and Culture Environments: The Effect of Compatibilization on the Inherent Biodegradability of the Host Polymer. Carbohydr. Res. 2003, 338, 1759–1769. [Google Scholar] [CrossRef]
- Montgomery, D.C. Design and Analysis of Experiments, 8th ed.; John Wiley & Sons: Hoboken, NJ, USA, 2012; Volume 2, ISBN 9781118146927. [Google Scholar]
- TAPPI Test Method T 559 cm-02; Grease Resistance Test for Paper and Paperboard. Tappi Press: Atlanta, GA, USA, 2002.
- Song, Z.; Xiao, H.; Zhao, Y. Hydrophobic-Modified Nano-Cellulose Fiber/PLA Biodegradable Composites for Lowering Water Vapor Transmission Rate (WVTR) of Paper. Carbohydr. Polym. 2014, 111, 442–448. [Google Scholar] [CrossRef] [PubMed]
- Aulin, C.; Ström, G. Multilayered Alkyd Resin/Nanocellulose Coatings for Use in Renewable Packaging Solutions with a High Level of Moisture Resistance. Ind. Eng. Chem. Res. 2013, 52, 2582–2589. [Google Scholar] [CrossRef]
- ASTM D882-18; Standard Test Method for Tensile Properties of Thin Plastic Sheeting. ASTM International: West Conshohocken, PA, USA, 2018.
- Domene-López, D.; García-Quesada, J.C.; Martin-Gullon, I.; Montalbán, M.G. Influence of Starch Composition and Molecular Weight on Physicochemical Properties of Biodegradable Films. Polymers 2019, 11, 1084. [Google Scholar] [CrossRef]
- Requena, R.; Jiménez, A.; Vargas, M.; Chiralt, A. Effect of Plasticizers on Thermal and Physical Properties of Compression-Moulded Poly[(3-Hydroxybutyrate)-Co-(3-Hydroxyvalerate)] Films. Polym. Test. 2016, 56, 45–53. [Google Scholar] [CrossRef]
- Long, Z.; Wu, M.; Peng, H.; Dai, L.; Zhang, D.; Wang, J. Preparation and oil-resistant mechanism of chitosan/cationic starch oil-proof paper. BioResources 2015, 10, 7907–7920. [Google Scholar] [CrossRef]
- Gietl, M.L.; Schmidt, H.-W.; Giesa, R.; Terrenoire, A.; Balk, R. Semiquantitative method for the evaluation of grease barrier coatings. Progr. Org. Coat. 2009, 66, 107–112. [Google Scholar] [CrossRef]
- Yokoyama, T.; Nakai, K. Evaluation of In-Plane Orthotropic Elastic Constants of Paper and Paperboard. Dimensions 2007, 60, 50. [Google Scholar]
- Rogovina, S.Z.; Aleksanyan, K.V.; Loginova, A.A.; Ivanushkina, N.E.; Vladimirov, L.V.; Prut, E.V.; Berlin, A.A. Influence of PEG on Mechanical Properties and Biodegradability of Composites Based on PLA and Starch. Starch/Staerke 2018, 70, 1700268. [Google Scholar] [CrossRef]
- Hubbe, M.A.; Gardner, D.J.; Shen, W. Contact angles and wettability of cellulosic surfaces: A review of proposed mechanisms and test strategies. BioResources 2015, 10, 8657. [Google Scholar] [CrossRef]
- Hormoz, E.; Tizazu, H. Mekonnen, Flexible and green multilayer paper coating for barrier enhancement of paper packaging. Sust. Mat. Technol. 2023, 37, e00694. [Google Scholar] [CrossRef]
- Amariei, S.; Ursachi, F.; Petraru, A. Development of New Biodegradable Agar-Alginate Membranes for Food Packaging. Membranes 2022, 12, 576. [Google Scholar] [CrossRef]


| Properties | Units | Test Method | Values | |
|---|---|---|---|---|
| Basis Weight | g/m2 | ISO 536 | 40 | |
| Tensile Strength | kN/m | ISO 1924-3 | MD CD | 4.3 1.8 |
| Tear Strength | mN | ISO 1974 | MD CD | 340 520 |
| Burst Strength | kPa | ISO 2758 | 188 | |
| Air resistance (Gurley) | S | ISO 5636-5 | 28 | |
| Cobb-60″ MG Side | g/m2 | ISO 535 | 21 | |
| Gloss | % | TAPPI 480 om-99 | 25 | |
| Brightness | % | ISO 2470 | 82 | |
| Opacity | % | ISO 2471 | 59 | |
| Thickness | μm | ISO 534 | 55 |
| Starch % (w/w PCL Dry Weight) | Agar % (w/w PCL Dry Weight) | PEG % (w/w PCL Dry Weight) | ||
|---|---|---|---|---|
| SET 1 | S5 AG | 5 | 1.5 | 0 |
| S10 AG | 10 | 1.5 | 0 | |
| S5 | 5 | 0 | 0 | |
| S10 | 10 | 0 | 0 | |
| SET 2 | PEG5 S5 AG | 5 | 1.5 | 5 |
| PEG5 S10 AG | 10 | 1.5 | 5 | |
| PEG5 S5 | 5 | 0 | 5 | |
| PEG5 S10 | 10 | 0 | 5 | |
| SET 3 | PEG15 S5 AG | 5 | 1.5 | 15 |
| PEG15 S10 AG | 10 | 1.5 | 15 | |
| PEG15 S5 | 5 | 0 | 15 | |
| PEG15 S10 | 10 | 0 | 15 | |
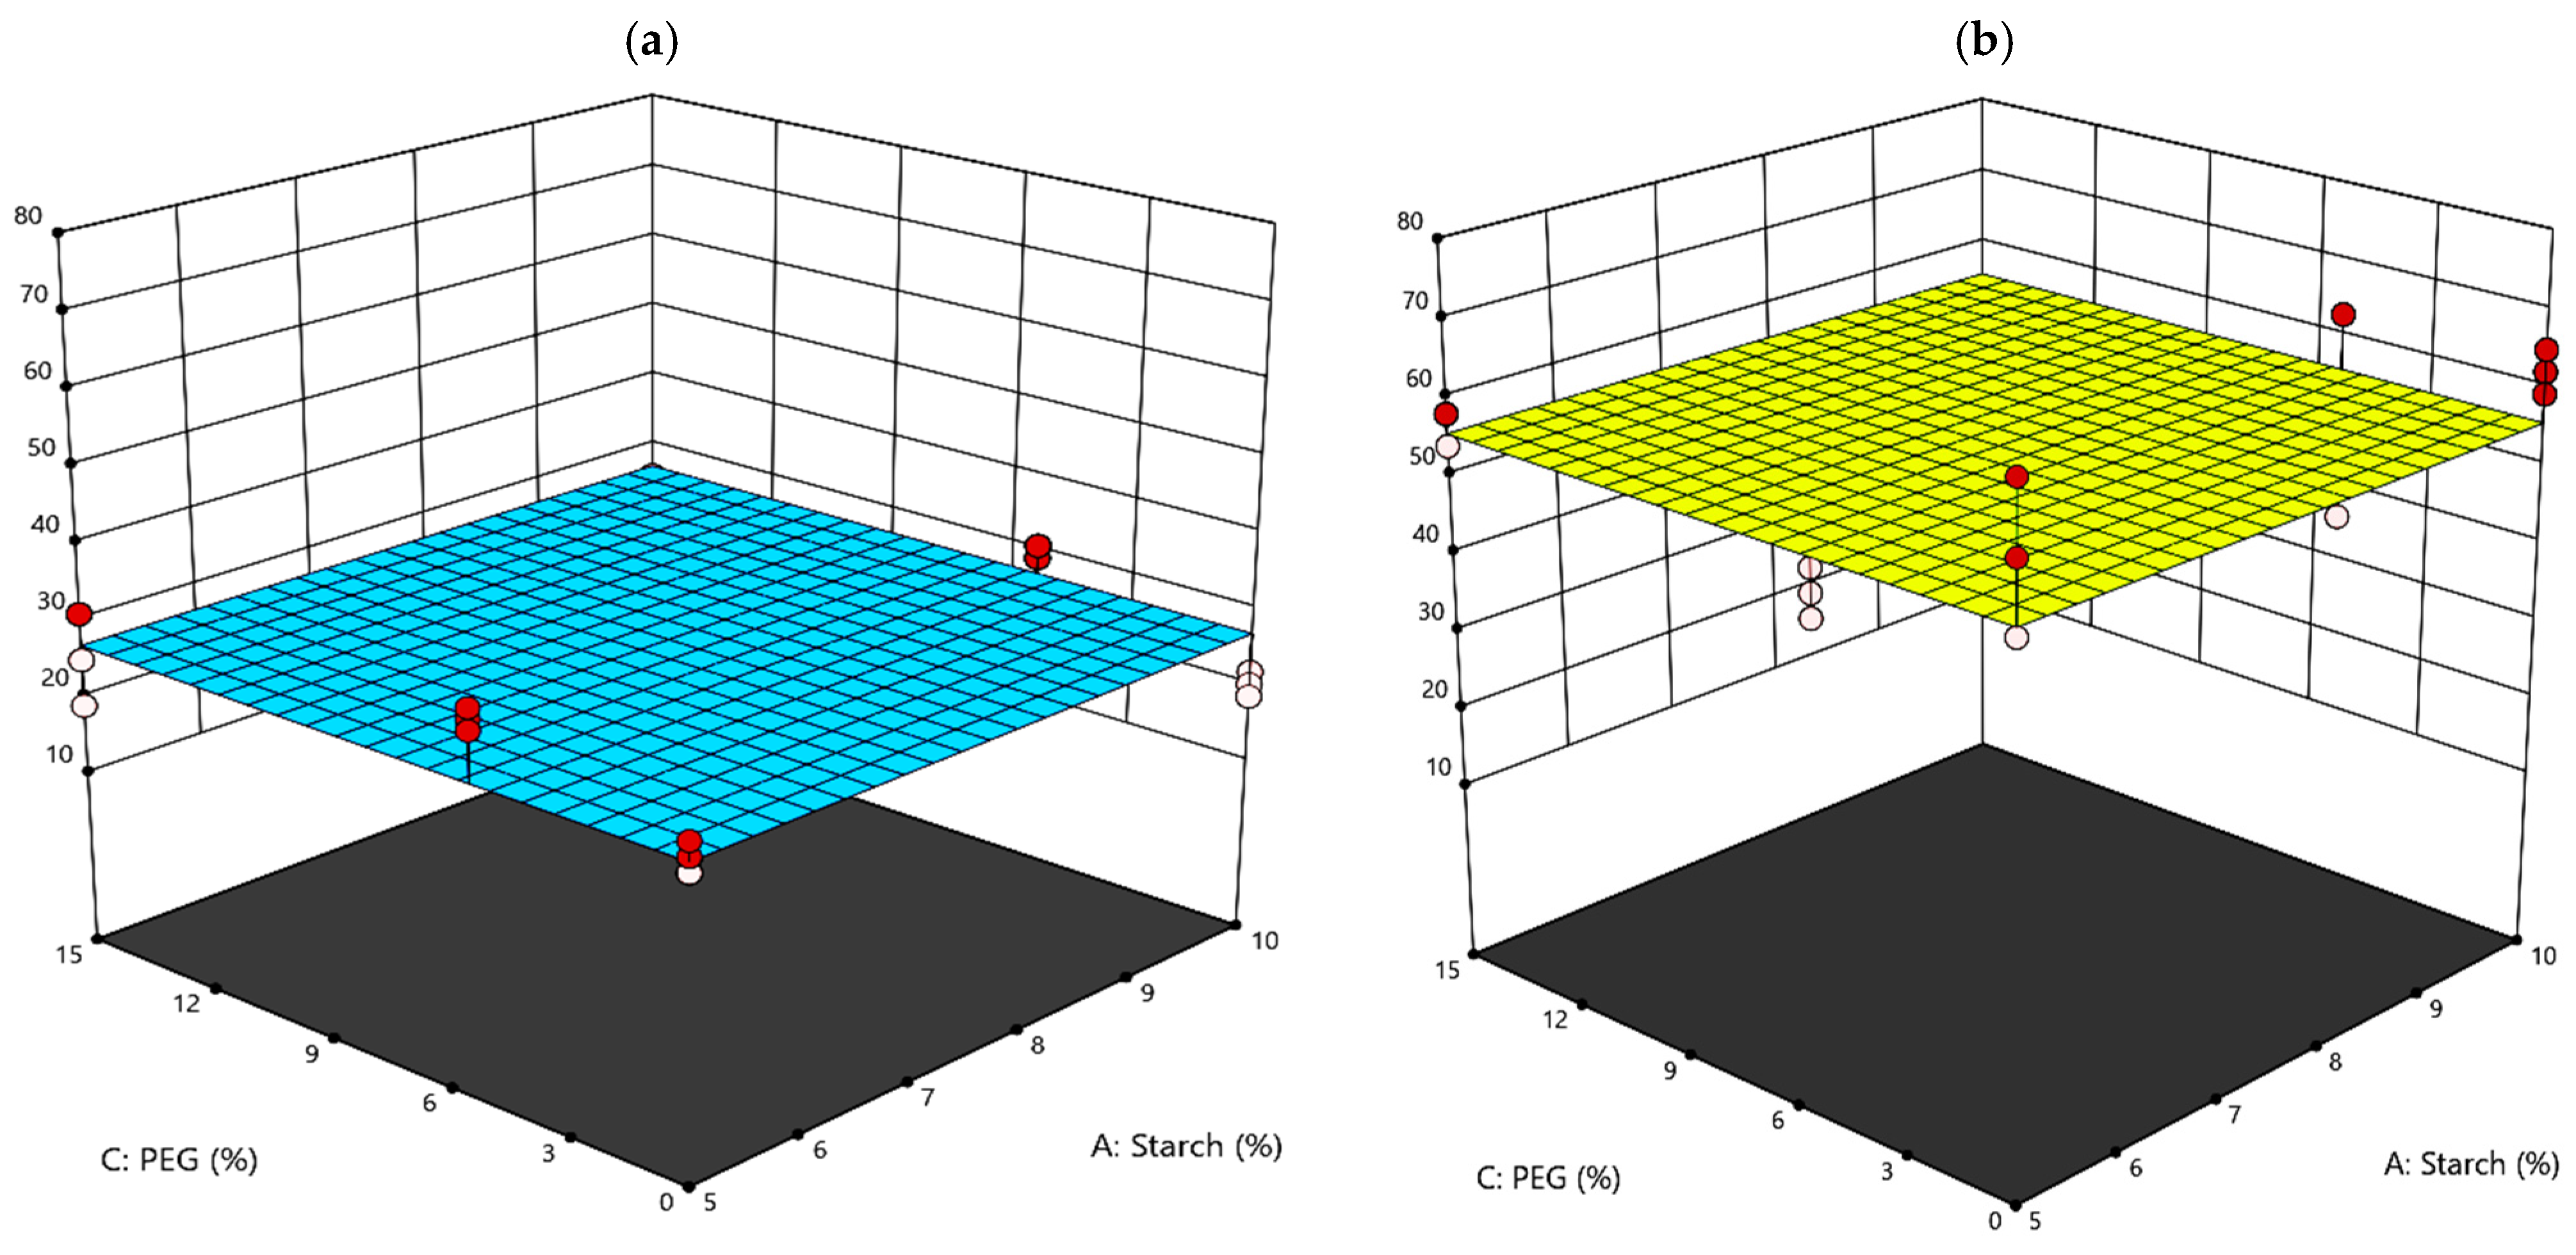
| Output Variables | Goal | Importance |
|---|---|---|
| WVTR | to minimize | 2 |
| Grease Resistance—Kit 12 | to maximize | 5 |
| Contact angle measurements oil | to maximize | 4 |
| Contact angle measurements water | to maximize | 2 |
| Thickness | to minimize | 3 |
| Grammage | to minimize | 3 |
| Mechanical properties | In range | 3 |
| SET | Samples | Thickness (mm) | Grammage (g/m2) | Oil CA 1 (Degrees) | Water CA 1 (Degrees) | Kit Test 12 | WVTR (g m−2 day−1) 38 °C 90% RH | Young’s Modulus (MPa) | Tensile Strength (MPa) | Elongation at Break (%) | |
|---|---|---|---|---|---|---|---|---|---|---|---|
| 1 | S5AG | 0.166 abc ± 0.010 | 54.4 ab± 10.9 | 65.77 abcd ± 4.85 | 54.88 def ± 3.78 | 9.33 bc ± 0.6 | 4943 cdb ± 74 | XD MD | 257 e± 320 1790 bcde ± 1362 | 12.32 ghi ± 0.39 27.55 efgh ± 1.92 | 3.43 a ± 0.77 2.91 a ± 0.29 |
| S10AG | 0.227 a ± 0.172 | 61.8 a± 6.9 | 56.78 de ± 2.69 | 49.90 f ± 5.41 | 8.33 c ± 0.6 | 4987 cbd ± 87 | XD MD | 638 bcde ± 48 1951 abcd ± 693 | 9.57 i ± 0.84 20.10 fghi ± 1.66 | 3.41 a ± 0.13 3.59 a ± 0.56 | |
| S5 | 0.073 f ± 0.004 | 52.1 ab± 6.6 | 65.23 bcd ± 4.18 | 52.37 ef ± 5.14 | 8.67 bc ± 0.6 | 4851 de ± 138 | XD MD | 247 e ± 221 511 cde ± 306 | 27.83 efgh ± 1.39 63.52 ab ± 8.96 | 3.42 a ± 0.46 3.30 a ± 0.65 | |
| S10 | 0.077 f ± 0.003 | 54.8 ab± 7.4 | 53.22 e ± 3.10 | 57.04 edf ± 3.46 | 10.33 ab ± 0.6 | 4808 de ± 182 | XD MD | 458 de ± 96 677 bcde ± 348 | 23.25 fghi ± 7.22 62.18 ab ± 2.80 | 3.58 a ± 1.30 3.43 a ± 0.25 | |
| 2 | PEG5 S5 AG | 0.140 bcdef ± 0.017 | 52.2 ab± 2.6 | 58.52 de ± 0.45 | 80.11 b ± 7.84 | 11.33 a ± 0.6 | 4907 dec ± 88 | XD MD | 477 cde ± 116 1108 bcde ± 152 | 15.06 ghi ± 1.34 34.88 def ± 1.41 | 3.15 a ± 0.35 3.14 a ± 0.25 |
| PEG5 S10 AG | 0.151 bcde ± 0.010 | 56.7 ab± 1.5 | 57.49 de ± 2.77 | 81.99 b ± 9.11 | 4.33 d ± 0.6 | 4800 de ± 51 | XD MD | 402 de ± 85 897 bcde ± 98 | 12.51 ghi ± 1.74 29.09 efg ± 1.65 | 2.95 a ± 0.56 2.76 a ± 0.23 | |
| PEG5 S5 | 0.101 cdef ± 0.005 | 55.0 ab± 4.4 | 62.22 bcde ± 0.12 | 56.42 cd ± 6.90 | 8.33 c ± 0.6 | 4810 de ± 140 | XD MD | 816 bcde ± 86 1411 bcde ± 244 | 23.65 fghi ± 0.33 51.46 bcd ± 3.01 | 3.21 a ± 0.16 2.96 a ± 0.25 | |
| PEG5 S10 | 0.083 def ± 0.004 | 55.7 ab± 7.7 | 59.03 cde ± 0.42 | 60.48 cd ± 3.65 | 10.33 ab ± 0.6 | 4688 e ± 110 | XD MD | 598 cde ±92 1238 bcde ± 338 | 23.81 fghi ± 2.99 49.50 bcd ± 13.42 | 3.15 a ± 0.66 2.79 a ± 0.93 | |
| 3 | PEG15 S5 AG | 0.155 abcd ± 0.013 | 49.6 bc± 5.3 | 70.20 abc ± 2.61 | 53.36 def ± 4.89 | 9.33 bc ± 0.6 | 5279 a ± 69 | XD MD | 702 bcde ± 200 1618bcde ± 108 | 12.17 ghi ± 0.46 24.99 efghi ± 6.14 | 3.27 a ± 0.48 2.61 a ± 0.92 |
| PEG15 S10 AG | 0.182 ab ± 0.018 | 56.0 ab± 10.4 | 70.90 ab ± 1.13 | 54.64 cdef ± 3.81 | 8.33 c ± 0.6 | 5147 ab ± 116 | XD MD | 572 cde ± 144 1106 bcde ± 186 | 10.73 hi ± 0.60 23.95 fghi ± 1.58 | 3.35 a ± 0.34 3.12 a ± 0.27 | |
| PEG15 S5 | 0.079 ef ± 0.004 | 58.3 ab± 8.1 | 76.72 a ± 3.06 | 57.01 cdef ± 4.60 | 8.67 bc ± 0.6 | 5152 ab ± 120 | XD MD | 1053 bcde ± 254 2210 ab ± 224 | 22.13 fghi ± 1.80 54.15 abc ± 4.06 | 3.09 a ± 0.59 3.05 a ± 0.25 | |
| PEG15 S10 | 0.089 def ± 0.003 | 56.1 ab± 8.1 | 71.17 ab ± 3.45 | 61.91 c ± 4.50 | 9.33 bc ± 0.6 | 5121 abc ± 176 | XD MD | 995 bcde ± 62 1670 bcde ± 472 | 22.62 fghi ± 0.78 50.92 bcd ± 2.92 | 3.65 a ± 0.37 3.28 a ± 0.14 | |
| UCP | 0.067 f ± 0.001 | 41.0 c± 1.9 | 66.37 abcd ± 3.26 | 129.46 a ± 23.05 | 0.33 e ± 0.6 | 5157 ± 152 | XD MD | 2057 abc ± 1245 3498 a ± 1333 | 41.89 cde ± 20.16 55.66 abc ± 3.10 | 2.92 a ± 0.32 2.56 a ± 0.24 |
| Agar | Starch | PEG | Agar PEG | PEG Starch | Agar Starch | PEG Agar Starch | |
|---|---|---|---|---|---|---|---|
| Grammage | / | * | / | / | * | / | / |
| Thickness | *** | / | / | * | / | / | / |
| CA Oil 0s | / | *** | *** | / | * | / | / |
| CA Oil 15s | * | / | / | / | / | / | / |
| CA Oil 30s | * | / | / | / | / | / | / |
| Grease Resistance | *** | *** | / | * | *** | *** | *** |
| CA Water | *** | * | *** | *** | / | * | / |
| WVTR | *** | * | *** | / | / | / | / |
| Tensile Strength | / | / | *** | *** | * | / | / |
| Young’s Modulus | *** | ** | * | *** | / | / | / |
| Elongation | / | / | / | / | / | / | / |
Disclaimer/Publisher’s Note: The statements, opinions and data contained in all publications are solely those of the individual author(s) and contributor(s) and not of MDPI and/or the editor(s). MDPI and/or the editor(s) disclaim responsibility for any injury to people or property resulting from any ideas, methods, instructions or products referred to in the content. |
© 2023 by the authors. Licensee MDPI, Basel, Switzerland. This article is an open access article distributed under the terms and conditions of the Creative Commons Attribution (CC BY) license (https://creativecommons.org/licenses/by/4.0/).
Share and Cite
Lo Faro, E.; Bonofiglio, A.; Barbi, S.; Montorsi, M.; Fava, P. Polycaprolactone/Starch/Agar Coatings for Food-Packaging Paper: Statistical Correlation of the Formulations’ Effect on Diffusion, Grease Resistance, and Mechanical Properties. Polymers 2023, 15, 3921. https://doi.org/10.3390/polym15193921
Lo Faro E, Bonofiglio A, Barbi S, Montorsi M, Fava P. Polycaprolactone/Starch/Agar Coatings for Food-Packaging Paper: Statistical Correlation of the Formulations’ Effect on Diffusion, Grease Resistance, and Mechanical Properties. Polymers. 2023; 15(19):3921. https://doi.org/10.3390/polym15193921
Chicago/Turabian StyleLo Faro, Emanuela, Angela Bonofiglio, Silvia Barbi, Monia Montorsi, and Patrizia Fava. 2023. "Polycaprolactone/Starch/Agar Coatings for Food-Packaging Paper: Statistical Correlation of the Formulations’ Effect on Diffusion, Grease Resistance, and Mechanical Properties" Polymers 15, no. 19: 3921. https://doi.org/10.3390/polym15193921
APA StyleLo Faro, E., Bonofiglio, A., Barbi, S., Montorsi, M., & Fava, P. (2023). Polycaprolactone/Starch/Agar Coatings for Food-Packaging Paper: Statistical Correlation of the Formulations’ Effect on Diffusion, Grease Resistance, and Mechanical Properties. Polymers, 15(19), 3921. https://doi.org/10.3390/polym15193921