PCN/BiOCl Polymer-Based Heterojunction with Rich Chlorine Defects for Photocatalytic Amine Oxidation
Abstract
:1. Introduction
2. Experimental Section
2.1. Instruments and Chemicals
2.2. Sample Preparation
2.2.1. Materials
2.2.2. Synthesis of PCN
2.2.3. Synthesis of PCN/BiOCl
2.3. Photocatalytic Experiments
2.3.1. Oxidation Coupling Reaction of Benzylamine
2.3.2. Dehydrogenation of Secondary Amines
2.3.3. Stability Testing
2.3.4. Trapping Experiment
3. Results and Discussion
3.1. Structure and Morphological Analysis
3.2. Chemical State Analysis
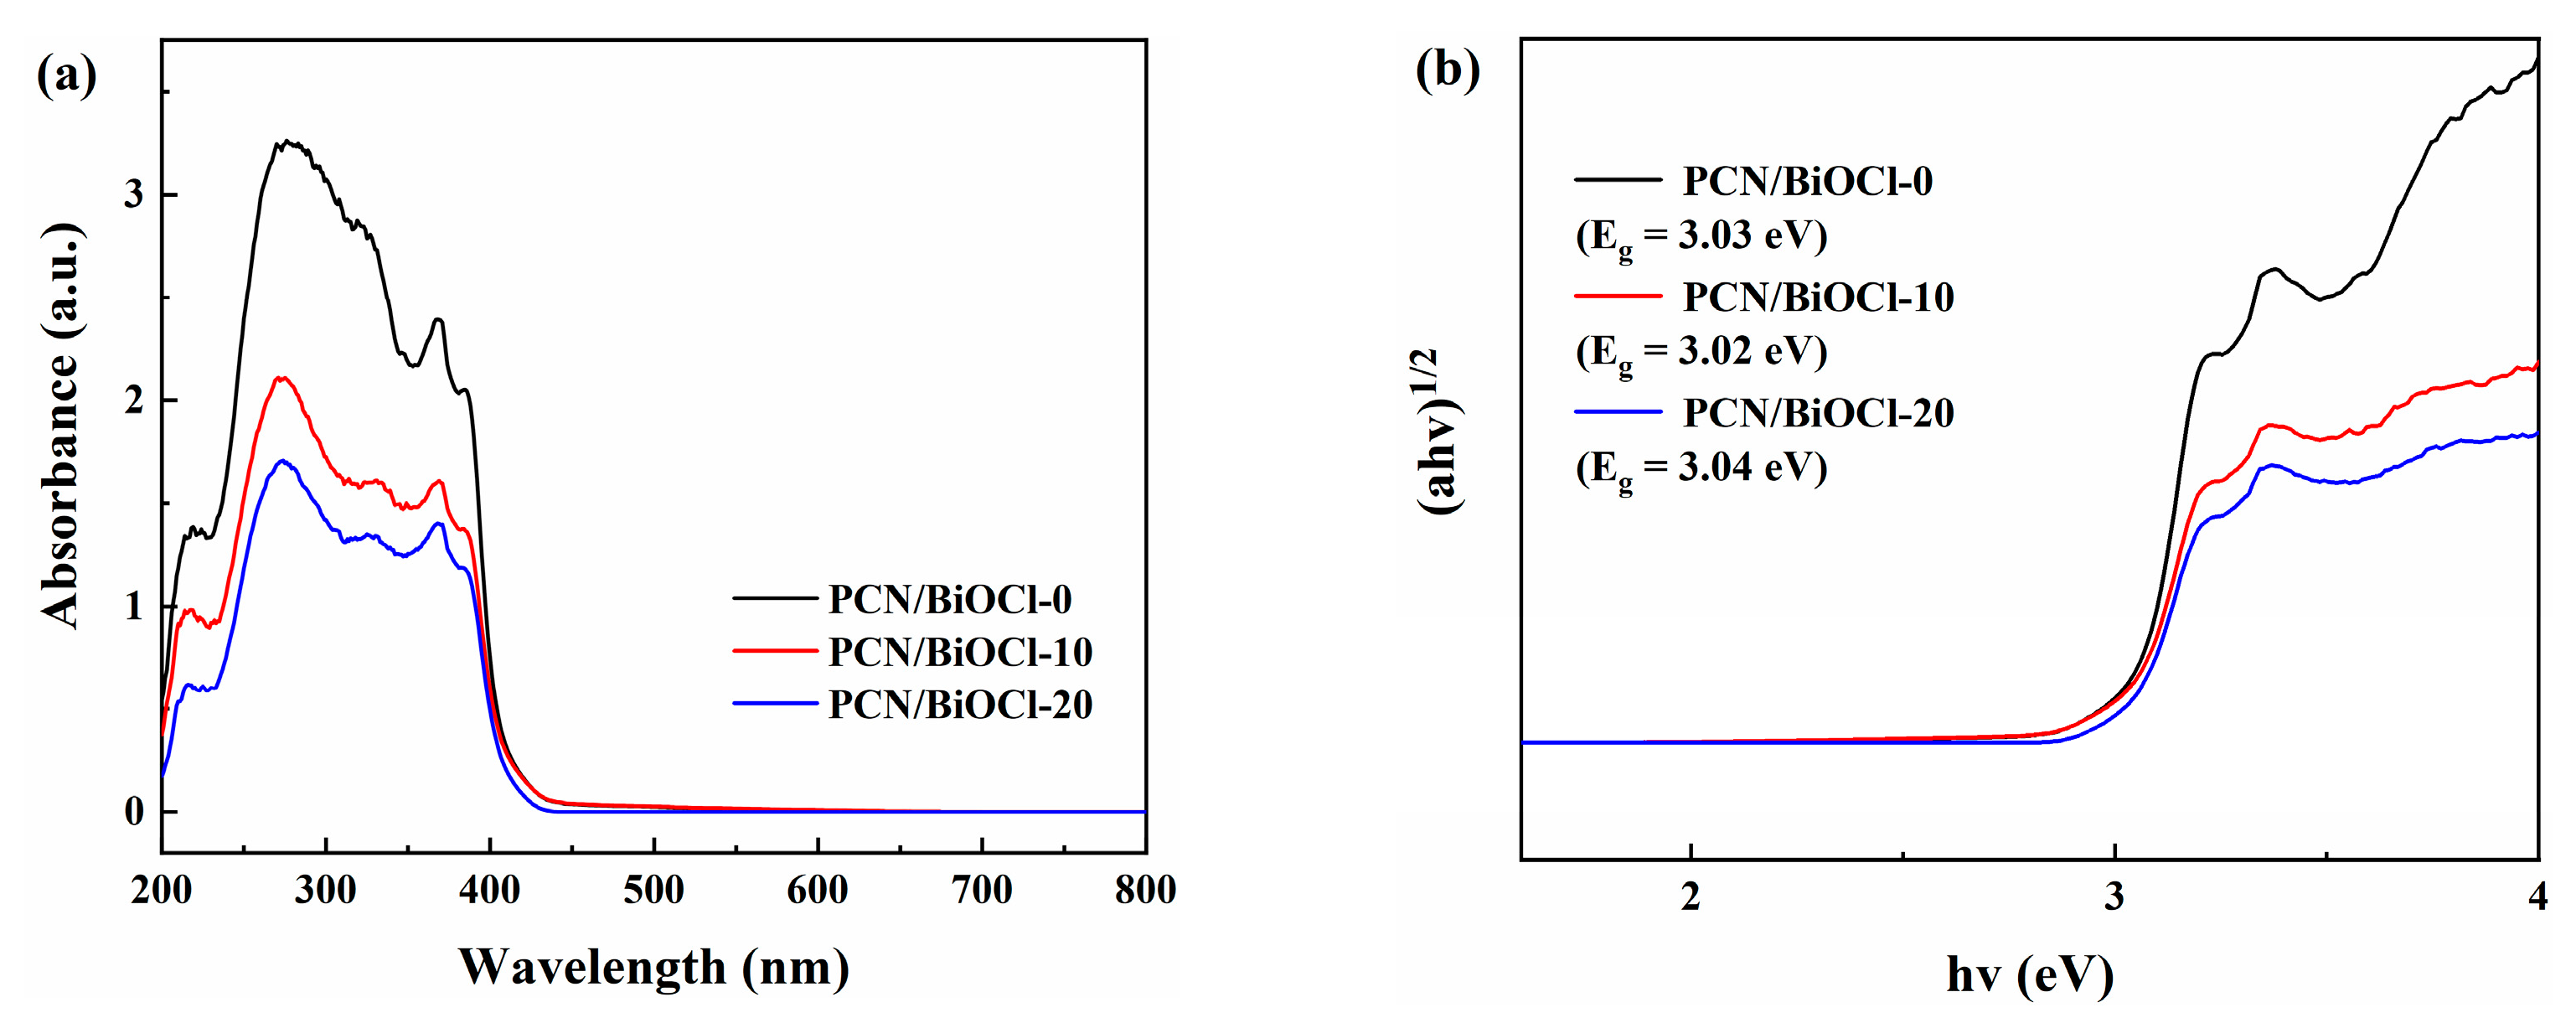
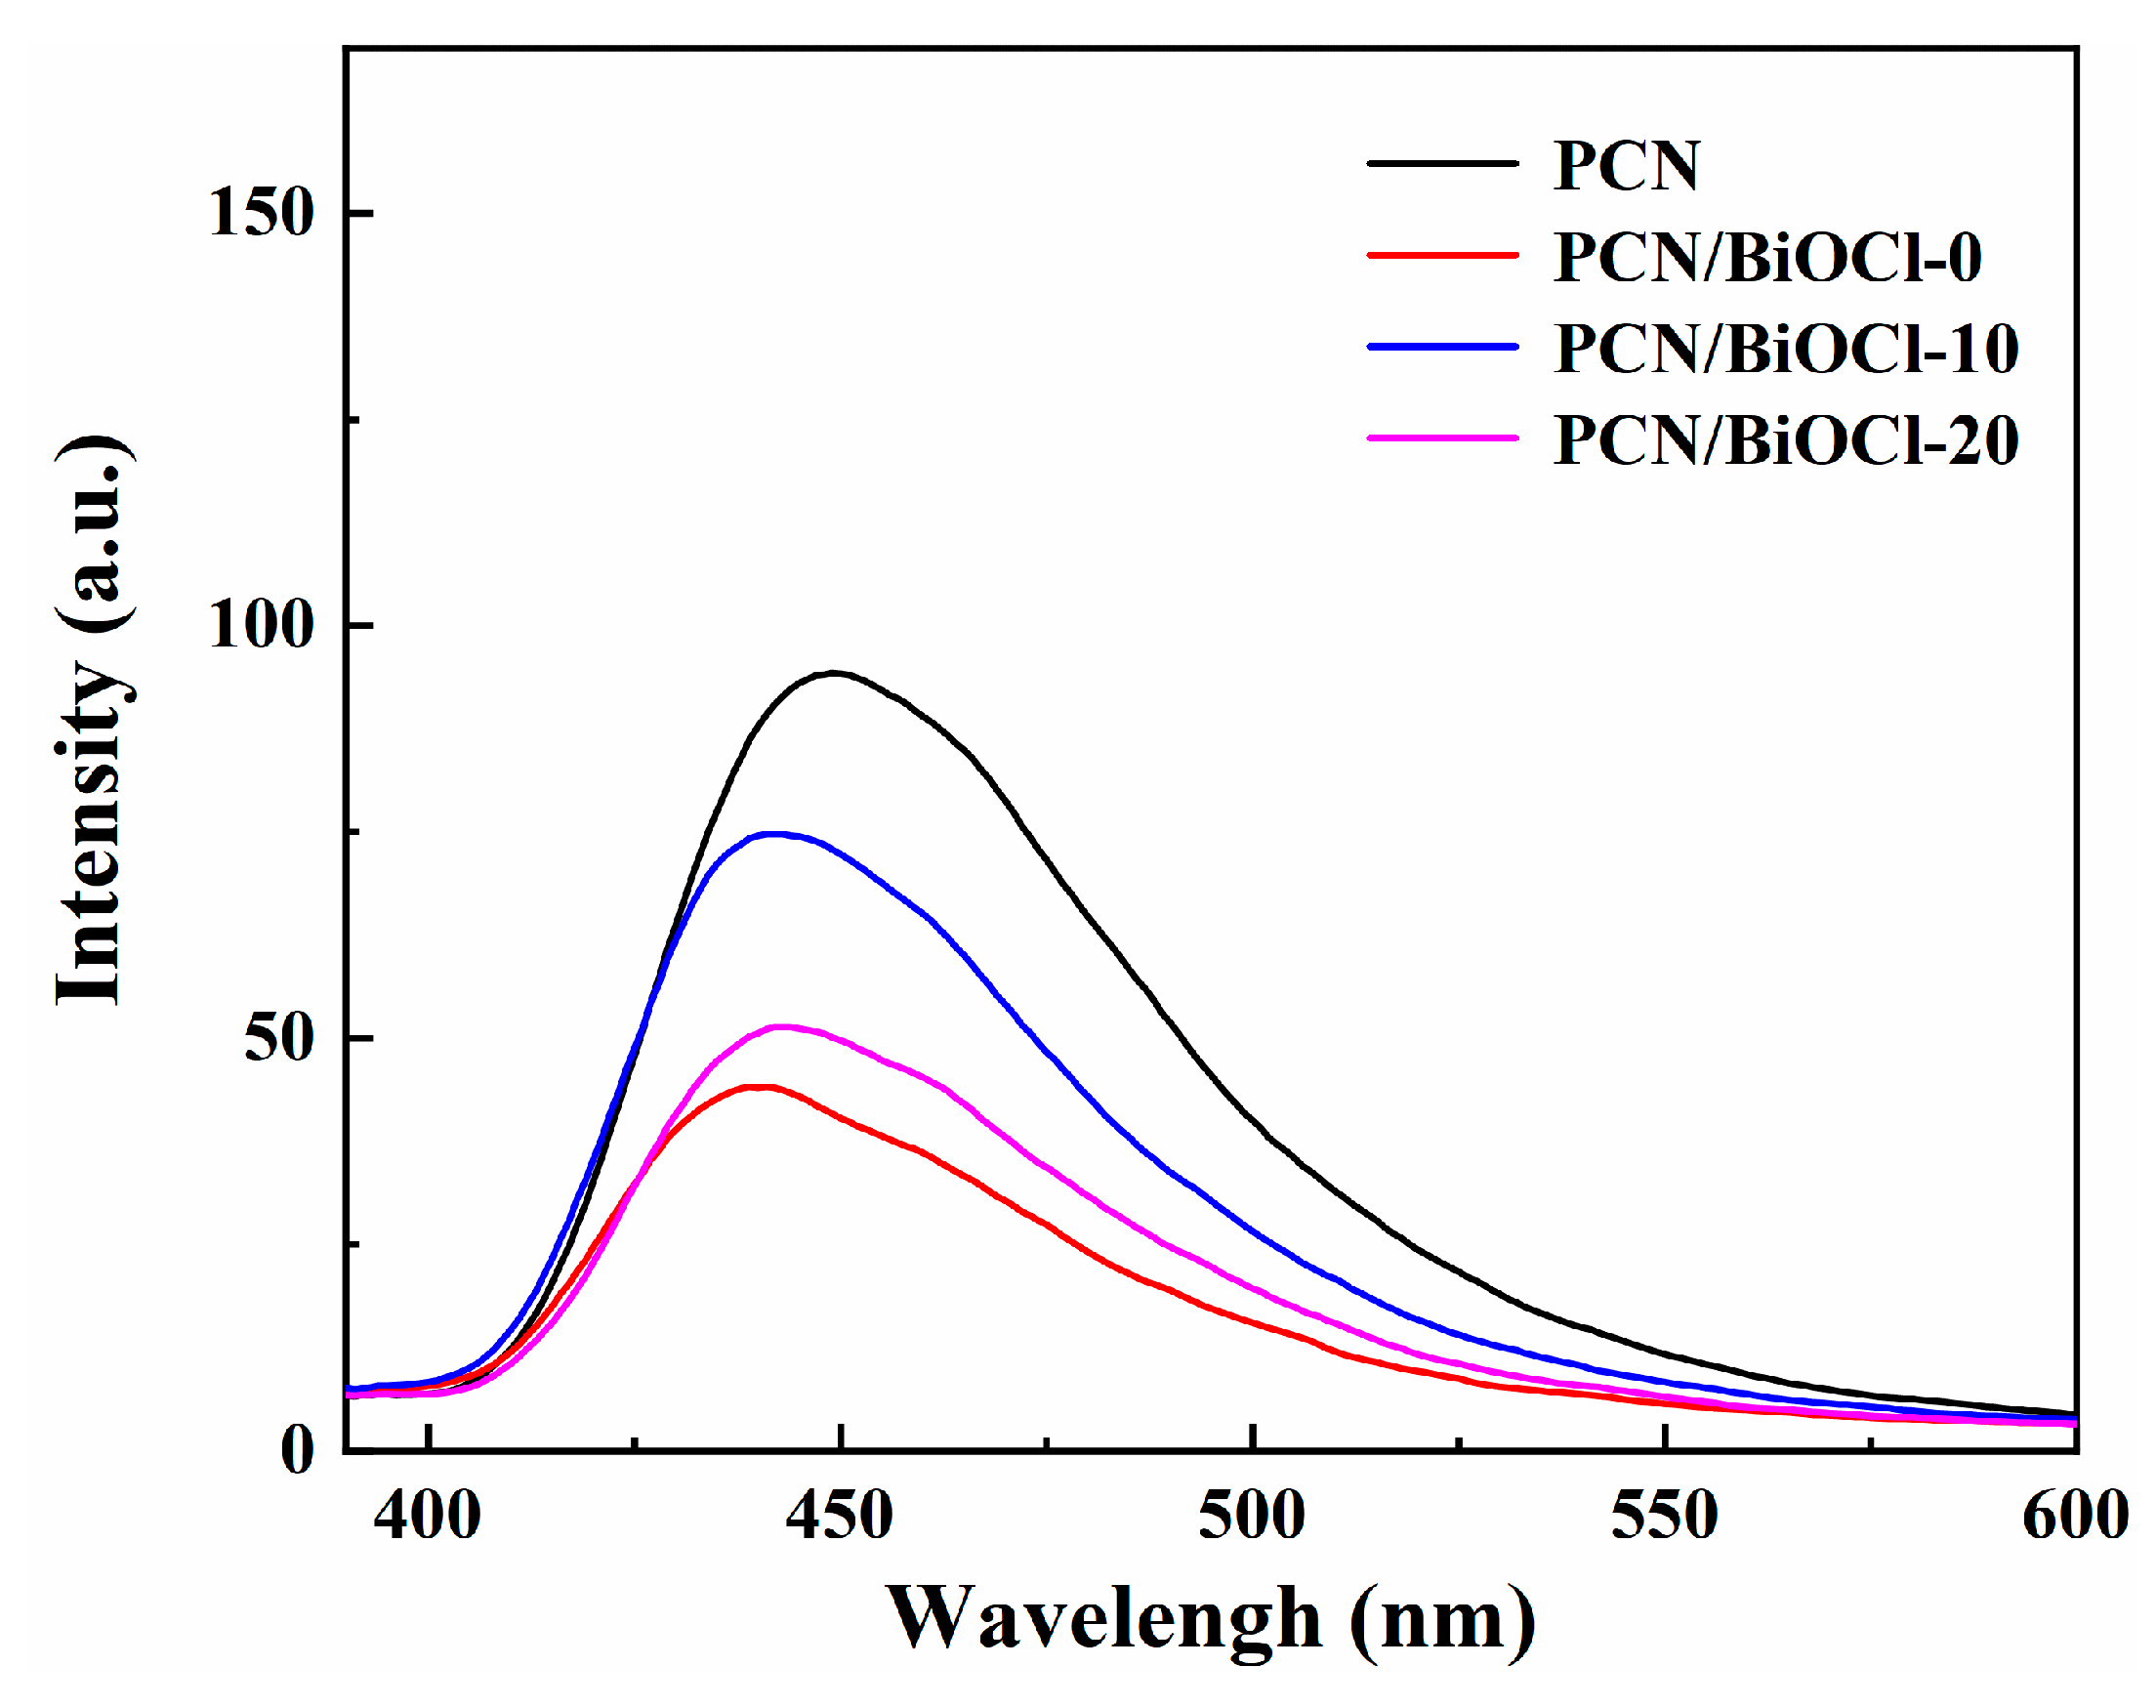
3.3. Photoelectrochemical and Optical Properties
3.4. Photocatalytic Activity
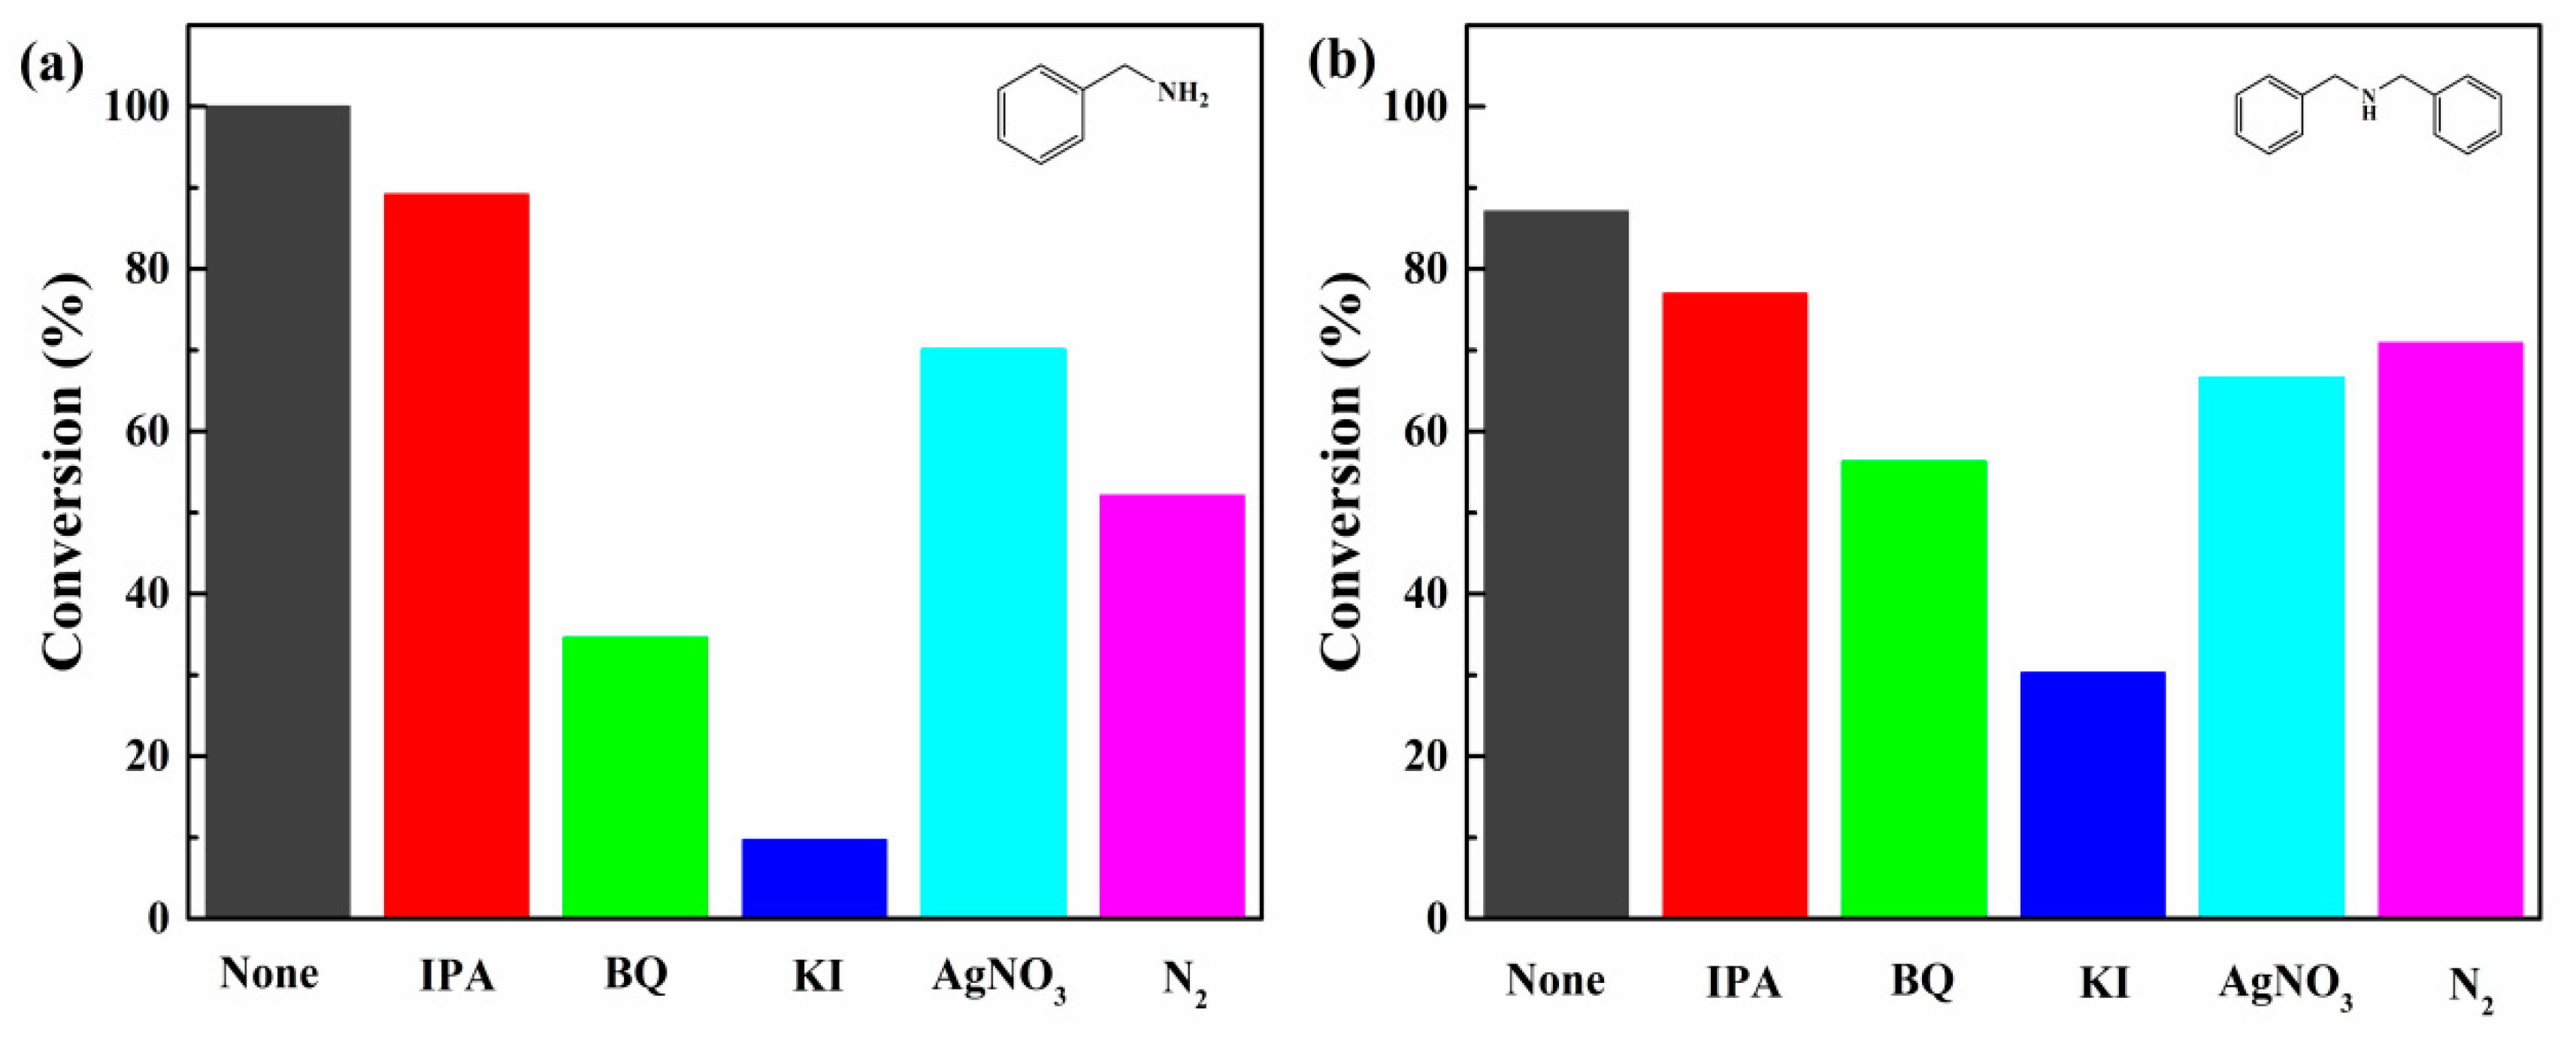
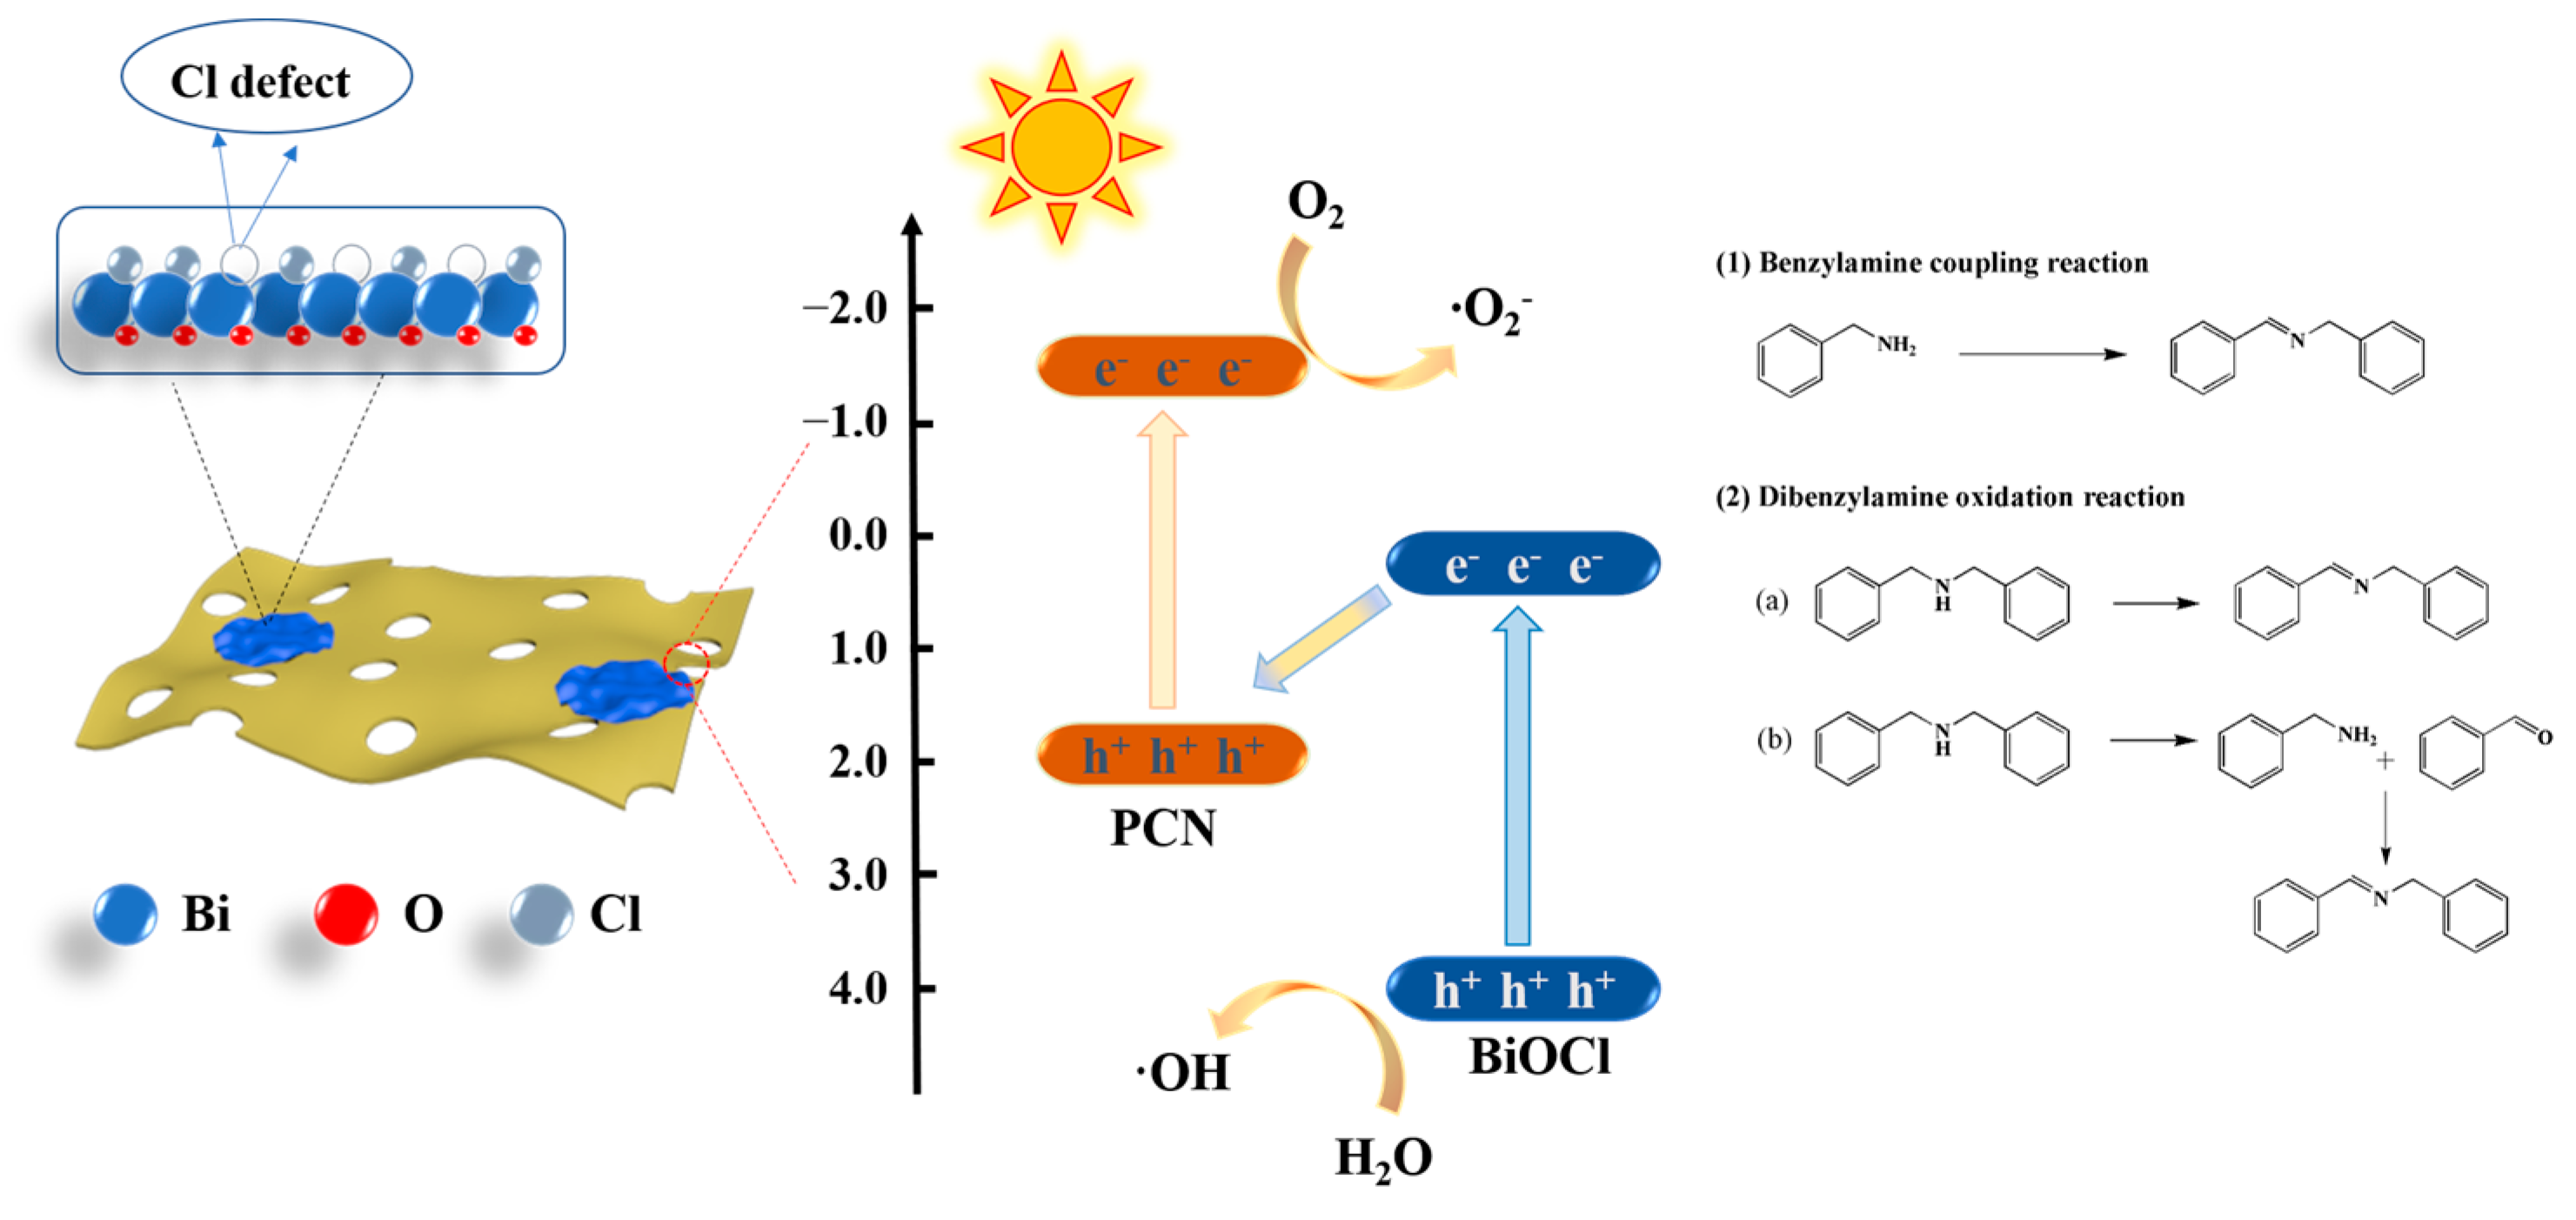
3.5. Mechanism Analysis
4. Conclusions
Supplementary Materials
Author Contributions
Funding
Institutional Review Board Statement
Data Availability Statement
Conflicts of Interest
References
- Nugent, T.C.; El-Shazly, M. Chiral Amine Synthesis-Recent Developments and Trends for Enamide Reduction, Reductive Amination, and Imine Reduction. Adv. Synth. Catal. 2010, 352, 753–819. [Google Scholar] [CrossRef]
- Naeimi, H.; Salimi, F.; Rabiei, K. Mild and convenient one pot synthesis of Schiff bases in the presence of P2O5/Al2O3 as new catalyst under solvent-free conditions. J. Mol. Catal. A Chem. 2006, 260, 100–104. [Google Scholar] [CrossRef]
- Radhika, N.P.; Selvin, R.; Kakkar, R.; Umar, A. Recent advances in nano-photocatalysts for organic synthesis. Arab. J. Chem. 2019, 12, 4550–4578. [Google Scholar] [CrossRef]
- Deng, F.; Zhang, Q.; Yang, L.; Luo, X.; Wang, A.; Luo, S.; Dionysiou, D.D. Visible-light-responsive graphene-functionalized Bi-bridge Z-scheme black BiOCl/Bi2O3 heterojunction with oxygen vacancy and multiple charge transfer channels for efficient photocatalytic degradation of 2-nitrophenol and industrial wastewater treatment. Appl. Catal. B Environ. 2018, 238, 61–69. [Google Scholar] [CrossRef]
- Choi, J.U.; Jo, W.-K. g-C3N4/oxygen-deficient BiOCl nanocomposite assisted by distinguished properties of graphene quantum dots for the efficient photocatalytic removal of organic vapors. Appl. Surf. Sci. 2019, 493, 873–881. [Google Scholar] [CrossRef]
- Li, H.; Liu, J.; Wang, C.; Yang, H.; Xue, X. Oxygen vacancies-enriched and porous hierarchical structures of ZnO microspheres with improved photocatalytic performance. Vacuum 2022, 199, 110891. [Google Scholar] [CrossRef]
- Li, H.; Jin, C.; Wang, Z.; Liu, Y.; Wang, P.; Zheng, Z.; Whangbo, M.-H.; Kou, L.; Li, Y.; Dai, Y.; et al. Effect of the intra- and inter-triazine N-vacancies on the photocatalytic hydrogen evolution of graphitic carbon nitride. Chem. Eng. J. 2019, 369, 263–271. [Google Scholar] [CrossRef]
- Hasija, V.; Sudhaik, A.; Raizada, P.; Hosseini-Bandegharaei, A.; Singh, P. Carbon quantum dots supported AgI/ZnO/phosphorus doped graphitic carbon nitride as Z-scheme photocatalyst for efficient photodegradation of 2, 4-dinitrophenol. J. Environ. Chem. Eng. 2019, 7, 103272. [Google Scholar] [CrossRef]
- Chen, Q.; Wang, H.; Wang, C.; Guan, R.; Duan, R.; Fang, Y.; Hu, X. Activation of molecular oxygen in selectively photocatalytic organic conversion upon defective TiO2 nanosheets with boosted separation of charge carriers. Appl. Catal. B Environ. 2020, 262, 118258. [Google Scholar] [CrossRef]
- Liao, J.; Li, K.; Ma, H.; Dong, F.; Zeng, X.; Sun, Y. Oxygen vacancies on the BiOCl surface promoted photocatalytic complete NO oxidation via superoxide radicals. Chin. Chem. Lett. 2020, 31, 2737–2741. [Google Scholar] [CrossRef]
- Mishra, A.; Mehta, A.; Basu, S.; Shetti, N.P.; Reddy, K.R.; Aminabhavi, T.M. Graphitic carbon nitride (g-C3N4)-based metal-free photocatalysts for water splitting: A review. Carbon 2019, 149, 693–721. [Google Scholar] [CrossRef]
- Song, X.; Yang, Q.; Jiang, X.; Yin, M.; Zhou, L. Porous graphitic carbon nitride nanosheets prepared under self-producing atmosphere for highly improved photocatalytic activity. J. Appl. Catal. B Environ. 2017, 217, 322–330. [Google Scholar] [CrossRef]
- Wang, M.; Tan, G.; Feng, S.; Dang, M.; Wang, Y.; Zhang, B.; Ren, H.; Lv, L.; Xia, A.; Liu, W.; et al. Defects and Internal Electric Fields Synergistically Optimized g-C3N4-x/BiOCl/WO2.92 Heterojunction for Photocatalytic NO Deep Oxidation. J. Hazard. Mater. 2021, 408, 124897. [Google Scholar] [CrossRef] [PubMed]
- Gao, X.; Peng, W.; Tang, G.; Guo, Q.; Luo, Y. Highly efficient and visible-light-driven BiOCl for photocatalytic degradation of carbamazepine. J. Alloys Compd. 2018, 757, 455–465. [Google Scholar] [CrossRef]
- Zhang, R.; Niu, S.; Xiang, J.; Zheng, J.; Jiang, Z.; Guo, C. Band-potential fluctuation in C3N4/BiOCl hetero-junction for boosting photo-catalytic activity. Sep. Purif. Technol. 2021, 261, 118258. [Google Scholar] [CrossRef]
- Peng, Y.; Mao, Y.G.; Kan, P.F.; Liu, J.Y.; Fang, Z. Controllable synthesis and photoreduction performance towards Cr(vi) of BiOCl microrods with exposed (110) crystal facets. New J. Chem. 2018, 42, 16911–16918. [Google Scholar] [CrossRef]
- Sun, Y.; Qi, X.; Li, R.; Xie, Y.; Tang, Q.; Ren, B. Hydrothermal synthesis of 2D/2D BiOCl/g-C3N4 Z-scheme: For TC degradation and antimicrobial activity evaluation. Opt. Mater. 2020, 108, 110170. [Google Scholar] [CrossRef]
- Che, H.; Liu, C.; Hu, W.; Hu, H.; Li, J.; Dou, J.; Shi, W.; Li, C.; Dong, H. NGQD active sites as effective collectors of charge carriers for improving the photocatalytic performance of Z-scheme g-C3N4/Bi2WO6 heterojunctions. Catal. Sci. Technol. 2018, 8, 622–631. [Google Scholar] [CrossRef]
- Bellamkonda, S.; Rao, G.R. Nanojunction-mediated visible light photocatalytic enhancement in heterostructured ternary BiOCl/ CdS/g-C3N4 nanocomposites. Catal. Today 2019, 321–322, 18–25. [Google Scholar] [CrossRef]
- Ye, L.; Tian, L.; Peng, T.; Zan, L. Synthesis of highly symmetrical BiOI single-crystal nanosheets and their {001} facet-dependent photoactivity. J. Mater. Chem. 2011, 21, 12479. [Google Scholar] [CrossRef]
- Wang, X.-J.; Wang, Q.; Li, F.-T.; Yang, W.-Y.; Zhao, Y.; Hao, Y.-J.; Liu, S.-J. Novel BiOCl-C3N4 heterojunction photocatalysts: In situ preparation via an ionic-liquid-assisted solvent-thermal route and their visible-light photocatalytic activities. Chem. Eng. J. 2013, 234, 361–371. [Google Scholar] [CrossRef]
- Weng, S.; Hu, J.; Lu, M.; Ye, X.; Pei, Z.; Huang, M.; Xie, L.; Lin, S.; Liu, P. In situ photogenerated defects on surface-complex BiOCl (010) with high visible-light photocatalytic activity: A probe to disclose the charge transfer in BiOCl (010)/surface-complex system. Appl. Catal. B Environ. 2015, 163, 205–213. [Google Scholar] [CrossRef]
- Li, G.; Huang, S.; Zhu, N.; Yuan, H.; Ge, D.; Wei, Y. Defect-rich heterojunction photocatalyst originated from the removal of chloride ions and its degradation mechanism of norfloxacin. Chem. Eng. J. 2021, 421, 127852. [Google Scholar] [CrossRef]
- Rao, F.; Zhong, J.; Li, J. Improved visible light responsive photocatalytic hydrogen production over g-C3N4 with rich carbon vacancies. Ceram. Int. 2022, 48, 1439–1445. [Google Scholar] [CrossRef]
- Wang, T.; Yang, W.; Chang, L.; Wang, H.; Wu, H.; Cao, J.; Fan, H.; Wang, J.; Liu, H.; Hou, Y.; et al. One-step calcination synthesis of accordion-like MXene-derived TiO2@C coupled with g-C3N4: Z-scheme heterojunction for enhanced photocatalytic NO removal. Sep. Purif. Technol. 2022, 285, 120329. [Google Scholar] [CrossRef]
- Zhao, G.; Ding, J.; Zhou, F.; Chen, X.; Wei, L.; Gao, Q.; Wang, K.; Zhao, Q. Construction of a Visible-Light-Driven Magnetic Dual Z-Scheme BiVO4/g-C3N4/NiFe2O4 Photocatalyst for Effective Removal of Ofloxacin: Mechanisms and Degradation Pathway. Chem. Eng. J. 2020, 405, 126704. [Google Scholar] [CrossRef]
- Yang, Q.; Li, R.; Wei, S.; Yang, R. Schottky functionalized Z-scheme heterojunction photocatalyst Ti2C3/g-C3N4/BiOCl: Efficient photocatalytic H2O2 production via two-channel pathway. Appl. Surf. Sci. 2022, 572, 151525. [Google Scholar] [CrossRef]
- Kundu, A.; Sharma, S.; Basu, S. Modulated BiOCl nanoplates with porous g-C3N4 nanosheets for photocatalytic degradation of color/colorless pollutants in natural sunlight. J. Phys. Chem. Solids 2021, 154, 110064. [Google Scholar] [CrossRef]
- Hou, W.; Deng, C.; Xu, H.; Li, D.; Zou, Z.; Xia, H.; Xia, D. n-p BiOCl@g-C3N4 Heterostructure with Rich-oxygen Vacancies for Photodegradation of Carbamazepine. ChemistrySelect 2020, 5, 2767–2777. [Google Scholar] [CrossRef]
- Dong, X.; Sun, Z.; Zhang, X.; Li, C.; Zheng, S. Construction of BiOCl/g-C3N4 /kaolinite composite and its enhanced photocatalysis performance under visible-light irradiation. J. Taiwan Inst. Chem. Eng. 2018, 84, 203–211. [Google Scholar] [CrossRef]
- Zhao, S.; Zhang, Y.; Zhou, Y.; Fang, J.; Wang, Y.; Zhang, C.; Chen, W. Fabrication of sandwich-structured g-C3N4/Au/BiOCl Z-scheme photocatalyst with enhanced photocatalytic performance under visible light irradiation. J. Mater. Sci. 2018, 53, 6008–6020. [Google Scholar] [CrossRef]
- Zhang, W.; Liang, Y. Facile Synthesis of Ternary g-C3N4@BiOCl/Bi12O17Cl2 Composites with Excellent Visible Light Photocatalytic Activity for NO Removal. Front. Chem. 2019, 7, 231. [Google Scholar] [CrossRef]
- Chen, Y.; Tang, D.; Wang, Z.; Yin, M.; Yang, Q.; Zhou, Y.; Cheng, Z.; Wang, Z.; Zhang, K.; Zhou, L. Sn-bridge type-II PCN/Sn/SnO heterojunction with enhanced photocatalytic activity. Semicond. Sci. Technol. 2020, 35, 115015. [Google Scholar] [CrossRef]

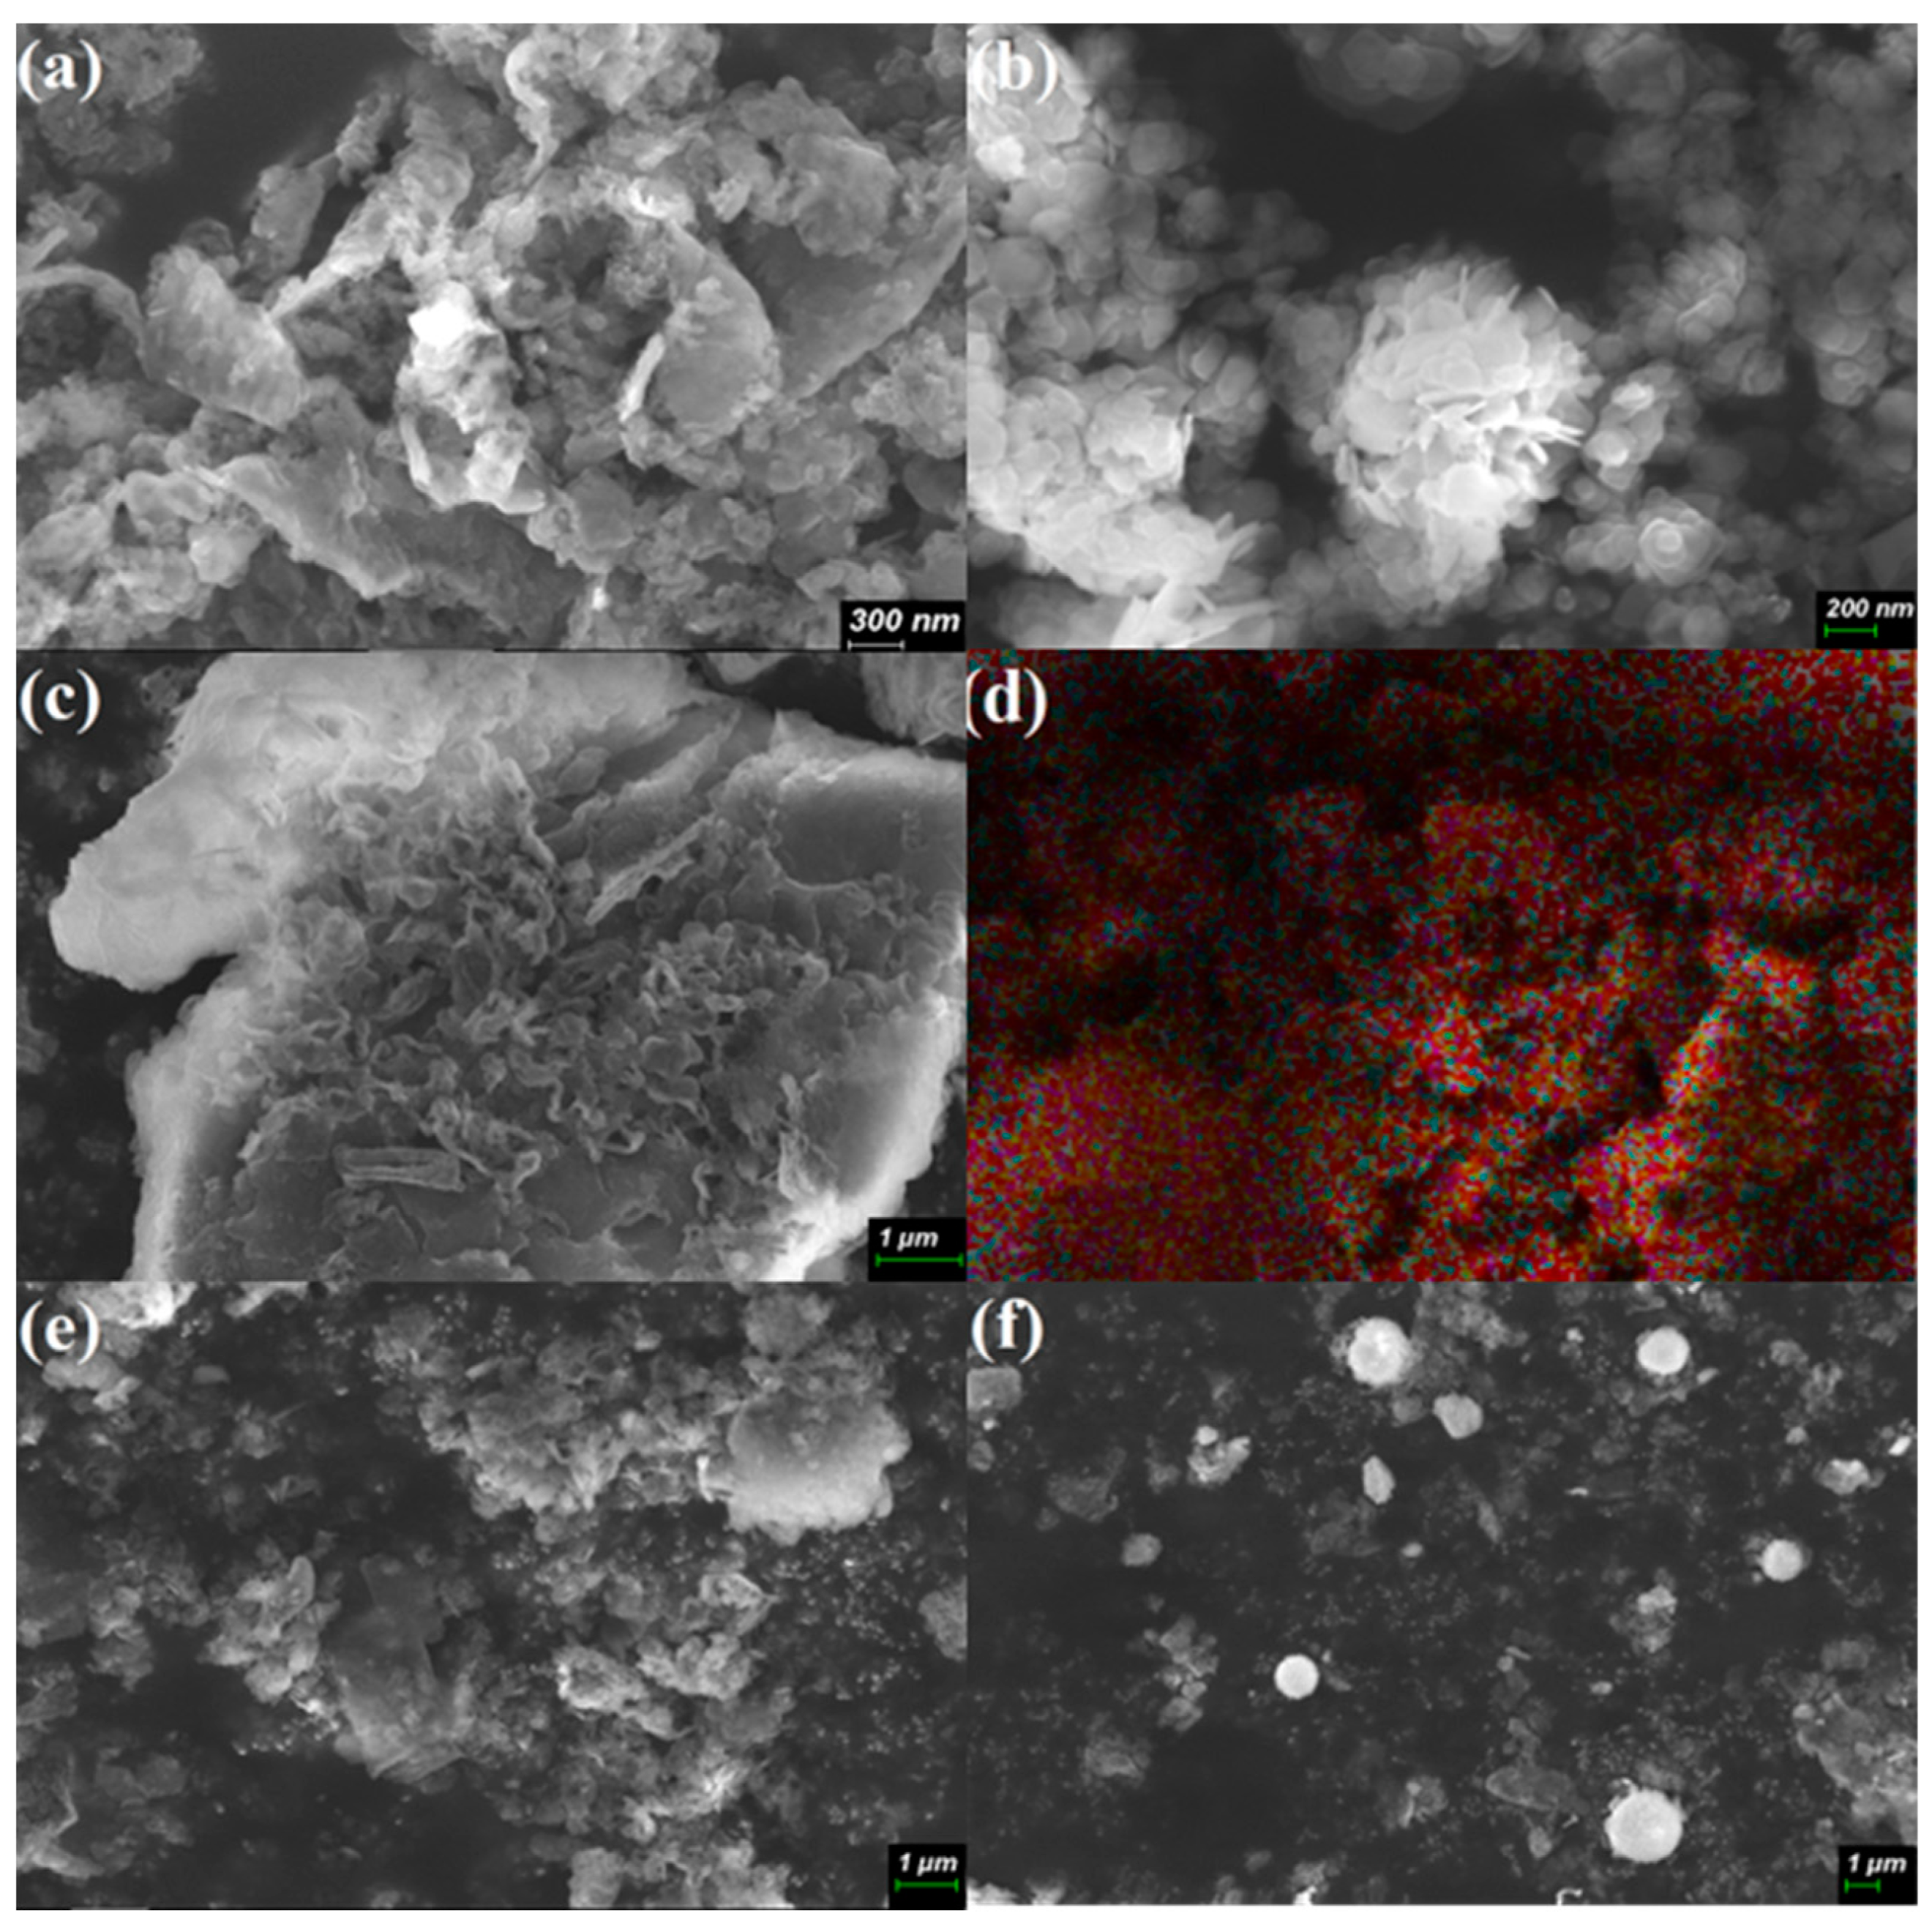
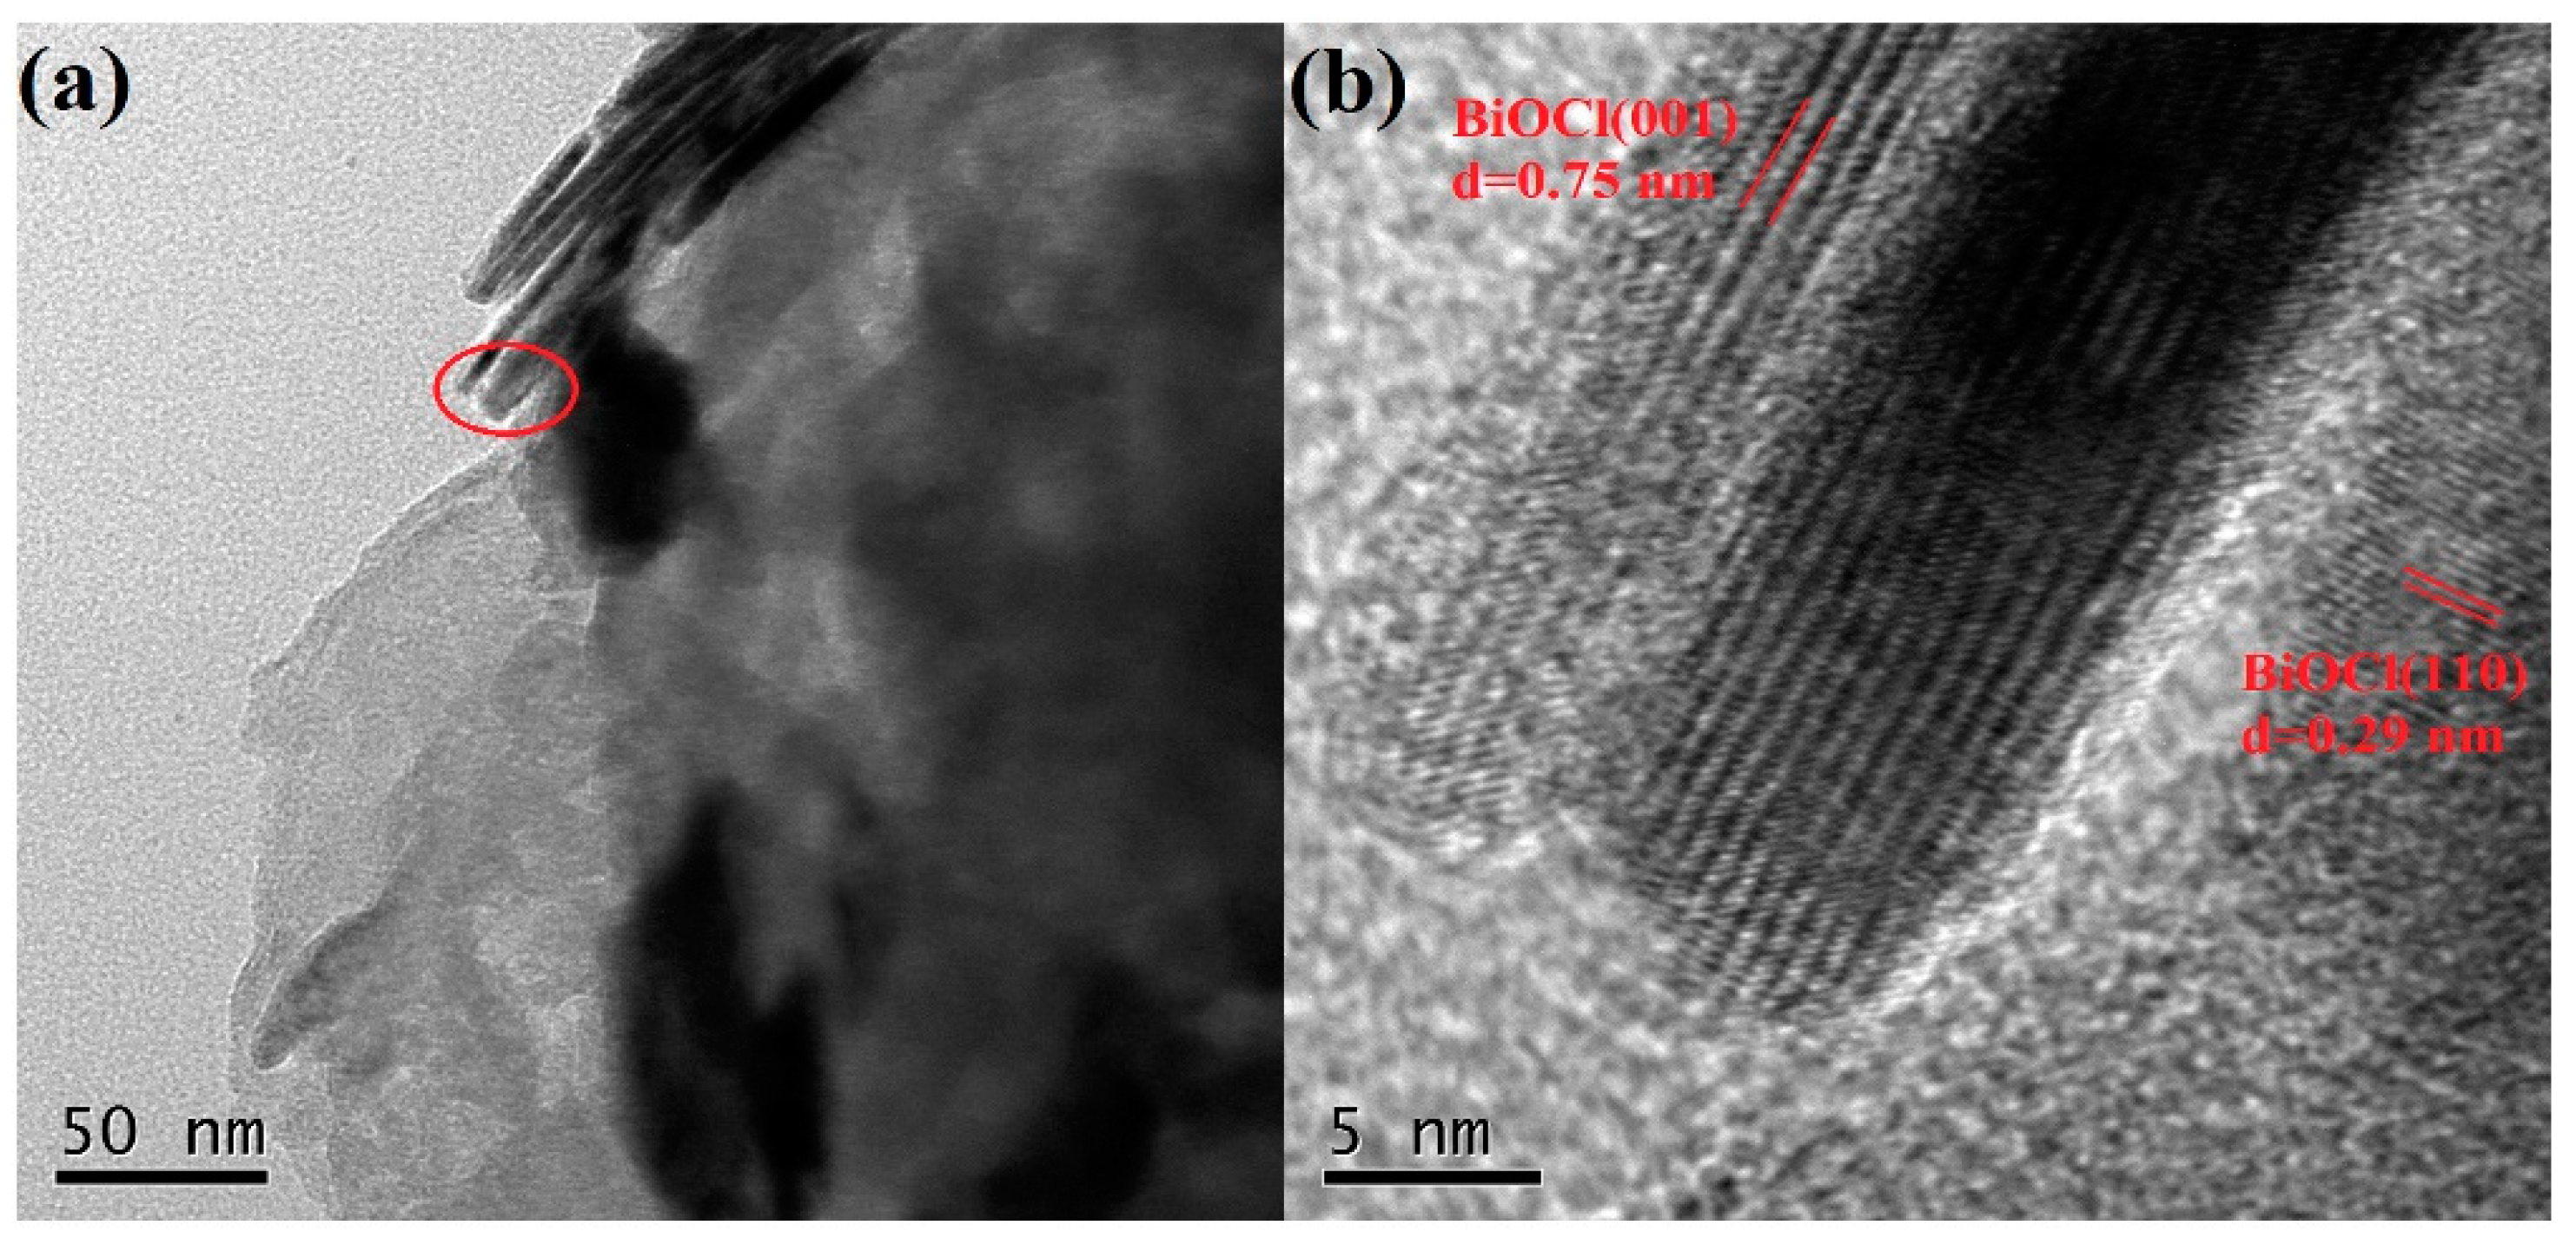
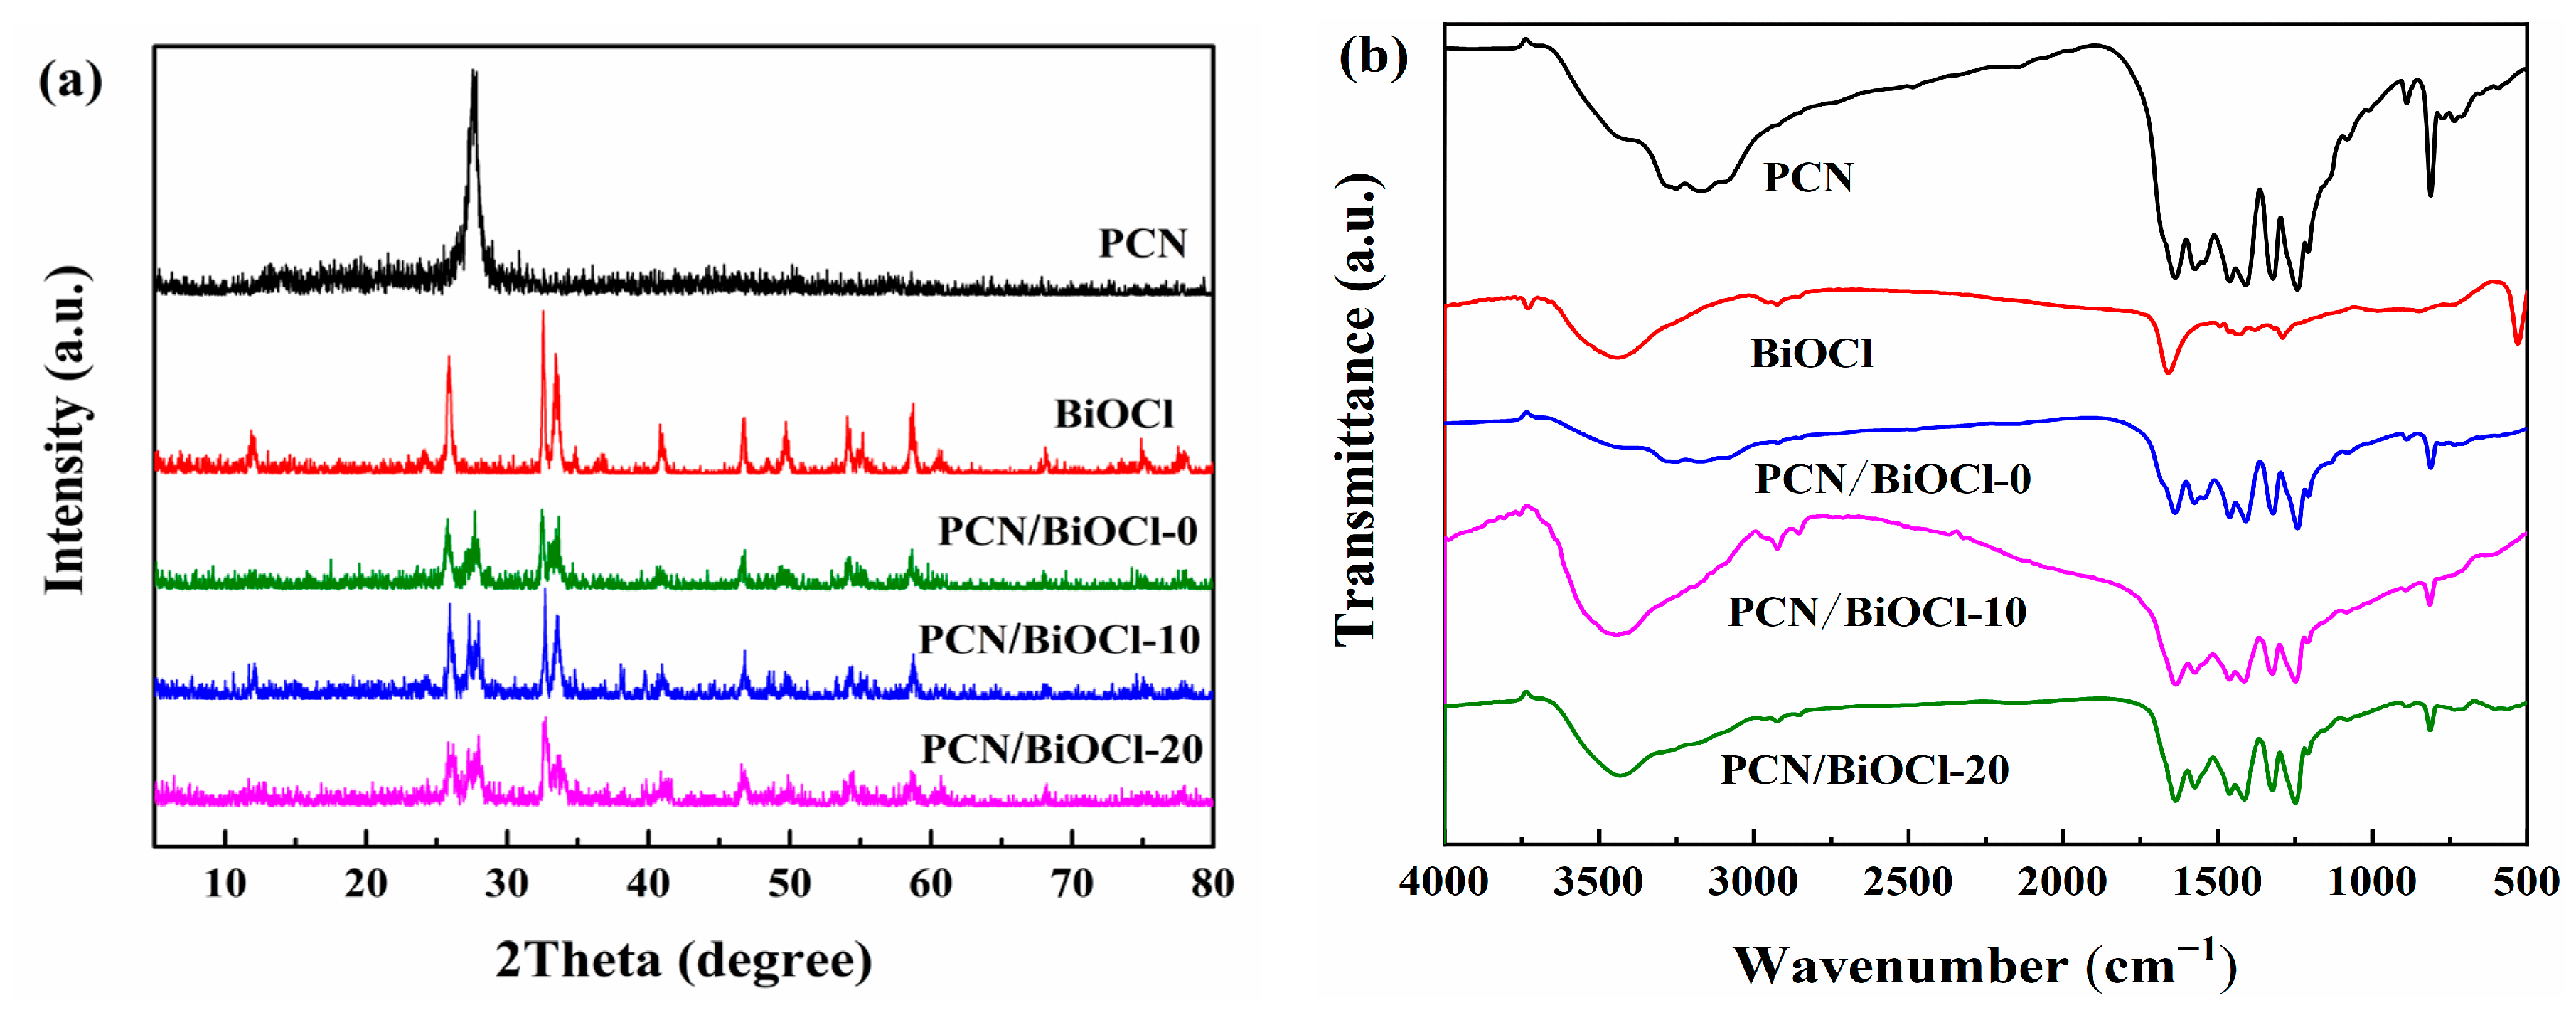
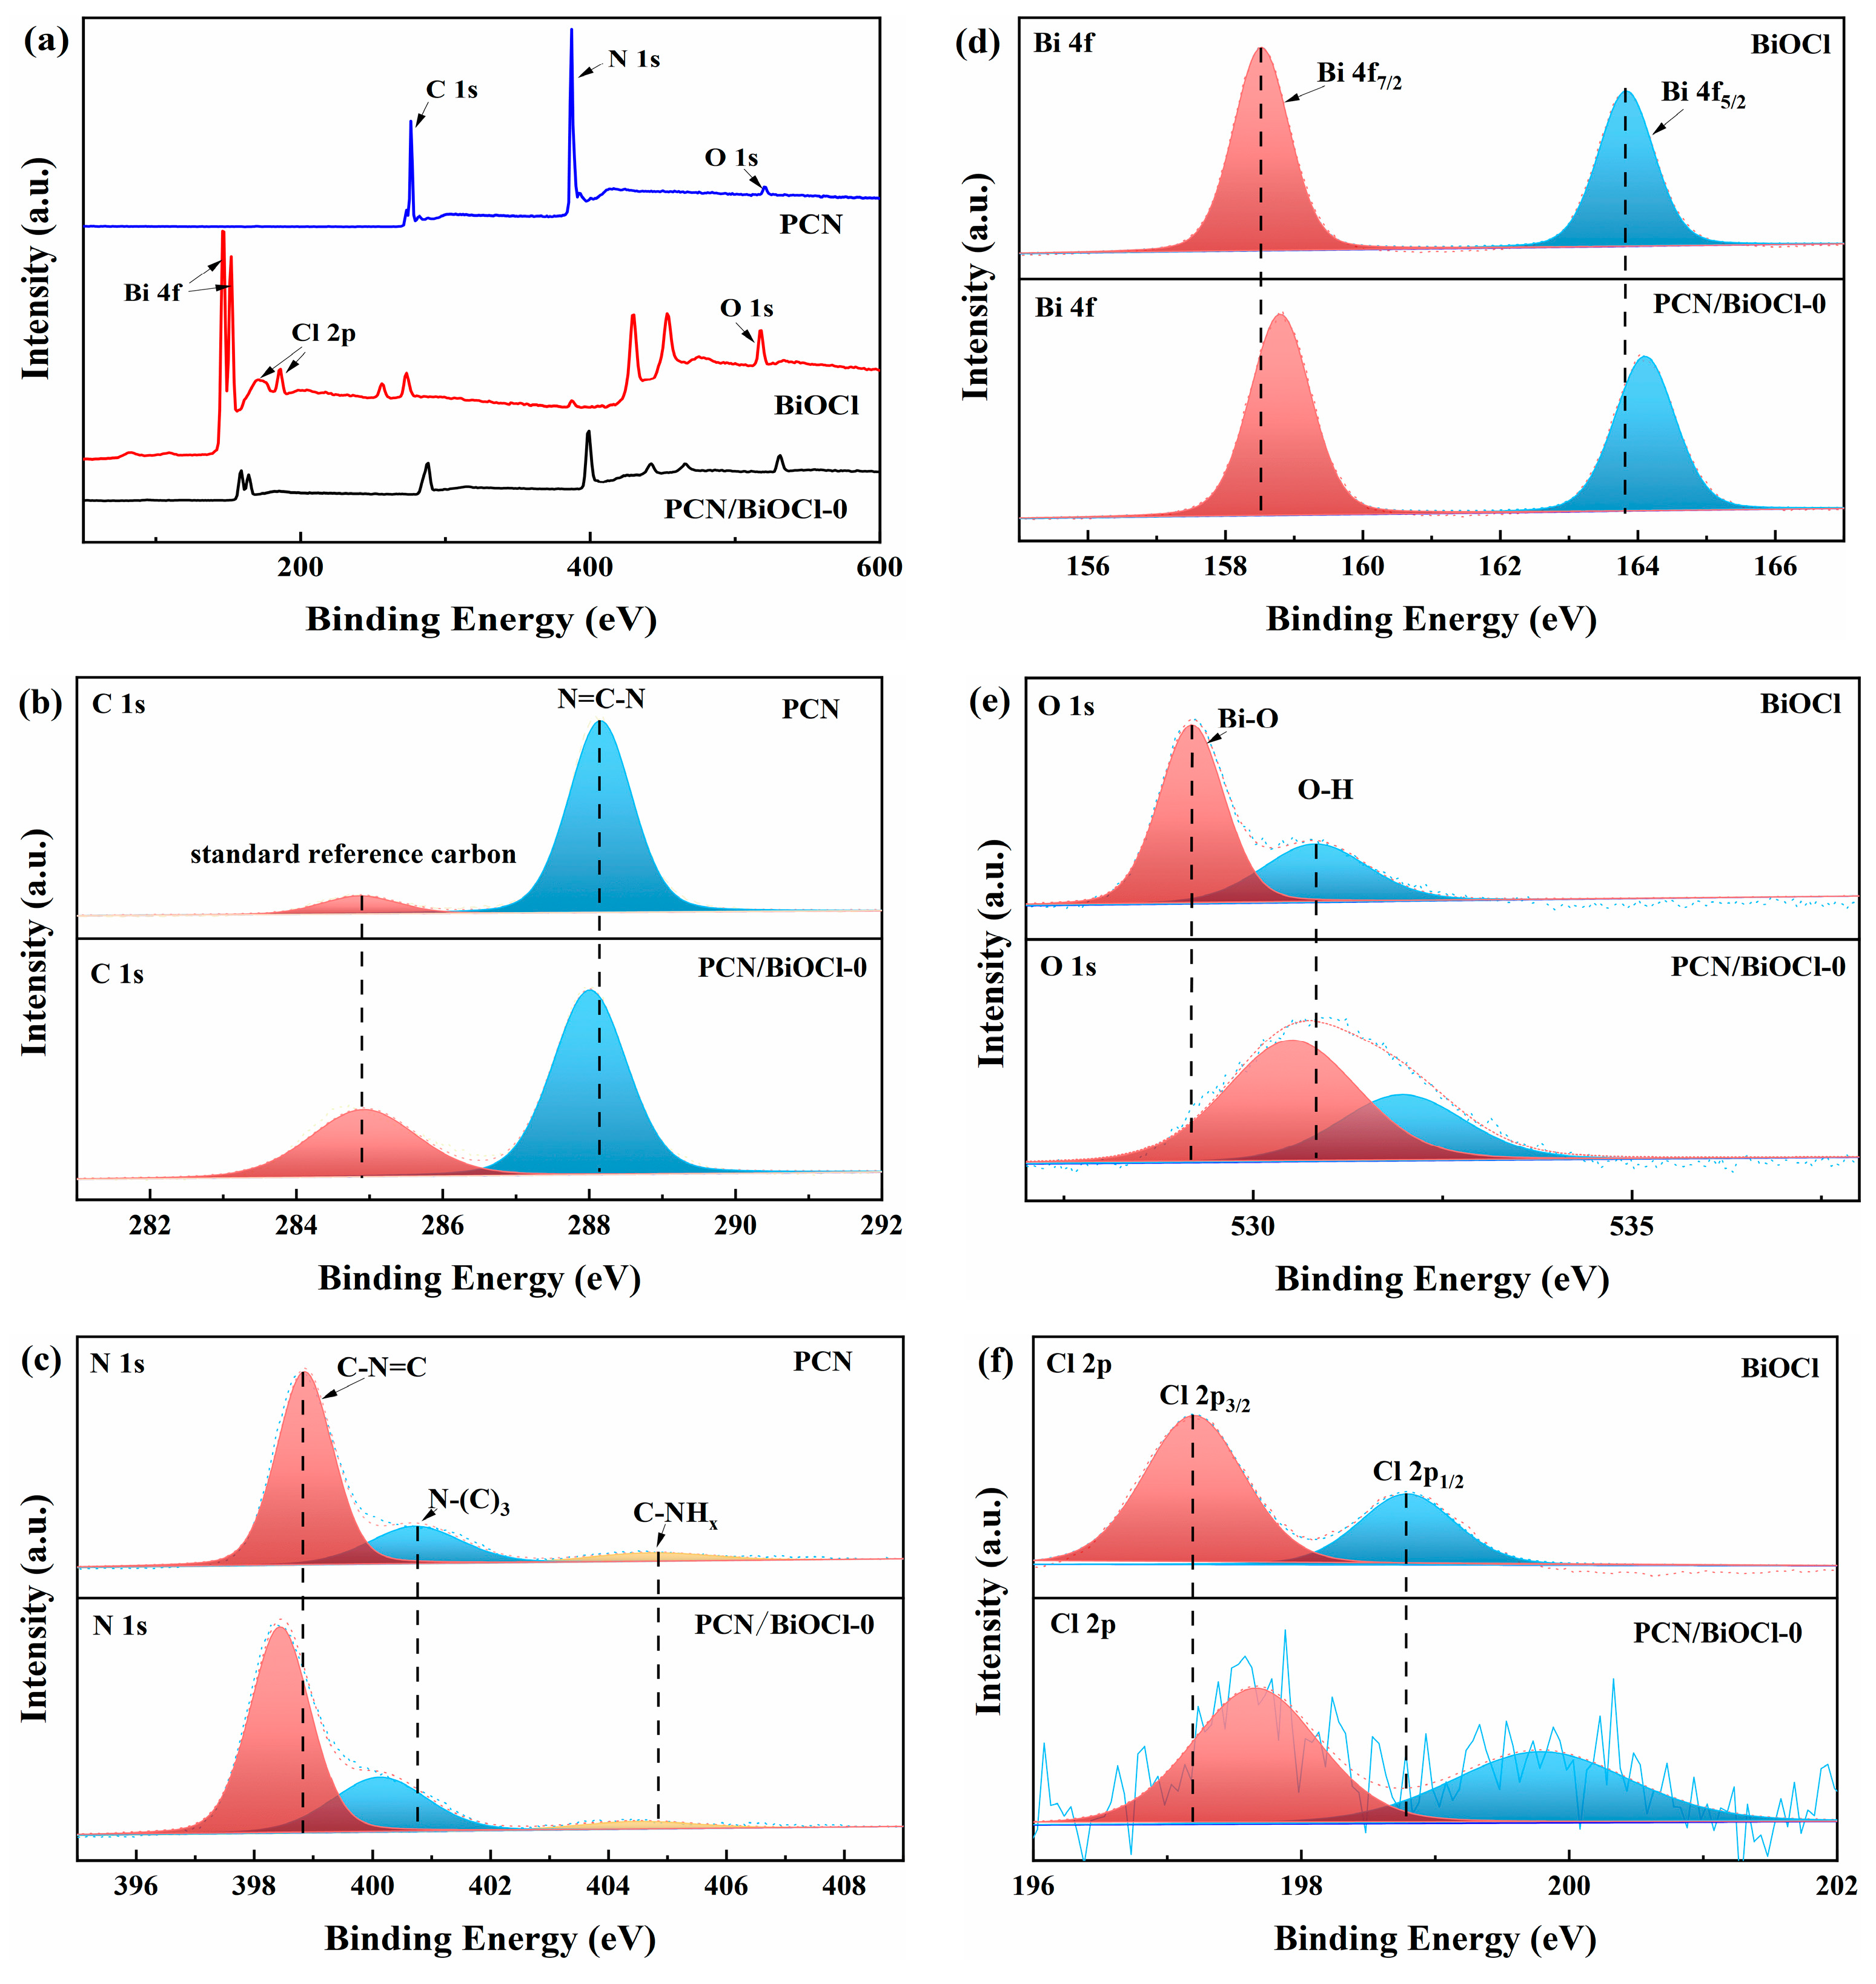

 | |||
| Entry | Catalyst | Conv. b (%) | Sel. b (%) |
| 1 | PCN | 40.1 | 99 |
| 2 | BiOCl | 54.5 | 99 |
| 3 | PCN/Bi2O3 | 42.3 | 99 |
| 4 | PCN/BiOCl-0 | 88.0 | 99 |
| 5 | PCN/BiOCl-10 | 72.7 | 99 |
| 6 | PCN/BiOCl-20 | 76.1 | 99 |
 | ||||
| Entry | Time (h) | Catalyst Amount (g) | Conv. b (%) | Sel. b (%) |
| 1 | 3 | 0 | 2.7 | 99 |
| 2 | 3 | 0.01 | 49.6 | 99 |
| 3 | 3 | 0.02 | 68.3 | 99 |
| 4 | 3 | 0.03 | 66.2 | 99 |
| 5 c | 3 | 0.02 | 2.2 | 99 |
| 6 | 4 | 0.02 | 74.8 | 99 |
| 7 | 5 | 0.02 | 88.5 | 99 |
| 8 | 6 | 0.02 | 97.2 | 99 |
 | ||||
| Entry | Product | Time (h) | Conv. b (%) | Sel. b (%) |
| 1 |  | 6 | 100 | 99 |
| 2 |  | 6 | 96.6 | 99 |
| 3 |  | 6 | 97.7 | 99 |
| 4 |  | 5 | 100 | 99 |
| 5 |  | 5/6 | 83.9/94.9 | 99 |
| 6 |  | 5/7 | 76.6/97.4 | 99 |
| 7 |  | 6 | 85.4 | 99 |
| 8 |  | 6 | 91 | 99 |
| 9 |  | 5 | 96.9 | 99 |
 | |||
| Entry | Catalyst | Conv. b (%) | Sel. b (%) |
| 1 | PCN | 25.7 | 99 |
| 2 | BiOCl | 36.0 | 99 |
| 3 | PCN/Bi2O3 | 52.0 | 99 |
| 4 | PCN/BiOCl-0 | 59.1 | 99 |
| 5 | PCN/BiOCl-10 | 39.9 | 99 |
| 6 | PCN/BiOCl-20 | 45.2 | 99 |
| Entry | Time (h) | Catalyst Amount (g) | Conv. b (%) | Sel. b (%) |
|---|---|---|---|---|
| 1 | 3 | 0 | 5.8 | 99 |
| 2 | 3 | 0.01 | 40.5 | 99 |
| 3 | 3 | 0.02 | 53.5 | 99 |
| 4 | 3 | 0.03 | 59.3 | 98 |
| 5 c | 3 | 0.02 | 0 | -- |
| 6 | 4 | 0.02 | 70.1 | 96 |
| 7 | 5 | 0.02 | 82.0 | 95 |
| 8 | 6 | 0.02 | 93.7 | 93 |
| 9 | 7 | 0.02 | 100 | 91 |
| Entry | Substrate | Time (h) | Conv. b (%) | Product (sel. b (%)) |
|---|---|---|---|---|
| 1 |  | 6 | 93.7 |  (93) (93) |
| 2 |  | 4 | 84.9 |  (91) (91) |
| 3 |  | 6 | 90.6 |  (99) (99) |
| 4 |  | 7 | 94.0 |  (90) (90) |
| 5 |  | 26 | 79.3 |  (99) (99) |
| 6 |  | 2 | 91.2 |  (91) (91) |
Disclaimer/Publisher’s Note: The statements, opinions and data contained in all publications are solely those of the individual author(s) and contributor(s) and not of MDPI and/or the editor(s). MDPI and/or the editor(s) disclaim responsibility for any injury to people or property resulting from any ideas, methods, instructions or products referred to in the content. |
© 2023 by the authors. Licensee MDPI, Basel, Switzerland. This article is an open access article distributed under the terms and conditions of the Creative Commons Attribution (CC BY) license (https://creativecommons.org/licenses/by/4.0/).
Share and Cite
Xu, G.; Wang, Z.; Chen, Y.; Qin, L.; Zhou, L. PCN/BiOCl Polymer-Based Heterojunction with Rich Chlorine Defects for Photocatalytic Amine Oxidation. Polymers 2023, 15, 4145. https://doi.org/10.3390/polym15204145
Xu G, Wang Z, Chen Y, Qin L, Zhou L. PCN/BiOCl Polymer-Based Heterojunction with Rich Chlorine Defects for Photocatalytic Amine Oxidation. Polymers. 2023; 15(20):4145. https://doi.org/10.3390/polym15204145
Chicago/Turabian StyleXu, Guichuan, Zhuhan Wang, Yefeng Chen, Li Qin, and Limei Zhou. 2023. "PCN/BiOCl Polymer-Based Heterojunction with Rich Chlorine Defects for Photocatalytic Amine Oxidation" Polymers 15, no. 20: 4145. https://doi.org/10.3390/polym15204145
APA StyleXu, G., Wang, Z., Chen, Y., Qin, L., & Zhou, L. (2023). PCN/BiOCl Polymer-Based Heterojunction with Rich Chlorine Defects for Photocatalytic Amine Oxidation. Polymers, 15(20), 4145. https://doi.org/10.3390/polym15204145


