
A Study of the Friction Stir Lap Welding of AA5052 and Polypropylene

 , , , ,
Abstract
:
1. Introduction
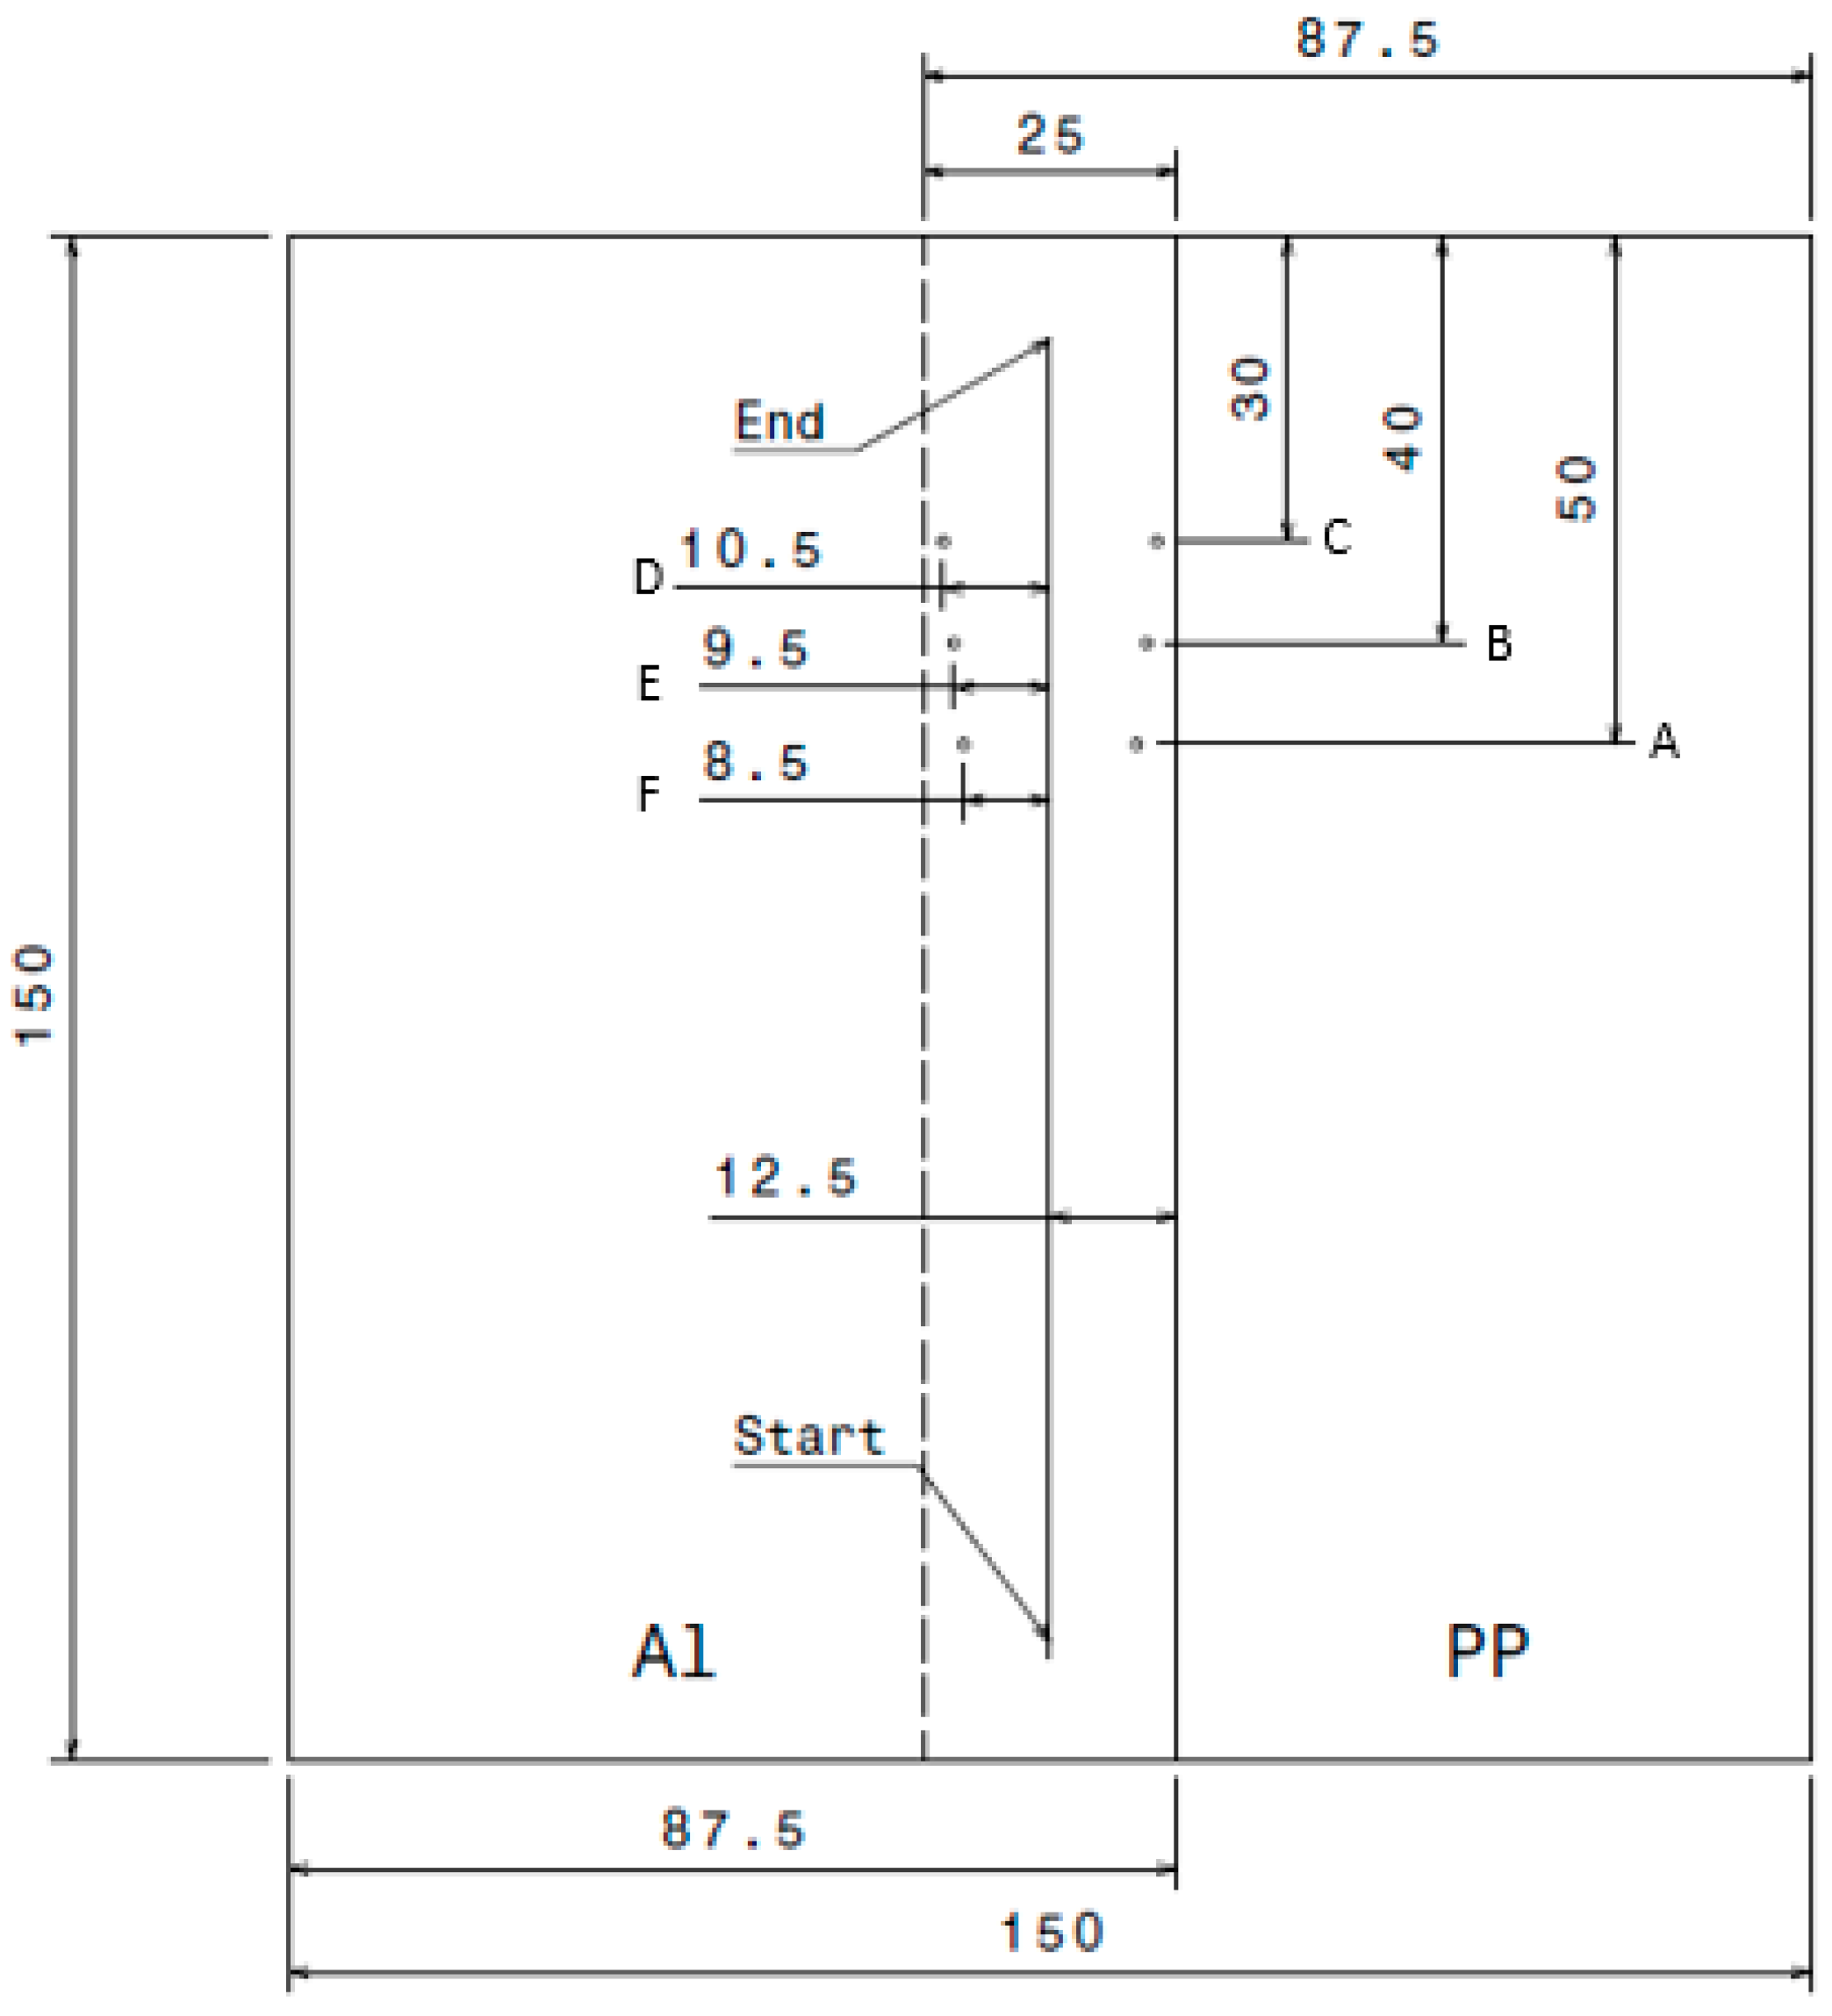
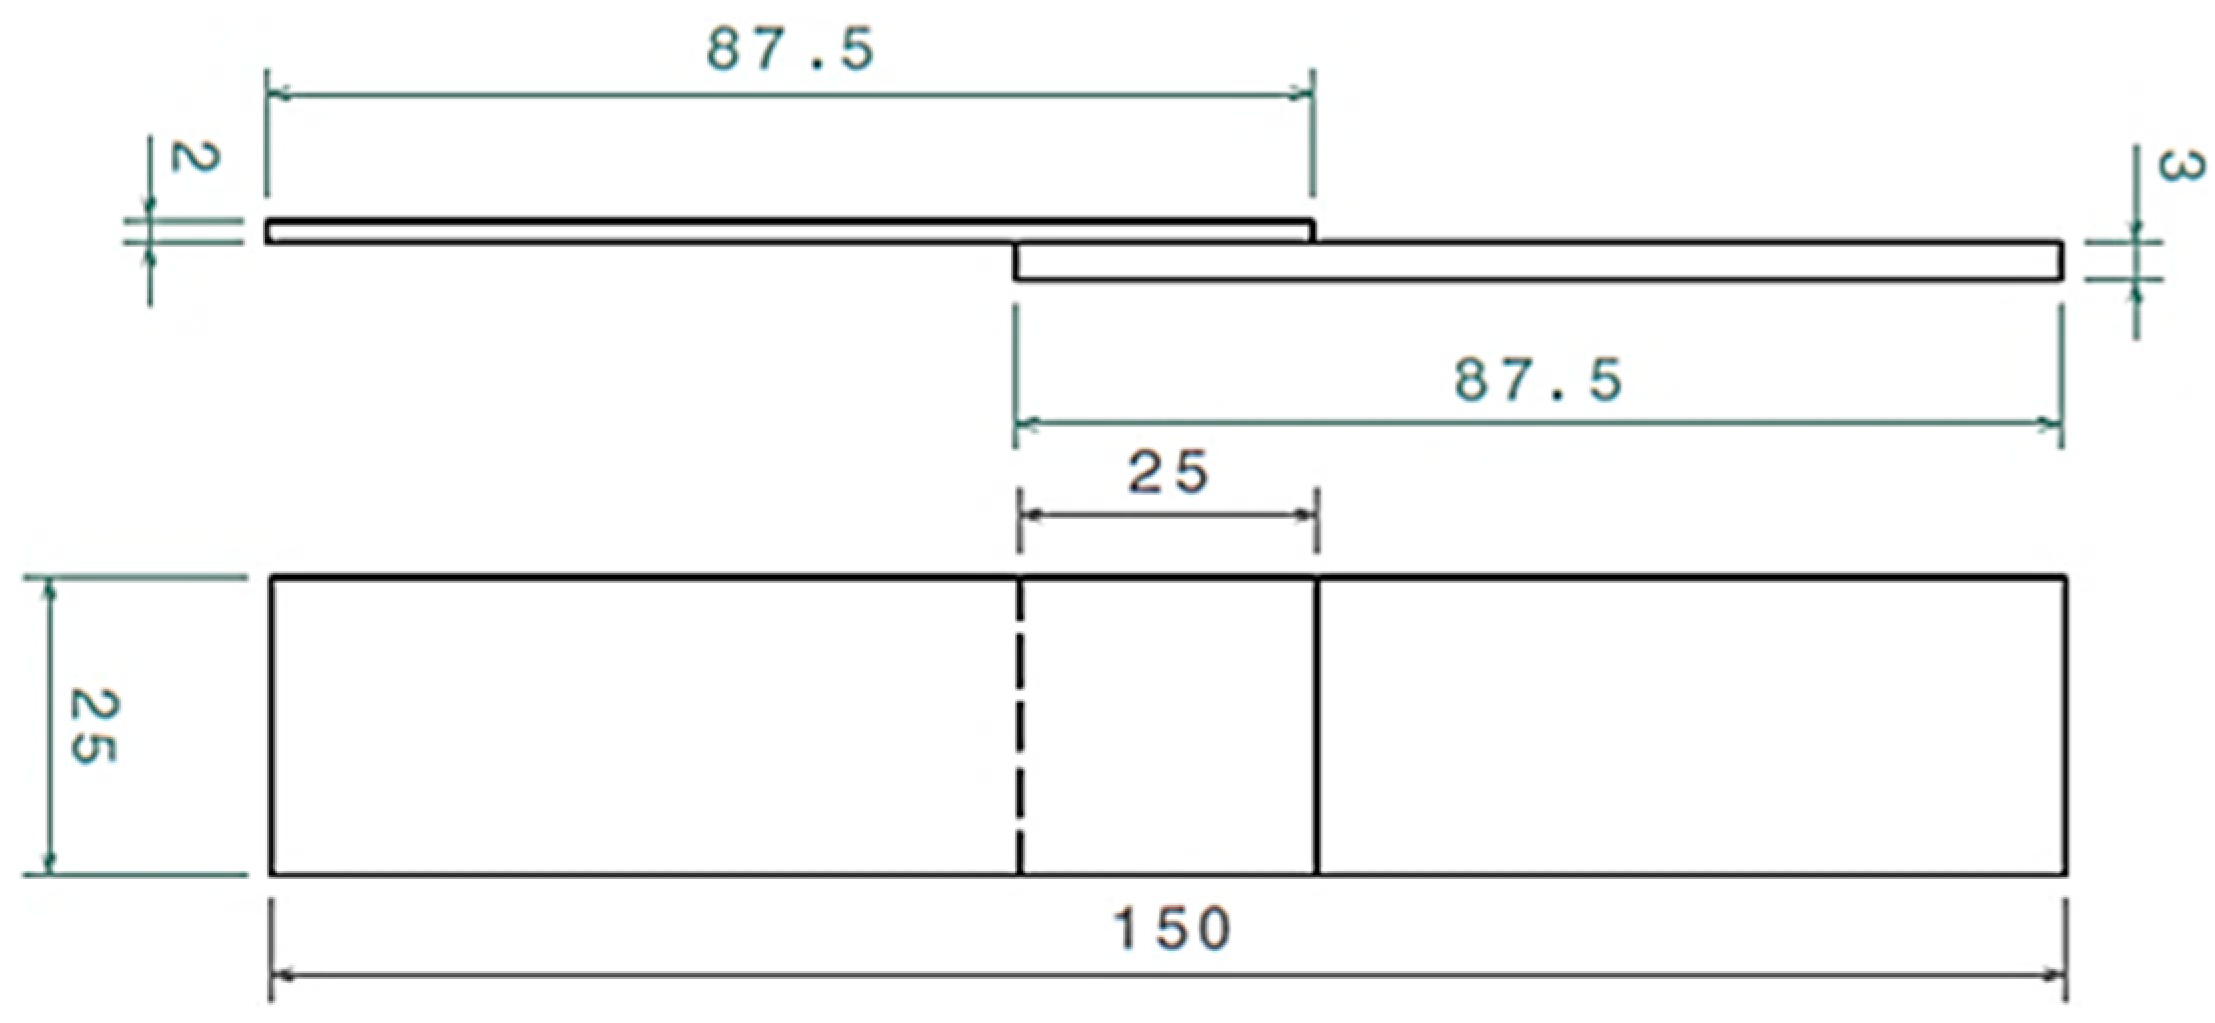
2. Materials and Methods
3. Results and Discussion
3.1. Tensile Behaviour of the Welded Joint
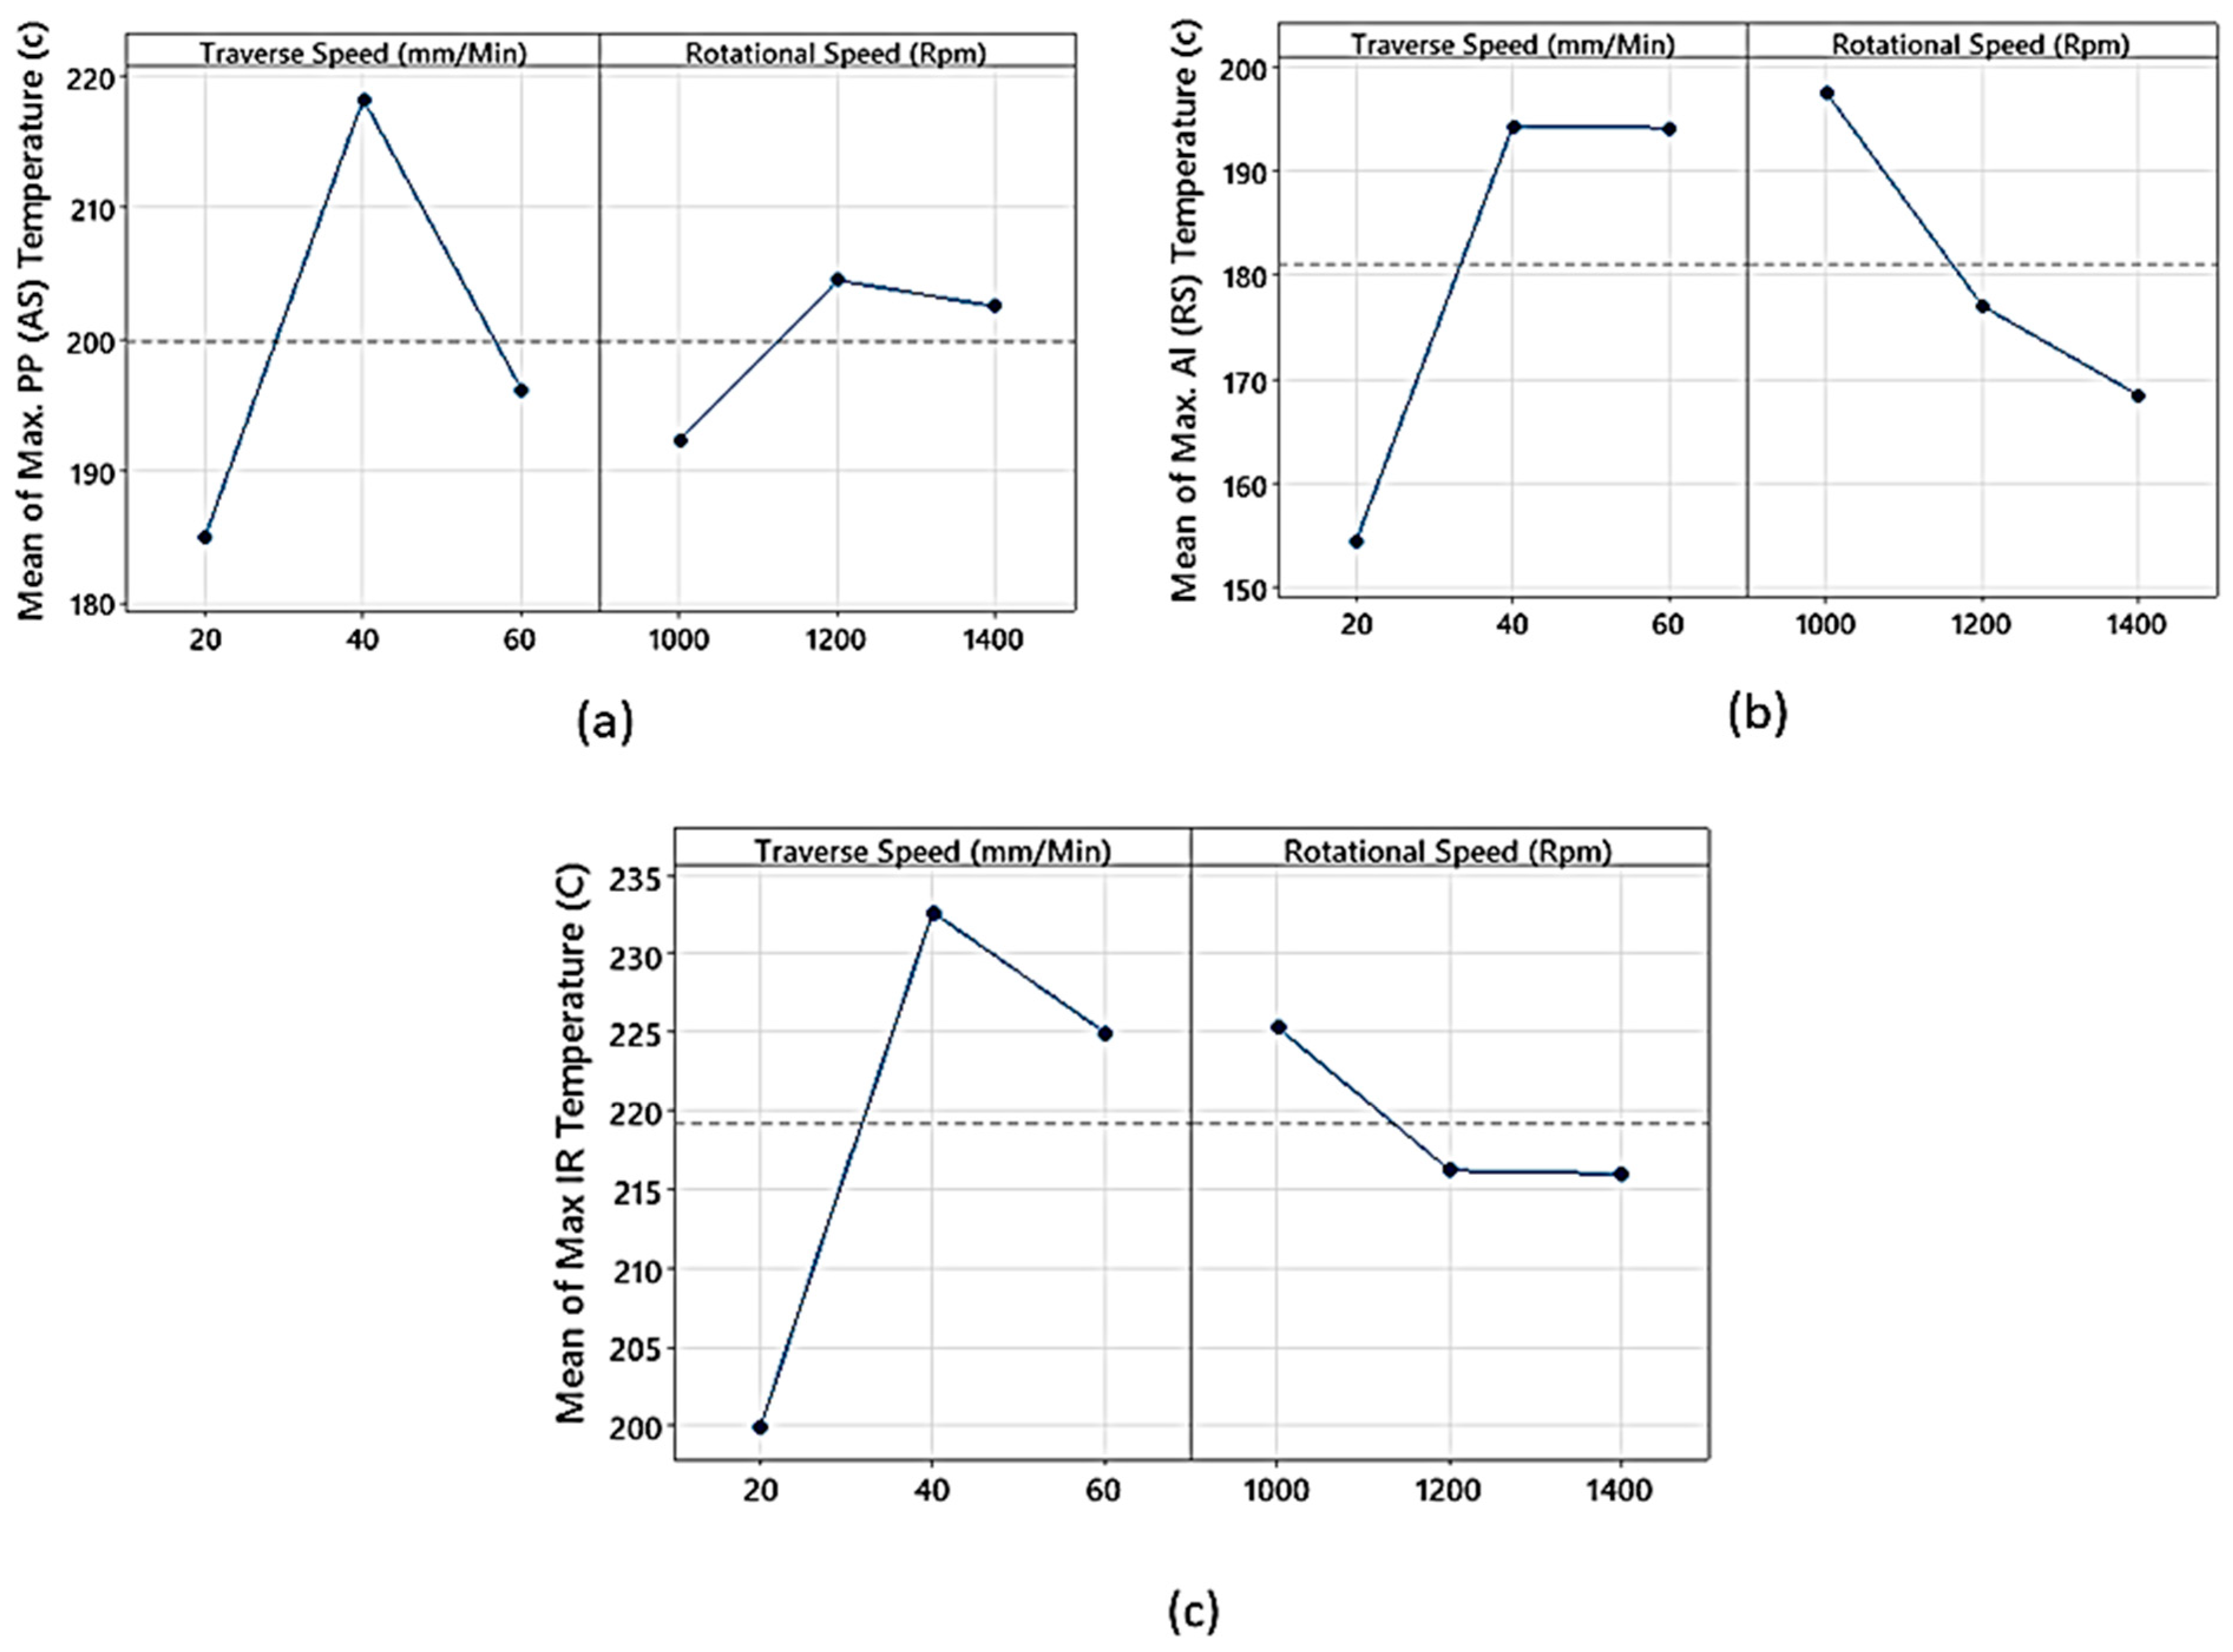
3.2. Process Temperatures and Its Relationship with Joint Strength
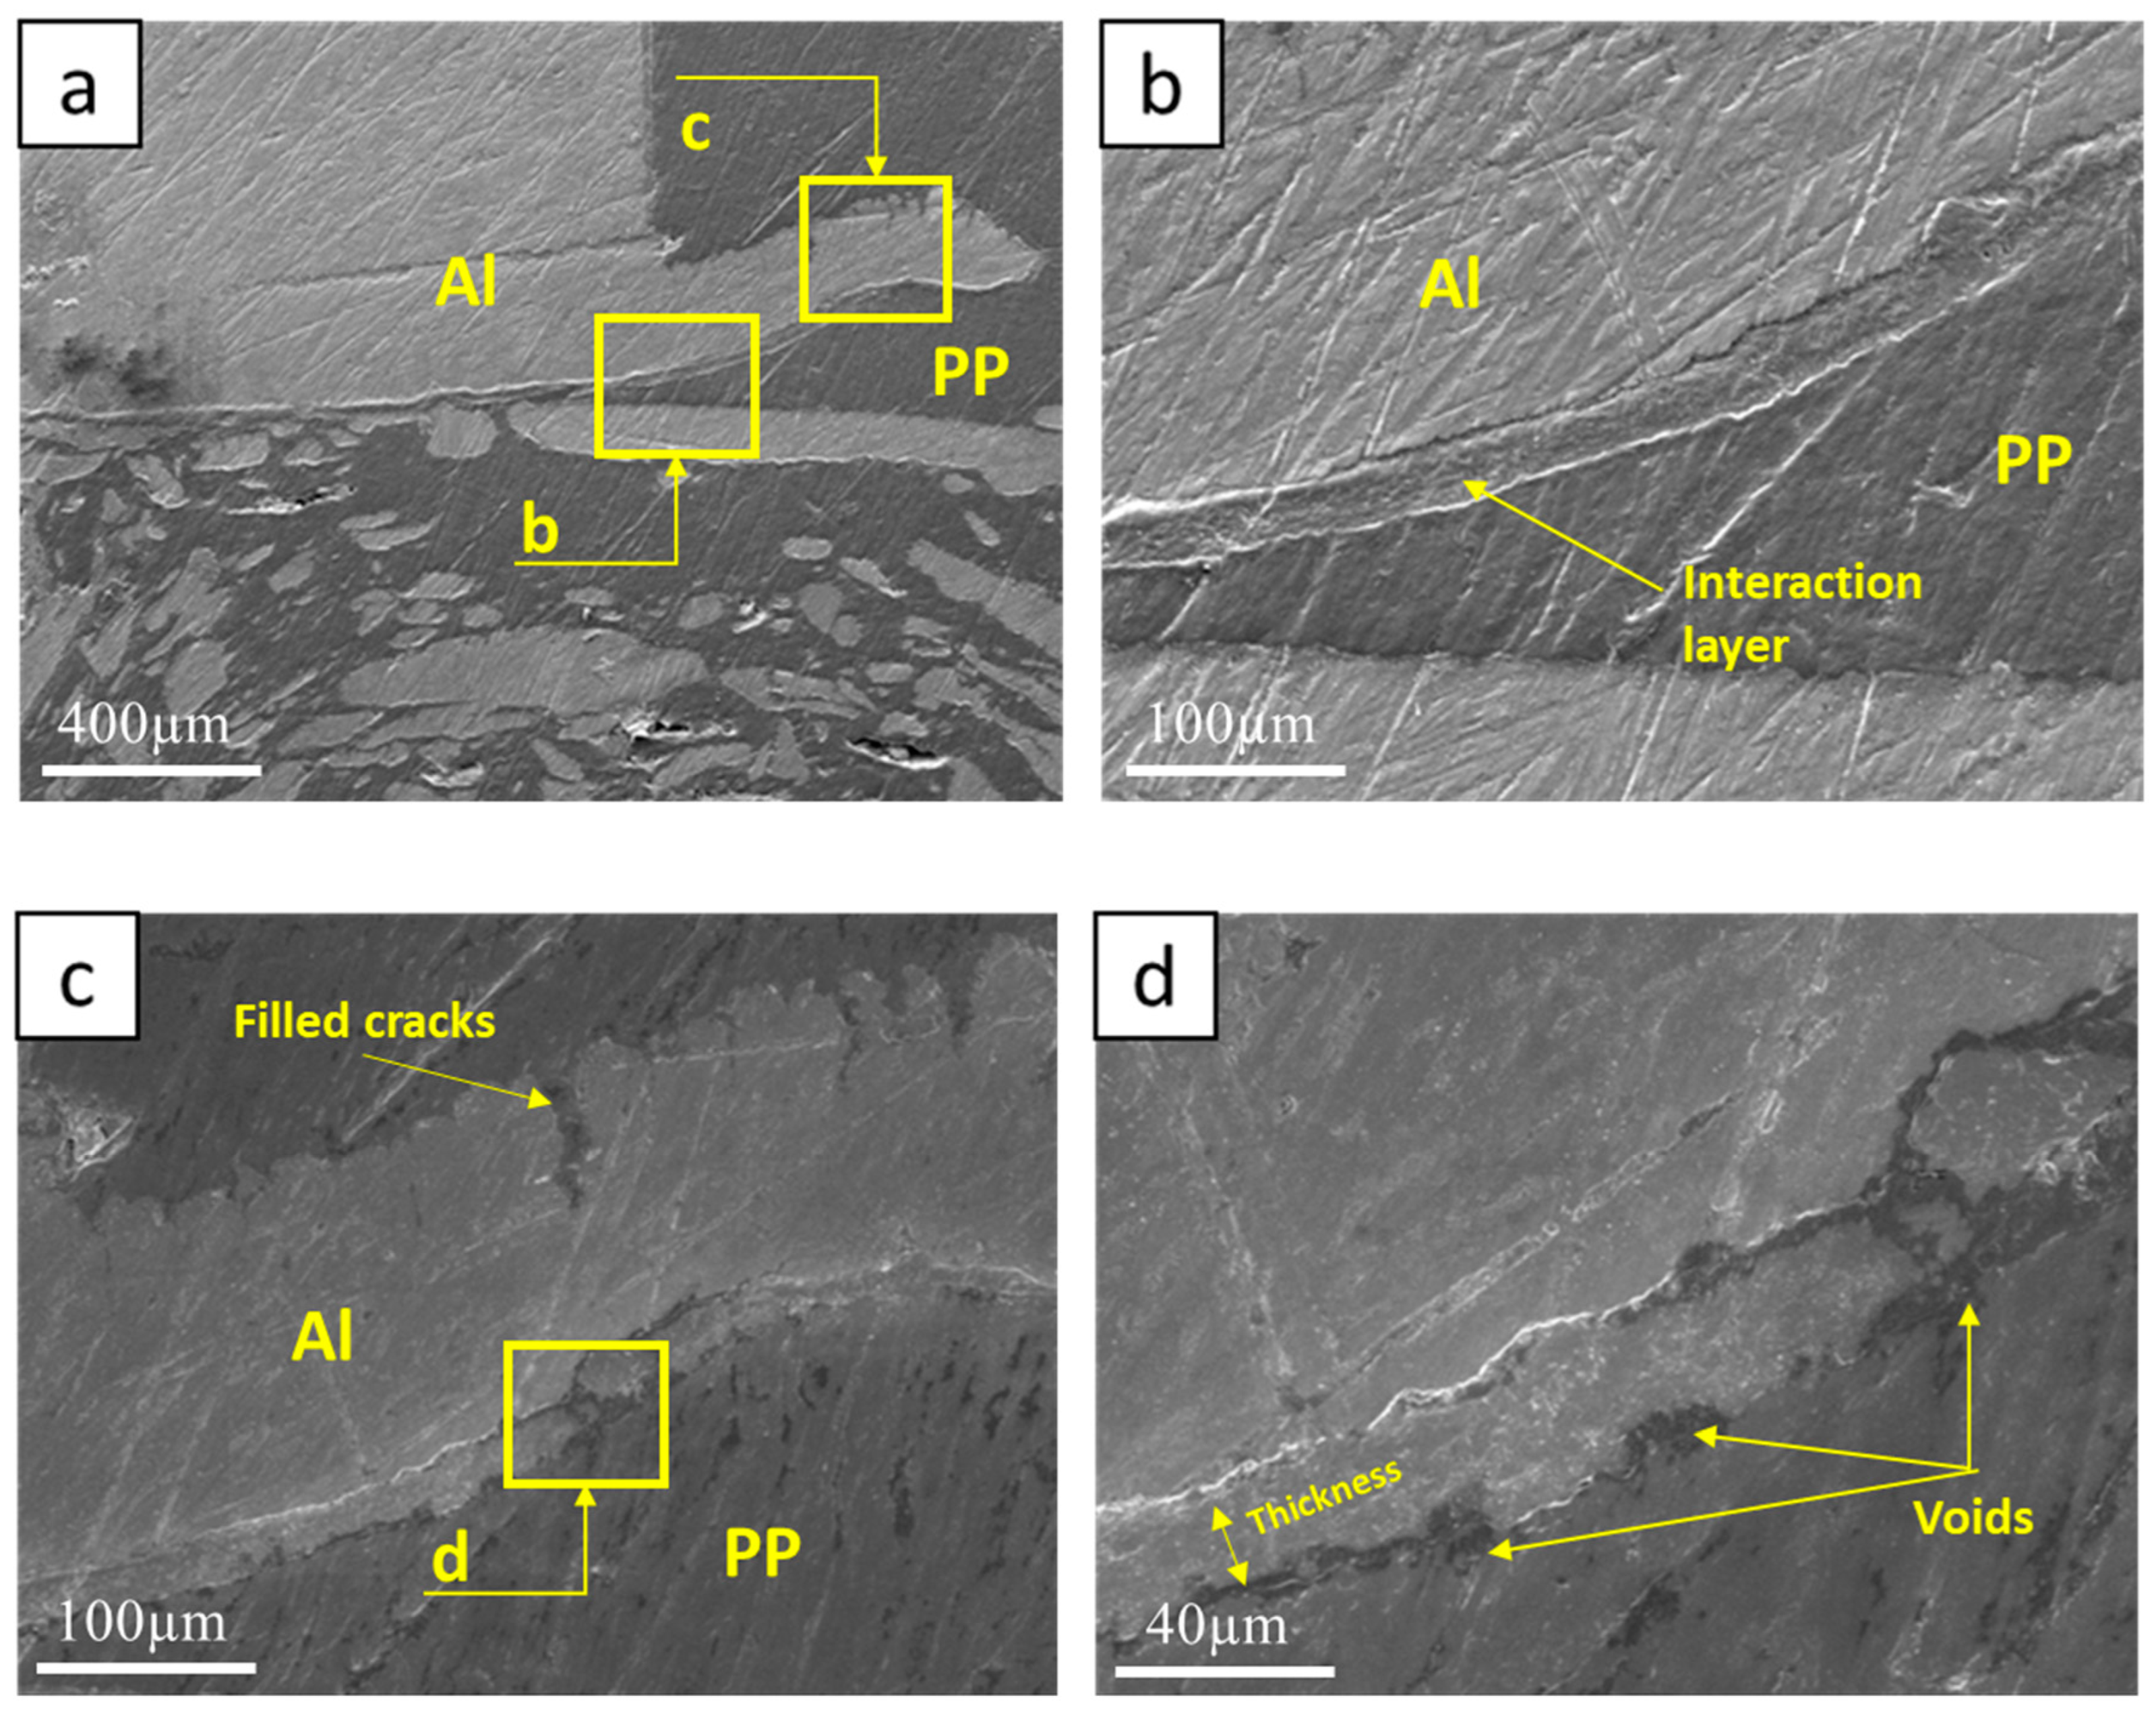
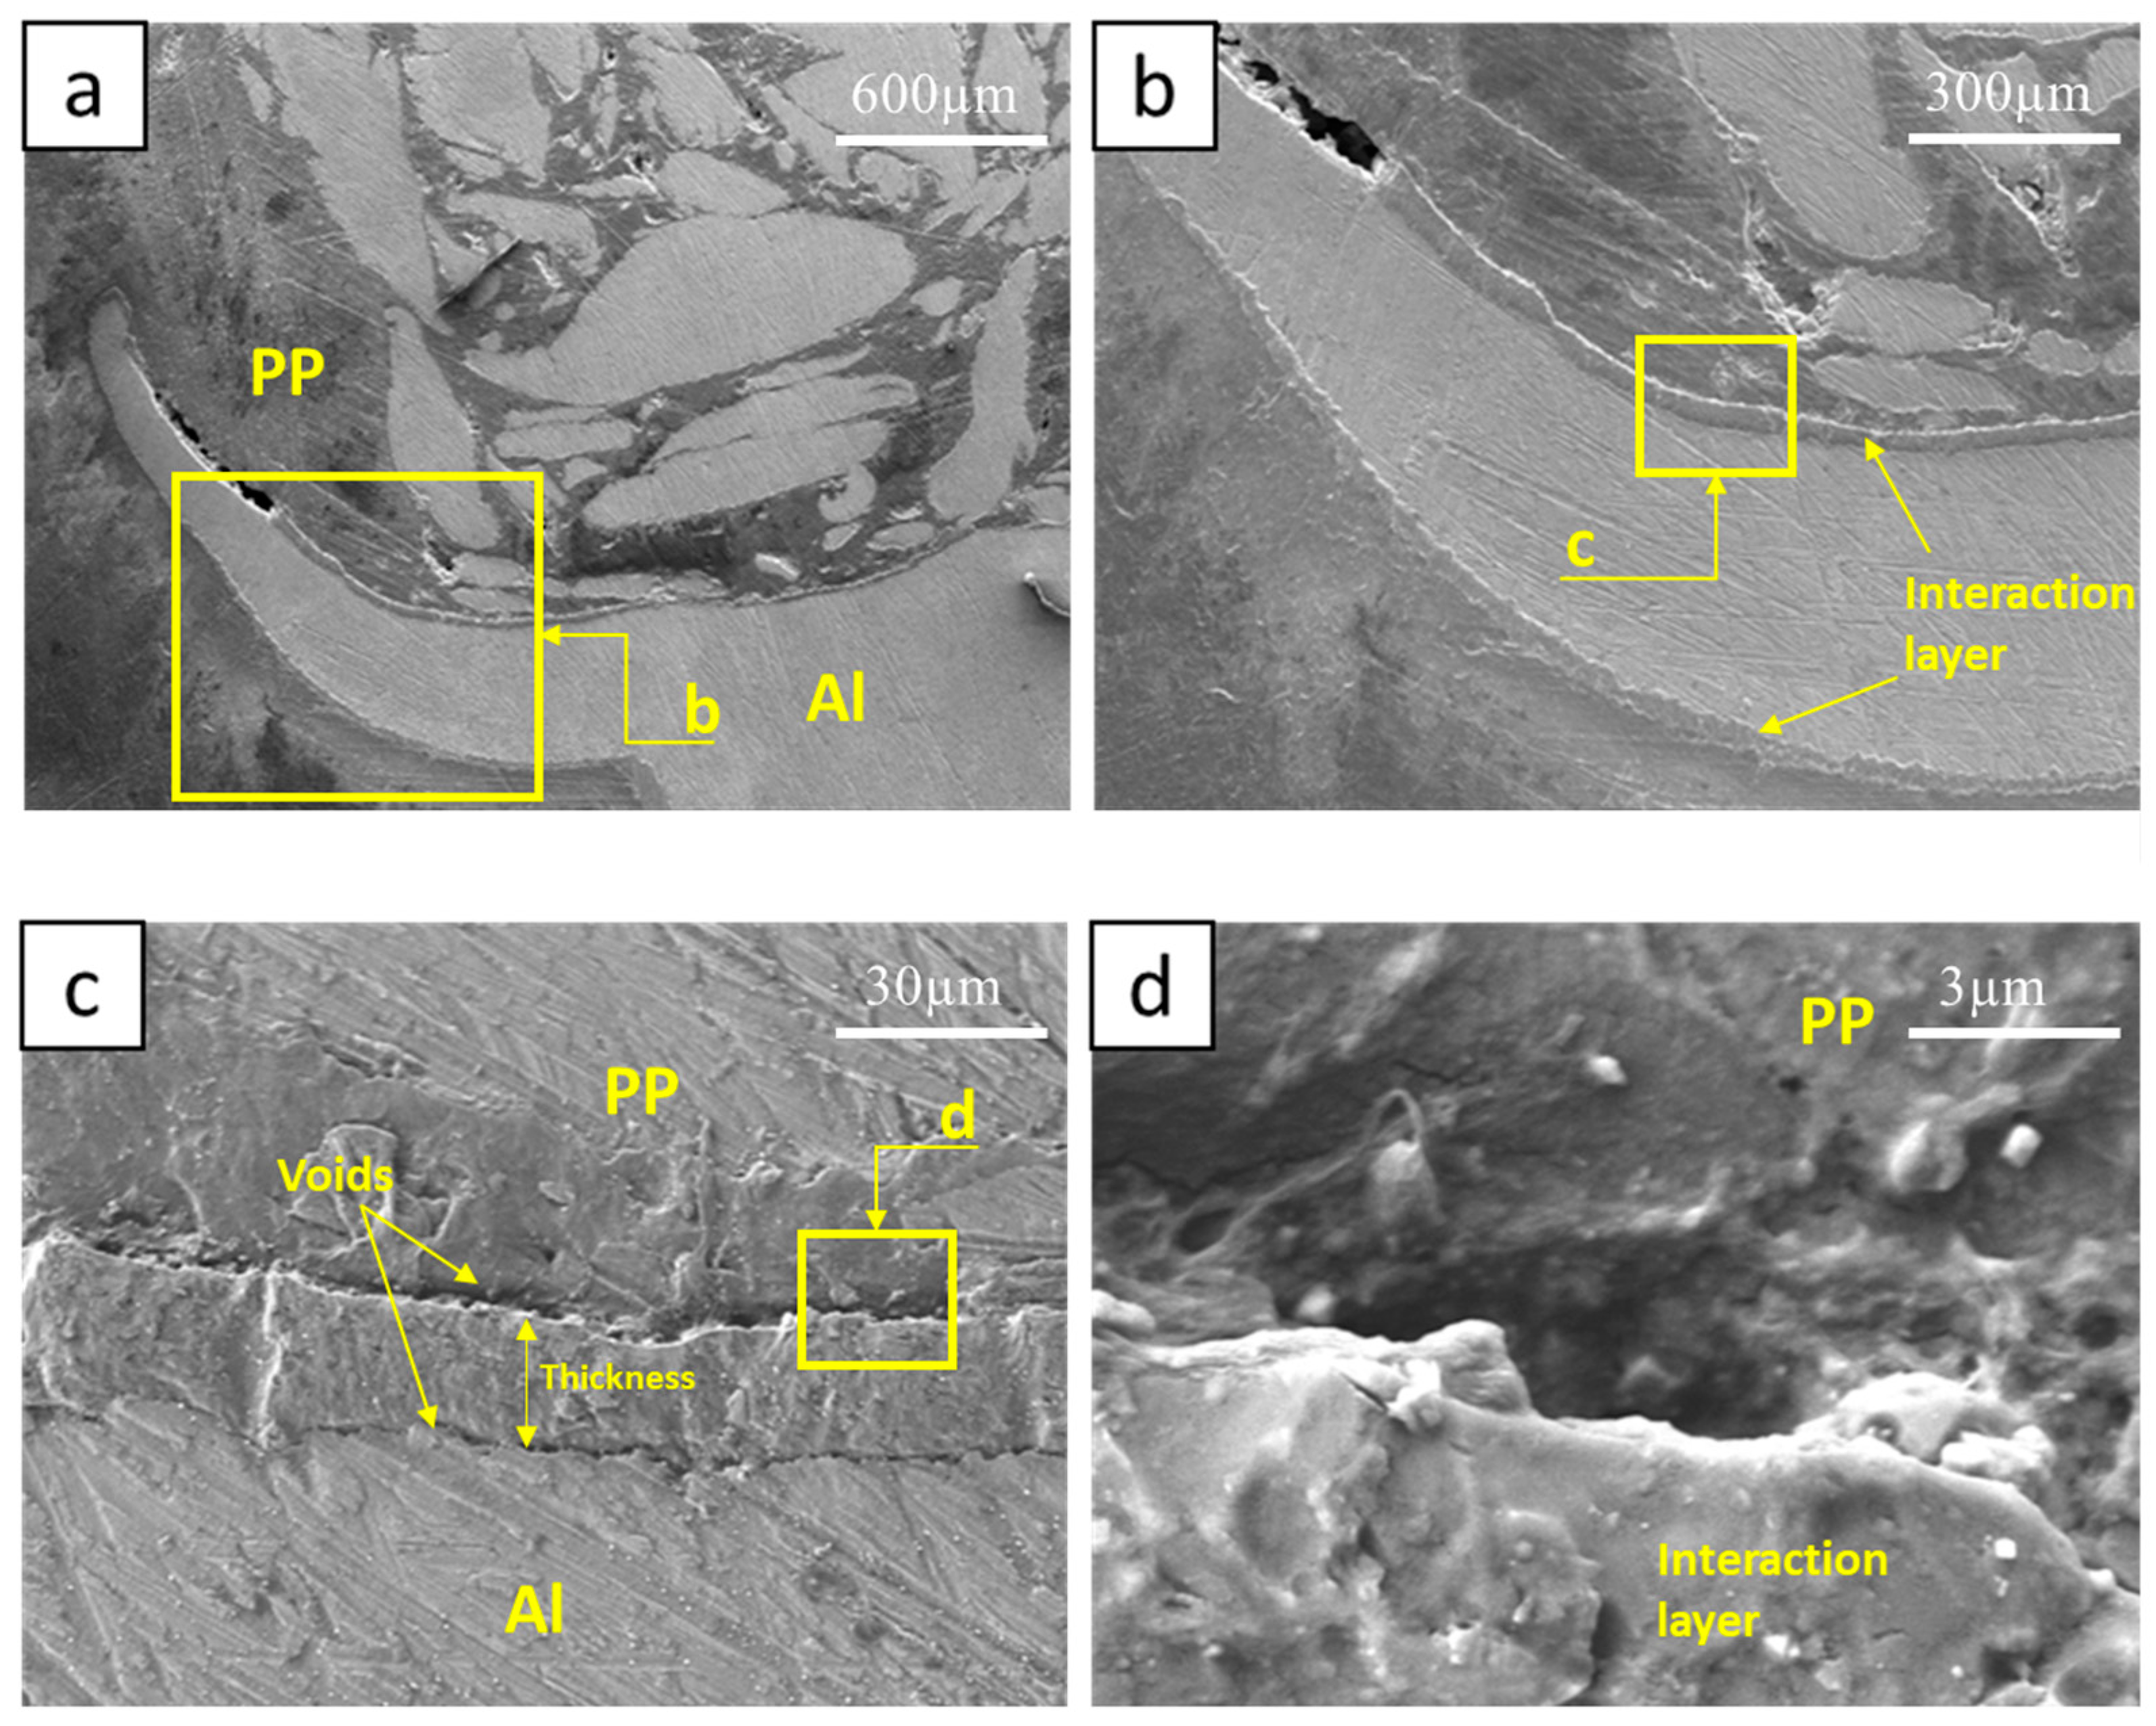
3.3. Joint Morphology
3.4. Process Temperatures and Its Relationship to Material Flow

| ) | Description |
|---|---|
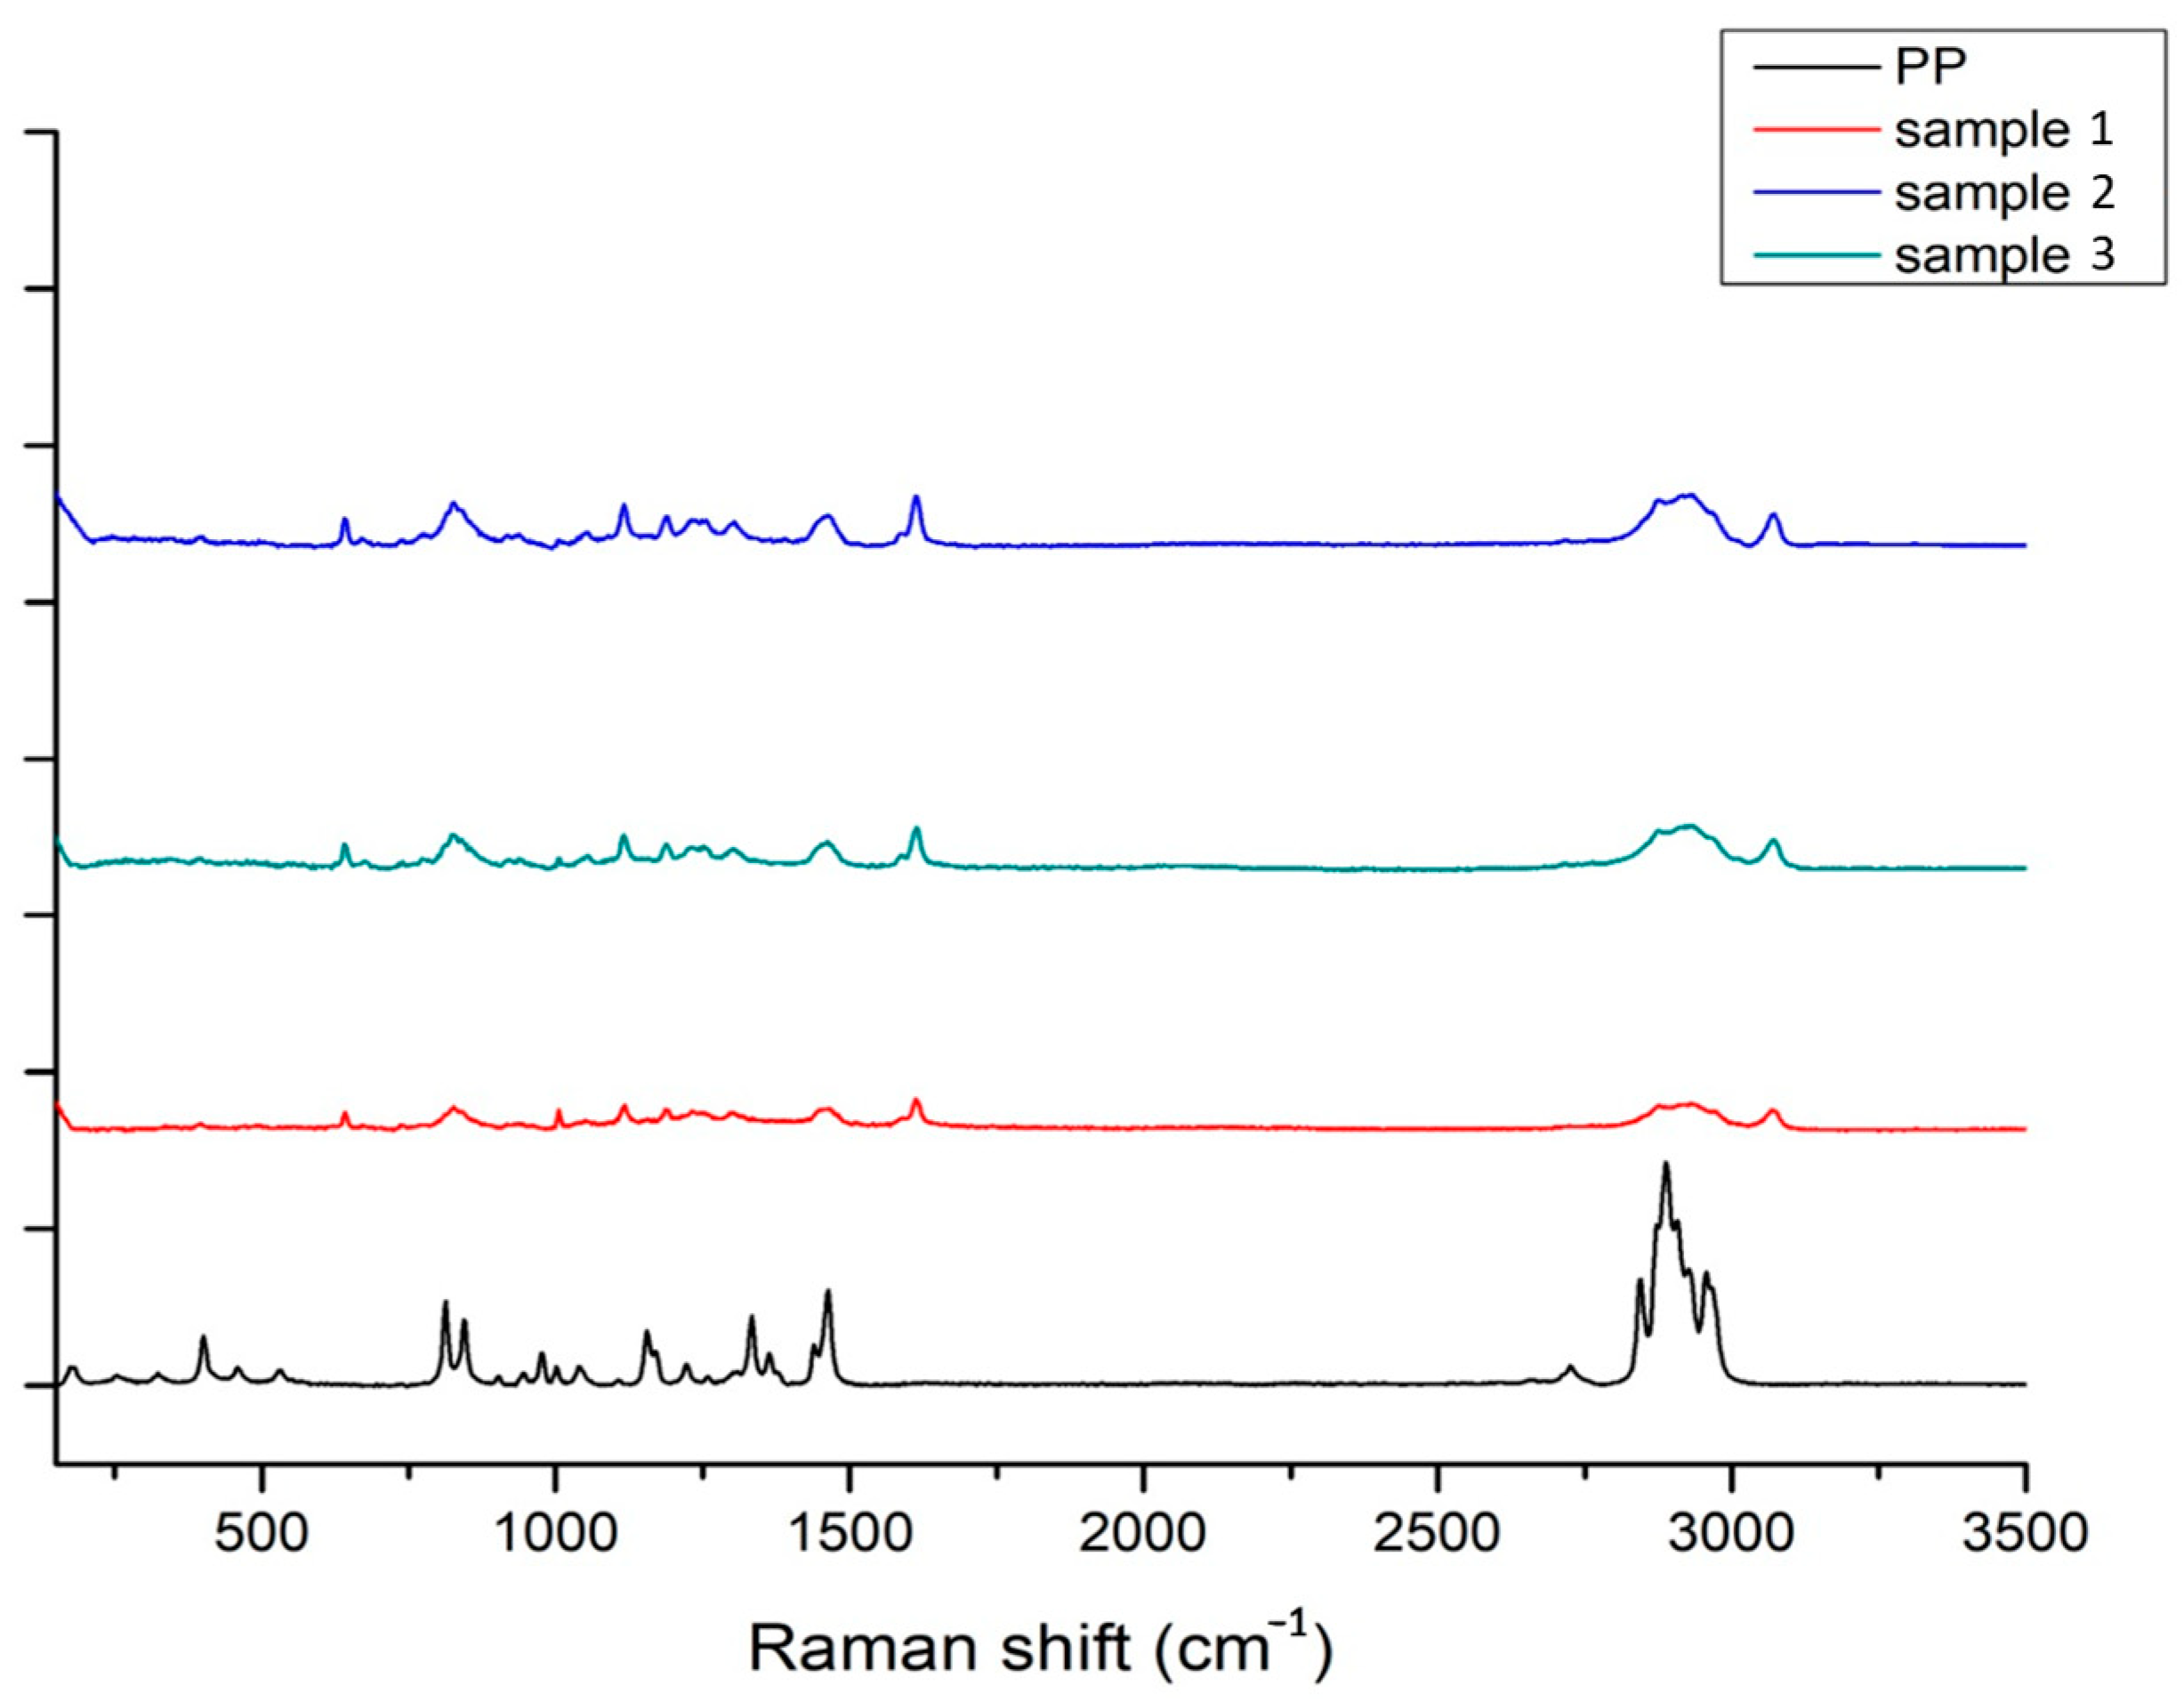
| 200–800 | Most of the peaks are related to the alloy. The changes offer information about the bonding, interaction, and oxide formation adhesion on the alloy [40] |
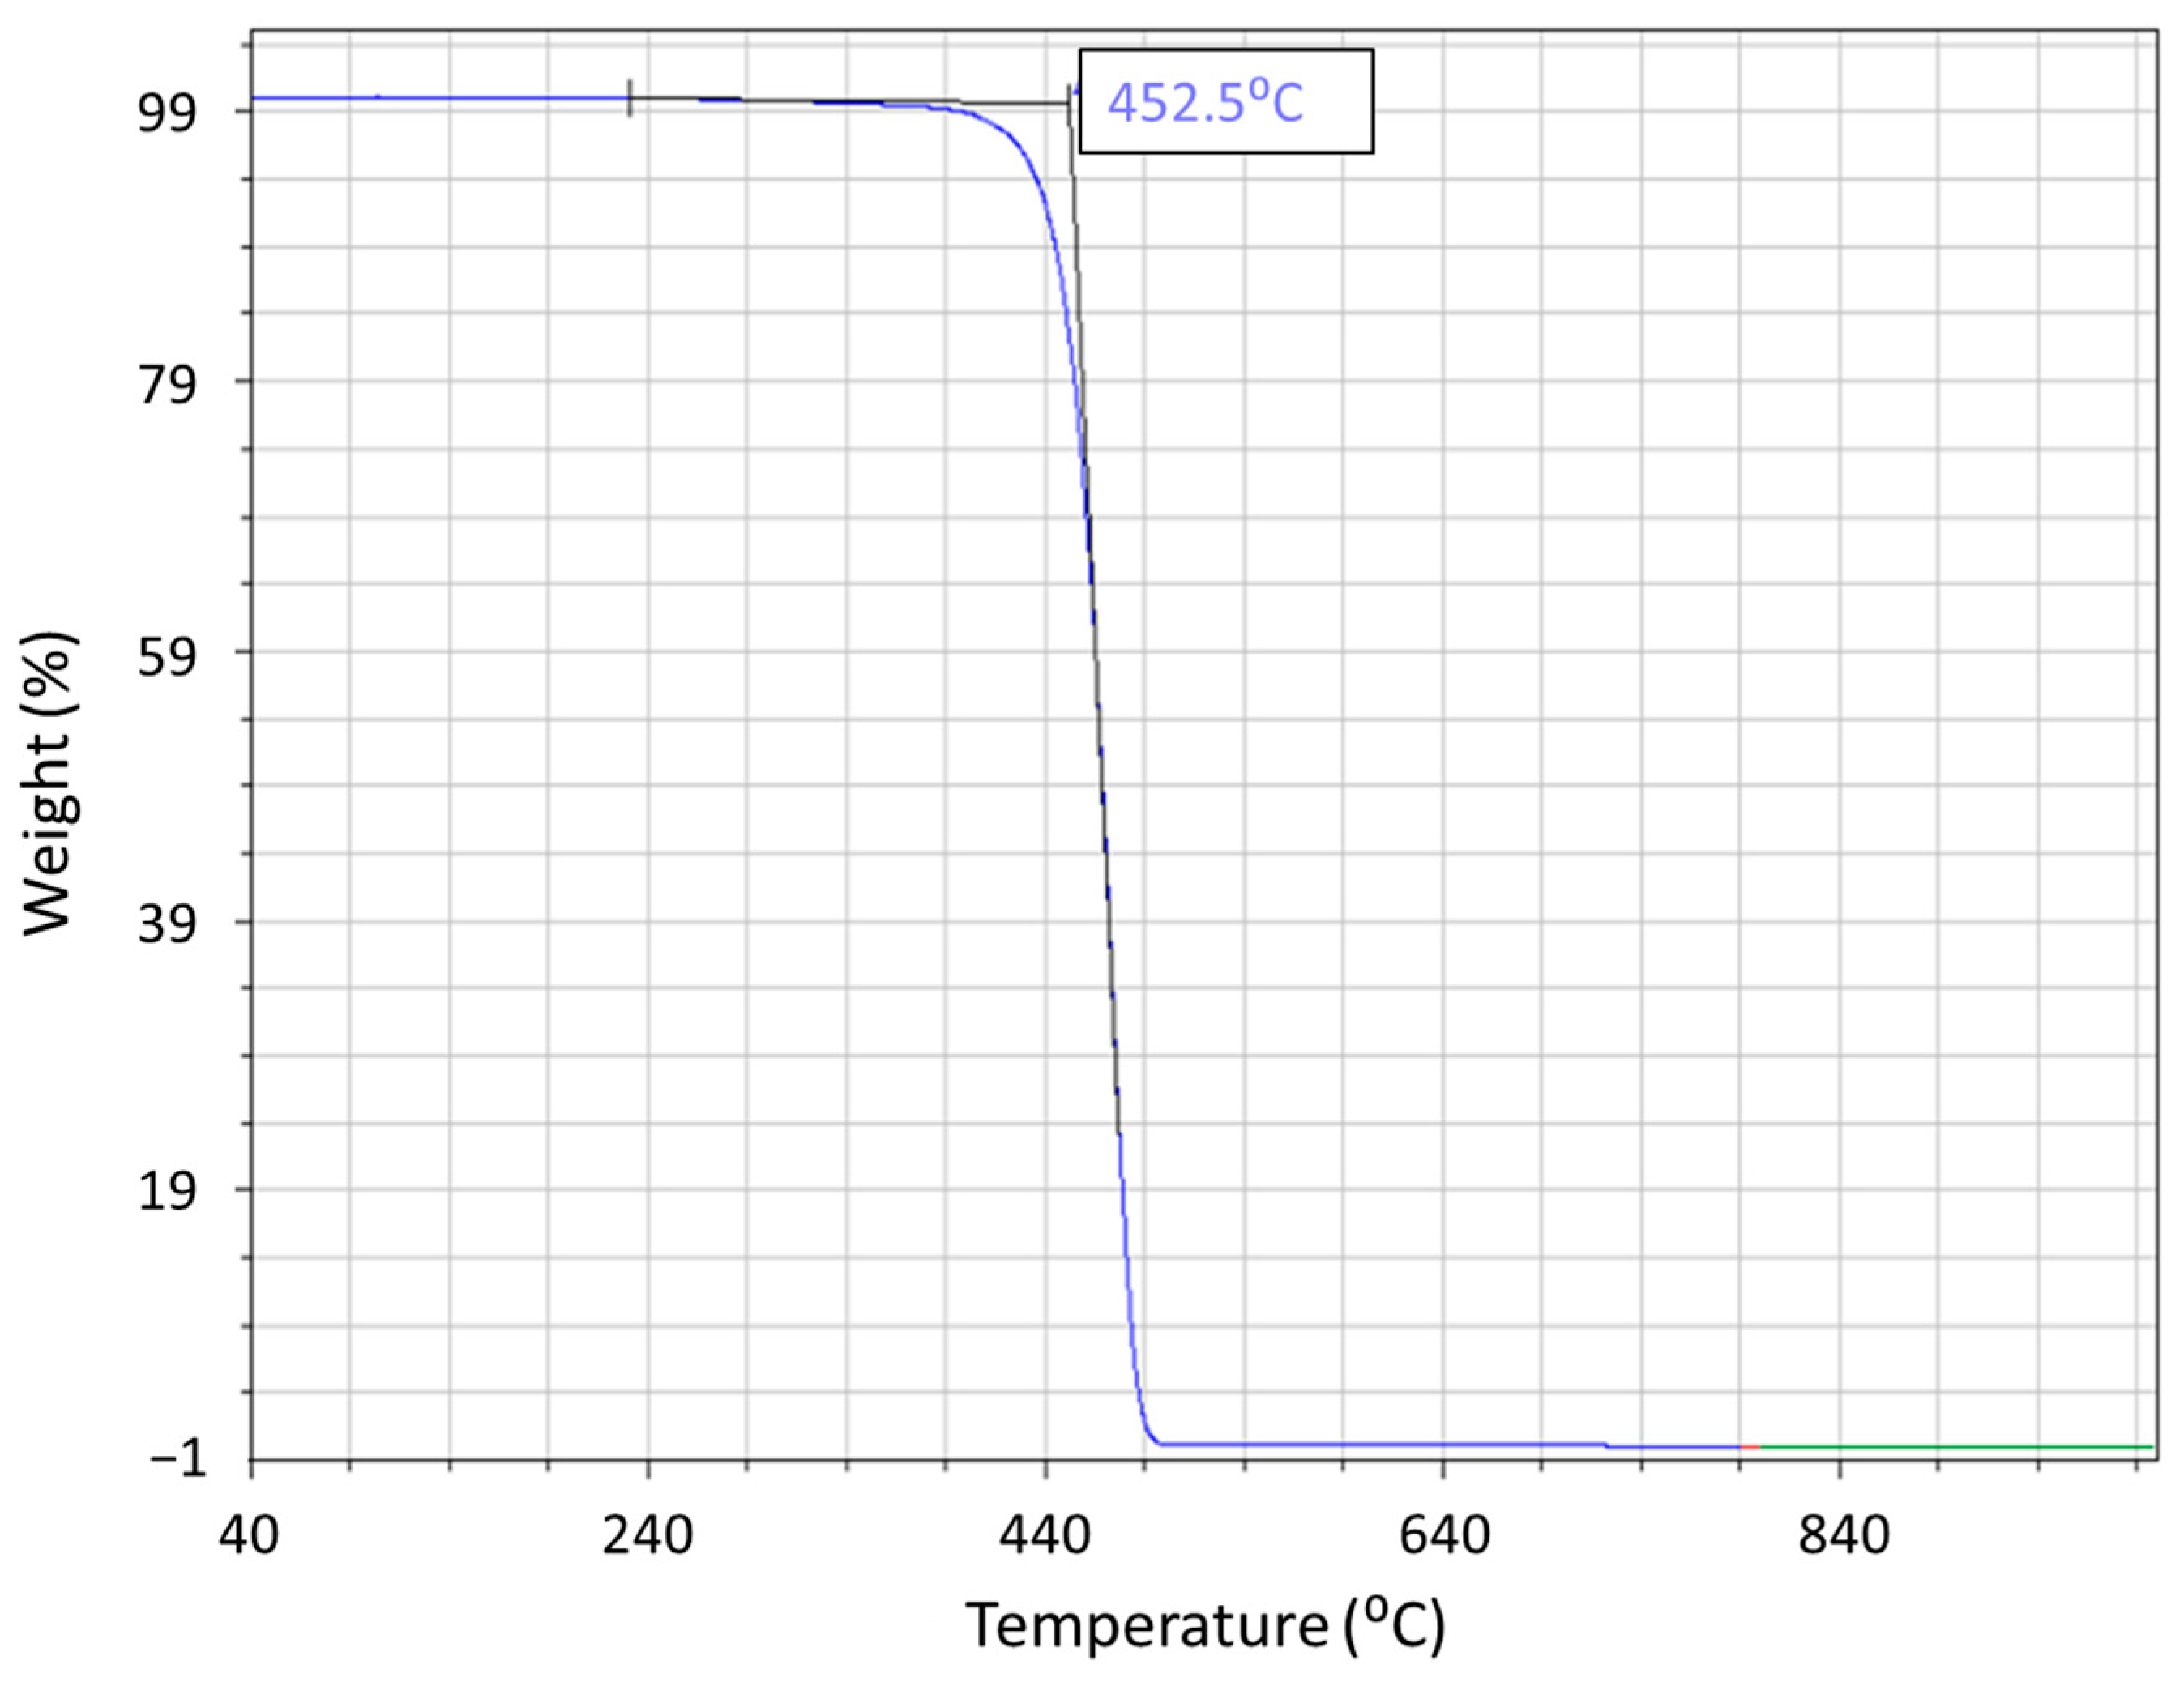
| 800–900 | Changes offer insights into the thermal stability of polypropylene and its degree of degradation [41] |
| 900–1000 | C-C stretching mode which is sensitive to the degree of crystallinity in the polymer [31] |
| 1300–1550 | Mainly corresponds to C-H deformation vibrations [32]. |
| 1300–1460 | deformation modes and bending modes |
| 1460–1550 | Aromatic ring stretching mode in the polypropylene molecule. |
| 2850–3000 | The symmetric and asymmetric stretching modes: sensitive to the degree of crystallinity in the polymer. |
4. Conclusions
- Efficacy of Novel Tool Design: The novel tapered fluted pin tool design demonstrated its effectiveness in this study. Its unique configuration enabled successful penetration of the AA5052 alloy, establishing a solid foundation for the welding process and ensuring a commendable weld initiation.
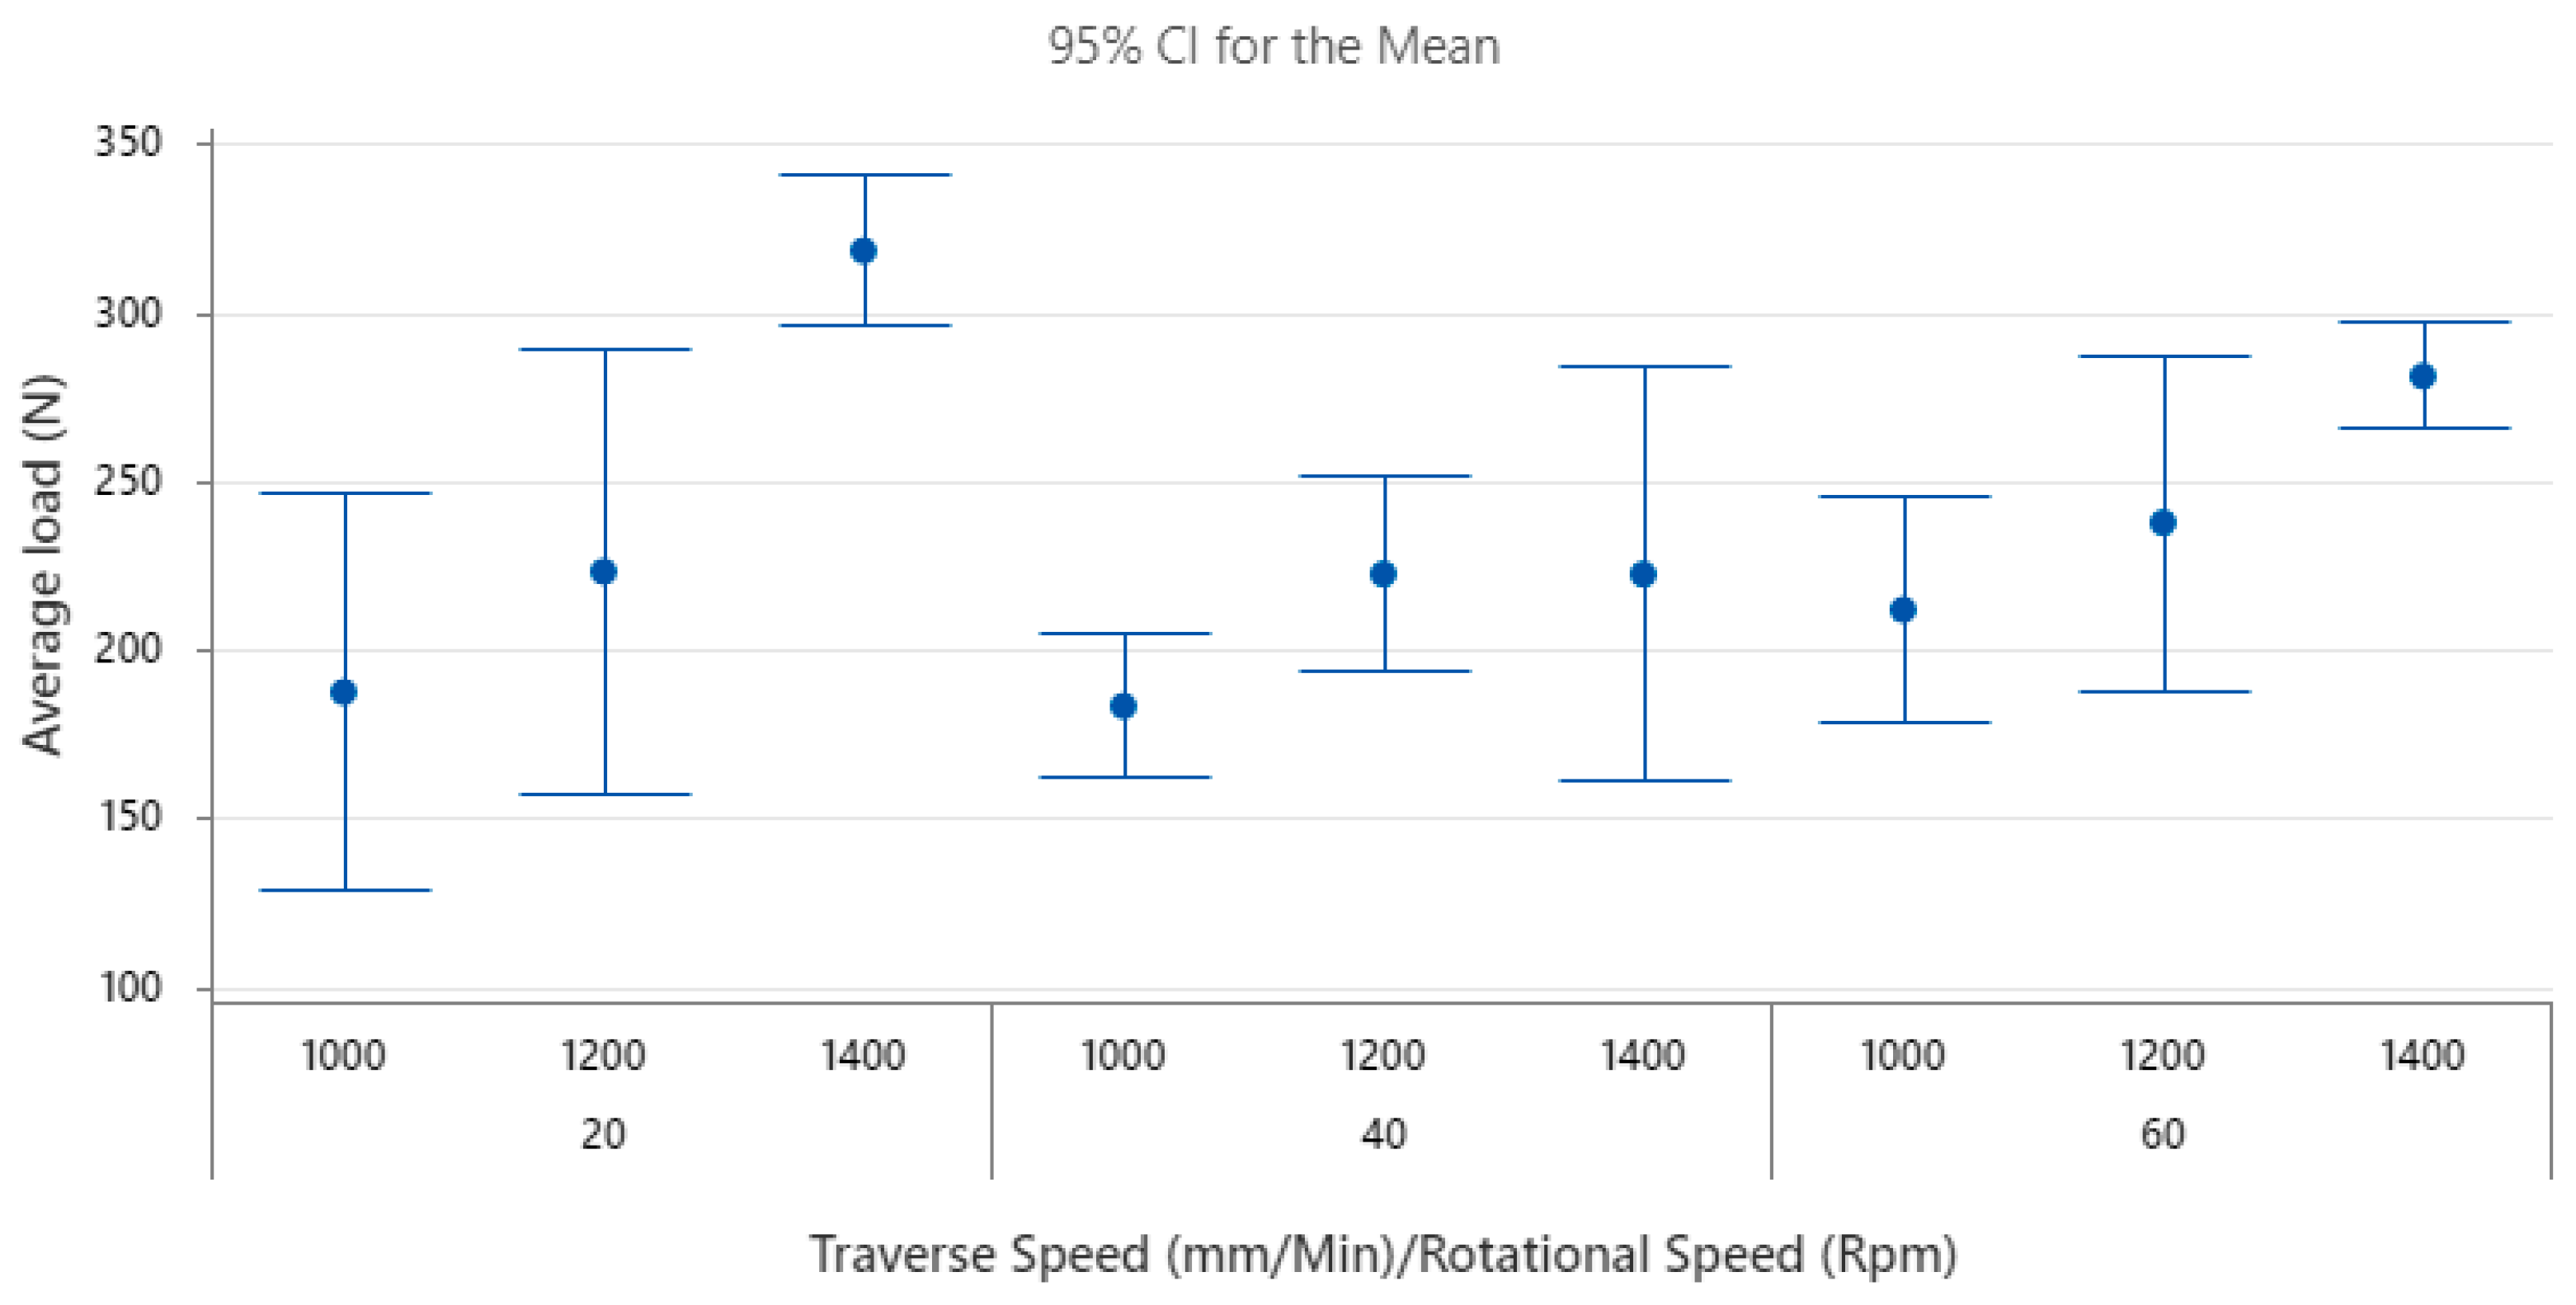
- Optimal Process Parameters: The most favourable conditions for joining AA5052 and PP, using the novel tapered fluted pin, are realised with a rotational speed of 1400 RPM and a traverse speed of 20 mm/min. Under these conditions, the joint exhibited a load of 336 N and achieved a tensile strength of 3.8 MPa. In relative terms, this strength corresponds to 16.54% of the weak material’s inherent strength. To put this in perspective, other studies noted joint strengths of 2.9 MPa for AA5052-H34 to PP-20%talc [26], and a relative strength of 21% when fusing 6061-T6 Al alloy with polyether ether ketone (PEEK) [10].
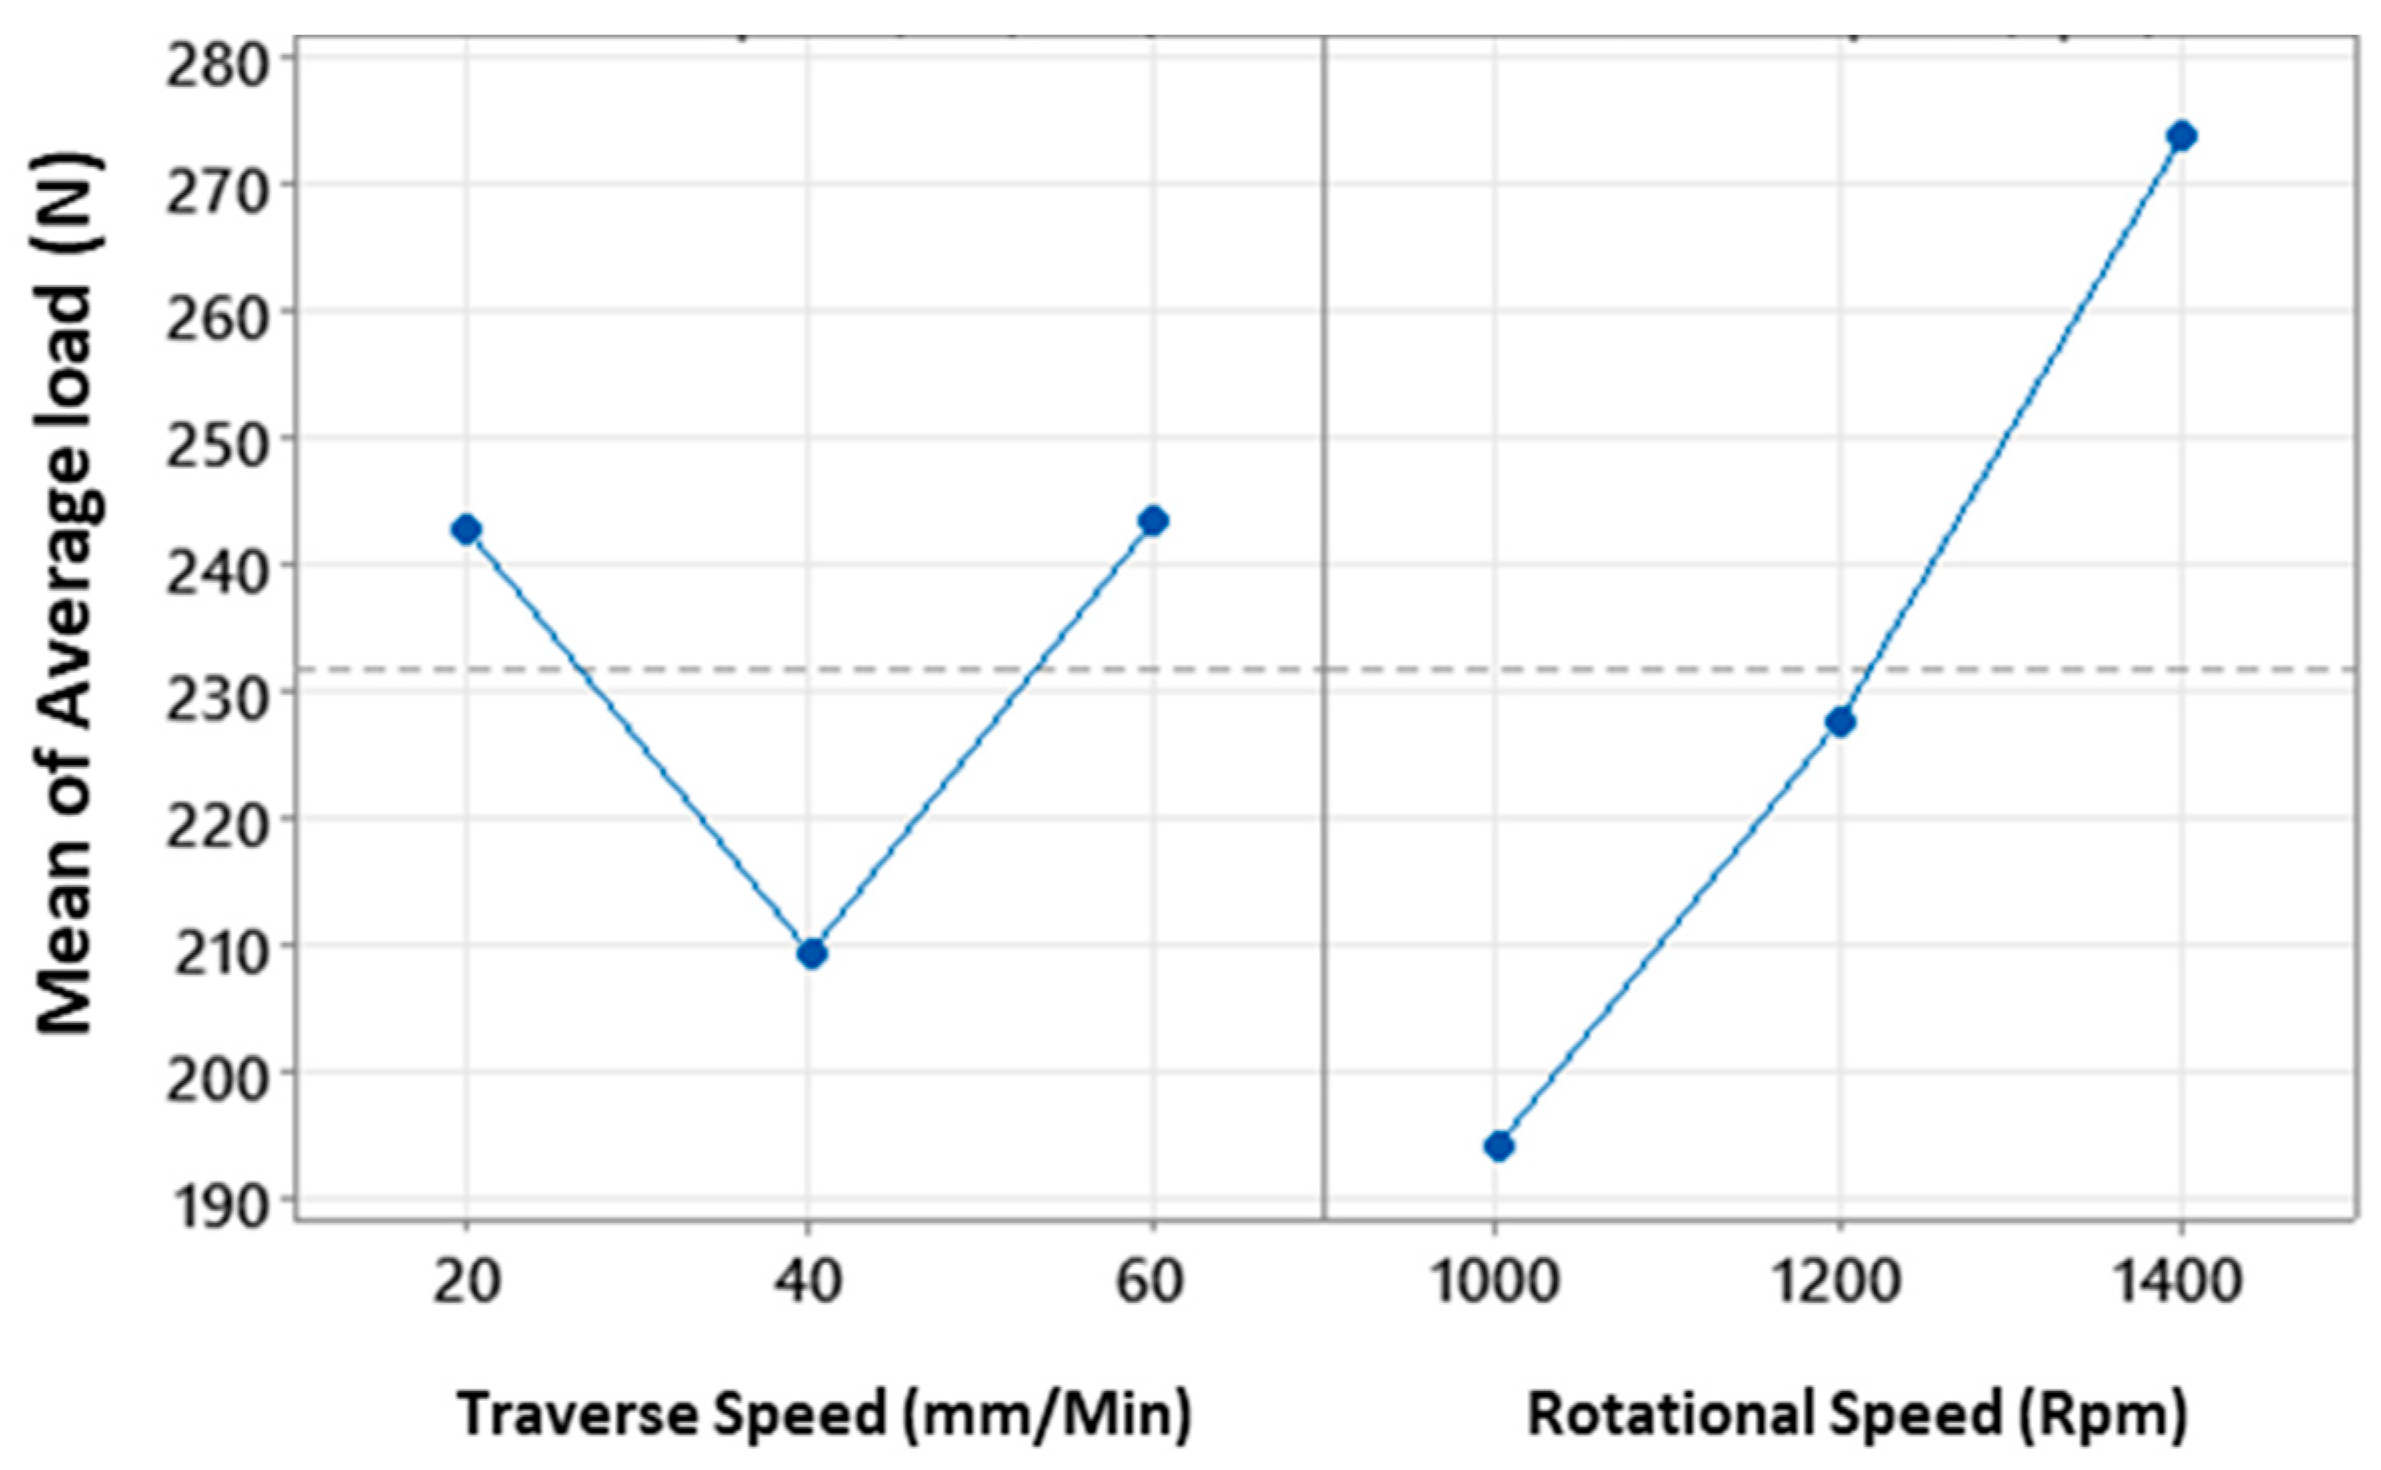
- Parameter Influence on Tensile Strength: The tensile strength of the joint is directly modulated by both rotational and traverse speeds. Notably, an increase in rotational speed positively impacts joint strength, whereas traverse speed shows a non-linear influence with an initial decrement at 40 mm/min, followed by an enhancement.
- Temperature Dynamics: The study elucidated that traverse speed affects the weld’s temperature, exhibiting a decrease after a certain threshold is reached. The rotational speed, on the other hand, demonstrated minimal influence on this parameter.
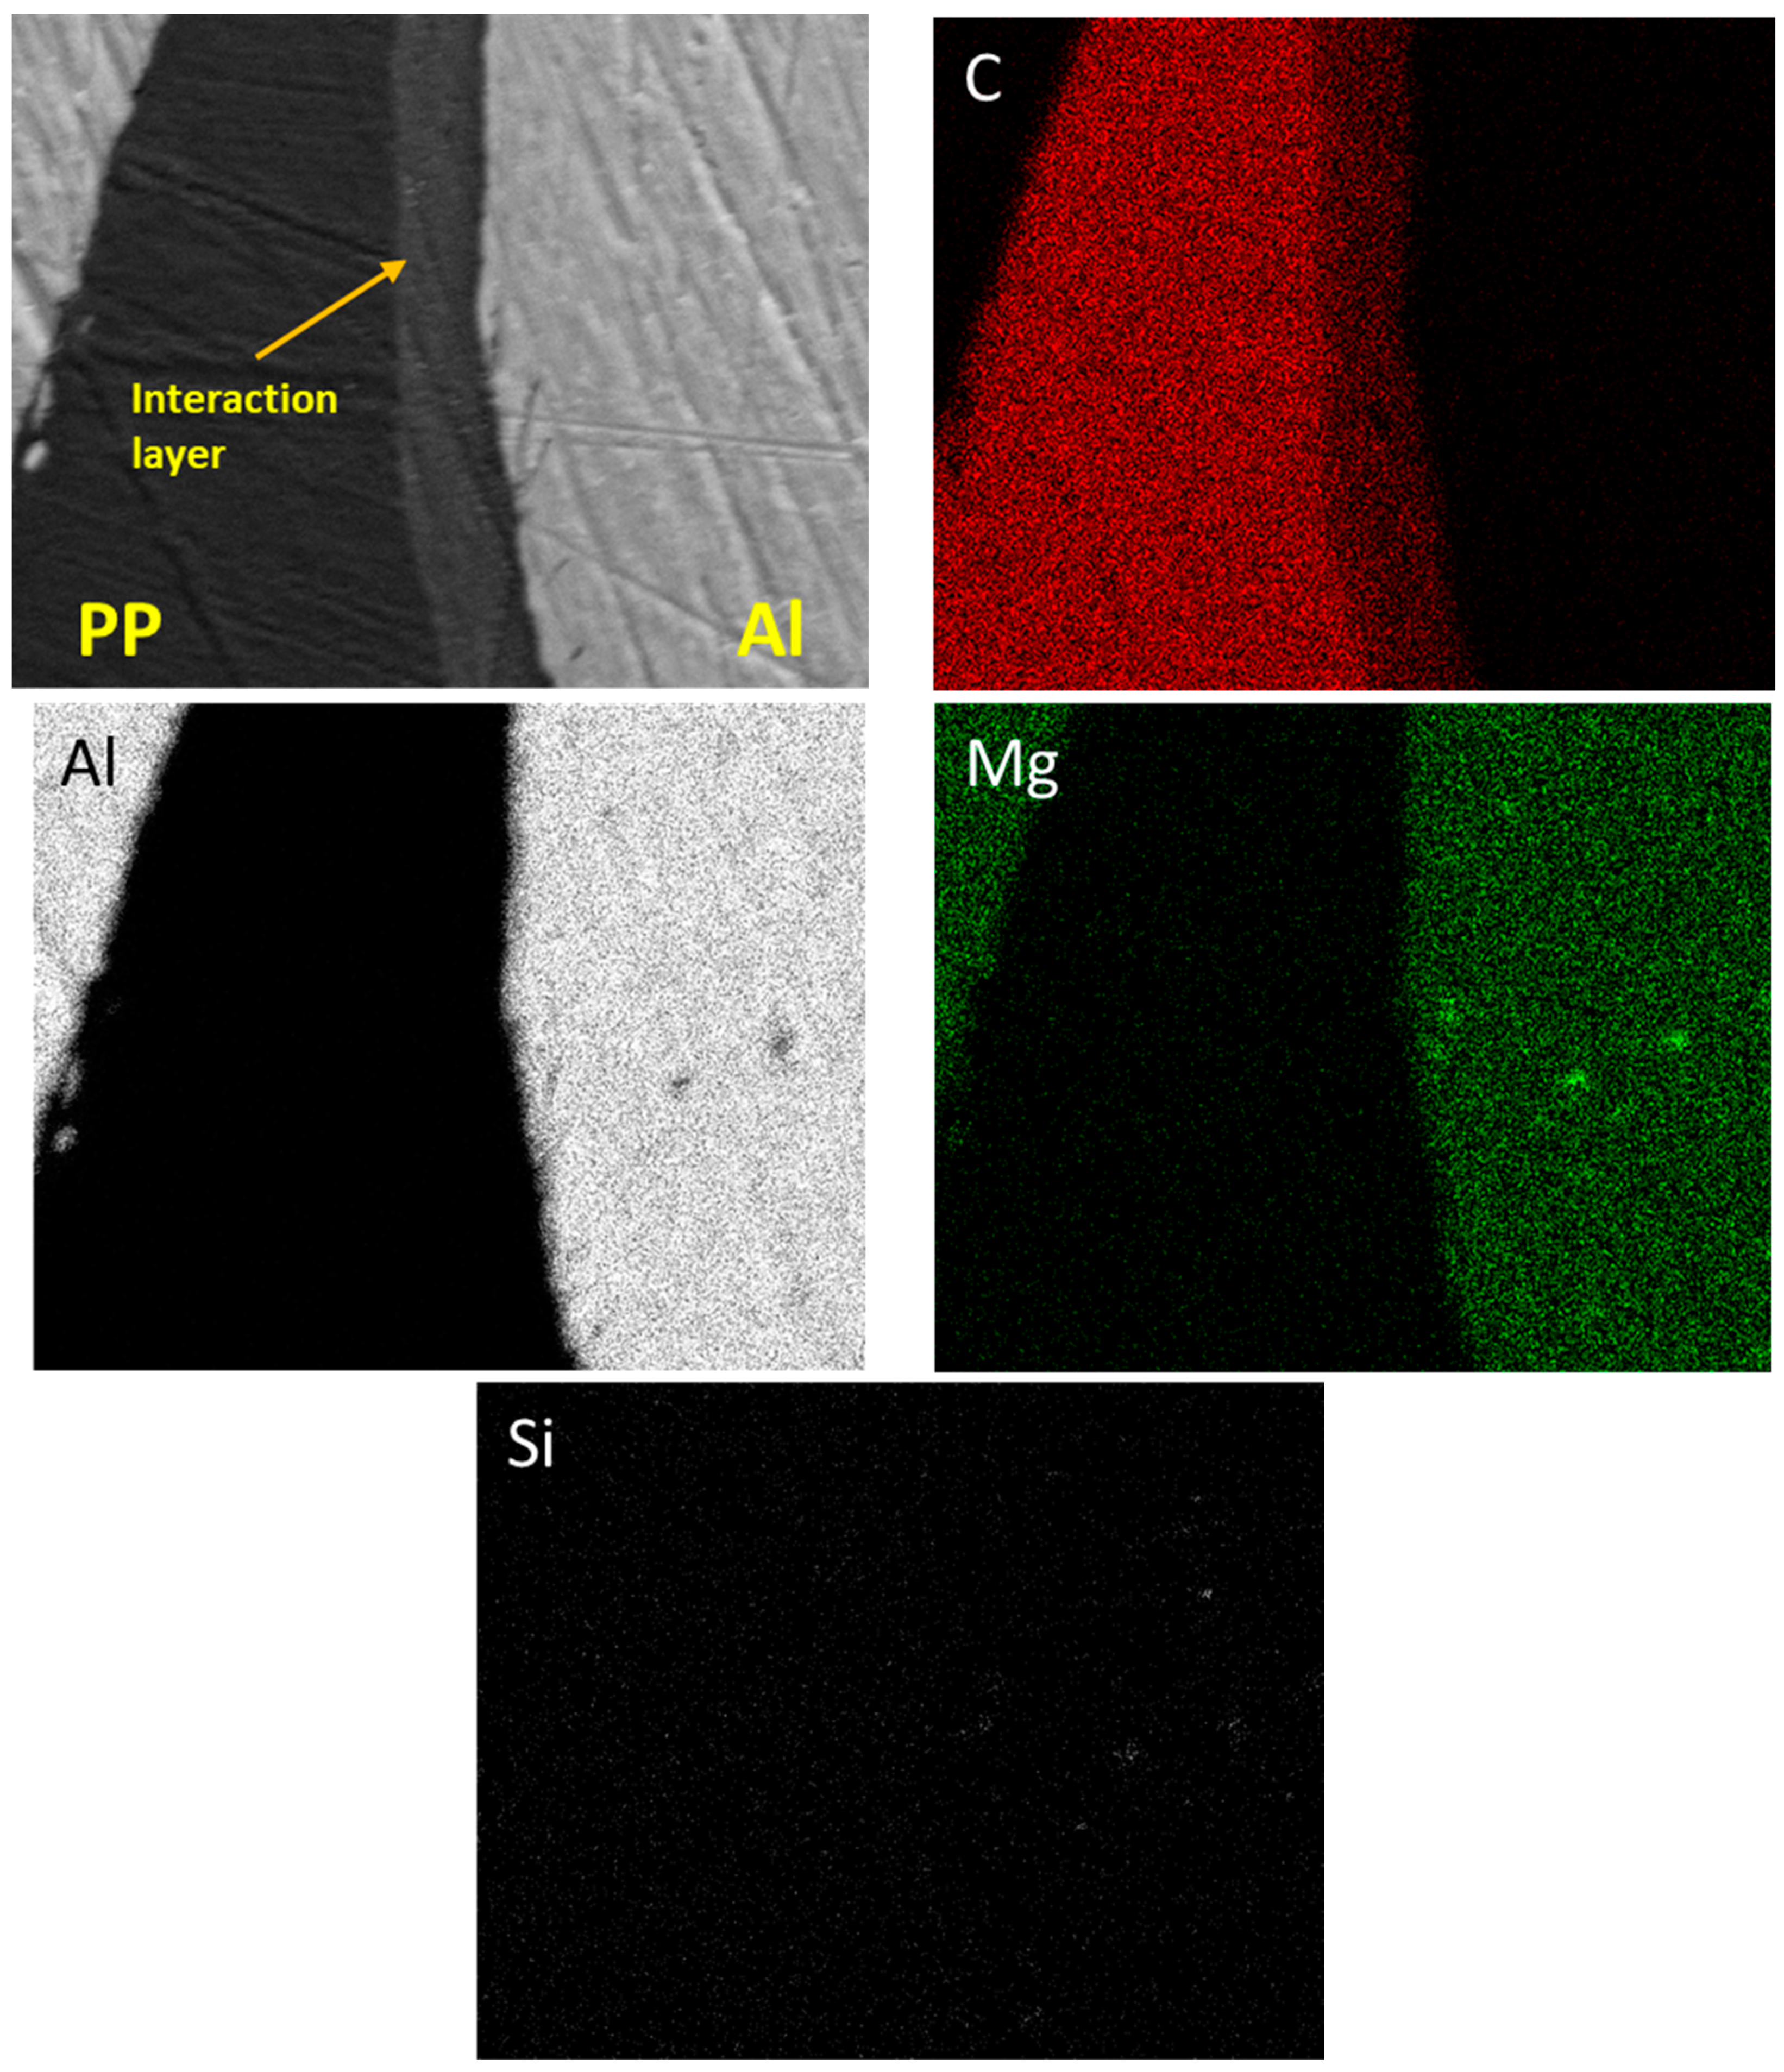
- Microstructure Insights: Microstructural analysis of the welded region revealed a composite material composed of aluminium chips and PP, reinforced by the presence of two distinct aluminium hooks. The fractures were predominantly observed to initiate at the interface of the retreating side hook.
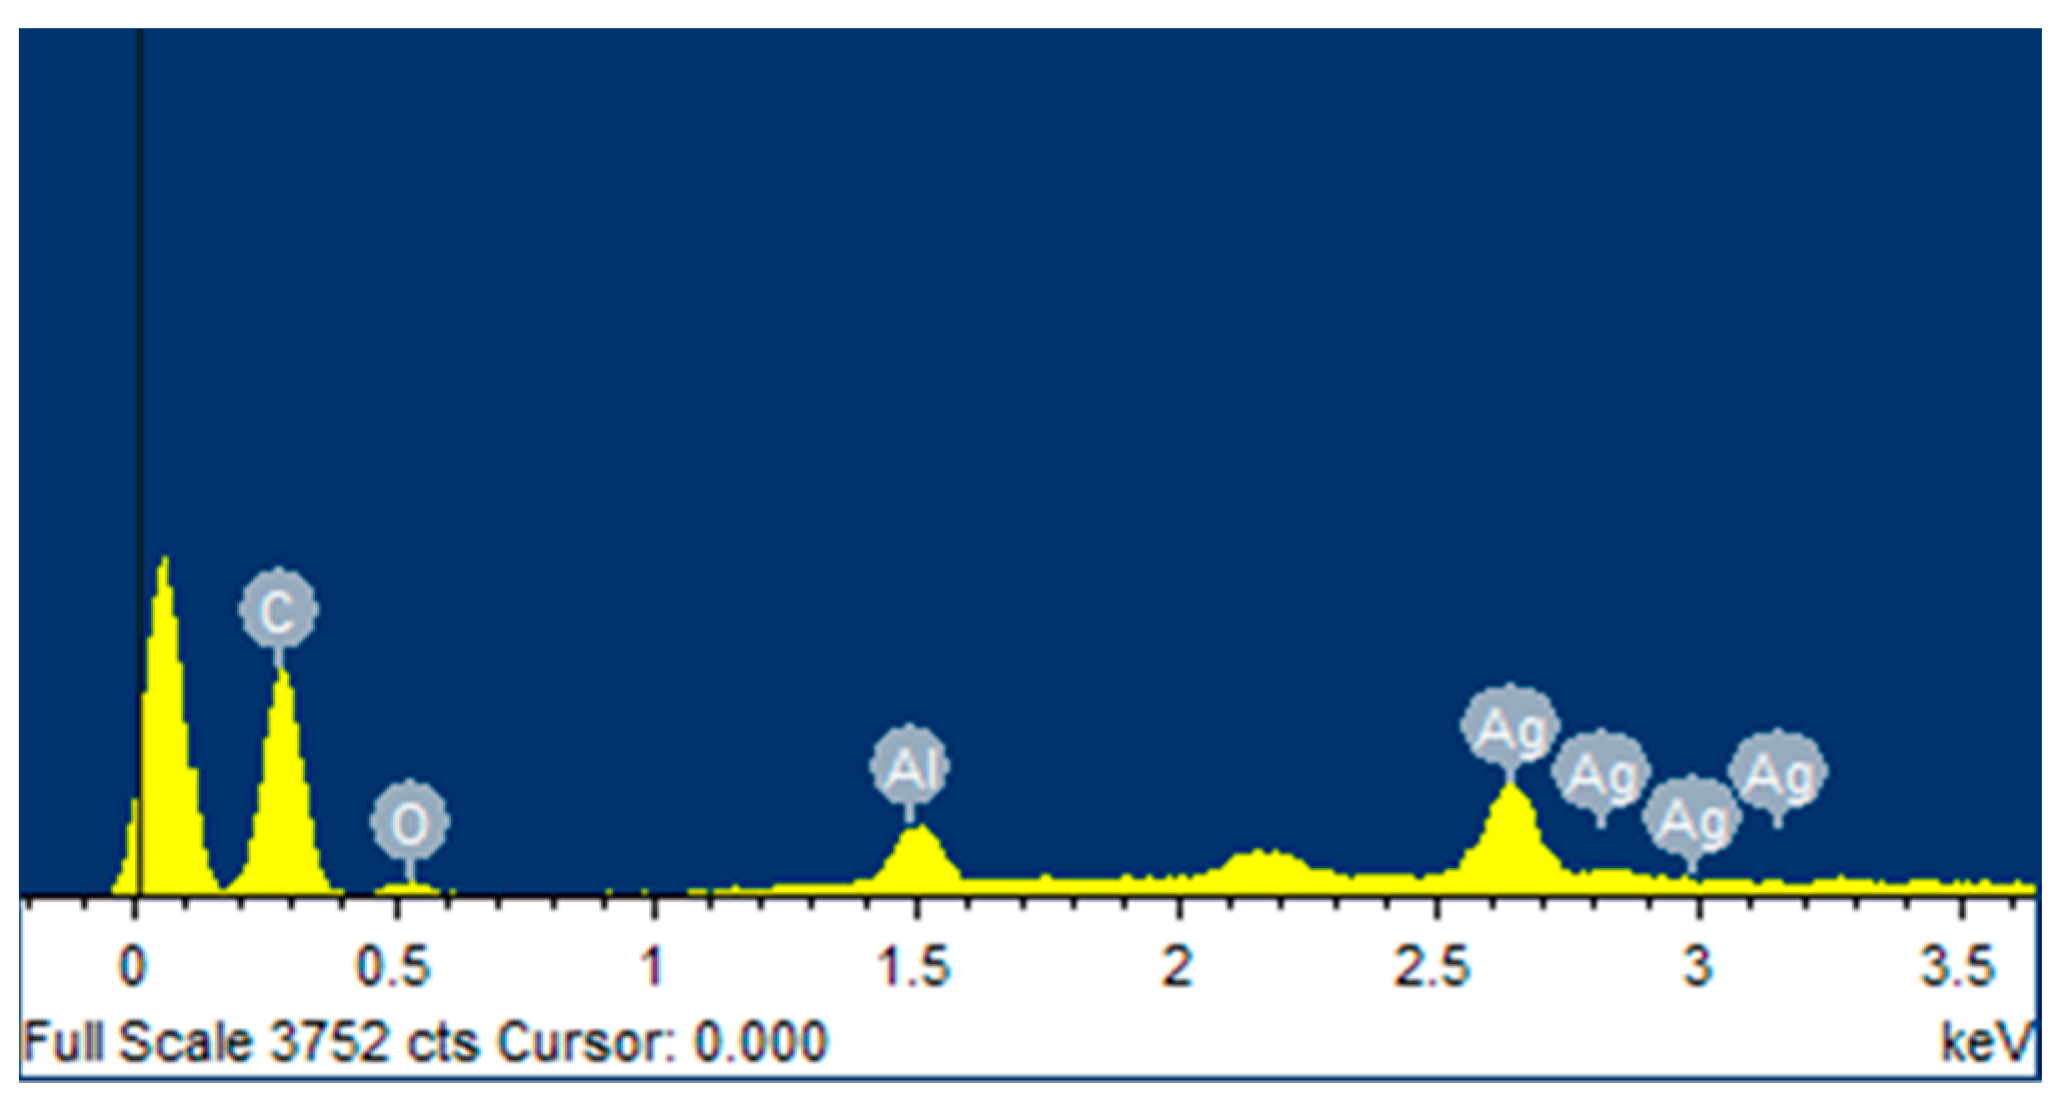
- Predominance of Mechanical Interlocking: Through advanced characterisation, it was discerned that mechanical interlocking is the preeminent contributor to joint strength variations. The absence of peaks between 1600–1800 in the Raman spectrum, typically indicative of C=O stretching mode, suggests that PP degradation transpired without a thermo-oxidation process. This is further supported by corroborative EDS mapping data, which negate the existence of C-O-Al bonds. The presence of antioxidants in PP’s additives probably inhibited oxidative reactions.
- Joint Strength Dependencies: Joint strength exhibits an inverse dependency on heat input, predominantly resulting from fluctuations in the interaction layer’s thickness.
- Interaction Layer Dynamics: Consistency in the chemical structure was observed across samples, suggesting that the chemical composition was not a major factor influencing joint strength. However, the thickness of the interaction layer emerged as a crucial determinant of joint strength. A direct inverse relationship was observed between increasing thickness, attributed to increased heat input, and decreasing joint strength. Moreover, PP-filled cracks within the hook were found to significantly enhance joint strength, as confirmed by SEM analysis.
Author Contributions
Funding
Institutional Review Board Statement
Data Availability Statement
Conflicts of Interest
References
- Ghori, S.W.; Rasheed, M.; Saba, N.; Jawaid, M. The role of advanced polymer materials in aerospace. In Sustainable Composites for Aerospace Applications; Elsevier: Amsterdam, The Netherlands, 2018; pp. 19–34. [Google Scholar]
- Ramarathnam, G.; Libertucci, M.; Sadowski, M.M.; North, T.H. Joining of polymers to metal. Weld. J. N. Y. 1992, 71, 483-s. [Google Scholar]
- Zheng, K.; Politis, D.J.; Wang, L.; Lin, J. A review on forming techniques for manufacturing lightweight complex—Shaped aluminium panel components. Int. J. Light. Mater. Manuf. 2018, 1, 55–80. [Google Scholar] [CrossRef]
- Haghshenas, M.; Khodabakhshi, F. Dissimilar friction-stir welding of aluminum and polymer: A review. Int. J. Adv. Manuf. Technol. 2019, 104, 333–358. [Google Scholar] [CrossRef]
- Khodabakhshi, F.; Haghshenas, M.; Chen, J.; Amirkhiz, B.S.; Li, J.; Gerlich, A. Bonding mechanism and interface characterisation during dissimilar friction stir welding of an aluminium/polymer bi-material joint. Sci. Technol. Weld. Join. 2016, 22, 182–190. [Google Scholar] [CrossRef]
- Shankar, S.; Kaushal, A.; Chattopadhyaya, S.; Vilaça, P.; Bennis, F. Joining of aluminium to polymer by friction stir welding: An overview. IOP Conf. Ser. Mater. Sci. Eng. 2021, 1104, 12005. [Google Scholar] [CrossRef]
- Moshwan, R.; Rahmat, S.M.; Yusof, F.; Hassan, M.A.; Hamdi, M.; Fadzil, M. Dissimilar friction stir welding between polycarbonate and AA 7075 aluminum alloy. Int. J. Mater. Res. 2015, 106, 258–266. [Google Scholar] [CrossRef]
- Ghiya, R.; Badheka, V.J. A review of friction stir lap welding of polymer to metal. Polym. Technol. Mater. 2021, 60, 1966–1995. [Google Scholar] [CrossRef]
- Ullegaddi, K.; Murthy, V.; Harsha, R.N.; Manjunatha. Friction Stir Welding Tool Design and Their Effect on Welding of AA-6082 T6. Mater. Today Proc. 2017, 4, 7962–7970. [Google Scholar] [CrossRef]
- Huang, Y.; Meng, X.; Wang, Y.; Xie, Y.; Zhou, L. Joining of aluminum alloy and polymer via friction stir lap welding. J. Am. Acad. Dermatol. 2018, 257, 148–154. [Google Scholar] [CrossRef]
- Mahakur, V.K.; Gouda, K.; Patowari, P.K.; Bhowmik, S. A Review on Advancement in Friction Stir Welding Considering the Tool and Material Parameters. Arab. J. Sci. Eng. 2021, 46, 7681–7697. [Google Scholar] [CrossRef]
- Ratanathavorn, W.; Melander, A. Dissimilar joining between aluminium alloy (AA 6111) and thermoplastics using friction stir welding. Sci. Technol. Weld. Join. 2015, 20, 222–228. [Google Scholar] [CrossRef]
- Derazkola, H.A.; Elyasi, M. The influence of process parameters in friction stir welding of Al-Mg alloy and polycarbonate. J. Manuf. Process. 2018, 35, 88–98. [Google Scholar] [CrossRef]
- Rai, R.; De, A.; Bhadeshia, H.; DebRoy, T. Friction stir welding tools. Sci. Technol. Weld. Join. 2011, 16, 325–342. [Google Scholar] [CrossRef]
- Trimble, D.; O’Donnell, G.E.; Monaghan, J. Characterisation of tool shape and rotational speed for increased speed during friction stir welding of AA2024-T3. J. Manuf. Process. 2015, 17, 141–150. [Google Scholar] [CrossRef]
- Shahmiri, H.; Movahedi, M.; Kokabi, A.H. Friction stir lap joining of aluminium alloy to polypropylene sheets. Sci. Technol. Weld. Join. 2016, 22, 120–126. [Google Scholar] [CrossRef]
- Dalwadi, C.G.; Patel, A.R.; Kapopara, J.M.; Kotadiya, D.J.; Patel, N.D.; Rana, H. Examination of mechanical properties for dissimilar friction stir welded joint of Al alloy (AA-6061) to PMMA (Acrylic). Mater. Today Proc. 2018, 5, 4761–4765. [Google Scholar] [CrossRef]
- Derazkola, H.A.; Khodabakhshi, F.; Simchi, A. Friction-stir lap-joining of aluminium-magnesium/poly-methyl-methacrylate hybrid structures: Thermo-mechanical modelling and experimental feasibility study. Sci. Technol. Weld. Join. 2017, 23, 35–49. [Google Scholar] [CrossRef]
- Zhang, Y.N.; Cao, X.; Larose, S.; Wanjara, P. Review of tools for friction stir welding and processing. Can. Met. Q. 2012, 51, 250–261. [Google Scholar] [CrossRef]
- Panneerselvam, K.; Lenin, K. Investigation on effect of tool forces and joint defects during FSW of polypropylene plate. Procedia Eng. 2012, 38, 3927–3940. [Google Scholar] [CrossRef]
- Sandeep, R.; Arivazhagan, N. Innovation of thermoplastic polymers and metals hybrid structure using friction stir welding technique: Challenges and future perspectives. J. Braz. Soc. Mech. Sci. Eng. 2021, 43, 1–32. [Google Scholar] [CrossRef]
- Upadhyay, P.; Hovanski, Y.; Fifield, L.S.; Simmons, K.L. Friction stir lap welding of aluminum—Polymer using scribe technology. In Friction Stir Welding and Processing VIII; Springer: Berlin/Heidelberg, Germany, 2015; pp. 153–161. [Google Scholar]
- ASTM D1002; Standard Test Method for Apparent Shear Strength of Single-Lap-Joint Adhesively Bonded Metal Specimens by Tension Loading (Metal-to-Metal). ASTM International: West Conshohocken, PA, USA, 2019.
- ISO 11358-1; Plastics—Thermogravimetry (TG) Of Polymers—Part 1: General Principles. ISO: Geneva, Switzerland, 2022.
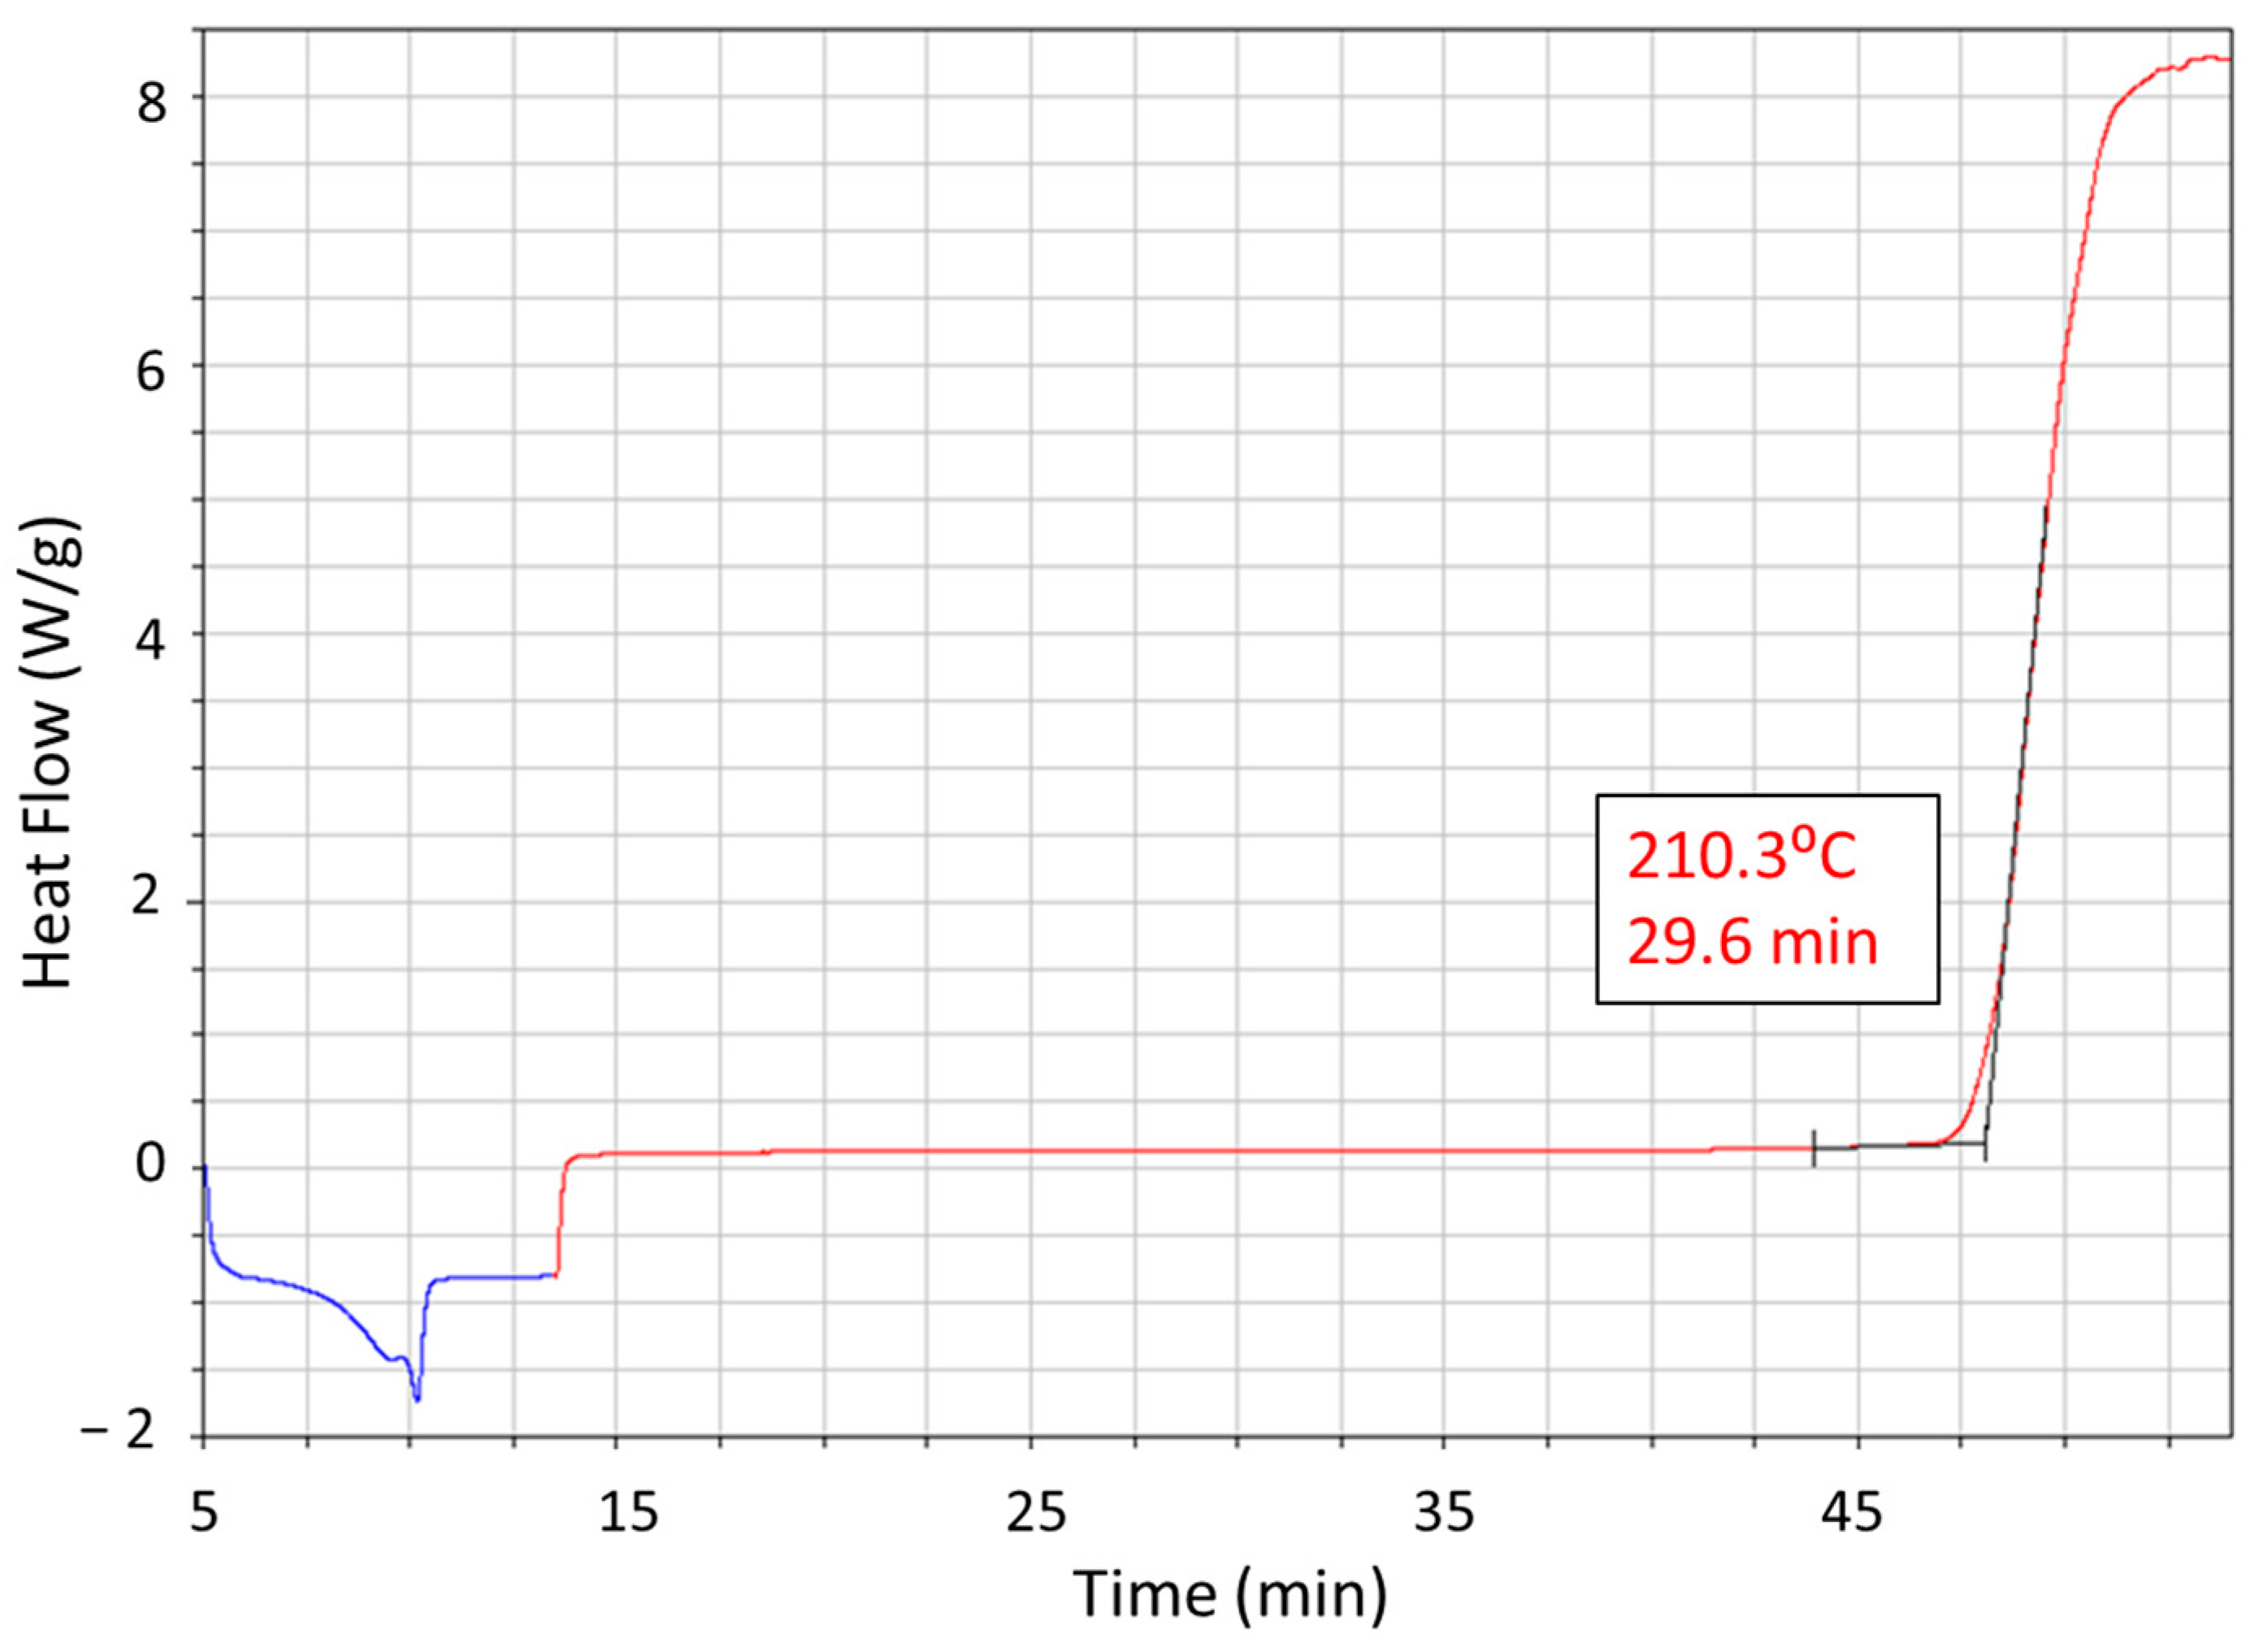
- ISO 11357-6; Plastics—Differential Scanning Calorimetry (DSC)—Part 6: Determination of Oxidation Induction Time (Isothermal OIT) and Oxidation Induction Temperature (Dynamic OIT). ISO: Geneva, Switzerland, 2018.
- Shiravi, H.; Movahedi, M.; Ozlati, A. Improving appearance and mechanical strength of aluminum-polypropylene/talc composite friction stir joint using a novel tool design. Int. J. Adv. Manuf. Technol. 2022, 121, 3717–3730. [Google Scholar] [CrossRef]
- Miandad, R.; Rehan, M.; Barakat, M.A.; Aburiazaiza, A.S.; Khan, H.; Ismail, I.M.I.; Dhavamani, J.; Gardy, J.; Hassanpour, A.; Nizami, A.-S. Catalytic pyrolysis of plastic waste: Moving toward pyrolysis based biorefineries. Front. Energy Res. 2019, 7, 27. [Google Scholar] [CrossRef]
- Zhang, G.; Nam, C.; Chung, T.C.M. Developing polypropylene bonded hindered phenol antioxidants for expanding polypropylene applications in high temperature conditions. J. Mater. Sci. Eng. 2017, 6, 393. [Google Scholar] [CrossRef]
- Zhang, G.; Nam, C.; Petersson, L.; Jämbeck, J.; Hillborg, H.; Chung, T.C.M. Increasing Polypropylene High Temperature Stability by Blending Polypropylene-Bonded Hindered Phenol Antioxidant. Macromolecules 2018, 51, 1927–1936. [Google Scholar] [CrossRef]
- Guo, X.; Lin, Z.; Wang, Y.; He, Z.; Wang, M.; Jin, G. In-Line Monitoring the Degradation of Polypropylene under Multiple Extrusions Based on Raman Spectroscopy. Polymers 2019, 11, 1698. [Google Scholar] [CrossRef]
- de Báez, M.A.; Hendra, P.; Judkins, M. The Raman spectra of oriented isotactic polypropylene. Spectrochim. Acta Part A Mol. Biomol. Spectrosc. 1995, 51, 2117–2124. [Google Scholar] [CrossRef]
- Gopanna, A.; Mandapati, R.N.; Thomas, S.P.; Rajan, K.; Chavali, M. Fourier transform infrared spectroscopy (FTIR), Raman spectroscopy and wide-angle X-ray scattering (WAXS) of polypropylene (PP)/cyclic olefin copolymer (COC) blends for qualitative and quantitative analysis. Polym. Bull. 2018, 76, 4259–4274. [Google Scholar] [CrossRef]
- Lin-Vien, D.; Colthup, N.B.; Fateley, W.G.; Grasselli, J.G. Compounds Containing the Carbonyl Group. In The Handbook of Infrared and Raman Characteristic Frequencies of Organic Molecules; Academic Press: Cambridge, MA, USA, 1991. [Google Scholar] [CrossRef]
- Blakey, I.; George, G.A. Raman spectral mapping of photo-oxidised polypropylene. Polym. Degrad. Stab. 2000, 70, 269–275. [Google Scholar] [CrossRef]
- Han, S.; Wu, L.H.; Jiang, C.Y.; Li, N.; Jia, C.L.; Xue, P.; Zhang, H.; Zhao, H.B.; Ni, D.R.; Xiao, B.L.; et al. Achieving a strong polypropylene/aluminum alloy friction spot joint via a surface laser processing pretreatment. J. Mater. Sci. Technol. 2020, 50, 103–114. [Google Scholar] [CrossRef]
- Wang, W.; Wang, S.; Zhang, X.; Xu, Y.; Tian, Y.; Huang, H. Enhanced aluminum alloy-polymer friction stir welding joints by introducing micro-textures. Mater. Lett. 2021, 295, 129872. [Google Scholar] [CrossRef]
- Wang, S.; Xu, Y.; Wang, W.; Tian, Y.; Zhang, X.; Huang, H.; Zheng, D. Enhancing interfacial bonding in friction stir lap welding of light metal and carbon fiber reinforced polymer composite. J. Manuf. Process. 2022, 83, 729–741. [Google Scholar] [CrossRef]
- Liu, F.; Dong, P.; Pei, X. A high-speed metal-to-polymer direct joining technique and underlying bonding mechanisms. J. Am. Acad. Dermatol. 2020, 280, 116610. [Google Scholar] [CrossRef]
- Liu, F.; Dong, P.; Lu, W.; Sun, K. On formation of Al O C bonds at aluminum/polyamide joint interface. Appl. Surf. Sci. 2019, 466, 202–209. [Google Scholar] [CrossRef]
- Adar, F. Raman spectra of metal oxides. Spectroscopy 2014, 29. [Google Scholar]
- Andreassen, E. Infrared and Raman spectroscopy of polypropylene. In Polypropylene; Springer: Dordrecht, The Netherlands, 1999. [Google Scholar] [CrossRef]


| Base Material | AA 5052 | Polypropylene |
|---|---|---|
| Density (kg/m3) | 2680 | 905 |
| Thermal conductivity (W/m·K) | 138 | 0.24 |
| Ultimate tensile strength (MPa) | 210–260 | >25 |
| Shear strength (MPa) | 180 | 25 |
| Chemical Composition of AA 5052 (%) | ||||||||
|---|---|---|---|---|---|---|---|---|
| Si | Fe | Cu | Mn | Mg | Cr | Zn | Ti | Aluminium (Minimum) |
| 0.12 | 0.31 | 0.003 | 0.037 | 2.5 | 0.172 | 0.001 | 0.016 | 96.841 |
| Fixed Parameters | Value | ||
|---|---|---|---|
| Pin Shape | Fluted 4 mm pin (straightened self-tapping screw) | ||
| Pin length (mm) | 4 | ||
| Tool Shoulder (mm) | 15 | ||
| Plunge Depth (mm) | 0.1 | ||
| Tilt Angle (Degree) | 2 | ||
| Variables | Level 1 | Level 2 | Level 3 |
| Rotation Speed (RPM)(CW) | 1000 | 1200 | 1400 |
| Traverse speed (mm/min) | 20 | 40 | 60 |
| Sample # | w (RPM) | v (mm/min) | Joint Features | Interaction Layer Thickness (μm) | Joint Temperature (°C) |
|---|---|---|---|---|---|
| 1 (Strongest) | 1400 | 20 | Hook’s PP filled cracks, voids, small Al chips in the weld nugget | 26.07 | 158 |
| 2 (Weakest) | 1000 | 20 | Chipped hook inner side, thick interaction layer, slim and long Al chips in the weld nugget | 65.74 | 226 |
| 3 | 1200 | 60 | Voids, two-sided interaction layer, bulk Al chips in the weld nugget | 27.49 | 188 |
Disclaimer/Publisher’s Note: The statements, opinions and data contained in all publications are solely those of the individual author(s) and contributor(s) and not of MDPI and/or the editor(s). MDPI and/or the editor(s) disclaim responsibility for any injury to people or property resulting from any ideas, methods, instructions or products referred to in the content. |
© 2023 by the authors. Licensee MDPI, Basel, Switzerland. This article is an open access article distributed under the terms and conditions of the Creative Commons Attribution (CC BY) license (https://creativecommons.org/licenses/by/4.0/).
Share and Cite
Alhatti, A.I.; Sheikh-Ahmad, J.; Almaskari, F.; Khan, K.A.; Deveci, S.; Hosny, A.I. A Study of the Friction Stir Lap Welding of AA5052 and Polypropylene. Polymers 2023, 15, 4481. https://doi.org/10.3390/polym15234481
Alhatti AI, Sheikh-Ahmad J, Almaskari F, Khan KA, Deveci S, Hosny AI. A Study of the Friction Stir Lap Welding of AA5052 and Polypropylene. Polymers. 2023; 15(23):4481. https://doi.org/10.3390/polym15234481
Chicago/Turabian StyleAlhatti, Ahmed I., Jamal Sheikh-Ahmad, Fahad Almaskari, Kamran A. Khan, Suleyman Deveci, and Abdelrahman I. Hosny. 2023. "A Study of the Friction Stir Lap Welding of AA5052 and Polypropylene" Polymers 15, no. 23: 4481. https://doi.org/10.3390/polym15234481
APA StyleAlhatti, A. I., Sheikh-Ahmad, J., Almaskari, F., Khan, K. A., Deveci, S., & Hosny, A. I. (2023). A Study of the Friction Stir Lap Welding of AA5052 and Polypropylene. Polymers, 15(23), 4481. https://doi.org/10.3390/polym15234481