
The Effects of Particle Size Distribution and Moisture Variation on Mechanical Strength of Biopolymer-Treated Soil


Abstract
:
1. Introduction
2. Materials and Methods
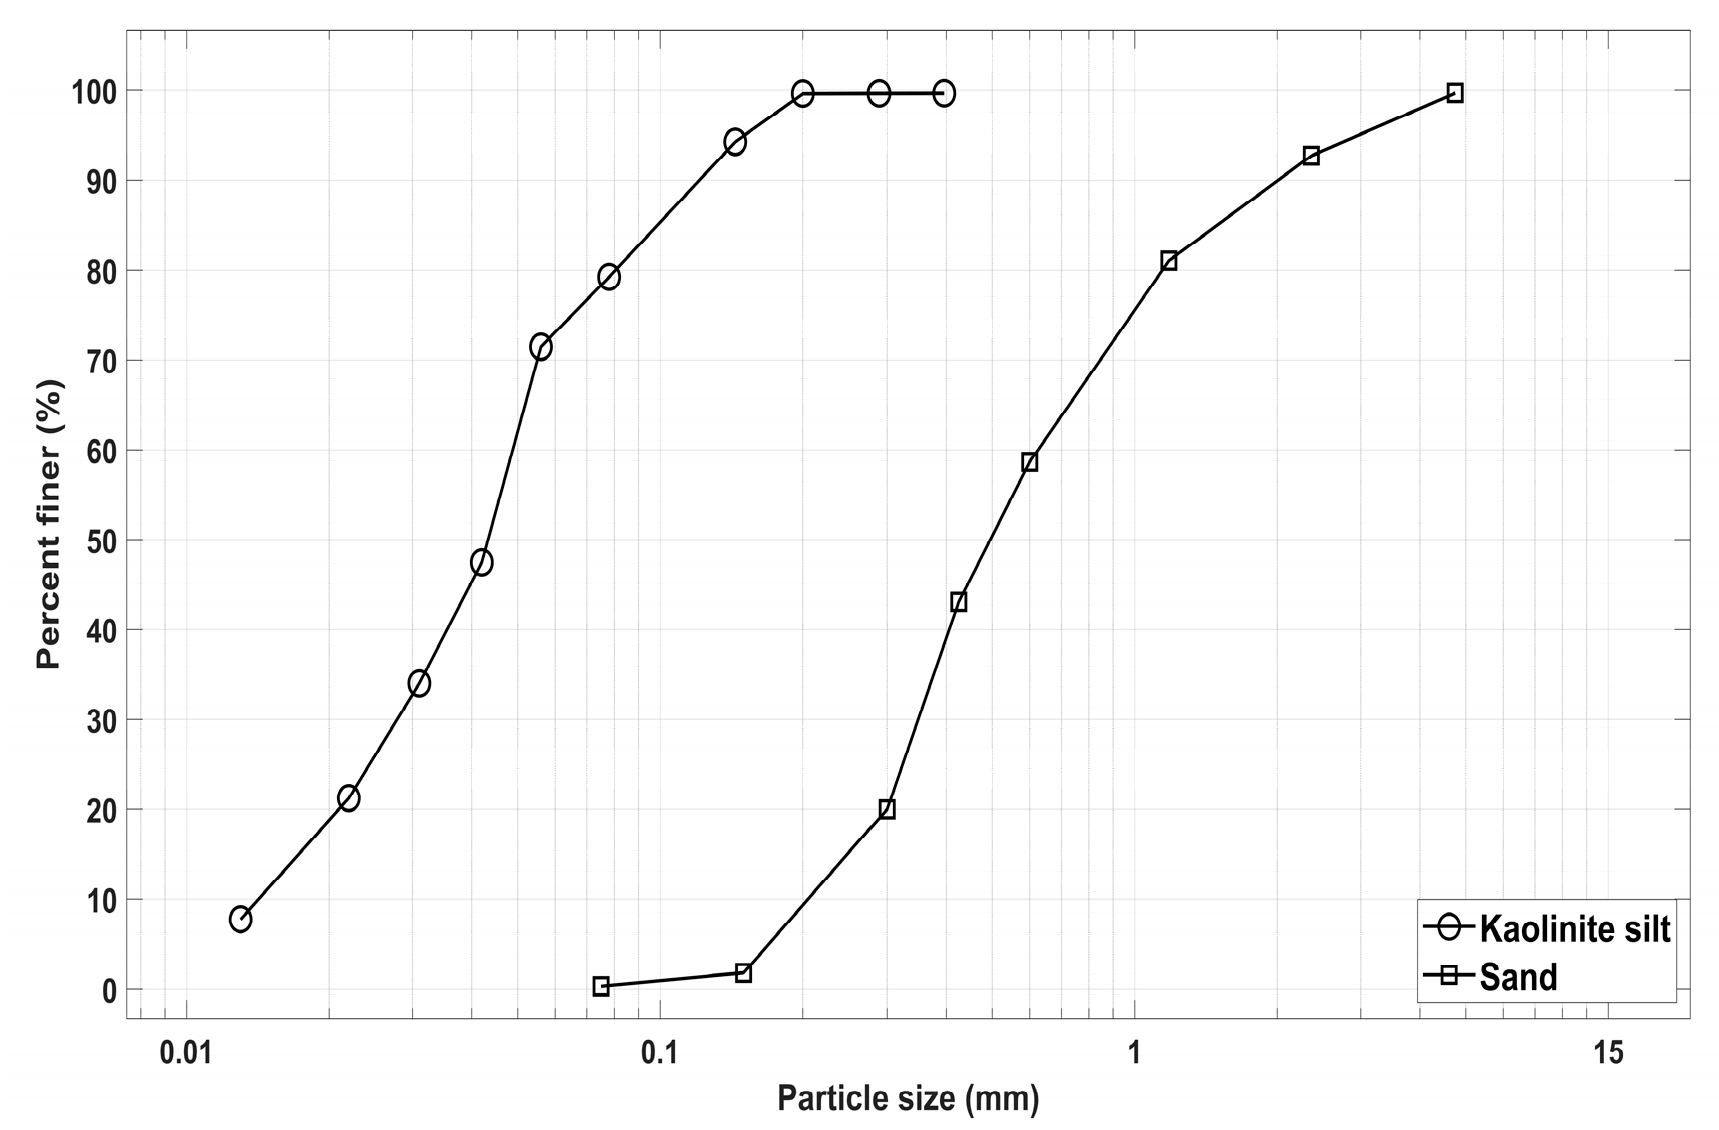
2.1. Sand and Kaolinite
2.2. Agar Gum
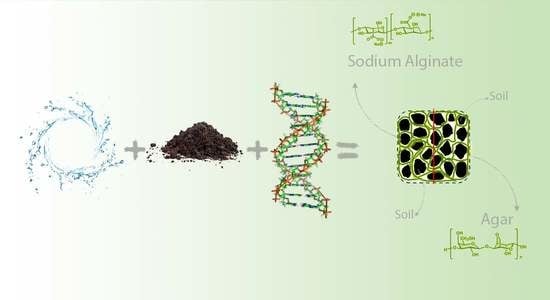
2.3. Sodium Alginate
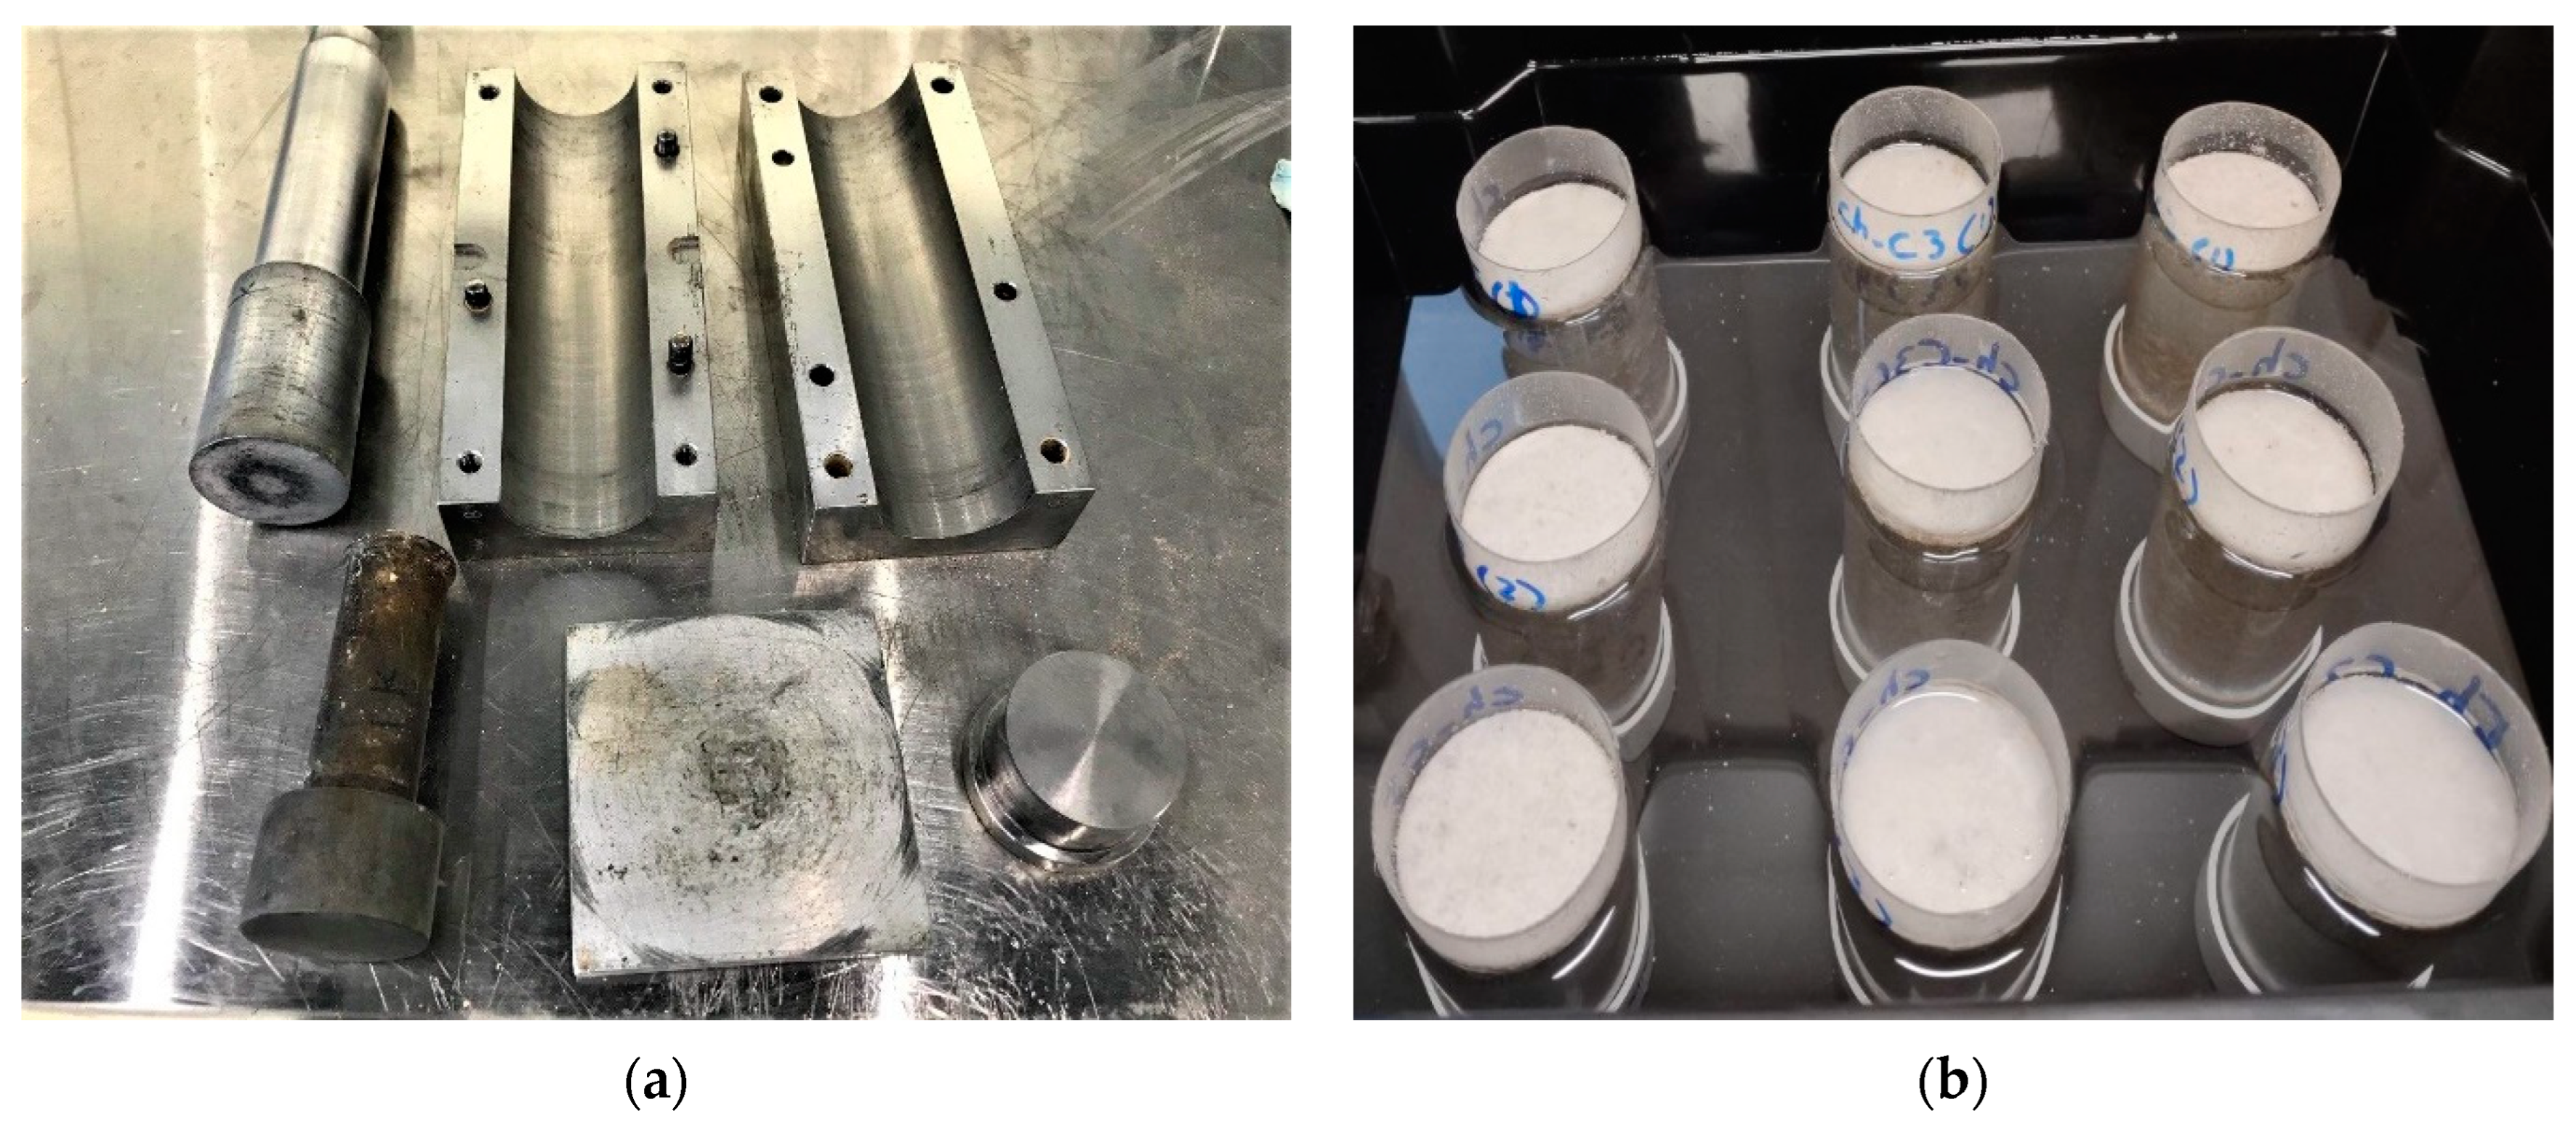
2.4. Sample Preparation
2.5. Kaolinite-Sand Combination
2.6. Experimental Program
2.6.1. Unconfined Compression Strength Test
2.6.2. Attenuated Total Reflectance Fourier Transform Infrared (ATR-FTIR) Spectroscopy
2.6.3. Scanning Electron Microscopy (SEM) Images
3. Results
3.1. Unconfined Compressive Strength Test
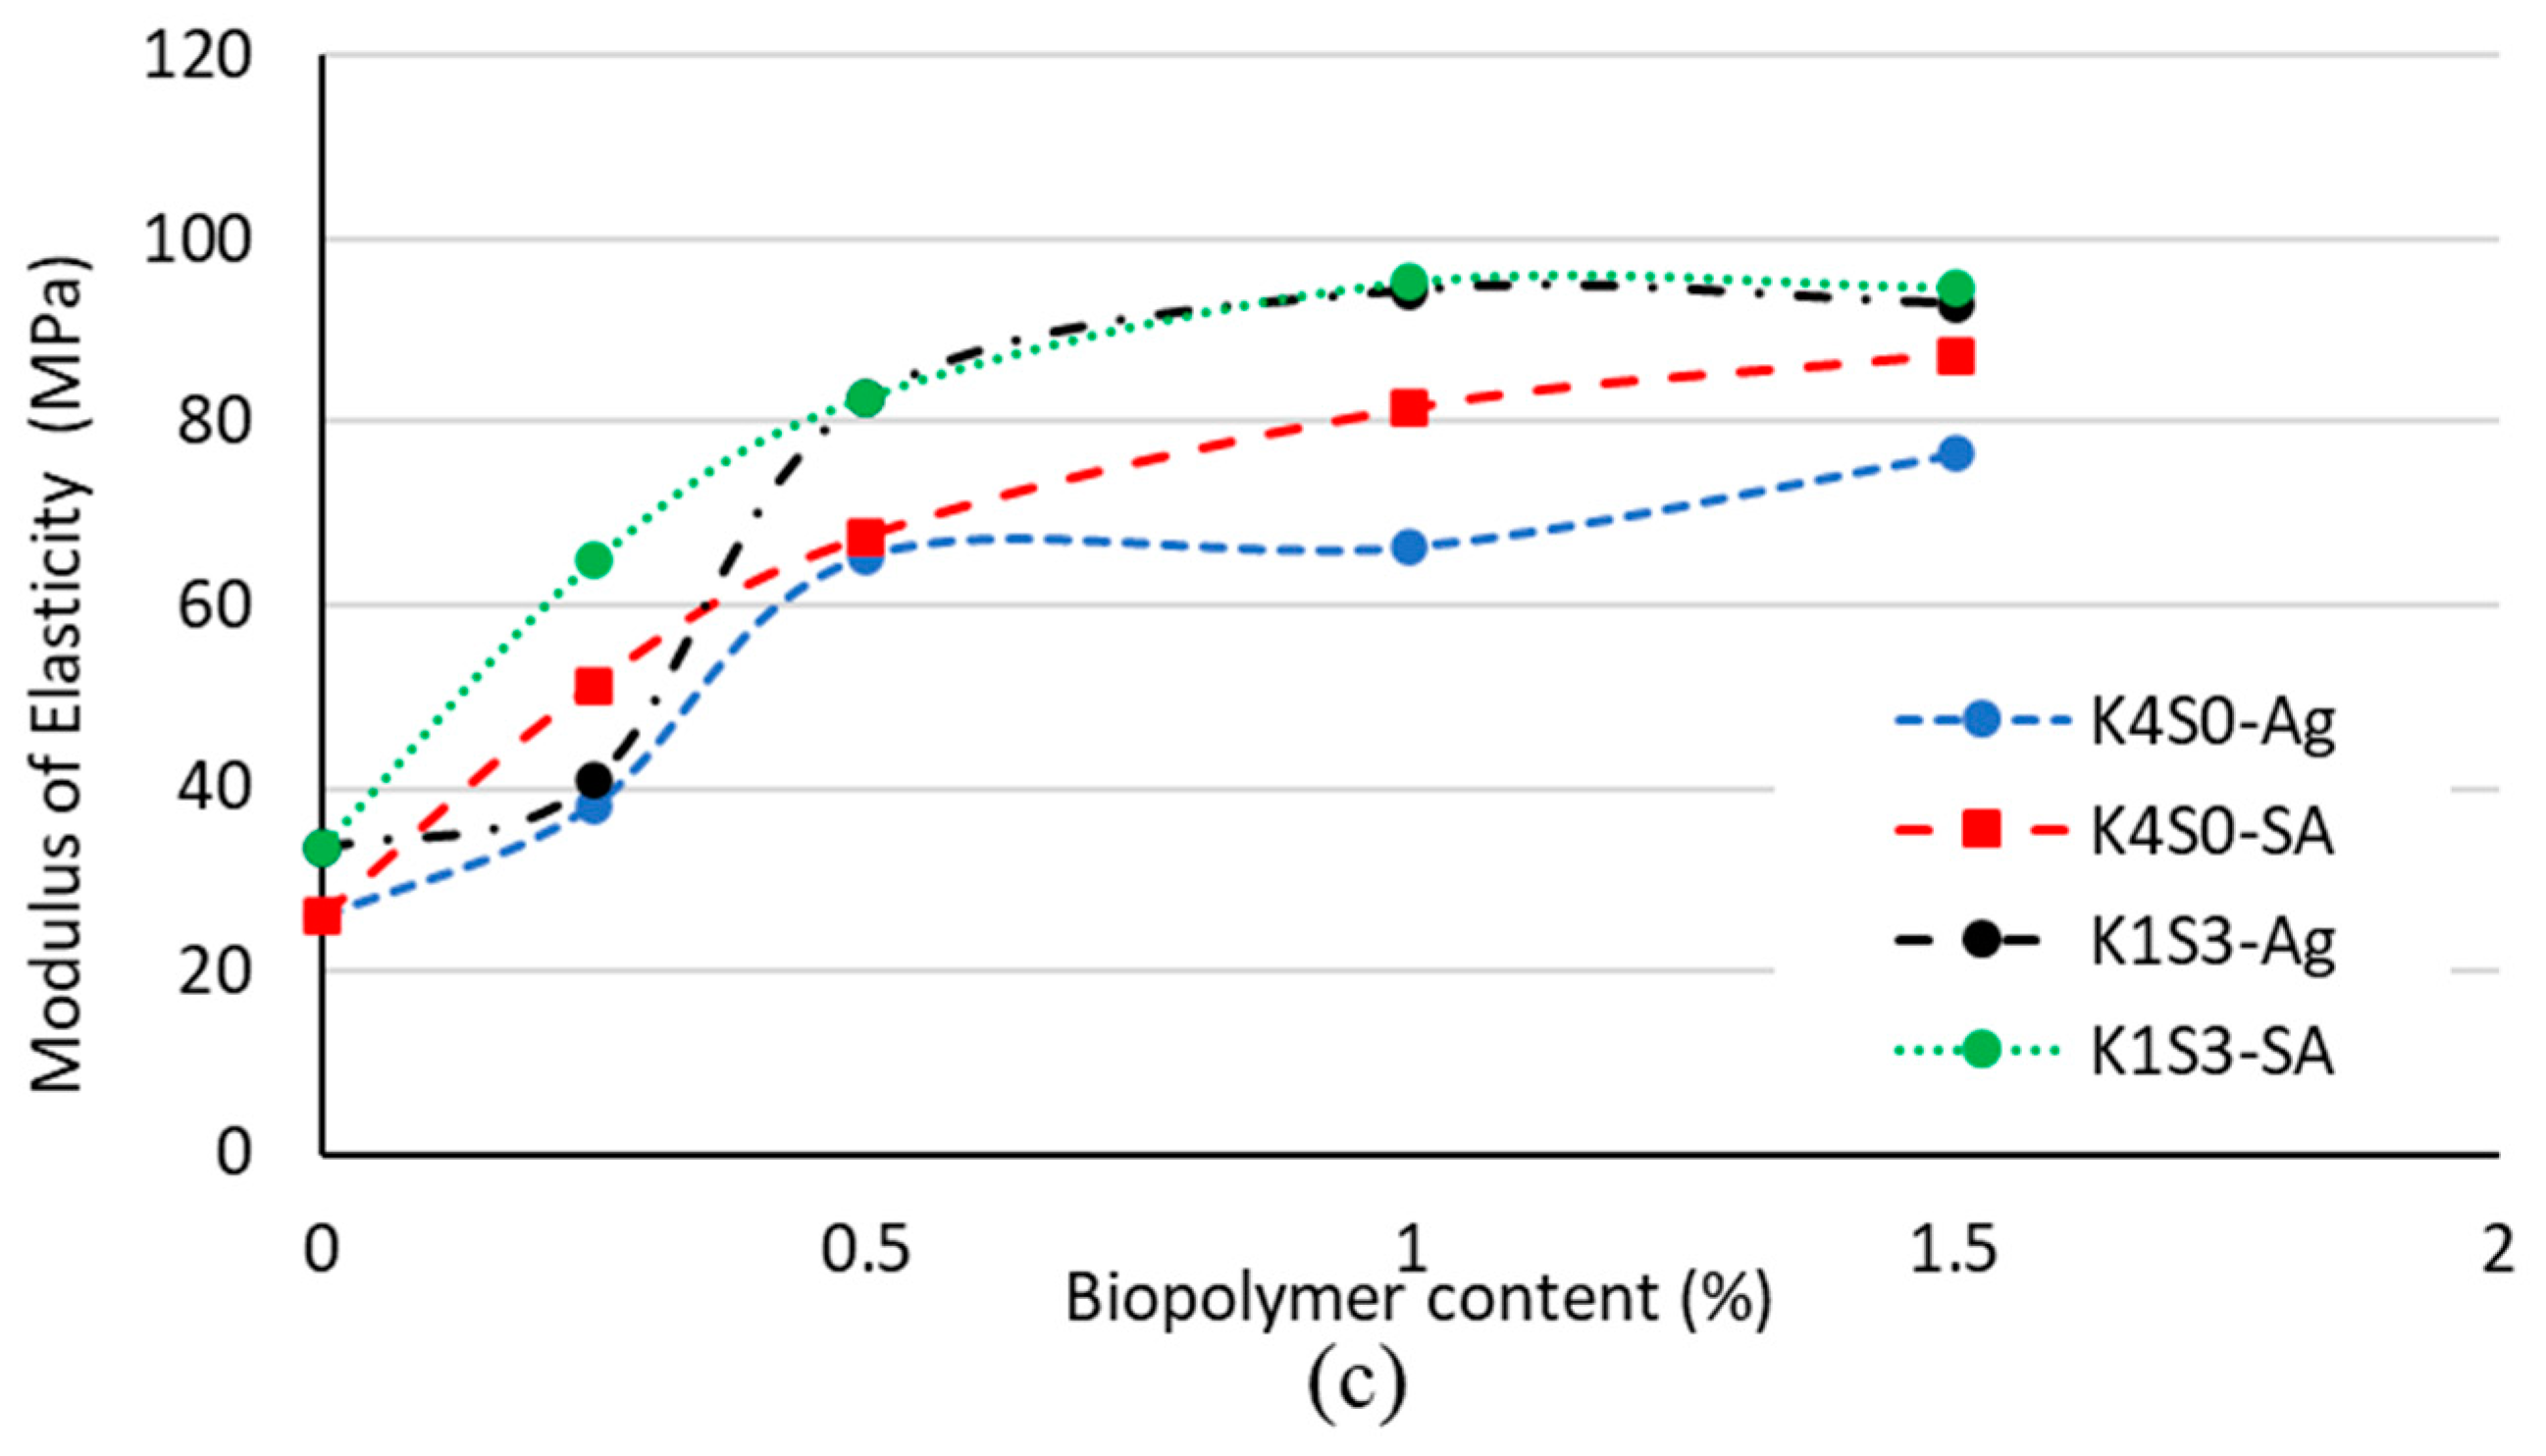
3.1.1. Biopolymer Content
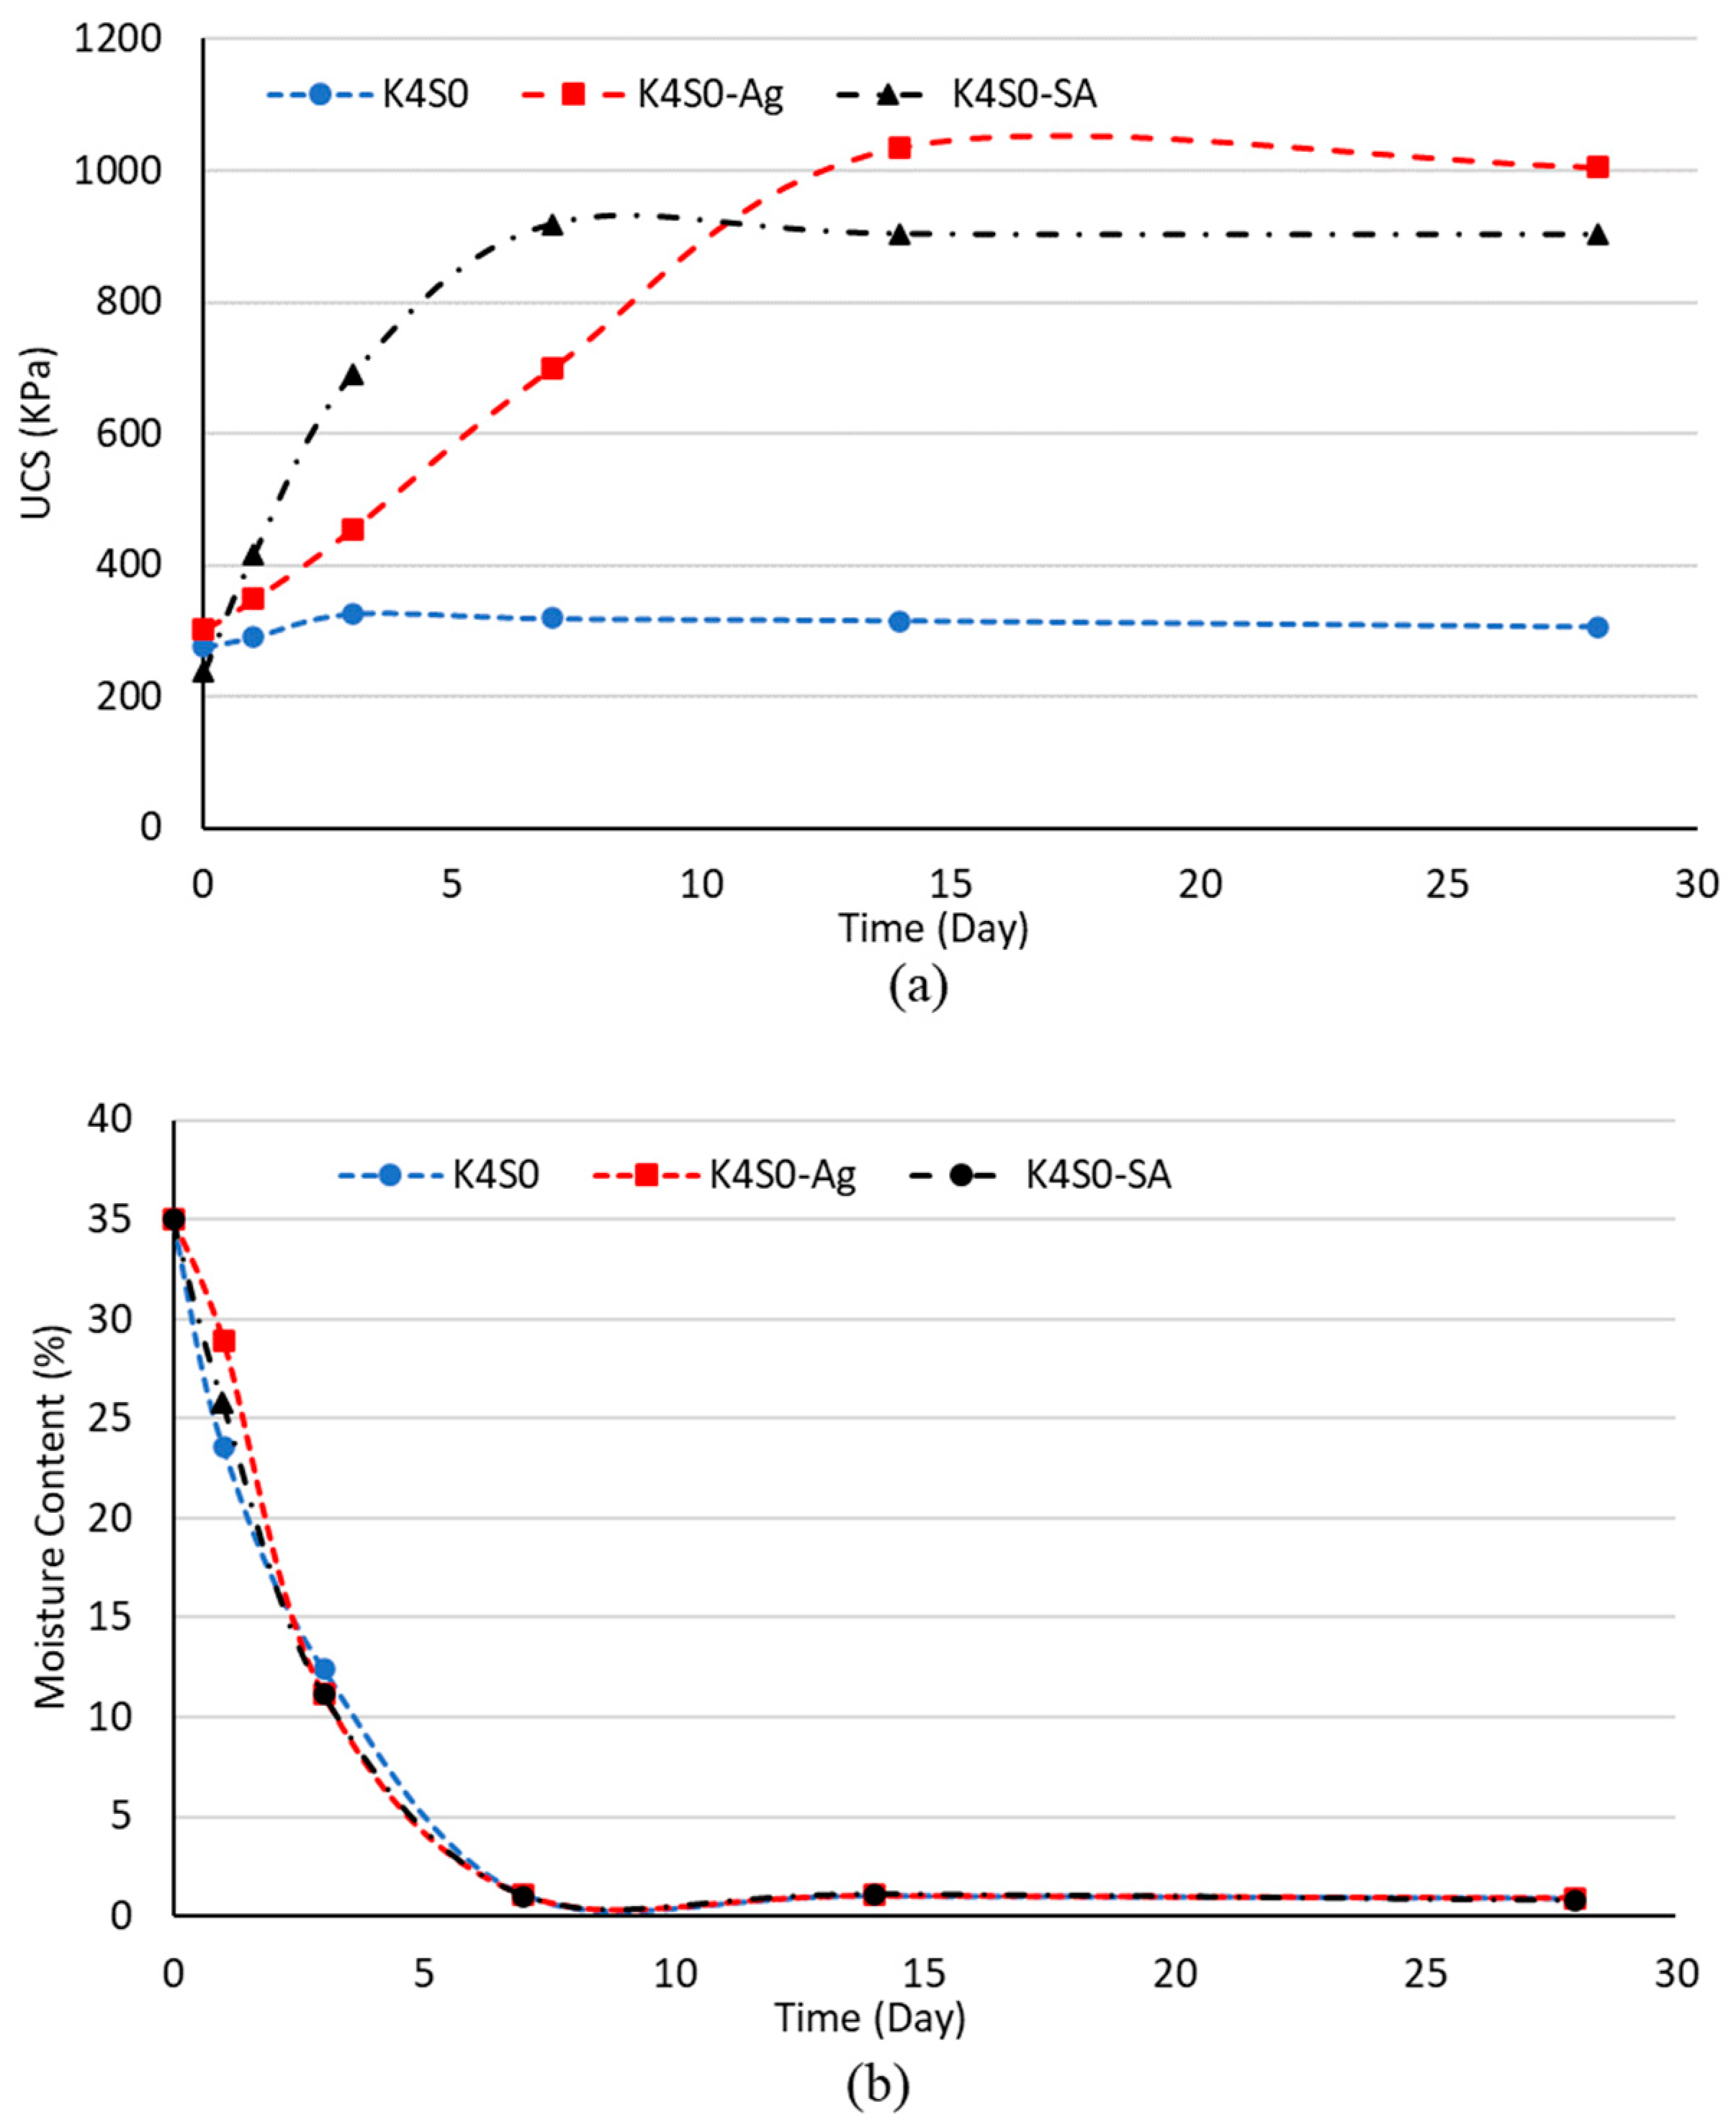
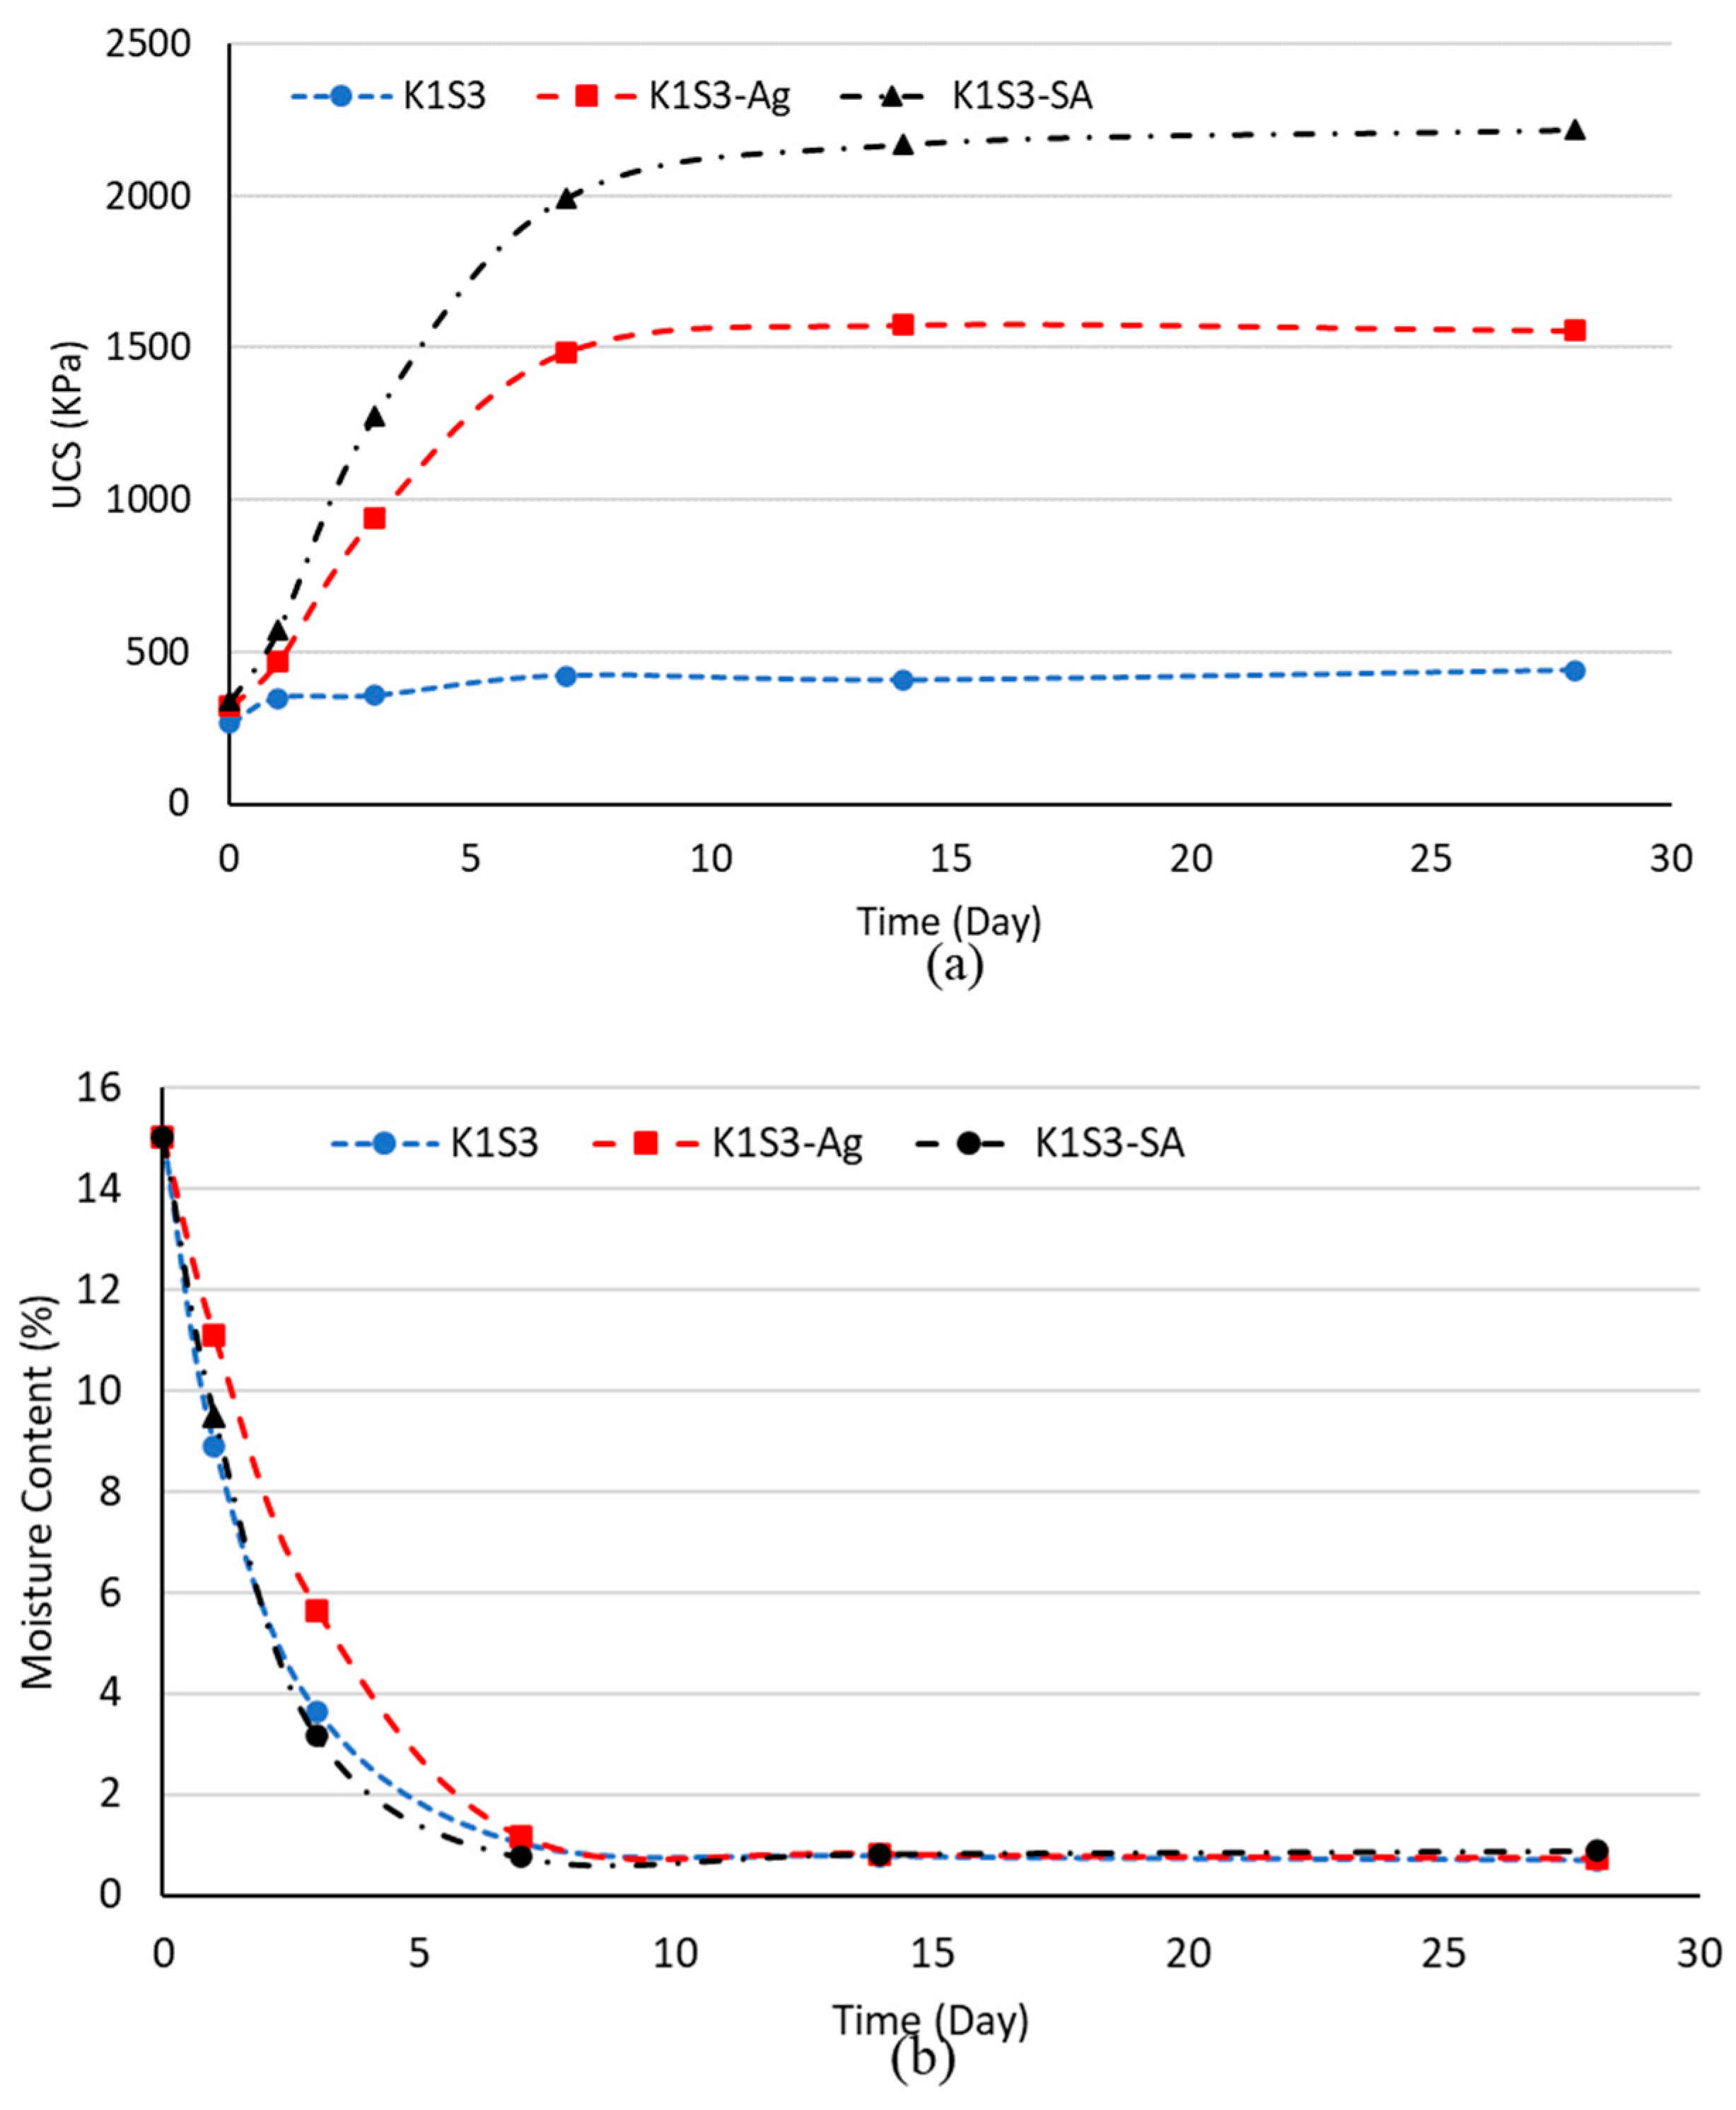
3.1.2. Dehydration Time
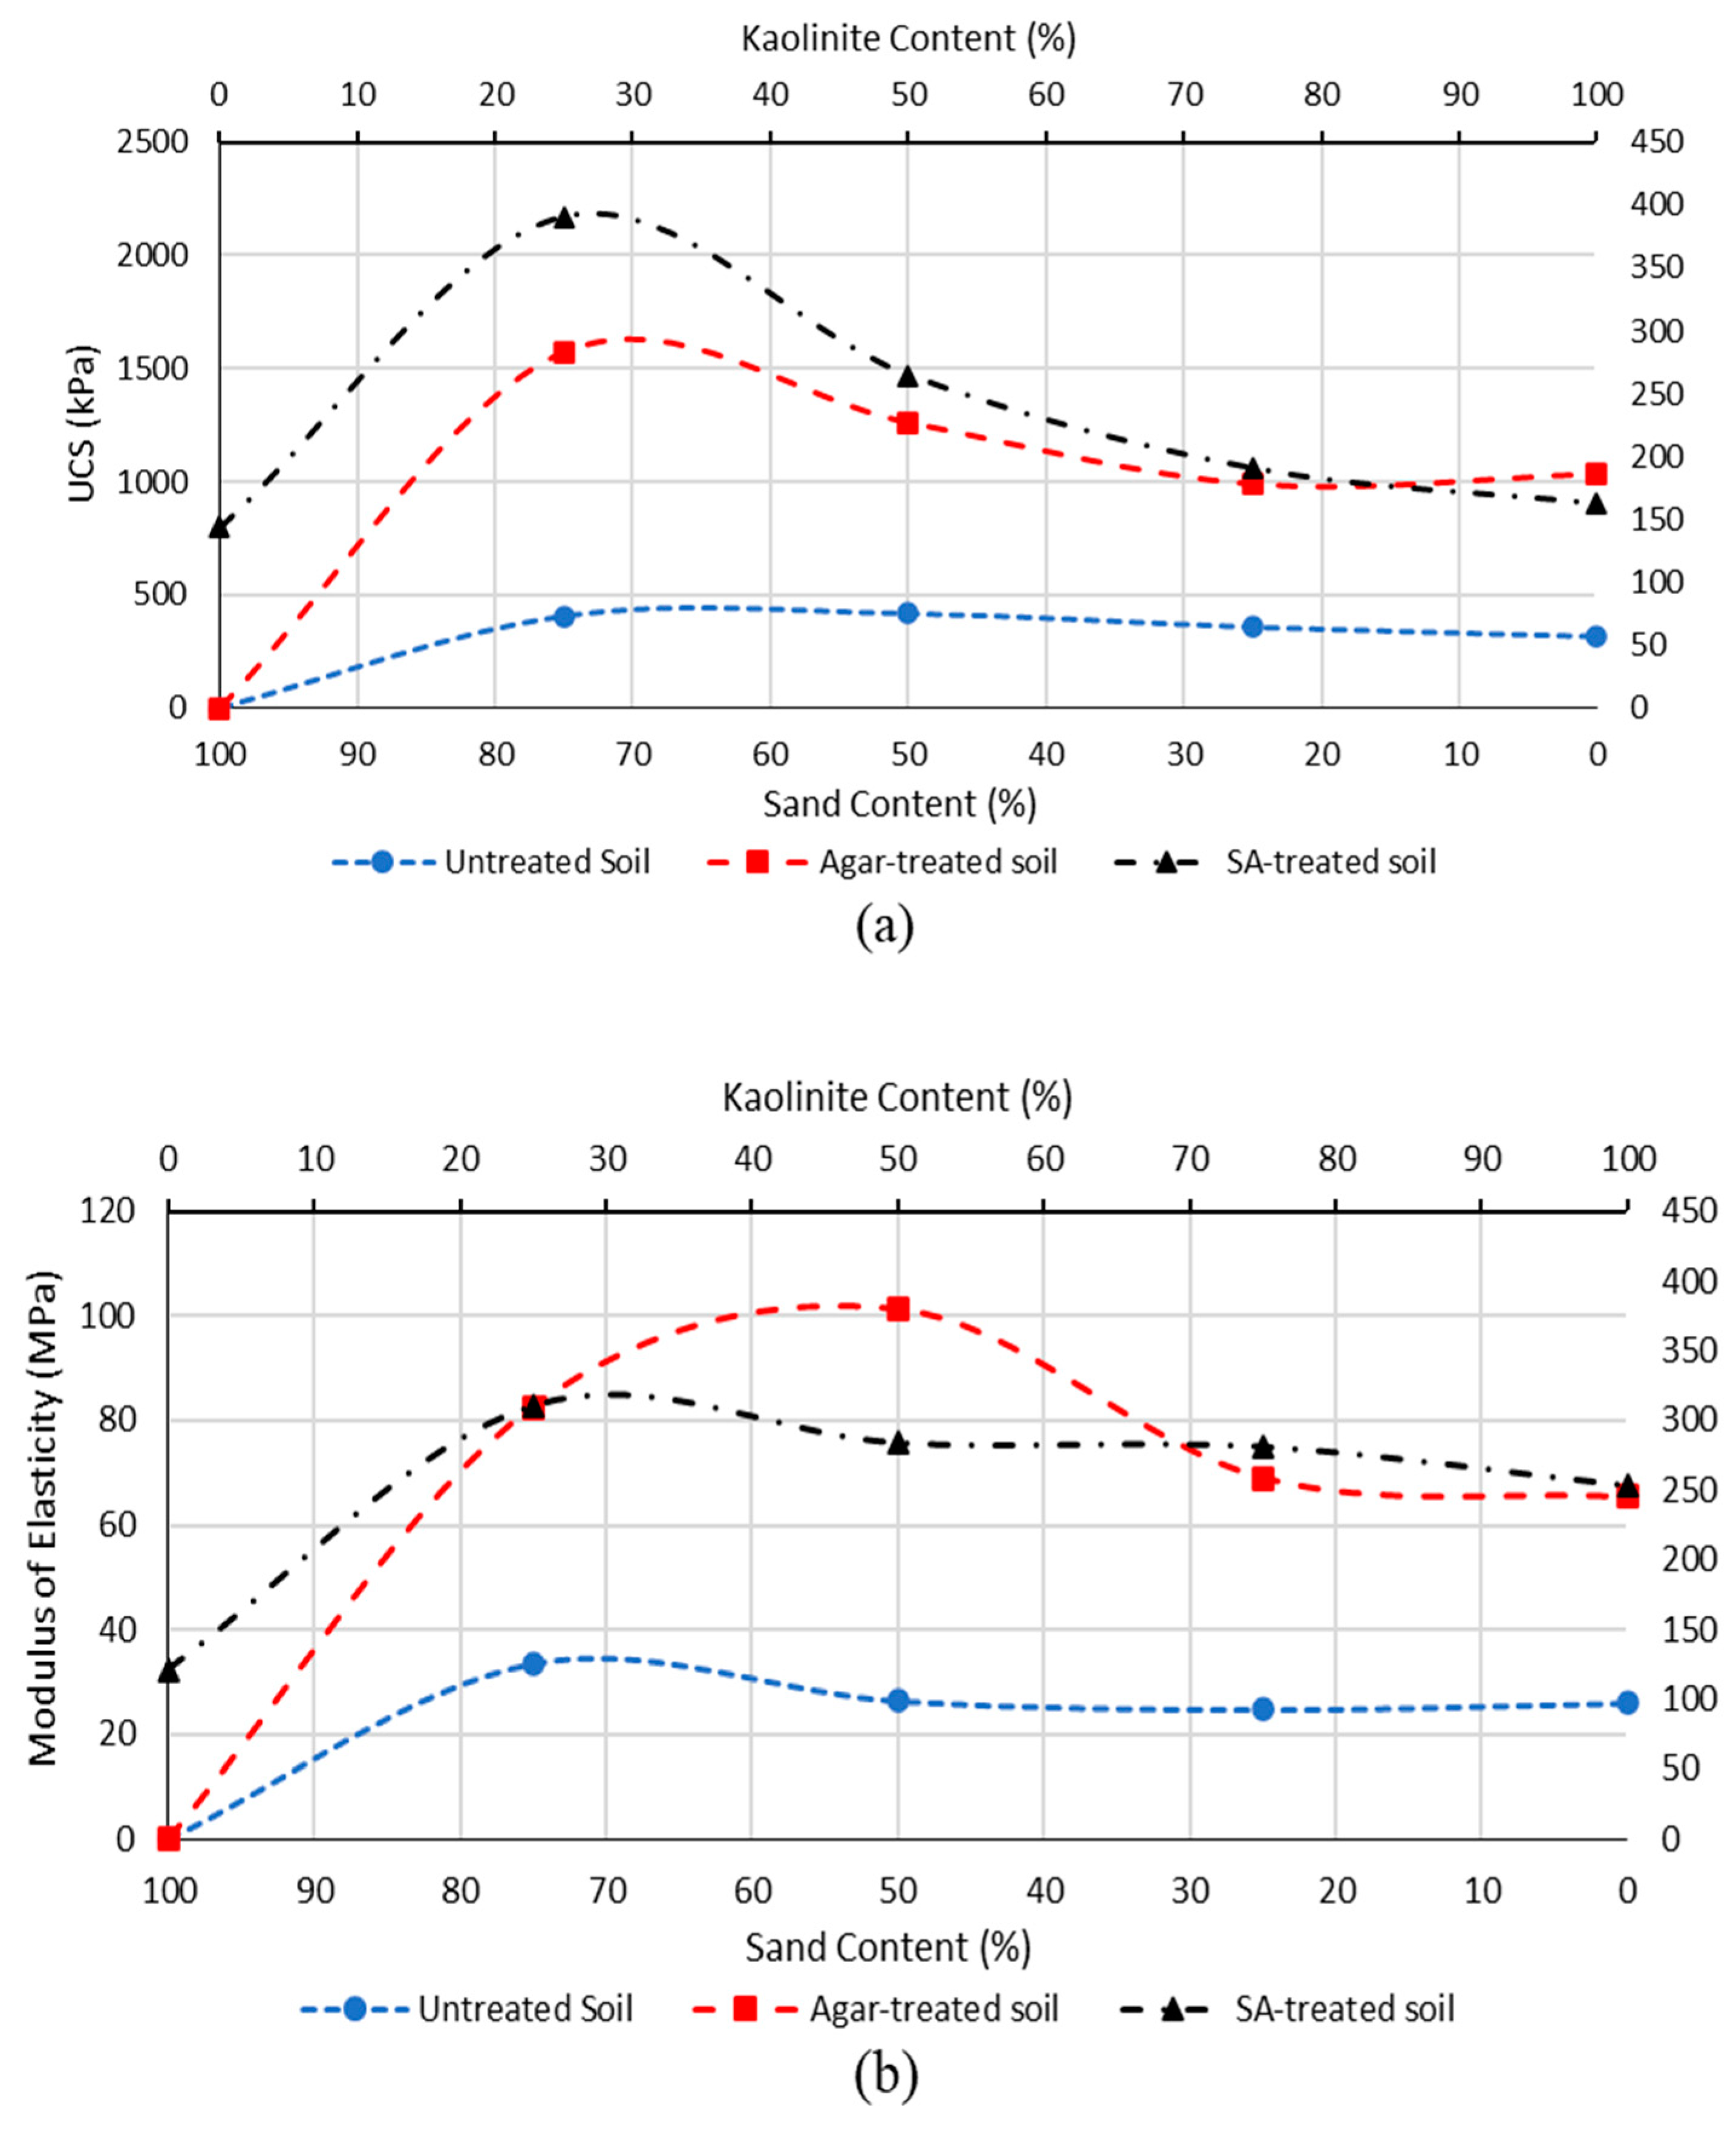
3.1.3. Soil Type
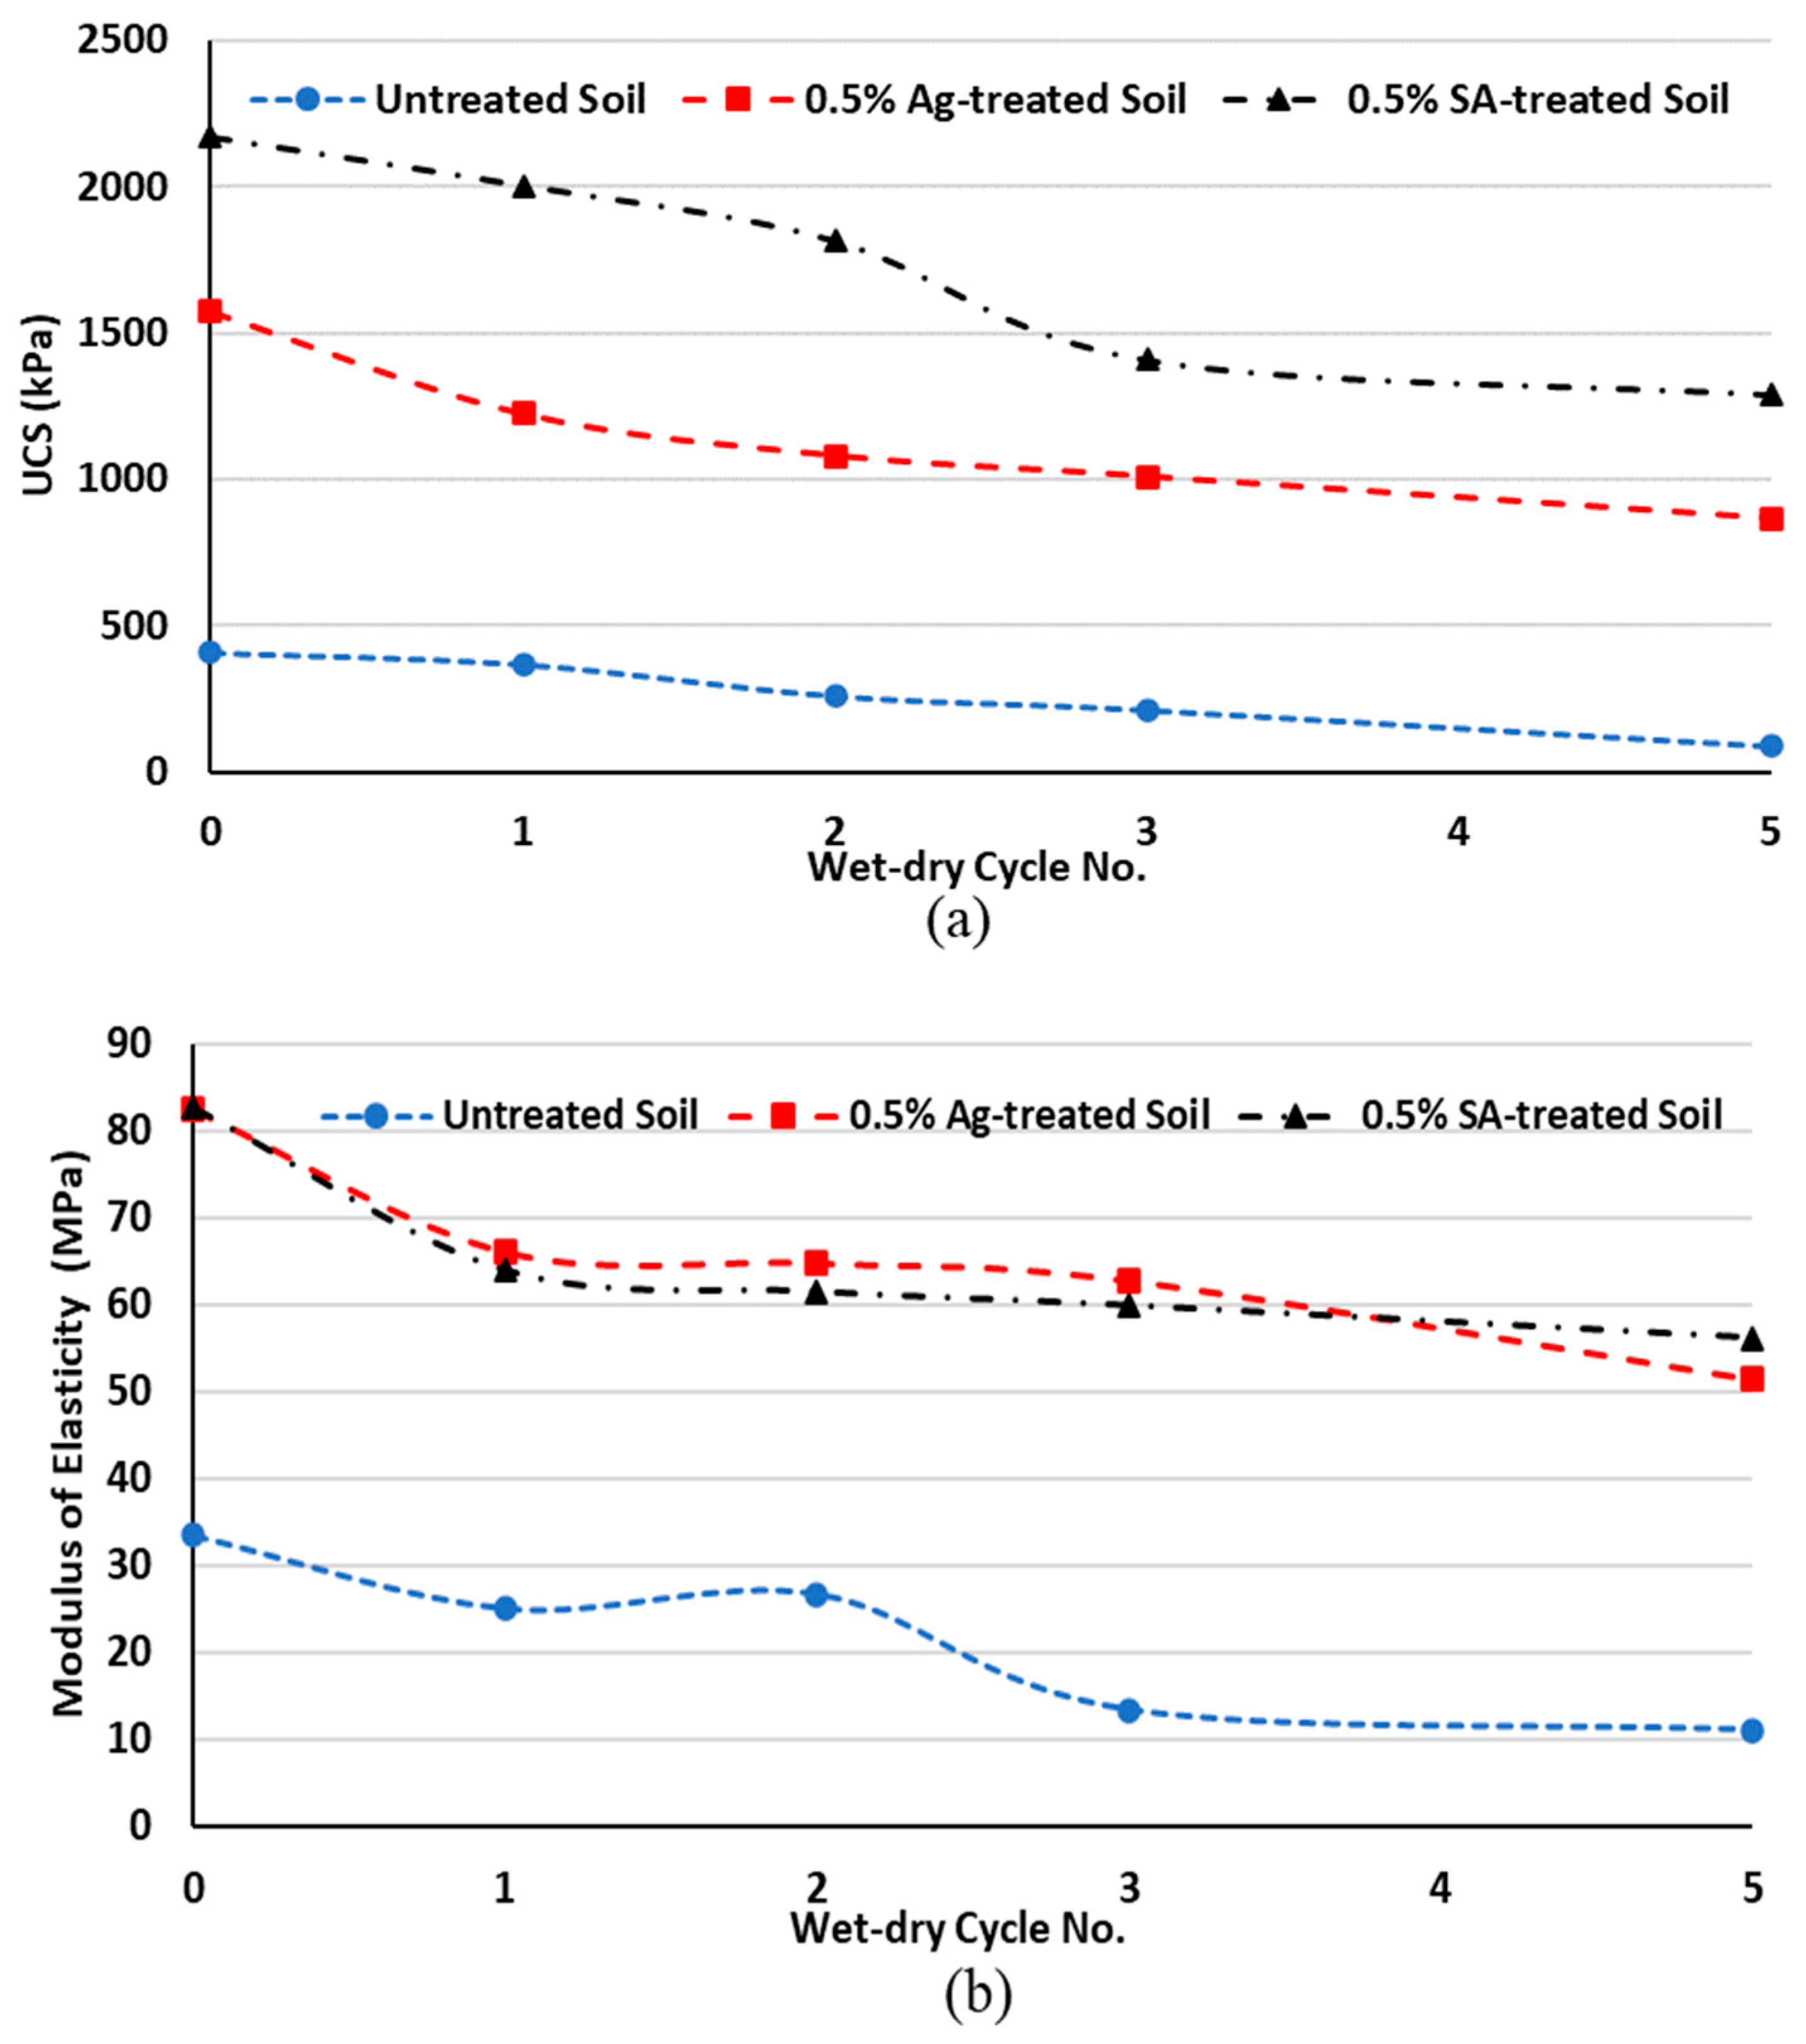
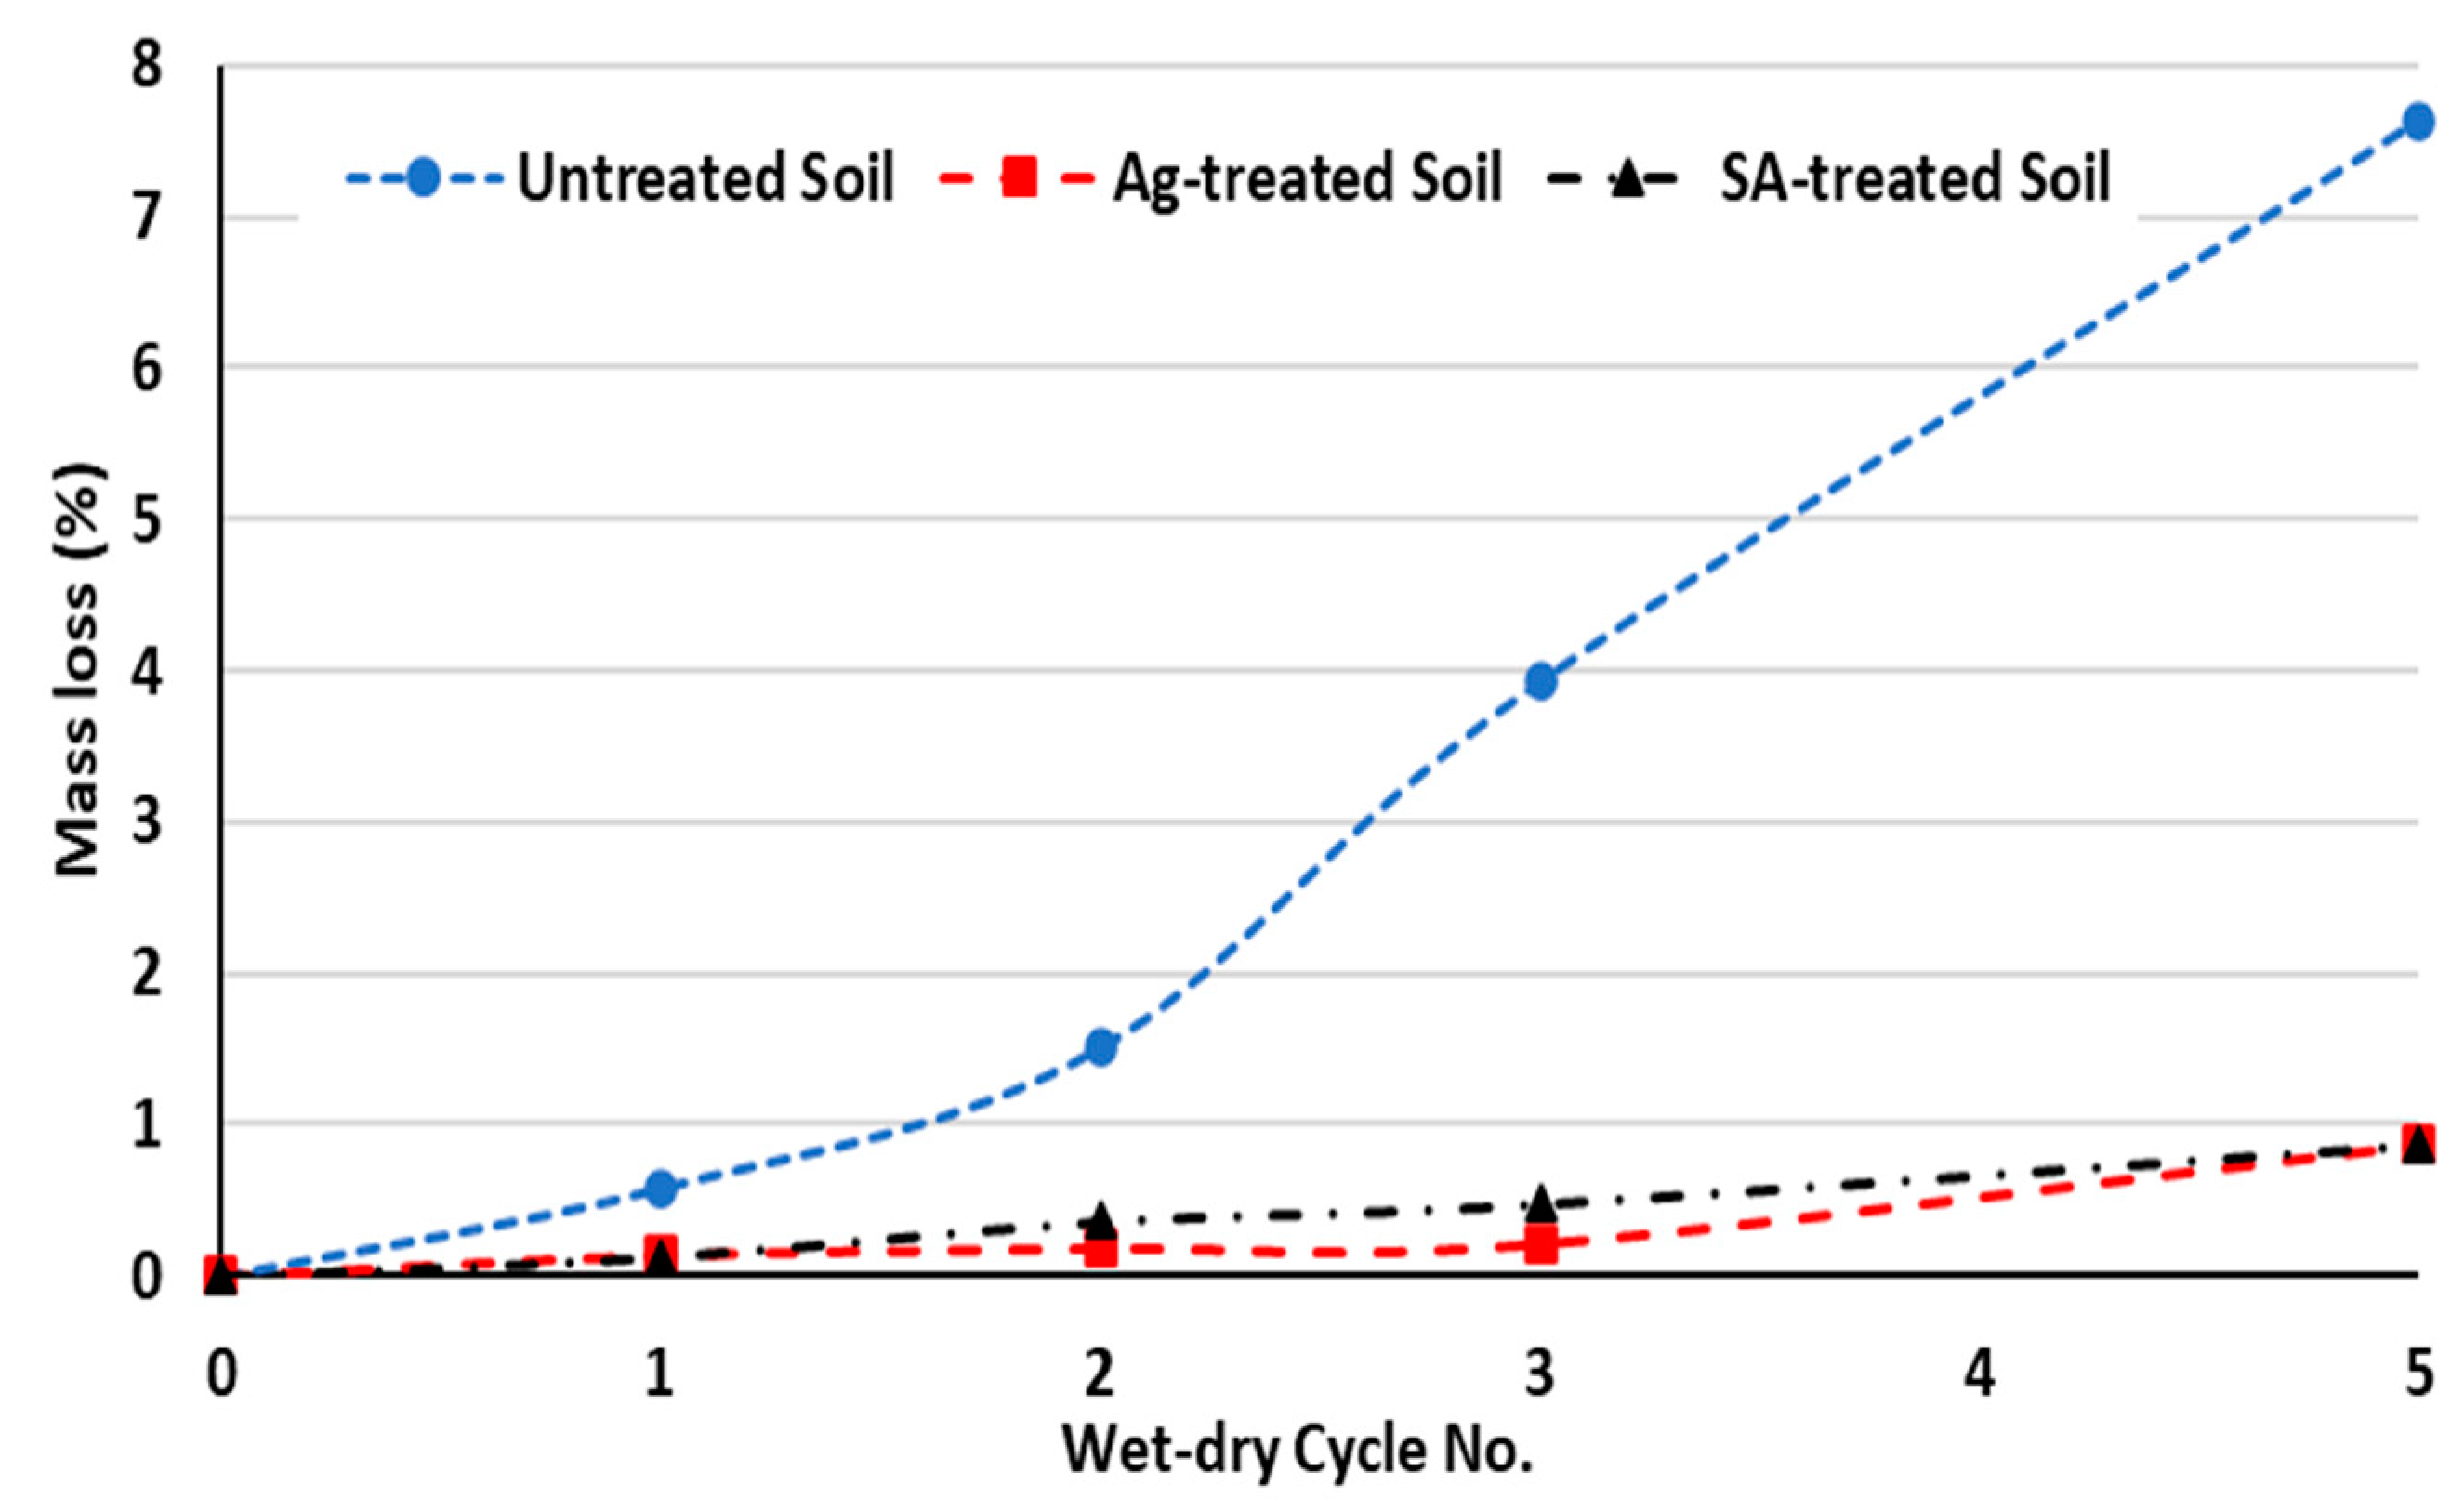
3.1.4. Wet–Dry Cycles
3.2. Microstructure and Interaction Model
3.2.1. Kaolinite and Sodium Alginate Composite (Kaolinite/SA Composite)
- (a)
- Hydrogen bonding: effective hydrogen bonds can be formed between the surface hydroxyl groups of kaolinite (alominols) and the ketone (in the carboxylate group) and the hydroxyl functional groups in the sodium alginate structure (either by intercalating or entering the polymer chain of sodium alginate within the kaolinite plates or by hydrogen bonding between SA and the outer surface of the kaolinite).
- (b)
- Electrostatic attraction: carboxylate functional groups bear negative charge (–COO–) onto the structure of the sodium alginate chain, which can have an effective electrostatic interaction with the positive surface charge of the kaolinite layer, as shown in Figure 10.
- (c)
- Hydrophobic bonding: hydrophobic bonding between the carbon chain of the sodium alginate polymer and the outer surface of the kaolinite layers without functional groups (uncharged basal surface of kaolinite) can also be established in the kaolinite/sodium alginate composite structure.
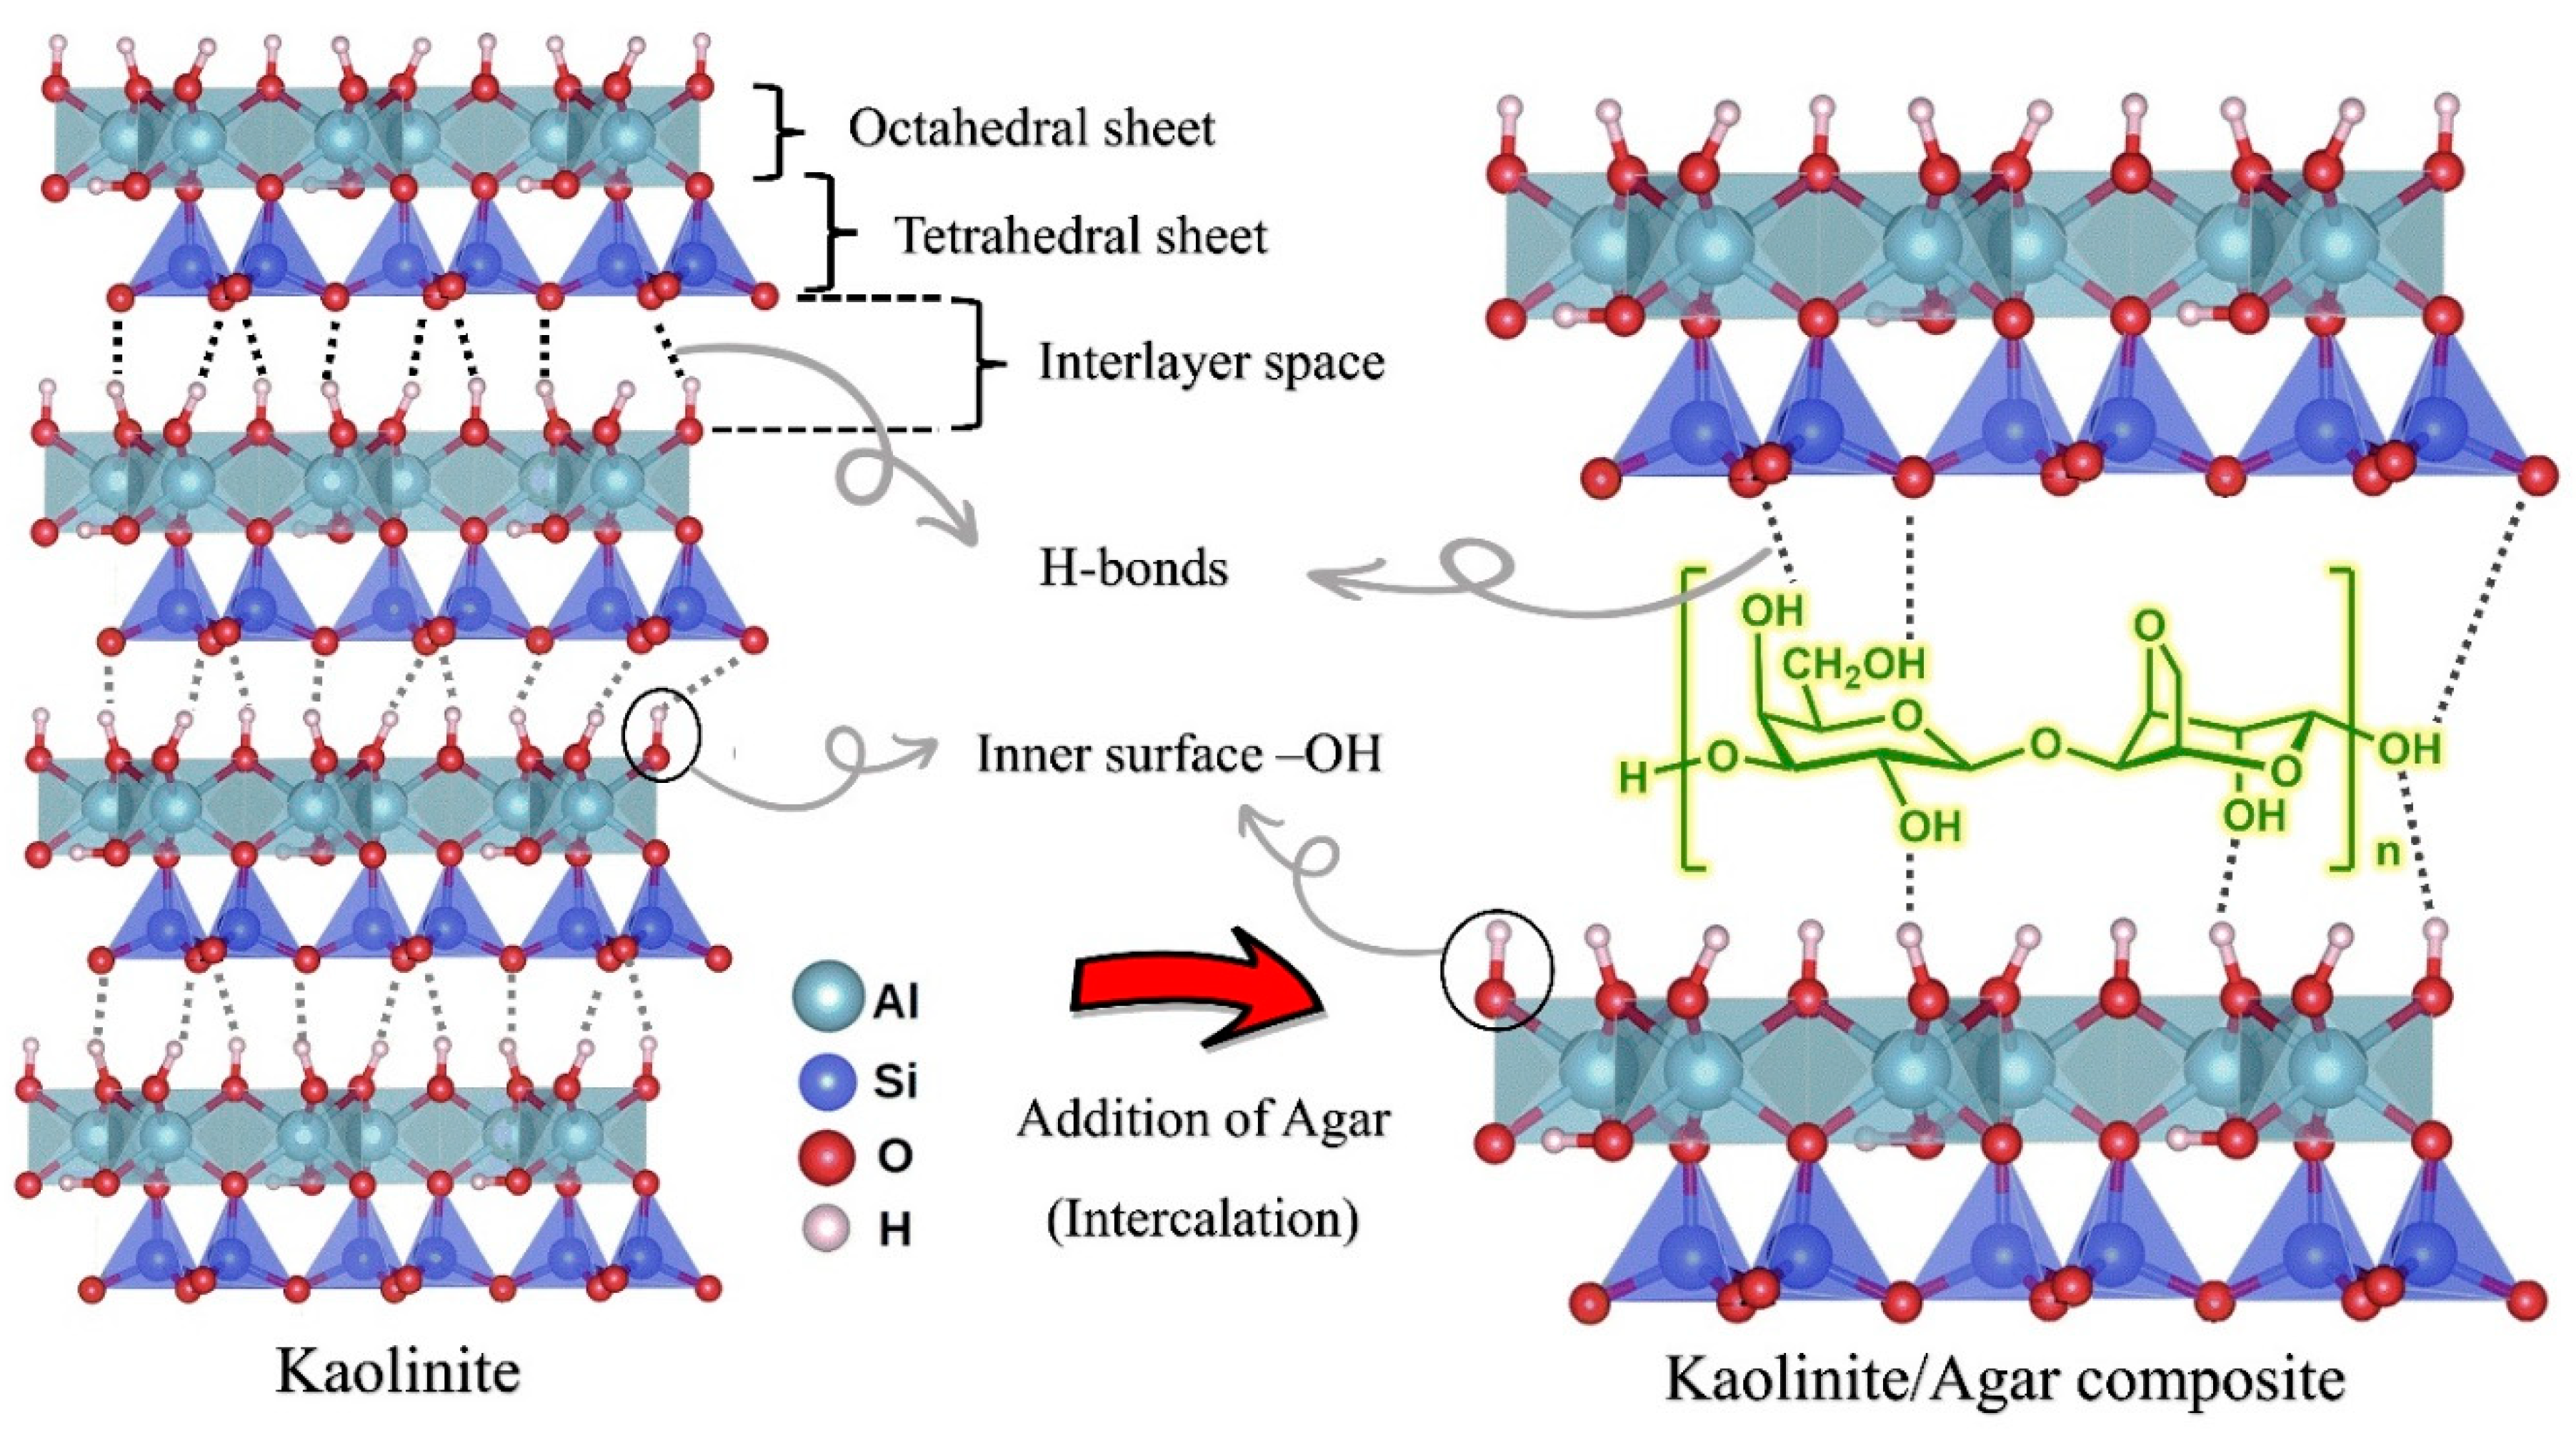
3.2.2. Kaolinite and Agar Composite (Kaolinite/Agar Composite)
3.2.3. River Sand and Agar/Sodium Alginate Composite
- (a)
- Hydrophobic bonding: since agar is an organic linear polymer without an electric charge and RS grains are assumed to be uncharged, hydrophobic interaction between them can be assumed when they come in contact on a microscopic surface. This is the predominant interaction in such compounds with a same nonpolar of uncharged nature.
- (b)
- Interfacial force of RS/agar fibers: the interfacial mechanical interaction between organic fibers of agar and particles of RS can lead to the formation of a homogeneous composite structure. The retaining mechanical force created by the placement of polymer fibers around the RS grains is a positive driving force that improves the mechanical strength of the grains in the composite structure compared to the pure structure of the RS in the absence of fibers.
3.3. ATR-FTIR Spectra of K1S3-SA and K1S3-Ag
4. Conclusions
Author Contributions
Funding
Data Availability Statement
Acknowledgments
Conflicts of Interest
Appendix A
References
- Hosseinpour, Z.; Najafpour-Darzi, G.; Latifi, N.; Morowvat, M.; Manahiloh, K.N. Synthesis of a biopolymer via a novel strain of Pantoea as a soil stabilizer. Transp. Geotech. 2021, 26, 100425. [Google Scholar] [CrossRef]
- Ashraf, M.S.; Azahar, S.B.; Yusof, N.Z. Soil improvement using MICP and biopolymers: A review. In Proceedings of the IOP Conference Series: Materials Science and Engineering, Busan, Republic of Korea, 25–27 August 2017; p. 012058. [Google Scholar]
- Bahmani, M.; Fatehi, H.; Noorzad, A.; Hamedi, J. Biological soil improvement using new environmental bacteria isolated from northern Iran. Environ. Geotech. 2019, 9, 534–546. [Google Scholar] [CrossRef]
- Bahmani, M.; Noorzad, A.; Hamedi, J.; Sali, F. The role of bacillus pasteurii on the change of parameters of sands according to temperatur compresion and wind erosion resistance. J. CleanWAS 2017, 1, 1–5. [Google Scholar] [CrossRef]
- Senian, N.; Li, P.Y.; Hei, N.L.; Leong, D.O.E.; Ginjom, I.R.H.; Omoregie, P.M.N.A.I. Ureolytic bacteria isolated from Sarawak limestone caves show high urease enzyme activity comparable to that of Sporosarcina pasteurii (DSM 33). Malays. J. Microbiol. 2016, 12, 463–470. [Google Scholar]
- Omoregie, A.I.; Palombo, E.A.; Ong, D.E.L.; Nissom, P.M. A feasible scale-up production of Sporosarcina pasteurii using custom-built stirred tank reactor for in-situ soil biocementation. Biocatal. Agric. Biotechnol. 2020, 24, 101544. [Google Scholar] [CrossRef]
- Leong, H.; Ong, D.E.L.; Sanjayan, J.; Nazari, A. A genetic programming predictive model for parametric study of factors affecting strength of geopolymers. RSC Adv. 2015, 5, 85630–85639. [Google Scholar] [CrossRef]
- Ingle, P.U.; Shende, S.S.; Shingote, P.R.; Mishra, S.S.; Sarda, V.; Wasule, D.L.; Rajput, V.D.; Minkina, T.; Rai, M.; Sushkova, S. Chitosan nanoparticles (ChNPs): A versatile growth promoter in modern agricultural production. Heliyon 2022, 8, e11893. [Google Scholar] [CrossRef]
- Tran, A.T.P.; Chang, I.; Cho, G.-C. Soil water retention and vegetation survivability improvement using microbial biopolymers in drylands. Geomech. Eng. 2019, 17, 475–483. [Google Scholar]
- Chang, I.; Prasidhi, A.K.; Im, J.; Shin, H.-D.; Cho, G.-C. Soil treatment using microbial biopolymers for anti-desertification purposes. Geoderma 2015, 253, 39–47. [Google Scholar] [CrossRef]
- Fatehi, H.; Abtahi, S.M.; Hashemolhosseini, H.; Hejazi, S.M. A novel study on using protein based biopolymers in soil strengthening. Constr. Build. Mater. 2018, 167, 813–821. [Google Scholar] [CrossRef]
- Shabani, K.; Bahmani, M.; Fatehi, H.; Chang, I. Improvement of the geotechnical engineering properties of dune sand using a plant-based biopolymer named serish. Geomech. Eng. 2022, 29, 535–548. [Google Scholar]
- Chang, I.; Im, J.; Lee, S.-W.; Cho, G.-C. Strength durability of gellan gum biopolymer-treated Korean sand with cyclic wetting and drying. Constr. Build. Mater. 2017, 143, 210–221. [Google Scholar] [CrossRef] [Green Version]
- Chang, I.; Im, J.; Prasidhi, A.K.; Cho, G.-C. Effects of Xanthan gum biopolymer on soil strengthening. Constr. Build. Mater. 2015, 74, 65–72. [Google Scholar] [CrossRef]
- Rashid, A.S.A.; Latifi, N.; Meehan, C.L.; Manahiloh, K.N. Sustainable improvement of tropical residual soil using an environmentally friendly additive. Geotech. Geol. Eng. 2017, 35, 2613–2623. [Google Scholar] [CrossRef]
- Fatehi, H.; Bahmani, M.; Noorzad, A. Strengthening of Dune Sand with Sodium Alginate Biopolymer. In Proceedings of the Geo-Congress 2019: Soil Improvement, Philadelphia, PA, USA, 24–27 March 2019; pp. 157–166. [Google Scholar]
- Fatehi, H.; Ong, D.E.L.; Yu, J.; Chang, I. Biopolymers as Green Binders for Soil Improvement in Geotechnical Applications: A Review. Geosciences 2021, 11, 291. [Google Scholar] [CrossRef]
- Shariatmadari, N.; Reza, M.; Tasuji, A.; Ghadir, P.; Javadi, A.A. Experimental study on the effect of chitosan biopolymer on sandy soil stabilization. In Proceedings of the E3S Web of Conferences, Kenitra, Morocco, 25–27 December 2020; p. 06007. [Google Scholar]
- Hataf, N.; Ghadir, P.; Ranjbar, N. Investigation of soil stabilization using chitosan biopolymer. J. Clean. Prod. 2018, 170, 1493–1500. [Google Scholar] [CrossRef]
- Cabalar, A.F.; Awraheem, M.H.; Khalaf, M.M. Geotechnical properties of a low-plasticity clay with biopolymer. J. Mater. Civ. Eng. 2018, 30, 04018170. [Google Scholar] [CrossRef]
- AzariJafari, H.; Amiri, M.J.T.; Ashrafian, A.; Rasekh, H.; Barforooshi, M.J.; Berenjian, J. Ternary blended cement: An eco-friendly alternative to improve resistivity of high-performance self-consolidating concrete against elevated temperature. J. Clean. Prod. 2019, 223, 575–586. [Google Scholar] [CrossRef]
- Armistead, S.J.; Rawlings, A.E.; Smith, C.C.; Staniland, S.S. Biopolymer stabilization/solidification of soils: A rapid, micro-macro, cross-disciplinary approach. Environ. Sci. Technol. 2020, 54, 13963–13972. [Google Scholar] [CrossRef]
- Armistead, S.J.; Smith, C.C.; Staniland, S.S. Sustainable biopolymer soil stabilization in saline rich, arid conditions: A ‘micro to macro’approach. Sci. Rep. 2022, 12, 2880. [Google Scholar] [CrossRef]
- Smitha, S.; Rangaswamy, K. Effect of biopolymer treatment on pore pressure response and dynamic properties of silty sand. J. Mater. Civ. Eng. 2020, 32, 04020217. [Google Scholar] [CrossRef]
- Smitha, S.; Rangaswamy, K.; Keerthi, D. Triaxial test behaviour of silty sands treated with agar biopolymer. Int. J. Geotech. Eng. 2021, 15, 484–495. [Google Scholar] [CrossRef]
- Chang, I.; Prasidhi, A.K.; Im, J.; Cho, G.-C. Soil strengthening using thermo-gelation biopolymers. Constr. Build. Mater. 2015, 77, 430–438. [Google Scholar] [CrossRef]
- Arab, M.G.; Mousa, R.; Gabr, A.; Azam, A.; El-Badawy, S.; Hassan, A. Resilient Behavior of Sodium Alginate–Treated Cohesive Soils for Pavement Applications. J. Mater. Civ. Eng. 2019, 31, 04018361. [Google Scholar] [CrossRef]
- Torfi, S.; Khayat, N.; Horpibulsuk, S. Sustainable stabilization of compacted clay using sodium alginate for subgrade application. Int. J. Geosynth. Ground Eng. 2021, 7, 82. [Google Scholar] [CrossRef]
- Zhao, Y.; Zhuang, J.; Wang, Y.; Jia, Y.; Niu, P.; Jia, K. Improvement of loess characteristics using sodium alginate. Bull. Eng. Geol. Environ. 2019, 79, 1879–1891. [Google Scholar] [CrossRef]
- Lee, M.; Kwon, Y.-M.; Park, D.-Y.; Chang, I.; Cho, G.-C. Durability and strength degradation of xanthan gum based biopolymer treated soil subjected to severe weathering cycles. Sci. Rep. 2022, 12, 19453. [Google Scholar] [CrossRef] [PubMed]
- Ayeldeen, M.; Negm, A.; El Sawwaf, M.; Gädda, T. Laboratory study of using biopolymer to reduce wind erosion. Int. J. Geotech. Eng. 2018, 12, 228–240. [Google Scholar] [CrossRef]
- Chen, R.; Lee, I.; Zhang, L. Biopolymer stabilization of mine tailings for dust control. J. Geotech. Geoenviron. Eng. 2015, 141, 04014100. [Google Scholar] [CrossRef]
- Nouri, H.; Ghadir, P.; Fatehi, H.; Shariatmadari, N.; Saberian, M. Effects of Protein-Based Biopolymer on Geotechnical Properties of Salt-Affected Sandy Soil. Geotech. Geol. Eng. 2022, 40, 5739–5753. [Google Scholar] [CrossRef]
- Mohammadi Nia, M.; Moradi, S. Artificial Neural Network–Based Predictive Tool for Modeling of Self-Centering Endplate Connections with SMA Bolts. J. Struct. Eng. 2022, 148, 04022198. [Google Scholar] [CrossRef]
- Hernandez-Carmona, G.; Freile-Pelegrín, Y.; Hernández-Garibay, E. Conventional and alternative technologies for the extraction of algal polysaccharides. In Functional Ingredients from Algae for Foods and Nutraceuticals; Elsevier: Amsterdam, The Netherlands, 2013; pp. 475–516. [Google Scholar]
- Langlois, J.; Fréon, P.; Delgenès, J.-P.; Steyer, J.-P.; Helias, A. Life cycle assessment of alginate production. In Proceedings of the 8th International Conference on LCA in the Agri-Food Sector, Saint-Malo, France, 1–4 October 2012. [Google Scholar]
- ASTM D6913-04; Standard Test Methods for Particle-Size Distribution (Gradation) of Soils Using Sieve Analysis; Annual Book of ASTM Standards 409. ASTM International: West Conshohocken, PA, USA, 2009.
- ASTM D7928-21e1; Standard Test Method for Particle-Size Distribution (Gradation) of Fine-Grained Soils Using the Sedimentation (Hydrometer) Analysis. ASTM International: West Conshohocken, PA, USA, 2017.
- ASTM D698-12; Standard Test Methods for Laboratory Compaction Characteristics of Soil Using Standard Effort (12 400 Ft-lbf/ft3 (600 KN-m/m3)). ASTM International: West Conshohocken, PA, USA, 2007; Volume 1.
- ASTM D2166-06; Standard Test Method for Unconfined Compressive Strength of Cohesive soil. ASTM International: West Conshohocken, PA, USA, 2006; Volume 2166.
- ASTM D2850-15; Standard Test Method for Unconsolidated-Undrained Triaxial Compression Test on Cohesive Soils. ASTM International: West Conshohocken, PA, USA, 2007.
- Zhan, W.; Yi, H.; Song, S.; Zhao, Y.; Rao, F. Hydrophobic agglomeration behaviors of clay minerals as affected by siloxane structure. Colloids Surf. A Physicochem. Eng. Asp. 2019, 568, 36–42. [Google Scholar] [CrossRef]
- Zhang, Z.; Tao, M. Durability of cement stabilized low plasticity soils. J. Geotech. Geoenviron. Eng. 2008, 134, 203–213. [Google Scholar] [CrossRef]
- Guney, Y.; Sari, D.; Cetin, M.; Tuncan, M. Impact of cyclic wetting–drying on swelling behavior of lime-stabilized soil. Build. Environ. 2007, 42, 681–688. [Google Scholar] [CrossRef]
- Miraki, H.; Shariatmadari, N.; Ghadir, P.; Jahandari, S.; Tao, Z.; Siddique, R. Clayey soil stabilization using alkali-activated volcanic ash and slag. J. Rock Mech. Geotech. Eng. 2022, 14, 576–591. [Google Scholar] [CrossRef]
- Hecht, H.; Srebnik, S. Structural characterization of sodium alginate and calcium alginate. Biomacromolecules 2016, 17, 2160–2167. [Google Scholar] [CrossRef]
- Armisen, R.; Gaiatas, F. Agar. In Handbook of Hydrocolloids; Elsevier: Amsterdam, The Netherlands, 2009; pp. 82–107. [Google Scholar]
- Zhang, D.; Yang, F.; He, J.; Xu, L.; Wang, T.; Feng, Z.-Q.; Chang, Y.; Gong, X.; Zhang, G.; Zheng, J. Multiple physical bonds to realize highly tough and self-adhesive double-network hydrogels. ACS Appl. Polym. Mater. 2019, 2, 1031–1042. [Google Scholar] [CrossRef]
- Liu, S.; Li, Y.; Li, L. Enhanced stability and mechanical strength of sodium alginate composite films. Carbohydr. Polym. 2017, 160, 62–70. [Google Scholar] [CrossRef]
- Kristó, J.; Frost, R.L.; Felinger, A.; Mink, J. FTIR spectroscopic study of intercalated kaolinite. J. Mol. Struct. 1997, 410, 119–122. [Google Scholar] [CrossRef]
- Fleming, I.; Williams, D.H. Spectroscopic Methods in Organic Chemistry; Springer: Berlin/Heidelberg, Germany, 1966. [Google Scholar]


| Sand | D50 (mm) | Cu | Cc | Gs | Shape | UCSC | emin | emax |
| 0.49 | 2.77 | 0.91 | 2.63 | Round | SP | 0.61 | 0.76 | |
| Kaolinite | Sand fraction (%) | Silt fraction (%) | Clay fraction (%) | LL (%) | PL (%) | PI (%) | USCS | Activity = PI/Clay content (%) |
| 0.88 | 78.00 | 21.12 | 62 | 46 | 16 | MH | 0.77 |
| Sand | Kaolinite Silt | ||
|---|---|---|---|
| Chemical Analysis | Characteristic (%) | Chemical Analysis | Characteristic (%) |
| Quartz | 48.97 | Silica | 48.97 |
| Calcite | 35.19 | Aluminum | 35.19 |
| Dolomite | 2.51 | Potassium | 2.51 |
| Siderite | 0.88 | Iron | 0.88 |
| Siderite (Mg/Ca) | 0.35 | Manganese | 0.35 |
| Andradite | 0.23 | Titanium | 0.23 |
| Plagioclase | 7.7 | Calcium | 0.03 |
| K-Feldspar | 3.0 | Phosphorus | 0.05 |
| Illite | 3.2 | Manganese | 0.1 |
| Chlorite | 1.4 | Others | 11.5 |
| Label | Soil (%) | Optimum Moisture Content (%) | Maximum Dry Density (gr/cm3) | ||
|---|---|---|---|---|---|
| Sand | Silt | Clay | |||
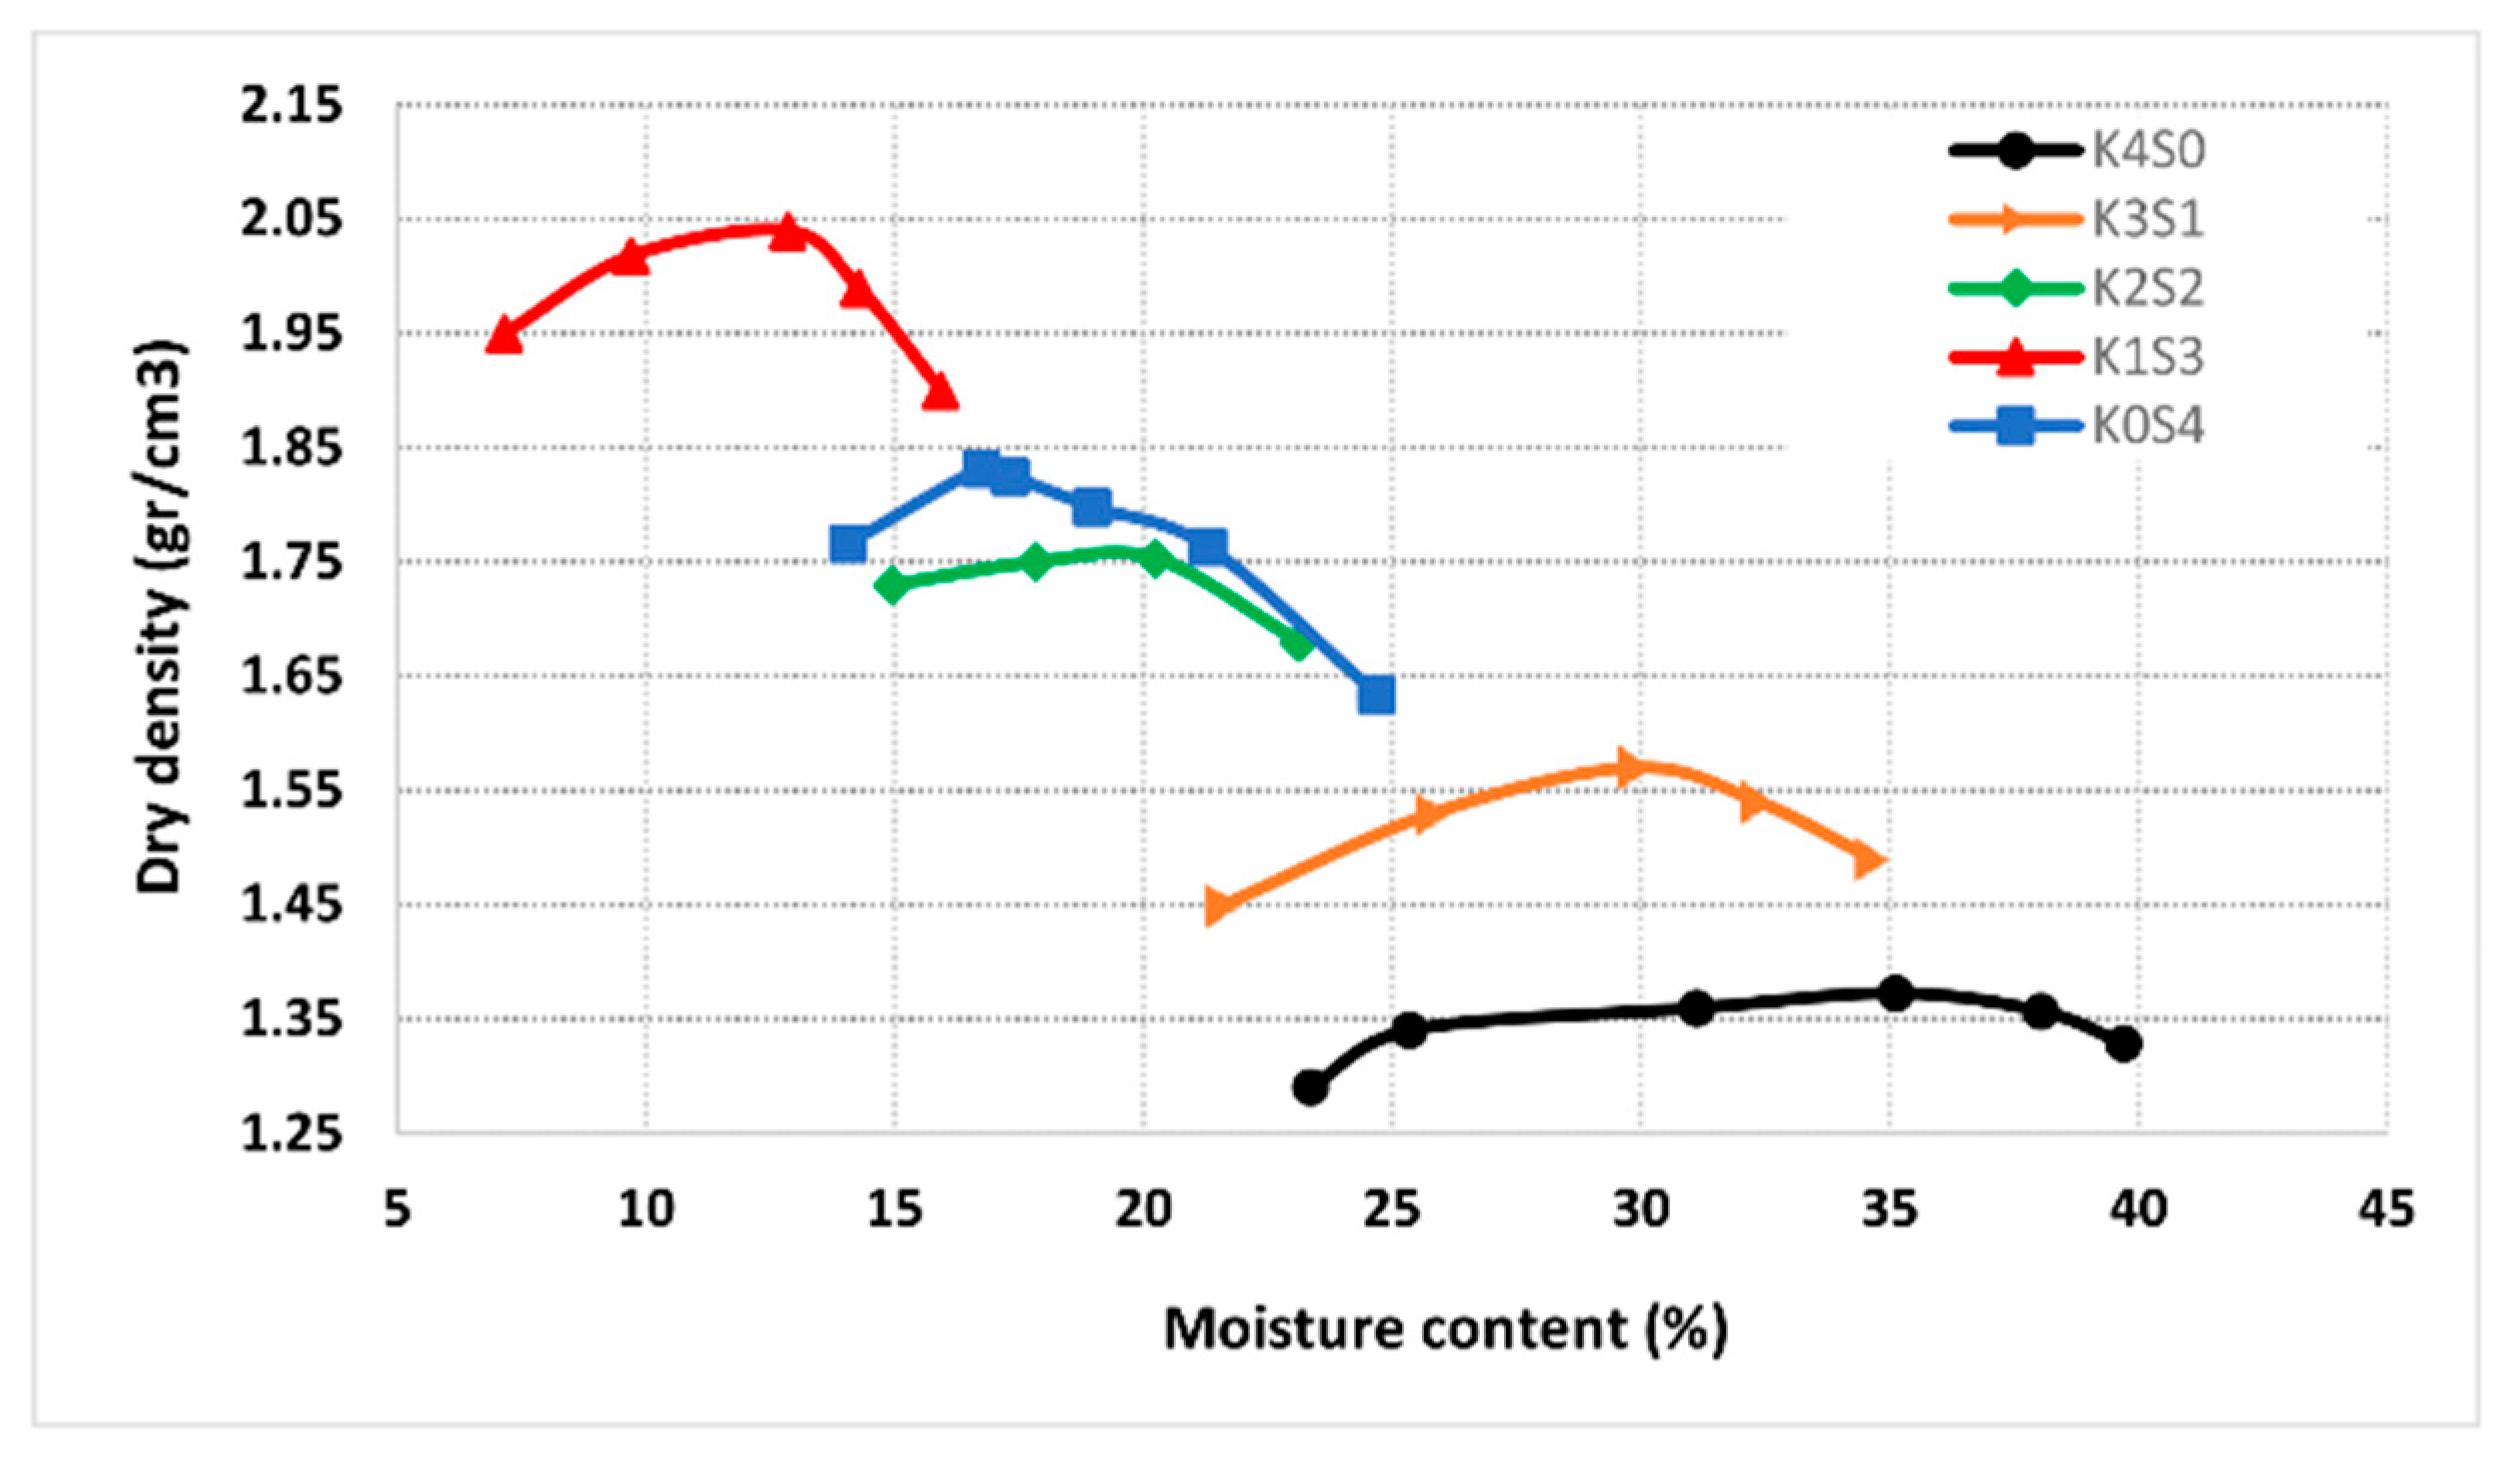
| K4S0 | 0 | 80 | 20 | 35.13 | 1.37 |
| K3S1 | 25 | 60 | 15 | 29.88 | 1.57 |
| K2S2 | 50 | 40 | 10 | 20.25 | 1.75 |
| K1S3 | 75 | 20 | 5 | 12.86 | 2.04 |
| K0S4 | 100 | 0 | 0 | 16.75 | 1.83 |
| Test Type | Biopolymer Type | Biopolymer Content (%) | Dehydration Time (Days) | Soil Type | No. of Wet–Dry Cycles |
|---|---|---|---|---|---|
| UCS | SA, Ag | 0.25, 0.5, 1, 1.5, 2 | 14 | K4S0, K1S3 | - |
| SA, Ag | 0, 0.5 | 0, 1, 3, 7, 14, 28 | K4S0, K1S3 | - | |
| SA, Ag | 0, 0.5 | 14 | K4S0, K3S1, K2S2, K1S3, K0S4 | - | |
| SA, Ag | 0, 0.5 | 14 | K1S3 | 0, 1, 2, 3, 5 | |
| FTIR | SA, Ag | 0.5 | 14 | K1S3 | - |
| SEM | SA, Ag | 0.5 | 14 | K4S0, K1S3, K0S4 | - |
Disclaimer/Publisher’s Note: The statements, opinions and data contained in all publications are solely those of the individual author(s) and contributor(s) and not of MDPI and/or the editor(s). MDPI and/or the editor(s) disclaim responsibility for any injury to people or property resulting from any ideas, methods, instructions or products referred to in the content. |
© 2023 by the authors. Licensee MDPI, Basel, Switzerland. This article is an open access article distributed under the terms and conditions of the Creative Commons Attribution (CC BY) license (https://creativecommons.org/licenses/by/4.0/).
Share and Cite
Fatehi, H.; Ong, D.E.L.; Yu, J.; Chang, I. The Effects of Particle Size Distribution and Moisture Variation on Mechanical Strength of Biopolymer-Treated Soil. Polymers 2023, 15, 1549. https://doi.org/10.3390/polym15061549
Fatehi H, Ong DEL, Yu J, Chang I. The Effects of Particle Size Distribution and Moisture Variation on Mechanical Strength of Biopolymer-Treated Soil. Polymers. 2023; 15(6):1549. https://doi.org/10.3390/polym15061549
Chicago/Turabian StyleFatehi, Hadi, Dominic E. L. Ong, Jimmy Yu, and Ilhan Chang. 2023. "The Effects of Particle Size Distribution and Moisture Variation on Mechanical Strength of Biopolymer-Treated Soil" Polymers 15, no. 6: 1549. https://doi.org/10.3390/polym15061549