
Preparation and Properties of Composite Graphene/Carbon Fiber Pouring Conductive Asphalt Concrete
 ,
,
Abstract
:1. Introduction
2. Research Content
3. Raw Material
3.1. Asphalt
3.2. Sasobit
3.3. Aggregate
- 1.
- Coarse aggregate
- 2.
- Fine aggregate
3.4. Mineral Powder
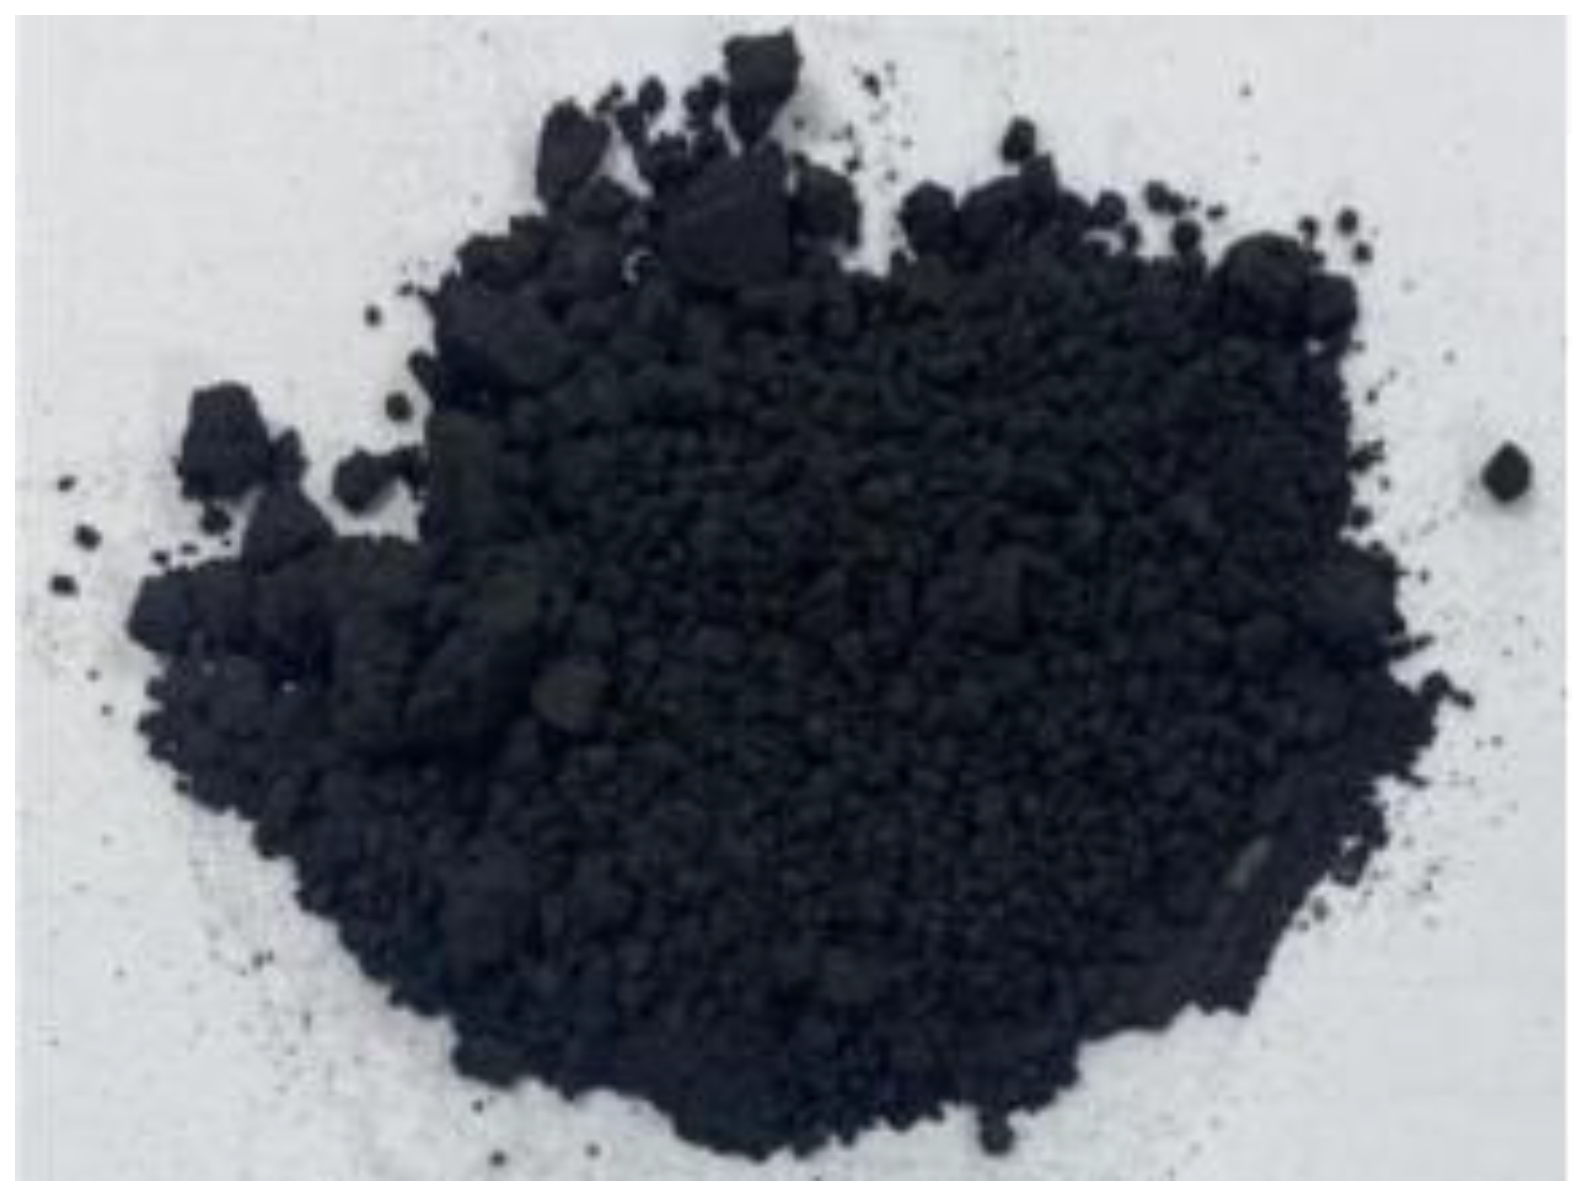
3.5. Graphene
3.6. Carbon Fiber
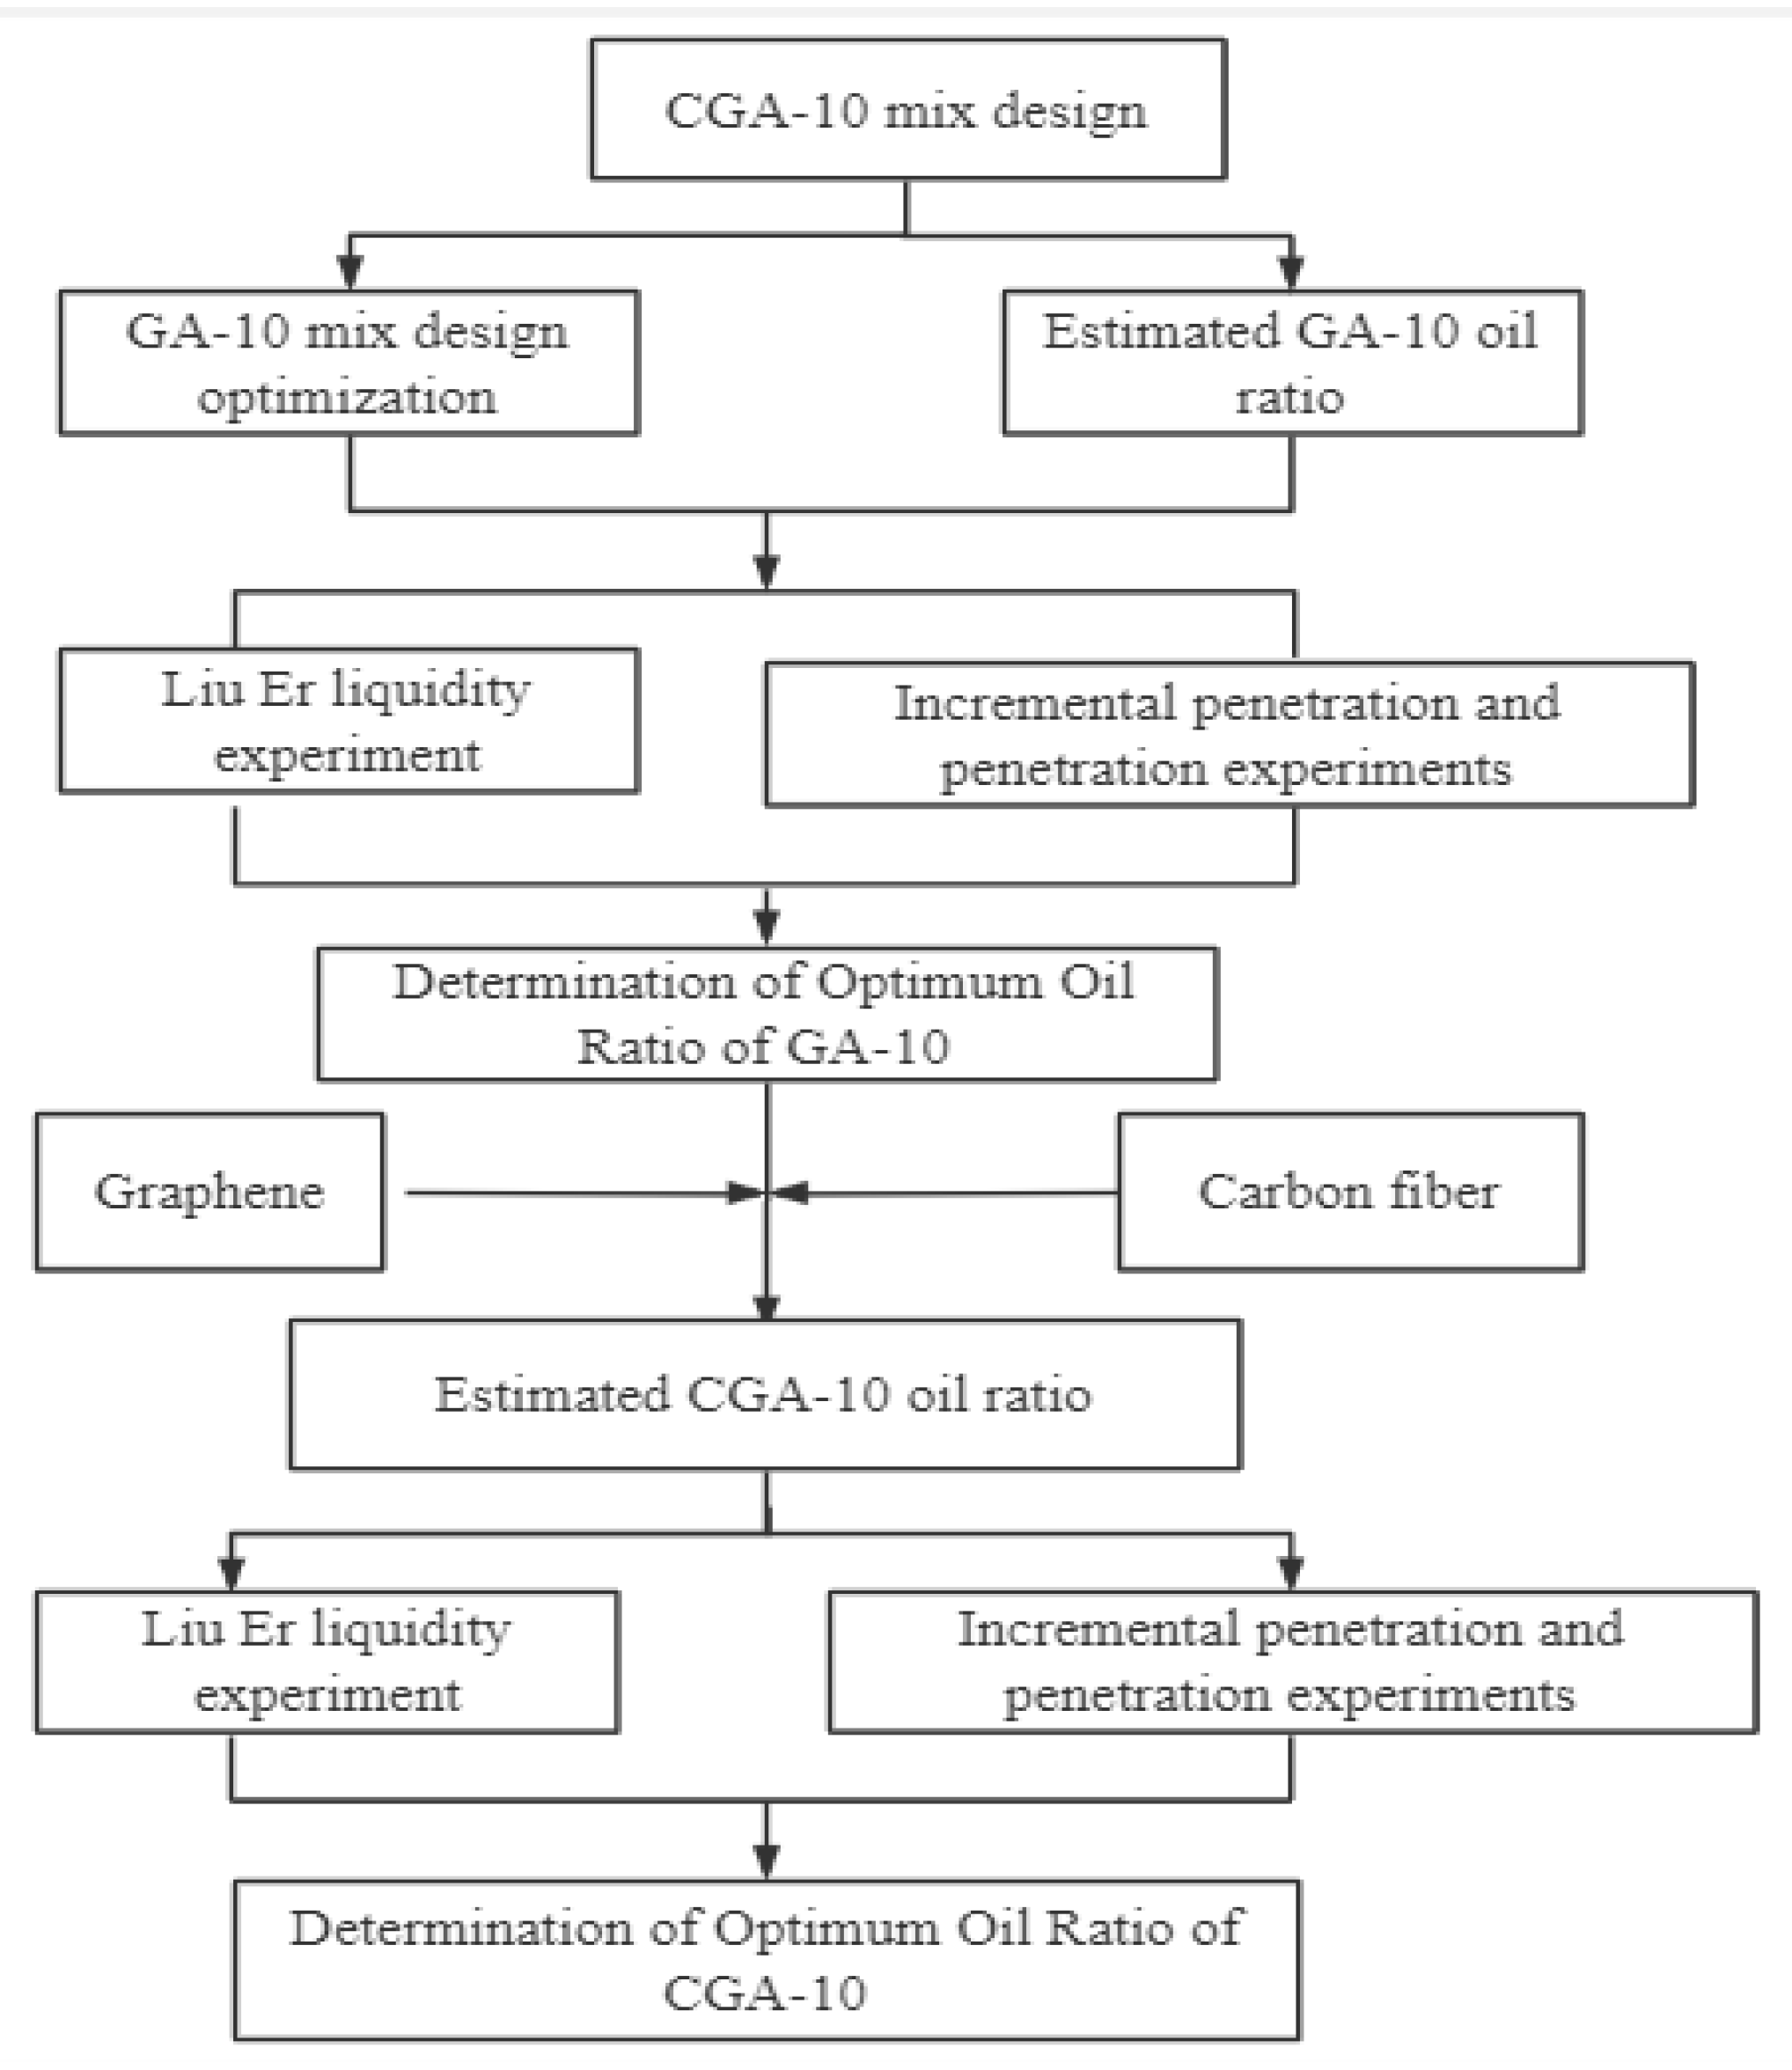
4. Mix Proportion Design of Casting Conductive Asphalt Concrete
4.1. Determination of Sasobit Content and Optimum Oil–Stone Ratio of Cast Asphalt Concrete
4.1.1. Fluidity Test of Cast Asphalt Concrete
- (1)
- The results of GA-10 liquidity test with oil–stone ratios of 8.1% and 8.9% did not meet the requirements of the specification for 5–20 s. When the oil–stone ratio is 8.3%, 8.5% and 8.7%, the fluidity is 16.3 s, 11.7 s and 8.4 s, respectively, which meet the requirements of the specification. The mixture has good fluidity.
- (2)
- When the content of Sasobit in the asphalt mixture increases from 0 to 3.0%, the fluidity of GA-10 with 8.3% oil-aggregate ratio increases by 18.2%, and when the content of Sasobit continues to increase from 3.0 to 6.0%, the fluidity increases by 5.5%. Similarly, the liquidity of GA-10 with the oil–stone ratio of 8.5% increases by 25.5% and 7.7%, and the liquidity of GA-10 with the oil–stone ratio of 8.7% increases by 29.4% and 7.1%. It can be found that when the content of Sasobit is less than 3.0%, the increase rate of mixture fluidity is the fastest. When the content exceeds 3.0%, the growth rate begins to slow down, and the improvement effect of Sasobit on mixture fluidity is weakened.
- (3)
- A Sasobit content of 3.0% can significantly improve the fluidity of GA-10, thereby reducing the difficulty of mixture paving in construction process and improving the construction efficiency. However, excessive Sasobit content in the mixture will lead to a decrease in the bearing capacity and fatigue resistance of the asphalt pavement. Therefore, the optimal Sasobit content in GA-10 is determined to be 3.0%.
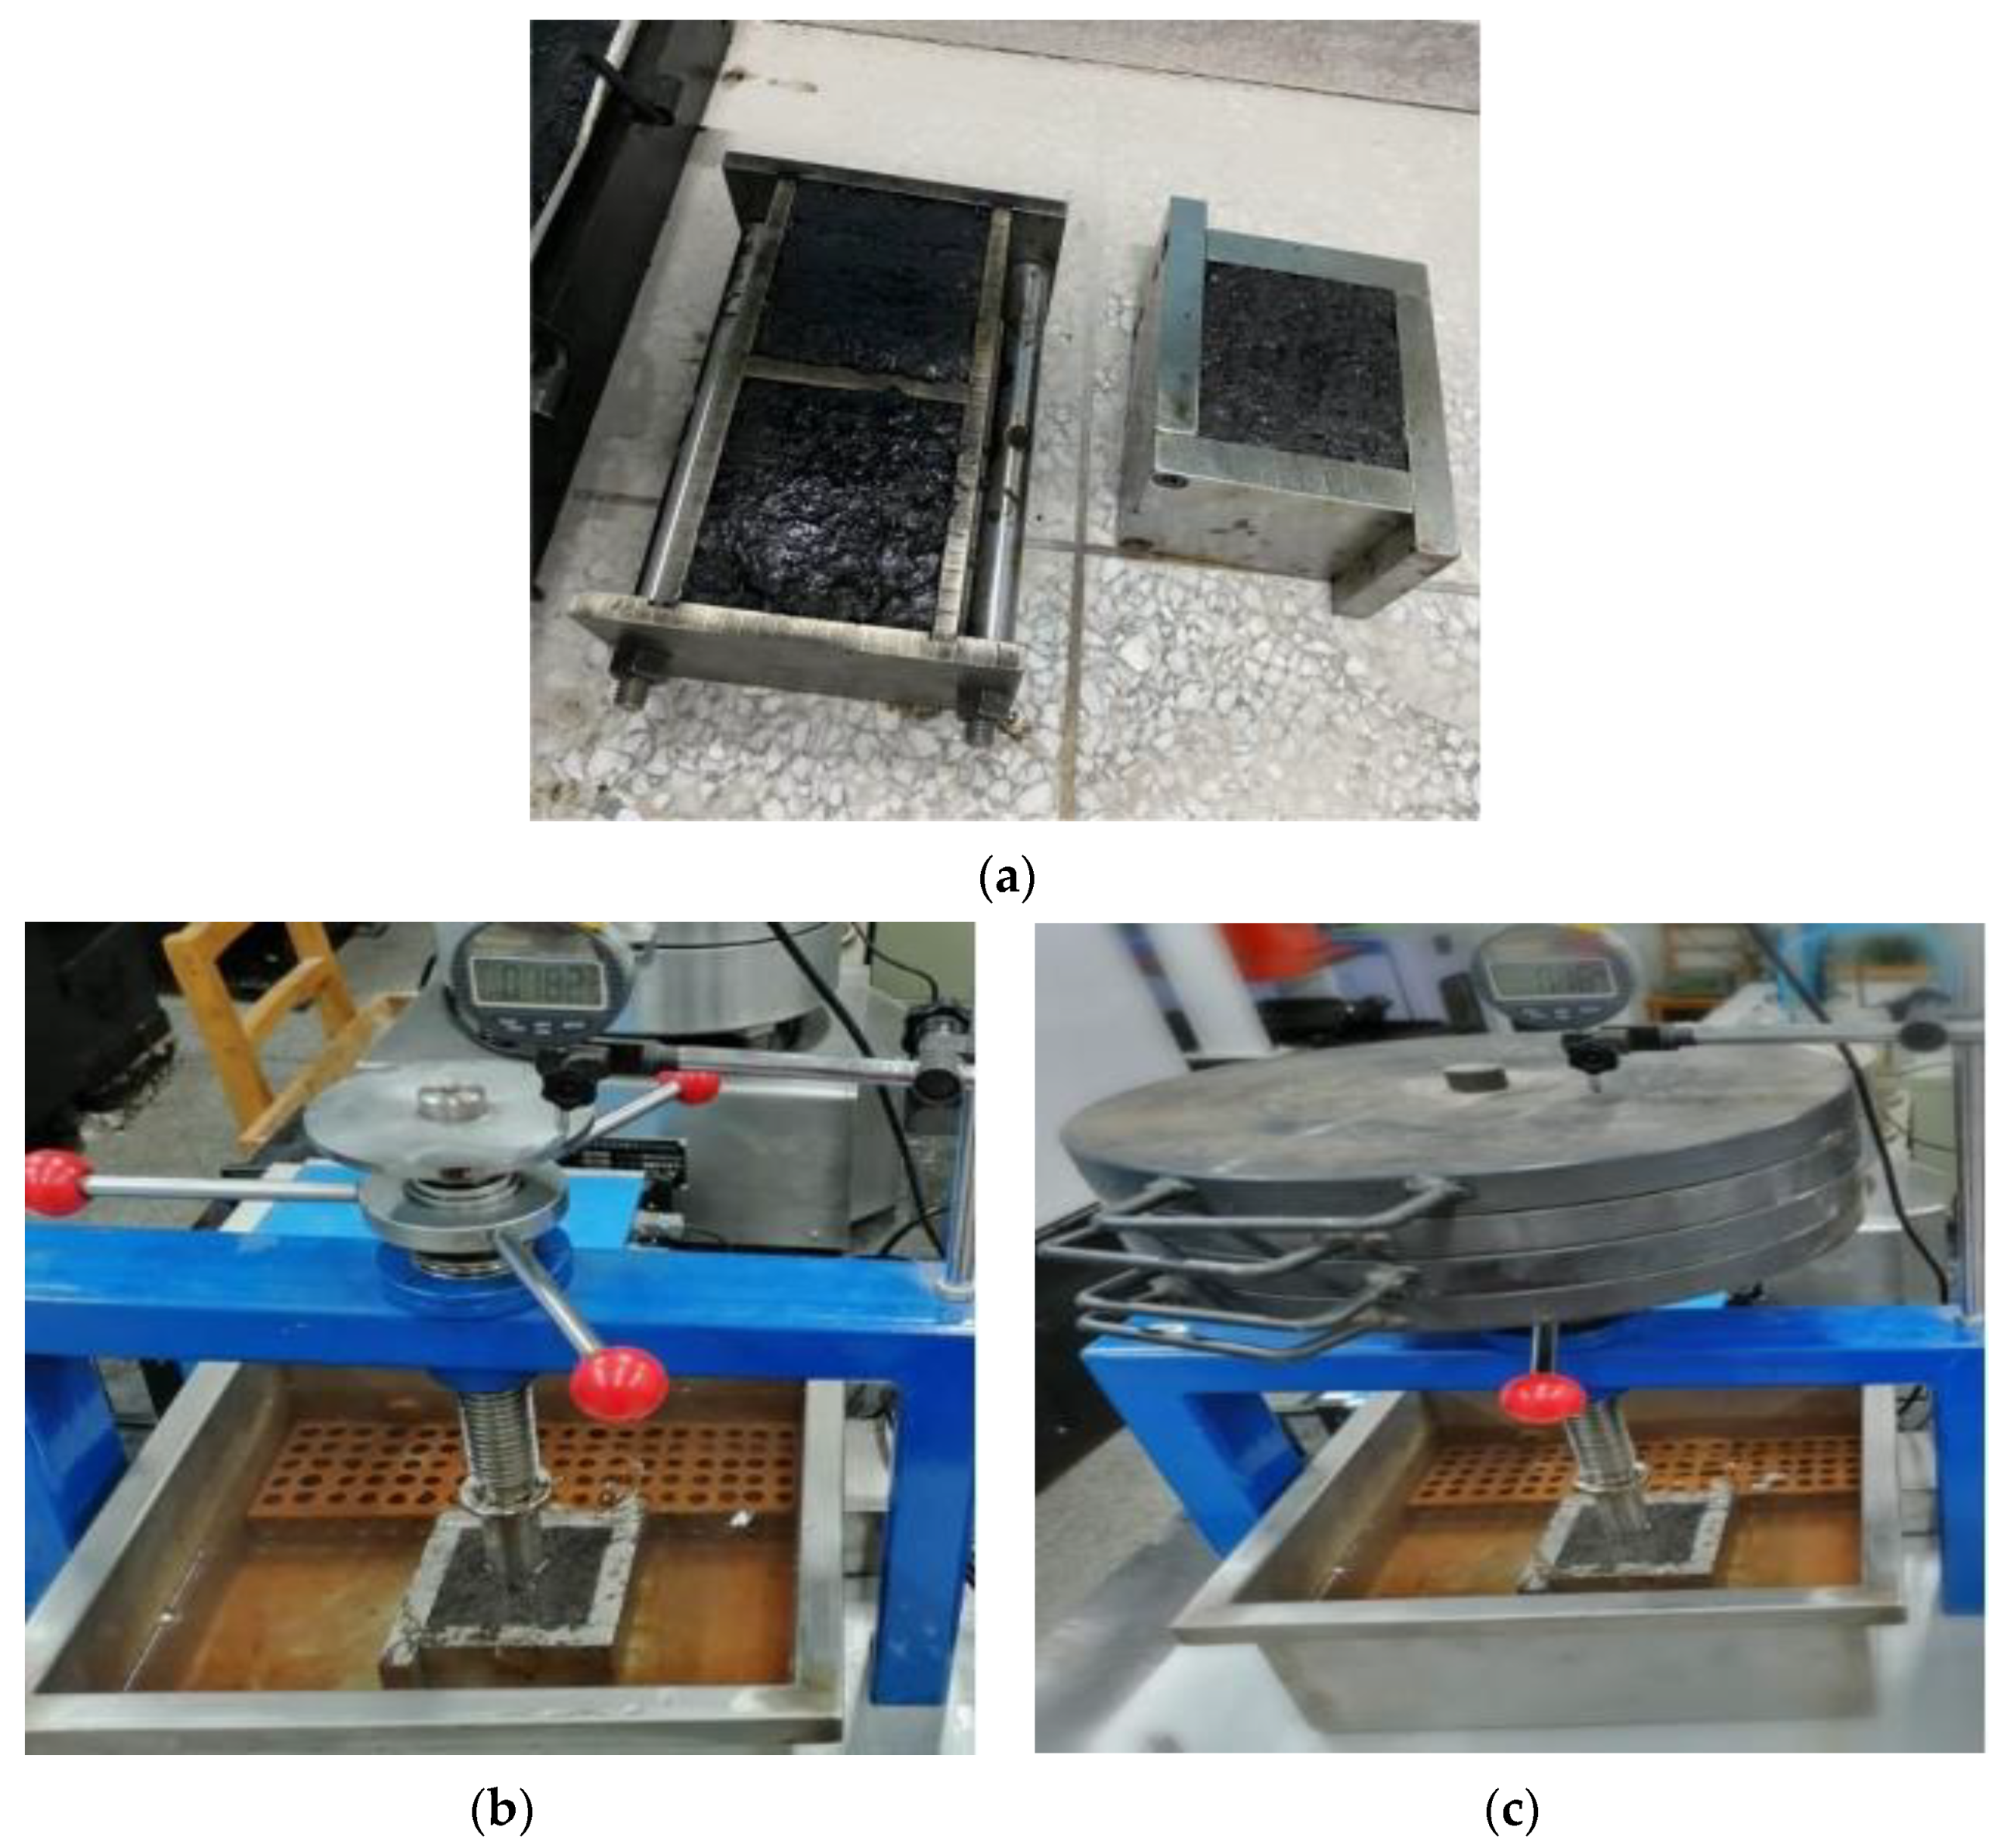
4.1.2. Poured Asphalt Concrete Penetration and Penetration Increment Test
- (1)
- Weight: 10~50 kg.
- (2)
- Dial indicator: range 0~10 mm, accuracy 0.01 mm.
- (3)
- Penetration rod: diameter 25.2 mm, mass 2.5 kg, cross-sectional area 5 cm2.
- (4)
- Constant temperature water bath: 60 °C, precision 0.1 °C.
- (5)
- Penetration test: 70.7 × 70.7 × (70.7 ± 1) mm.
4.2. Conductive Phase Material Content and Its Dispersion Method
- 1.
- Content of conductive phase materials
- 2.
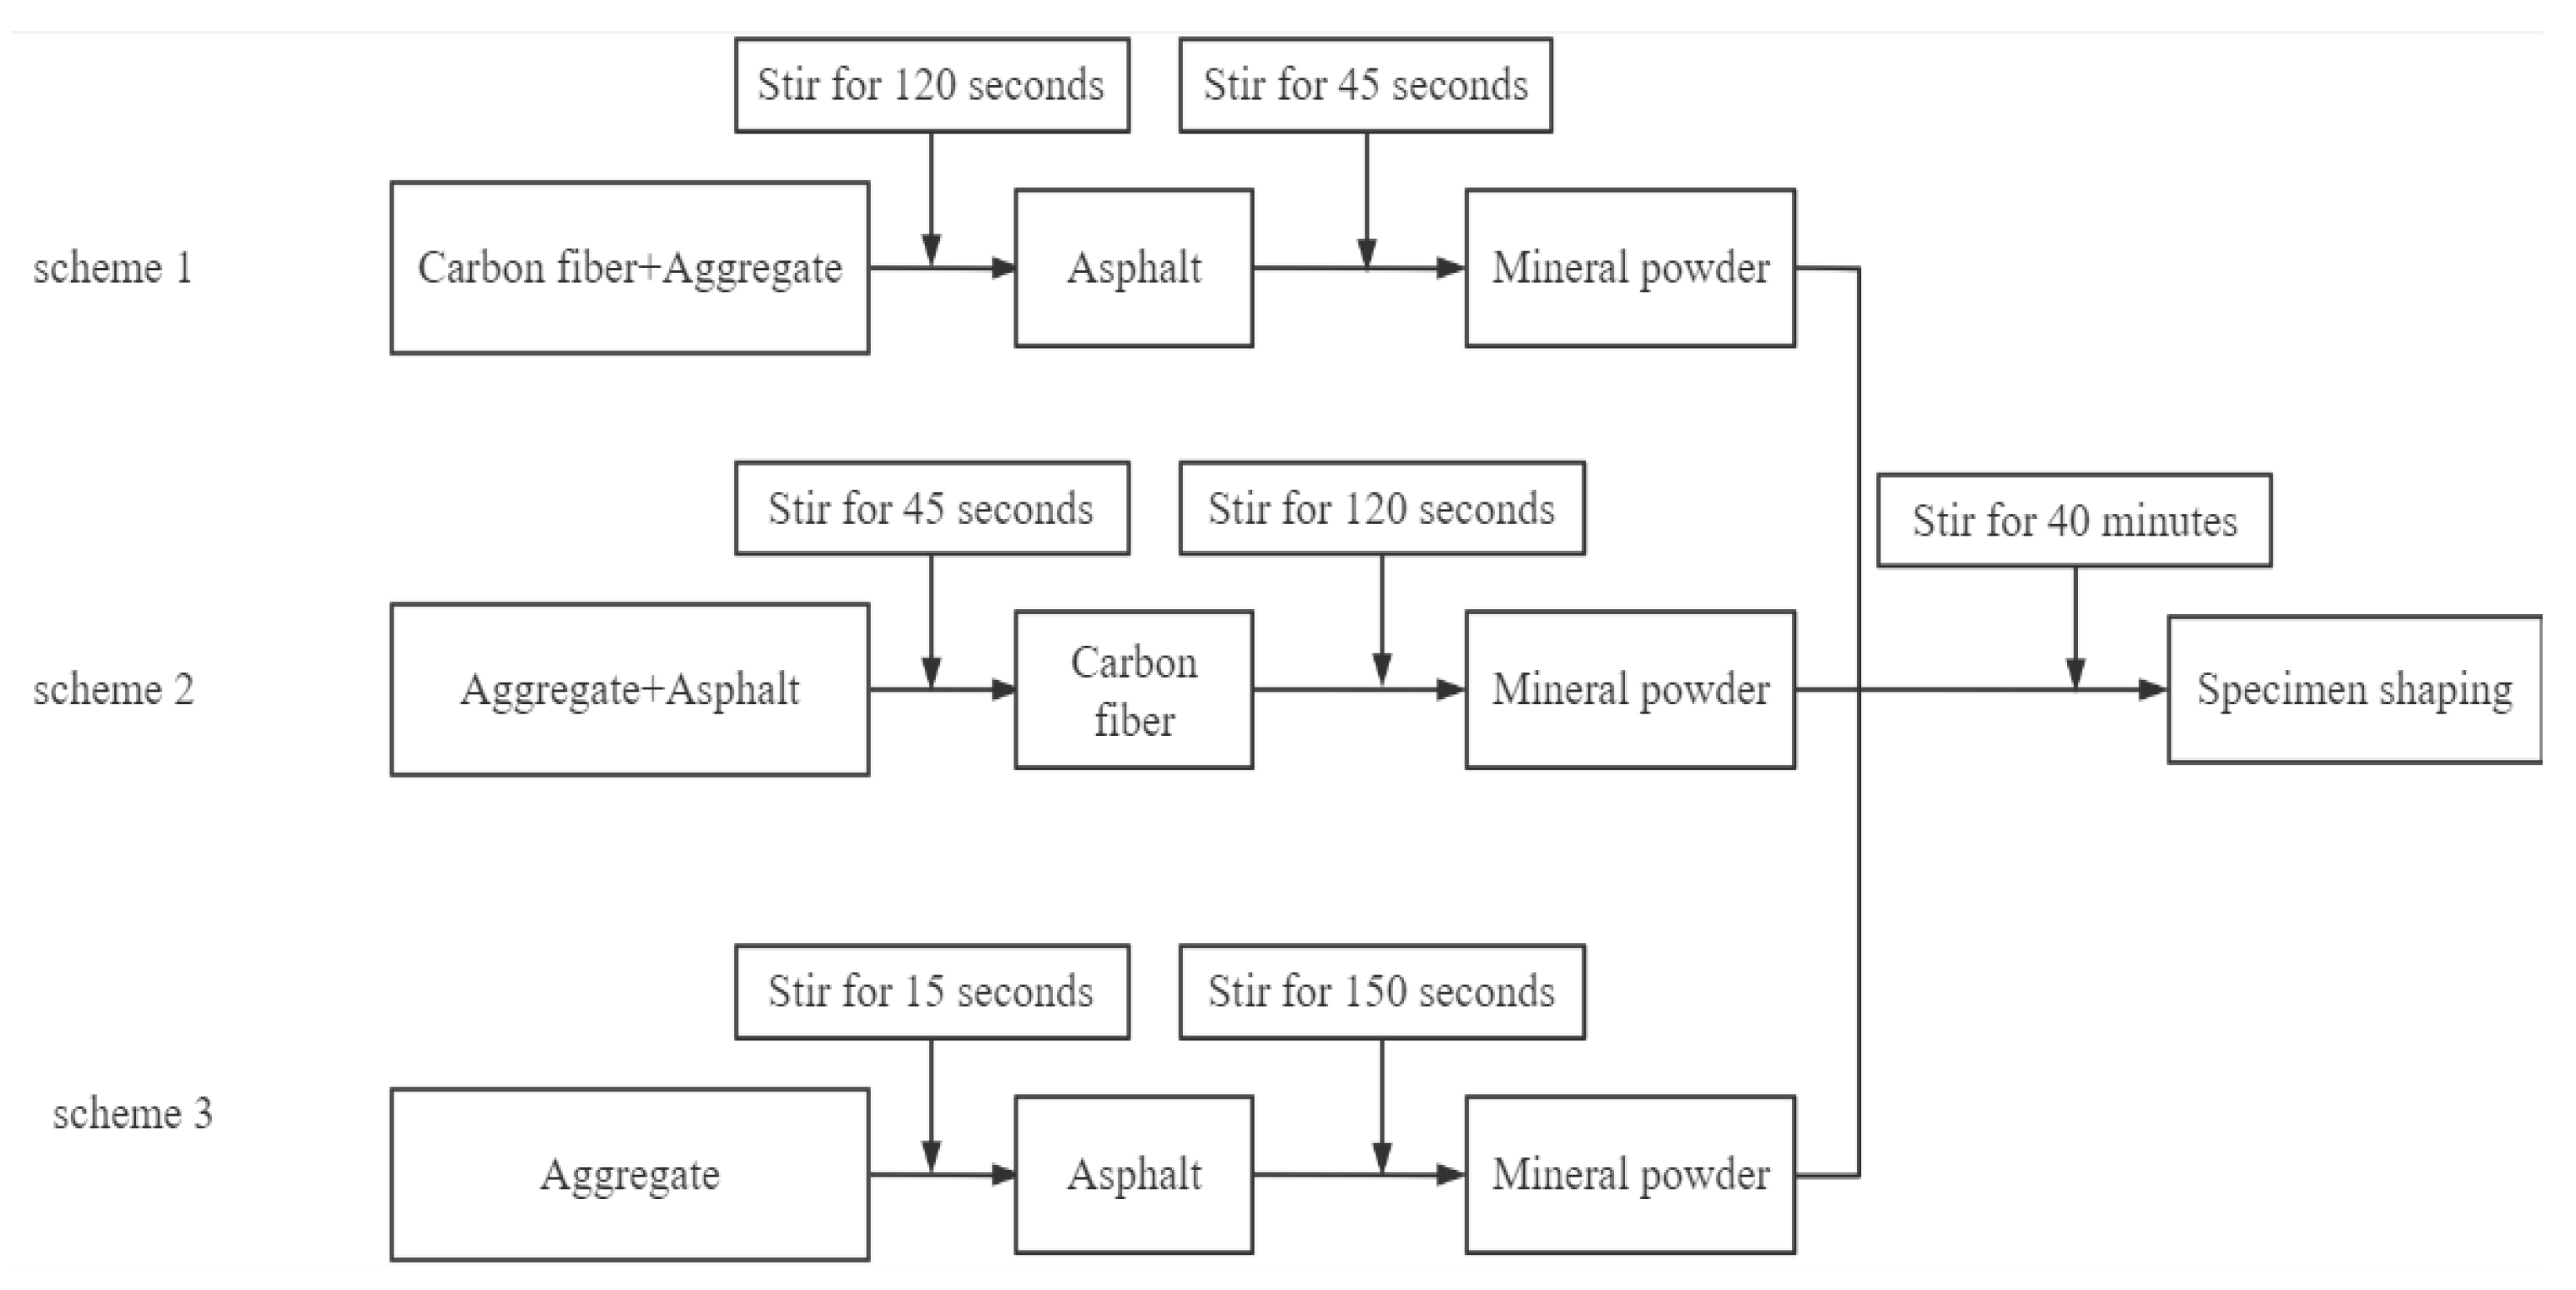
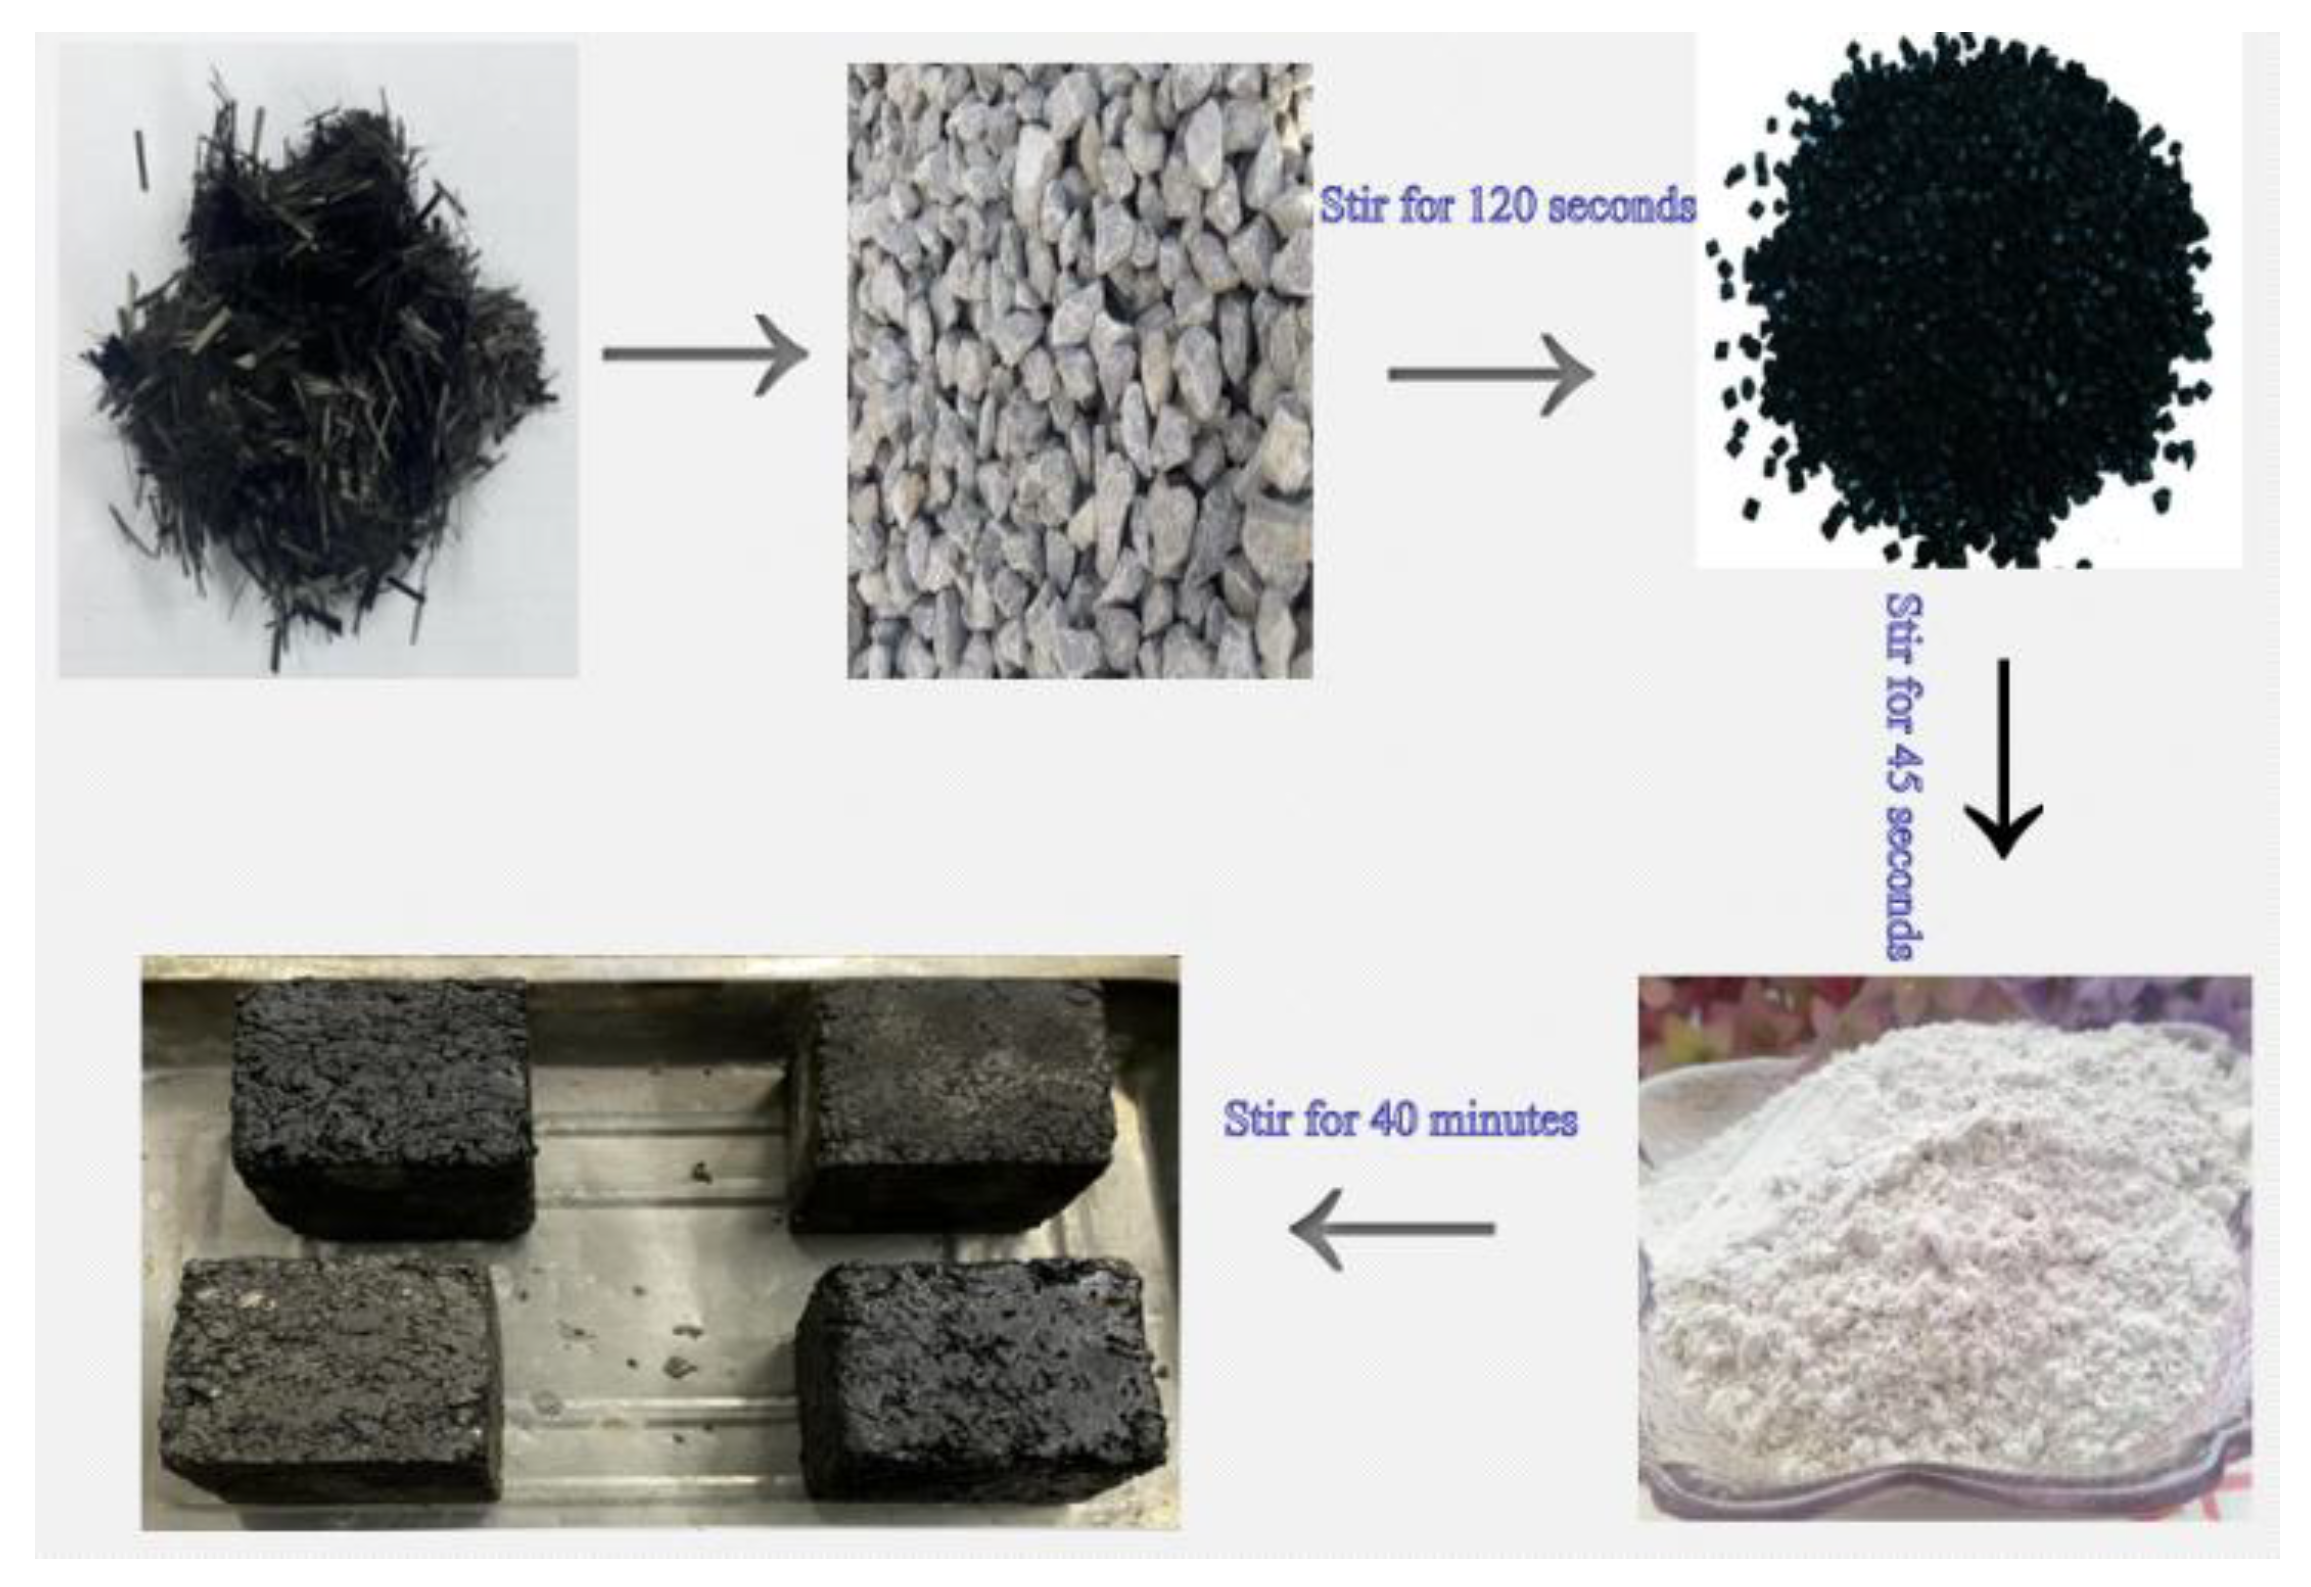
- Dispersion method of conductive phase materials
4.3. Determination of Optimum Oil–Stone Ratio of Cast Conductive Asphalt Concrete
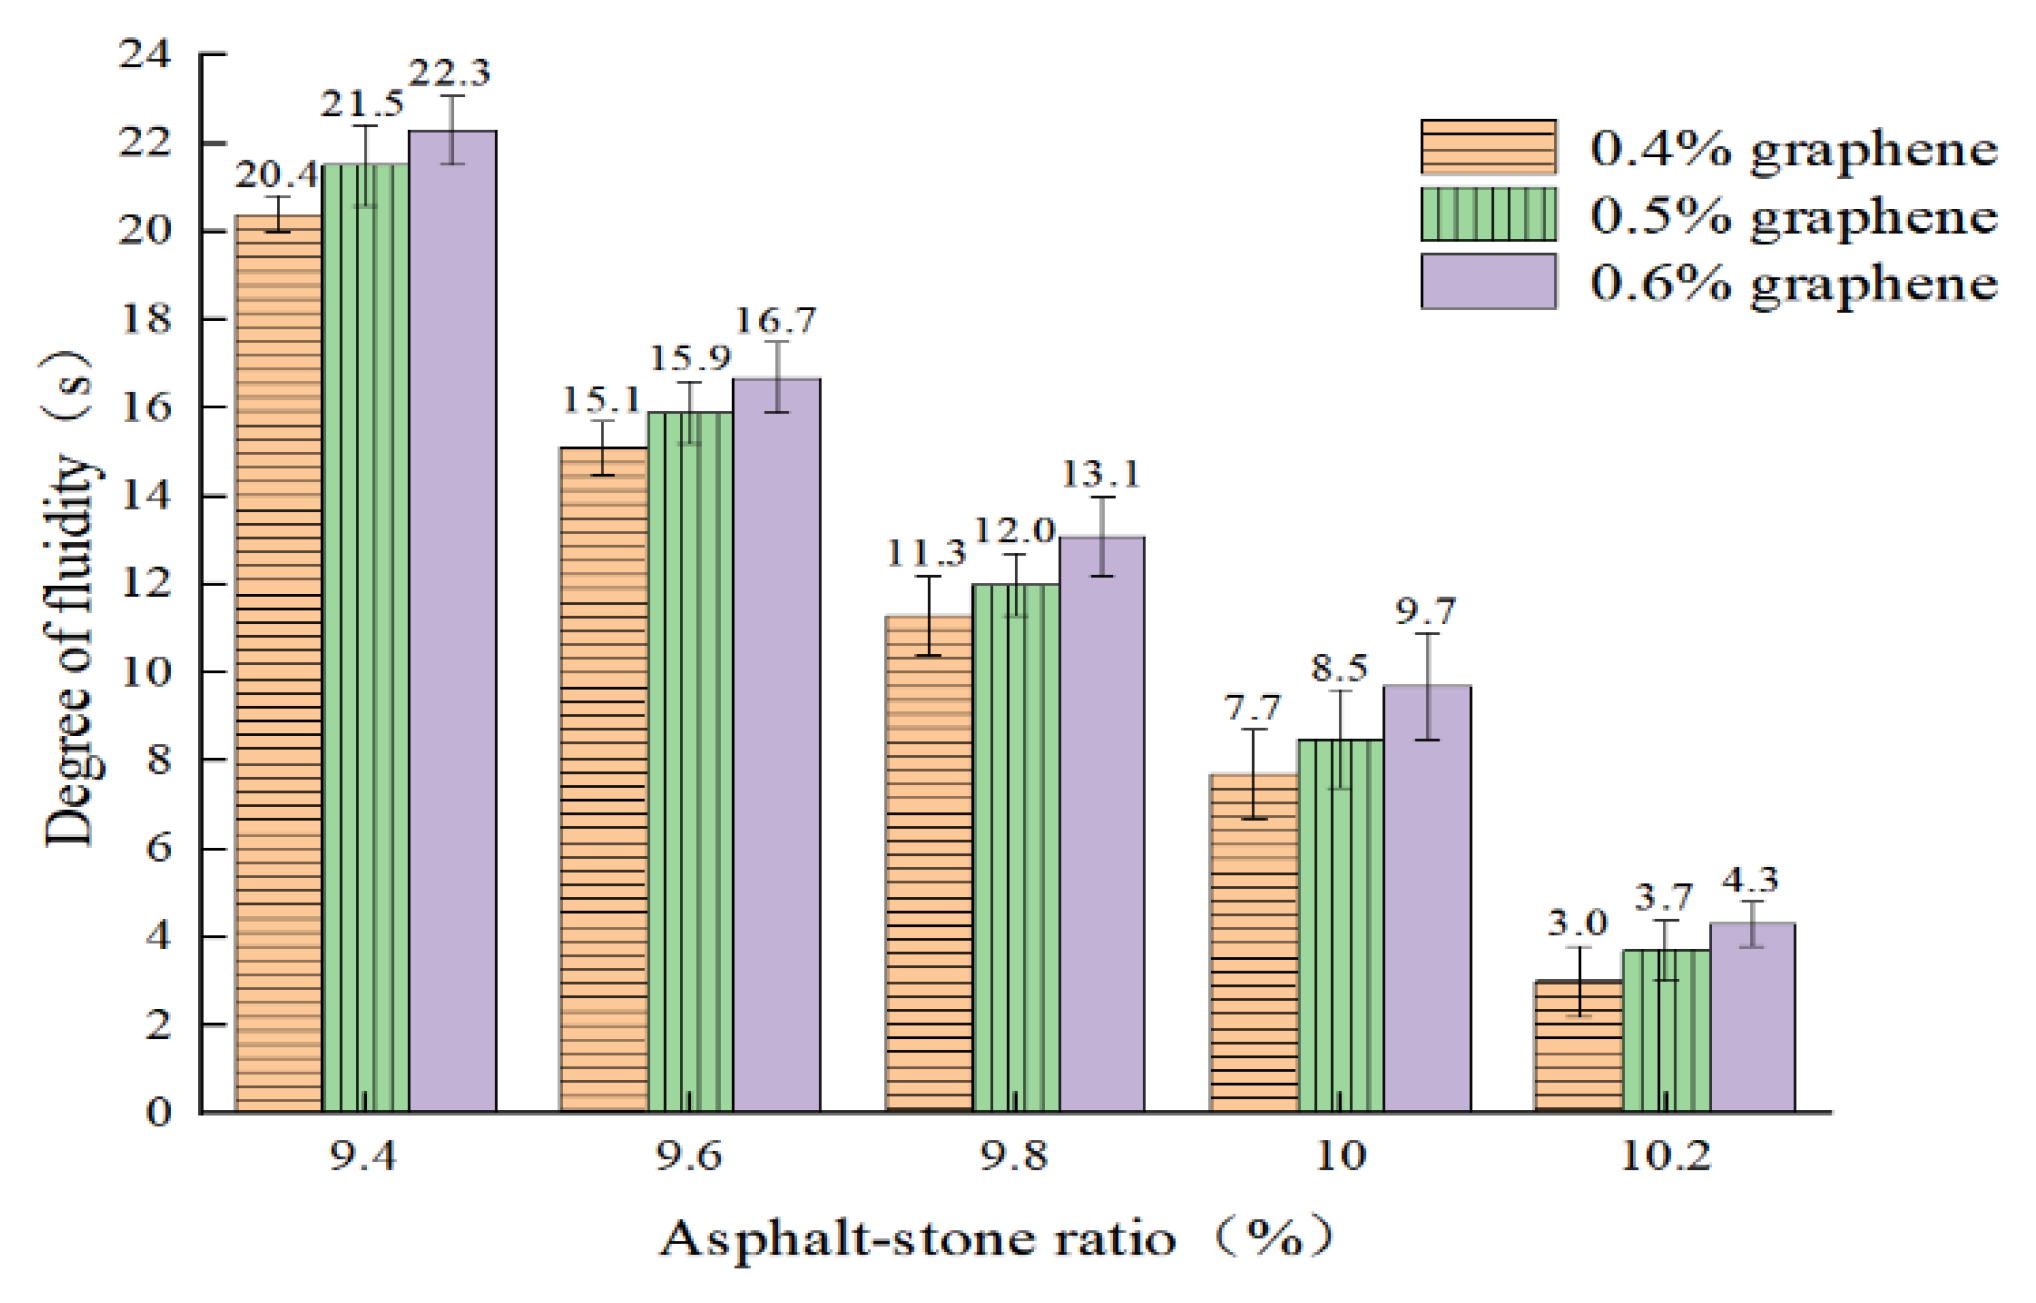
4.3.1. Fluidity Test of Cast Conductive Asphalt Concrete
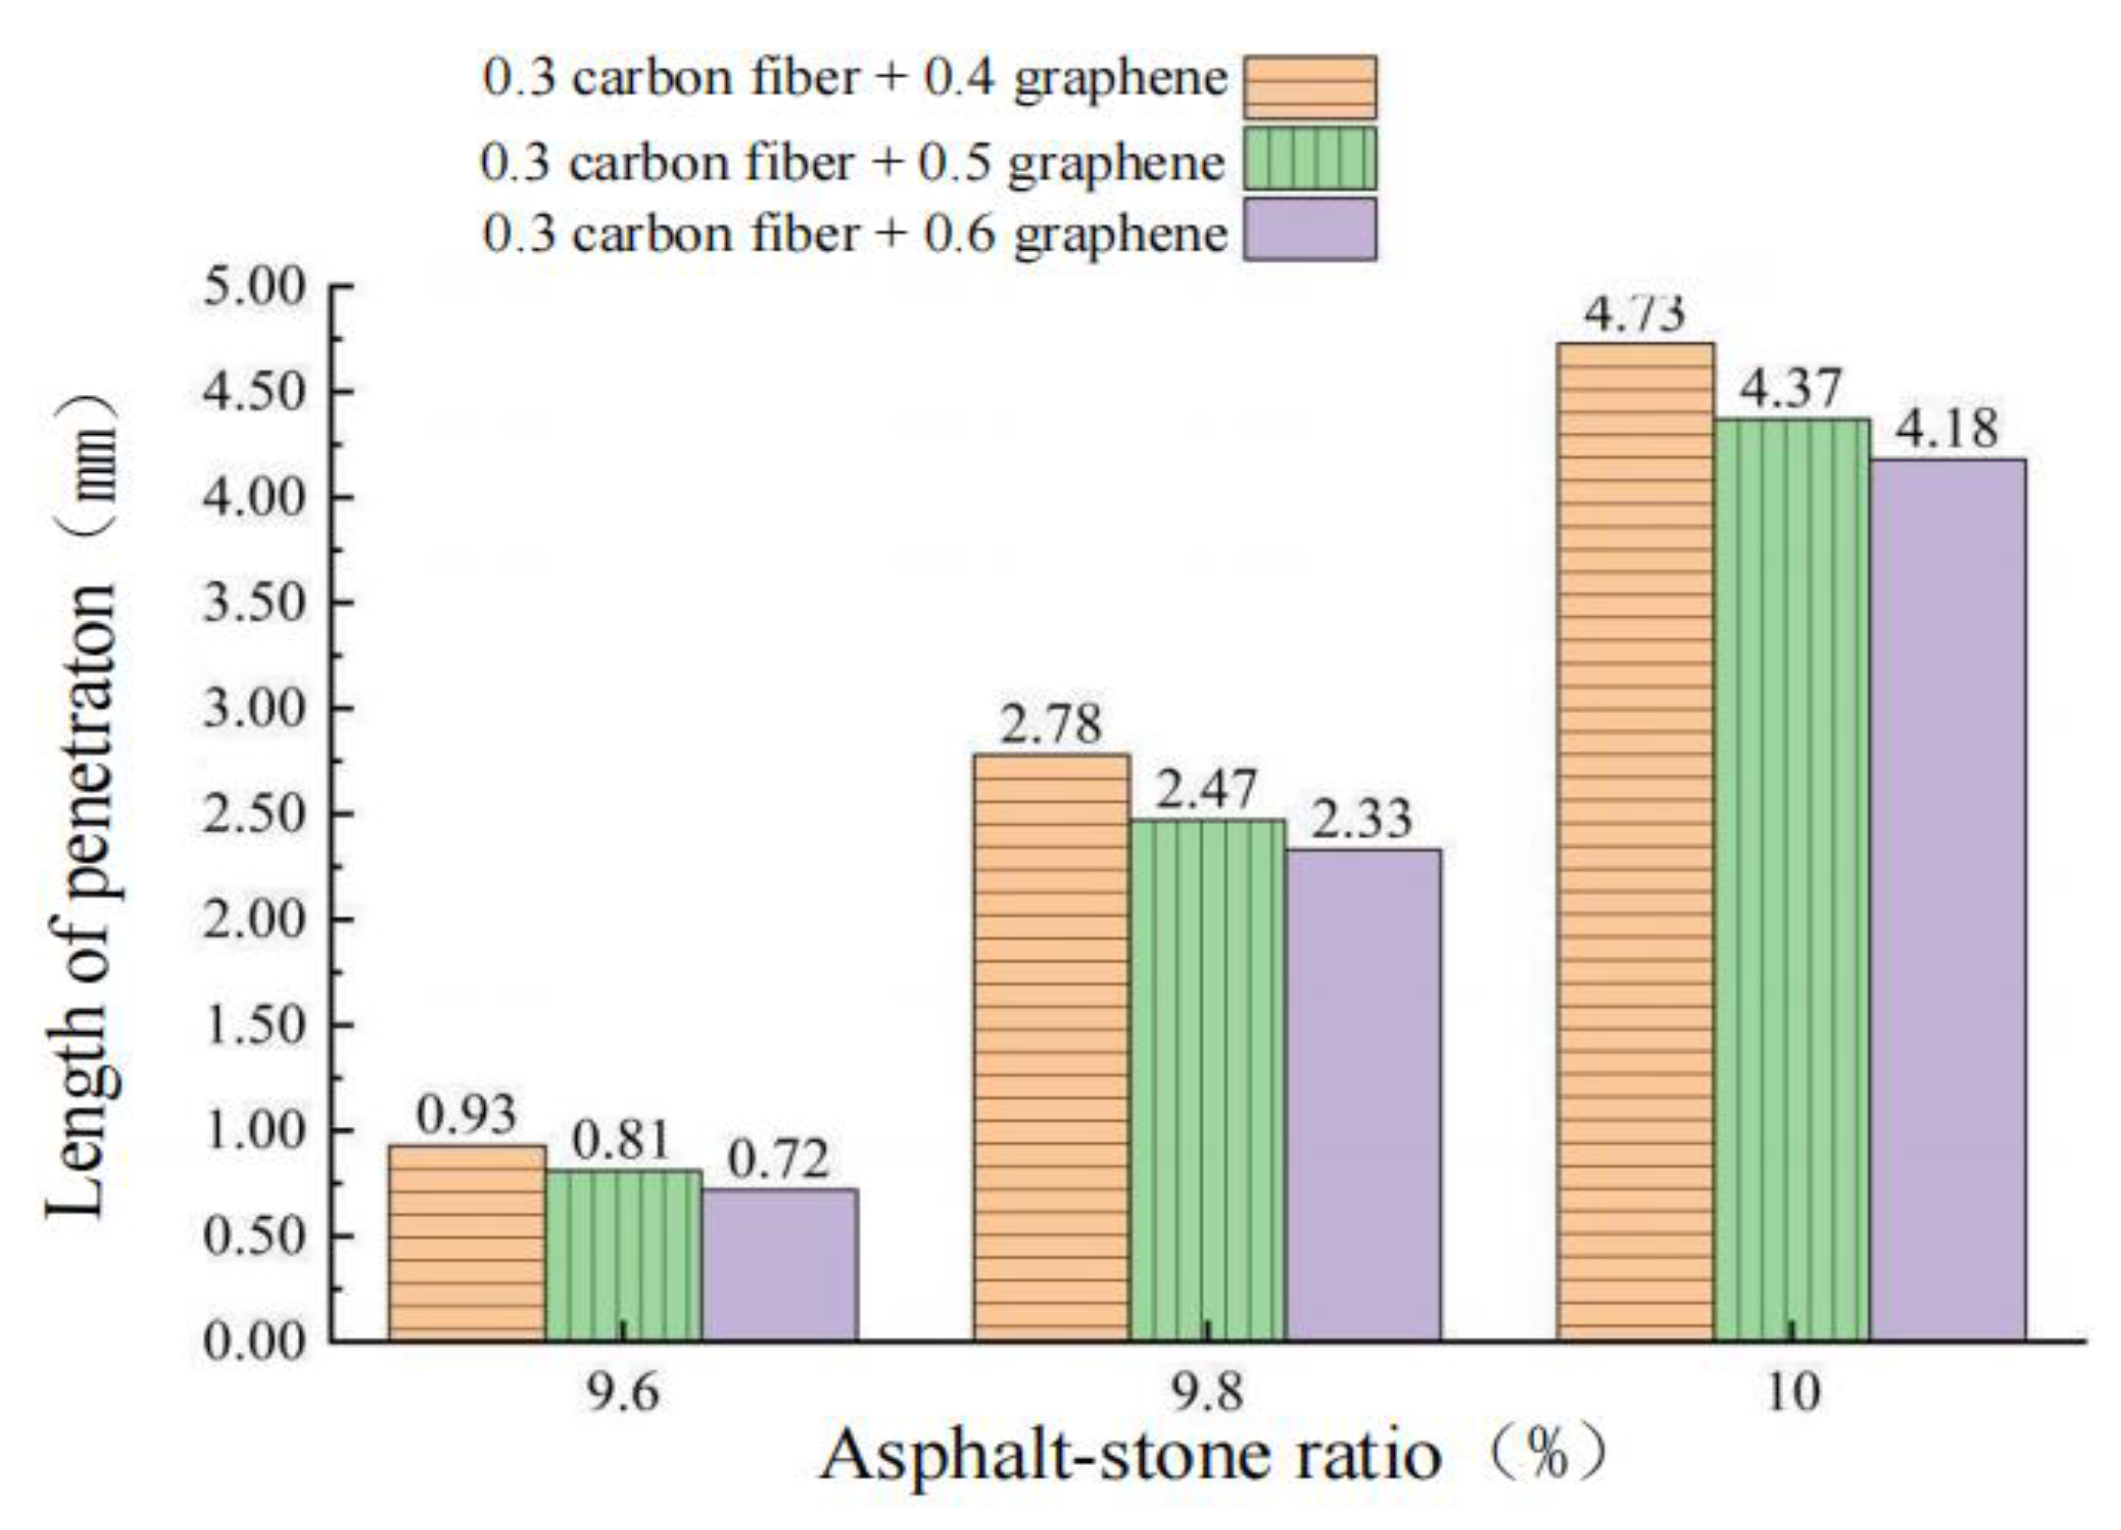
4.3.2. Incremental Test of Penetration and Penetration of Cast Conductive Asphalt Concrete
5. Study on Pavement Performance of Pouring Conductive Asphalt Concrete
5.1. High-Temperature Stability
5.2. Low-Temperature Crack Resistance
5.3. Water Stability
5.3.1. Immersion Marshall Test
5.3.2. Freeze–Thaw Splitting Test
5.4. Fatigue Property
6. Study on Electrothermal Performance of Cast Conductive Asphalt Concrete
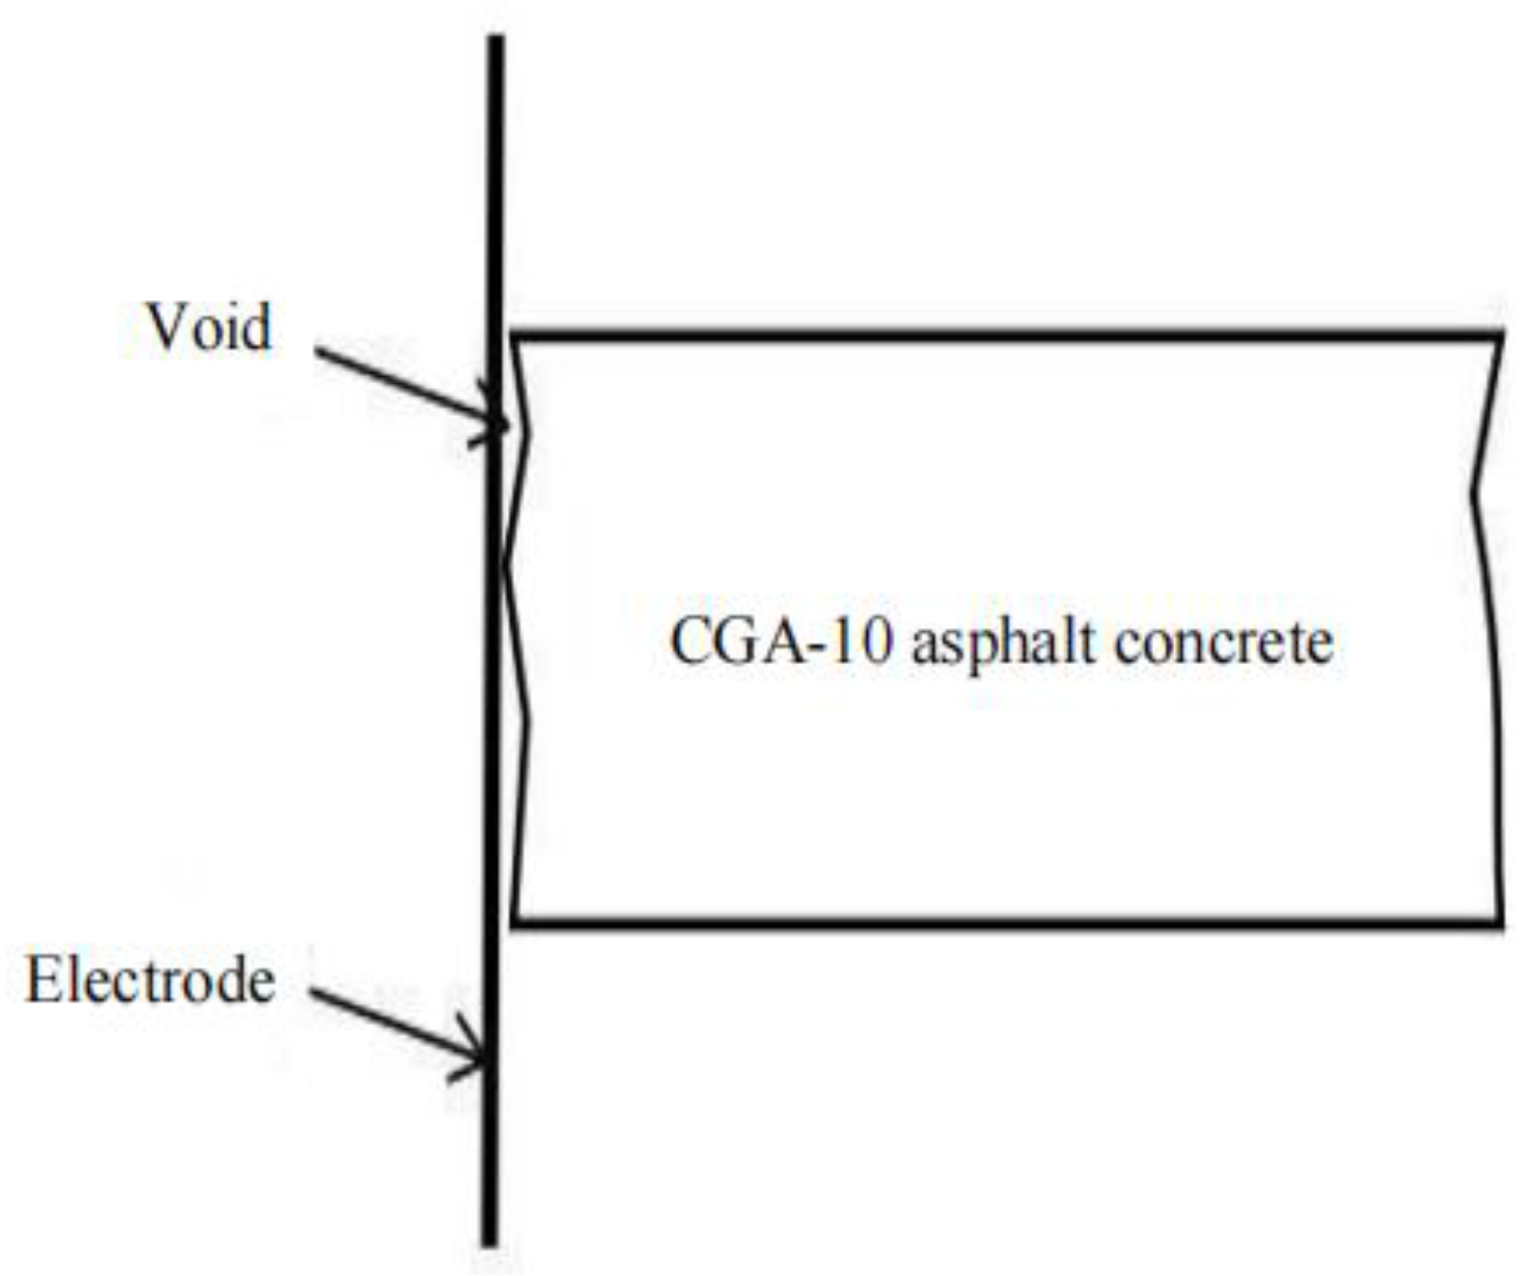
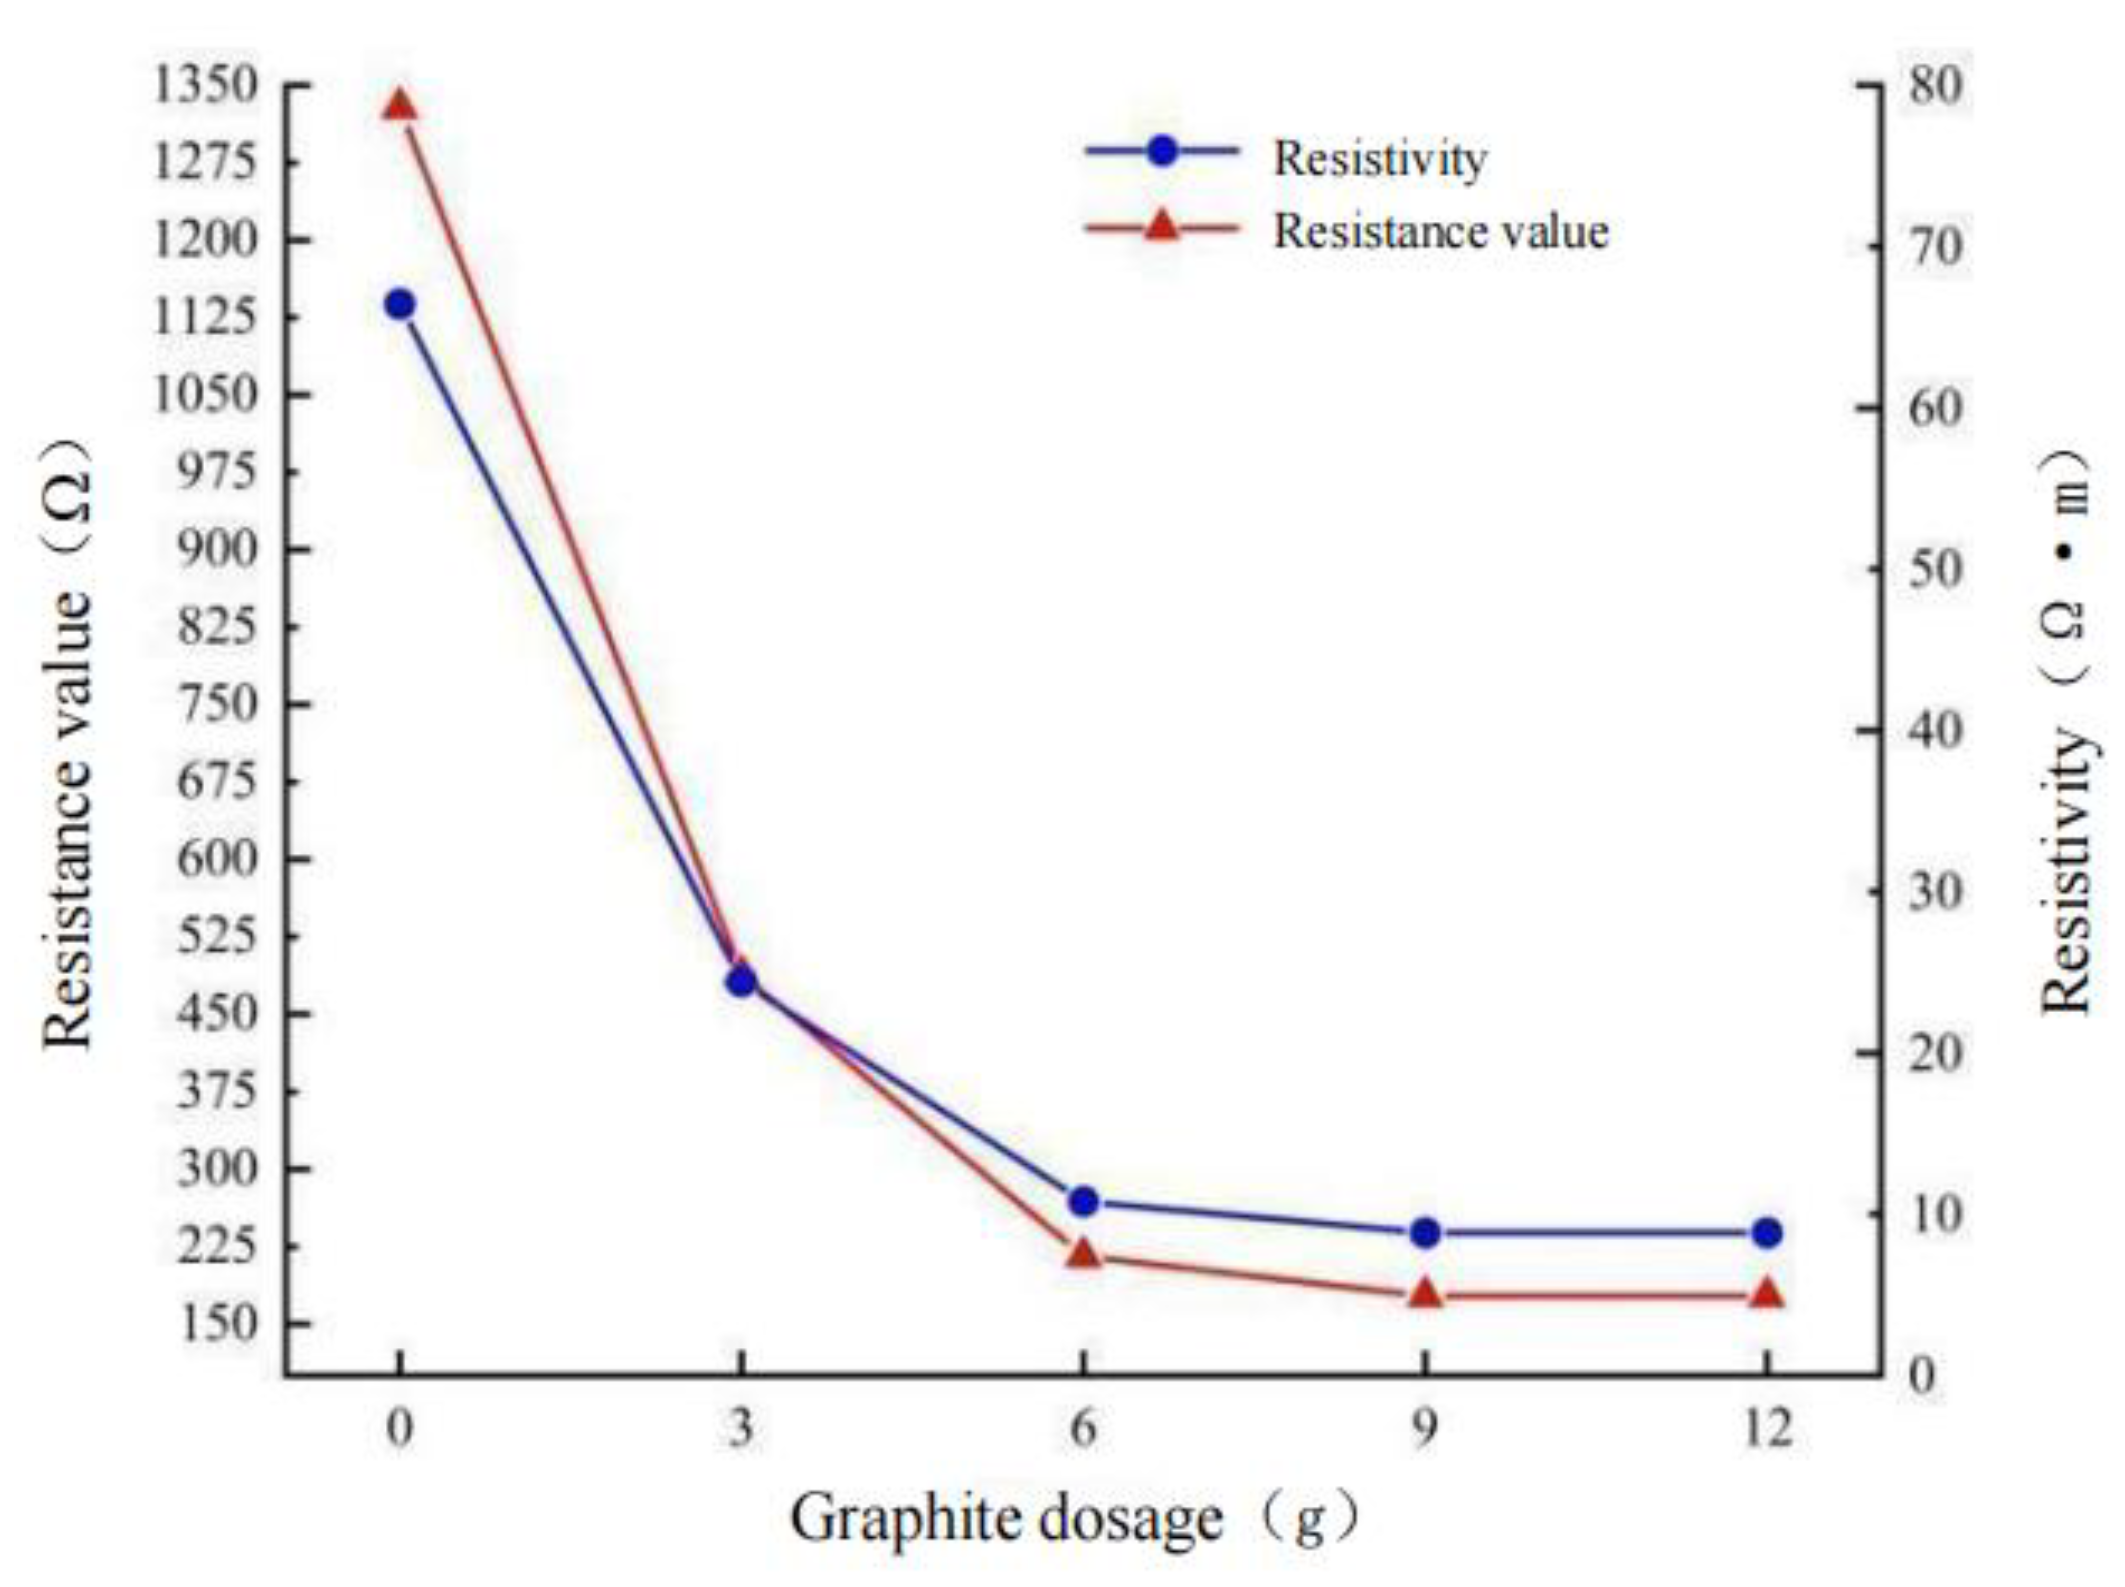
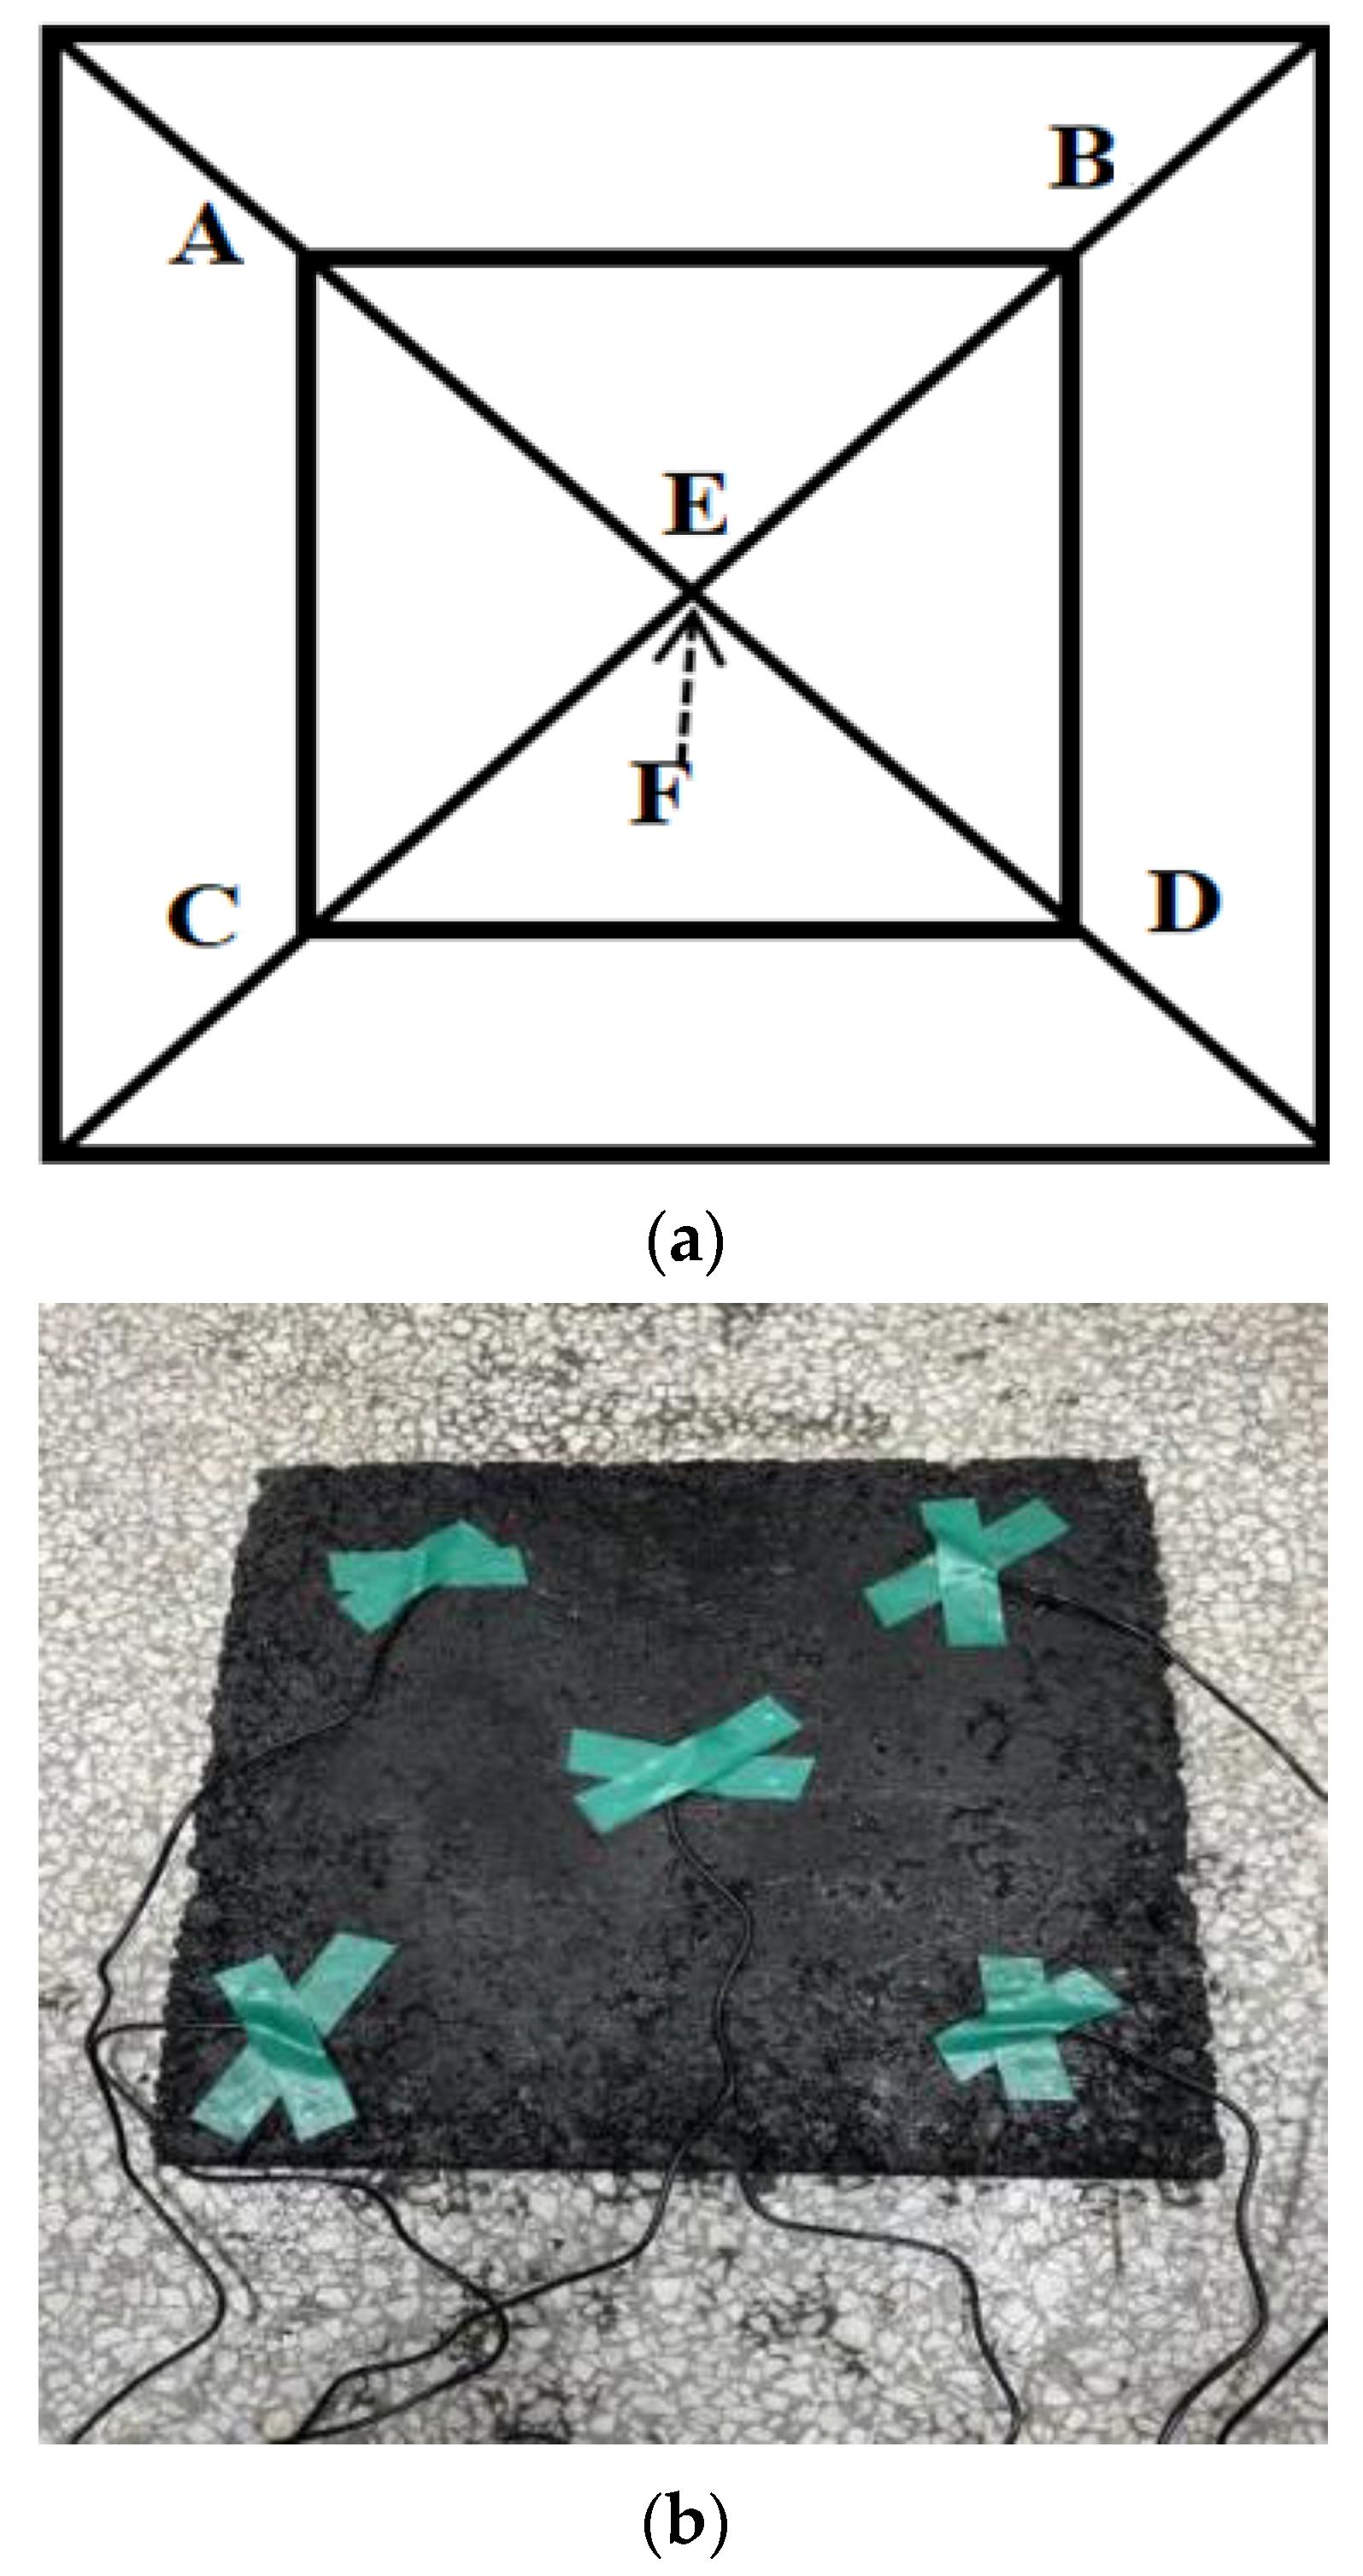
6.1. Determination of Graphite Distribution on Contact Surface between Electrode and Specimen
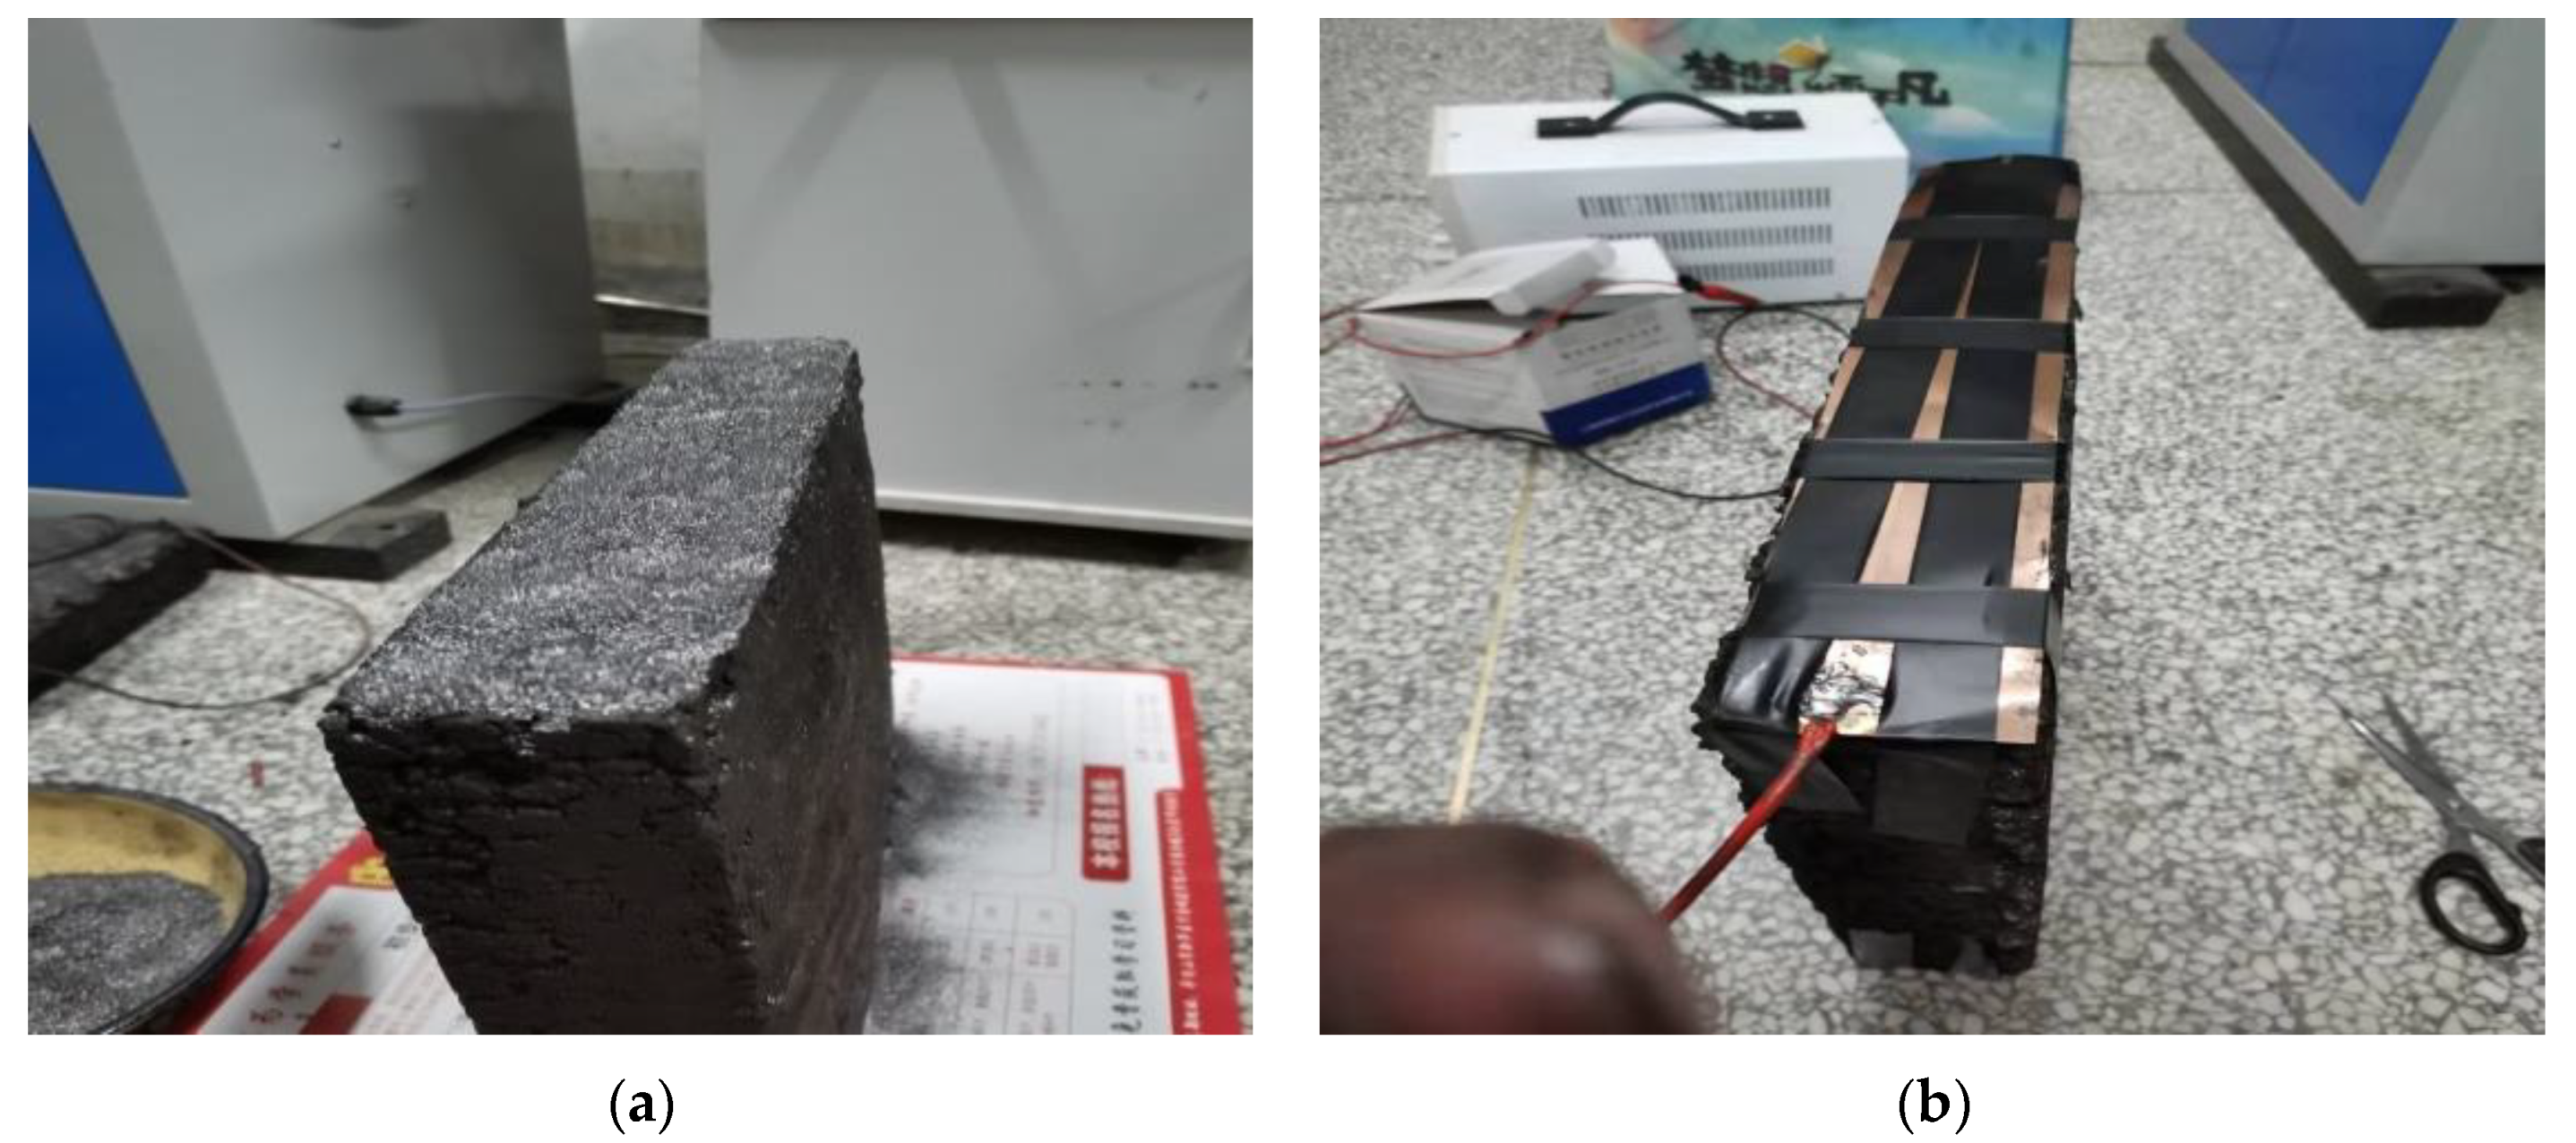
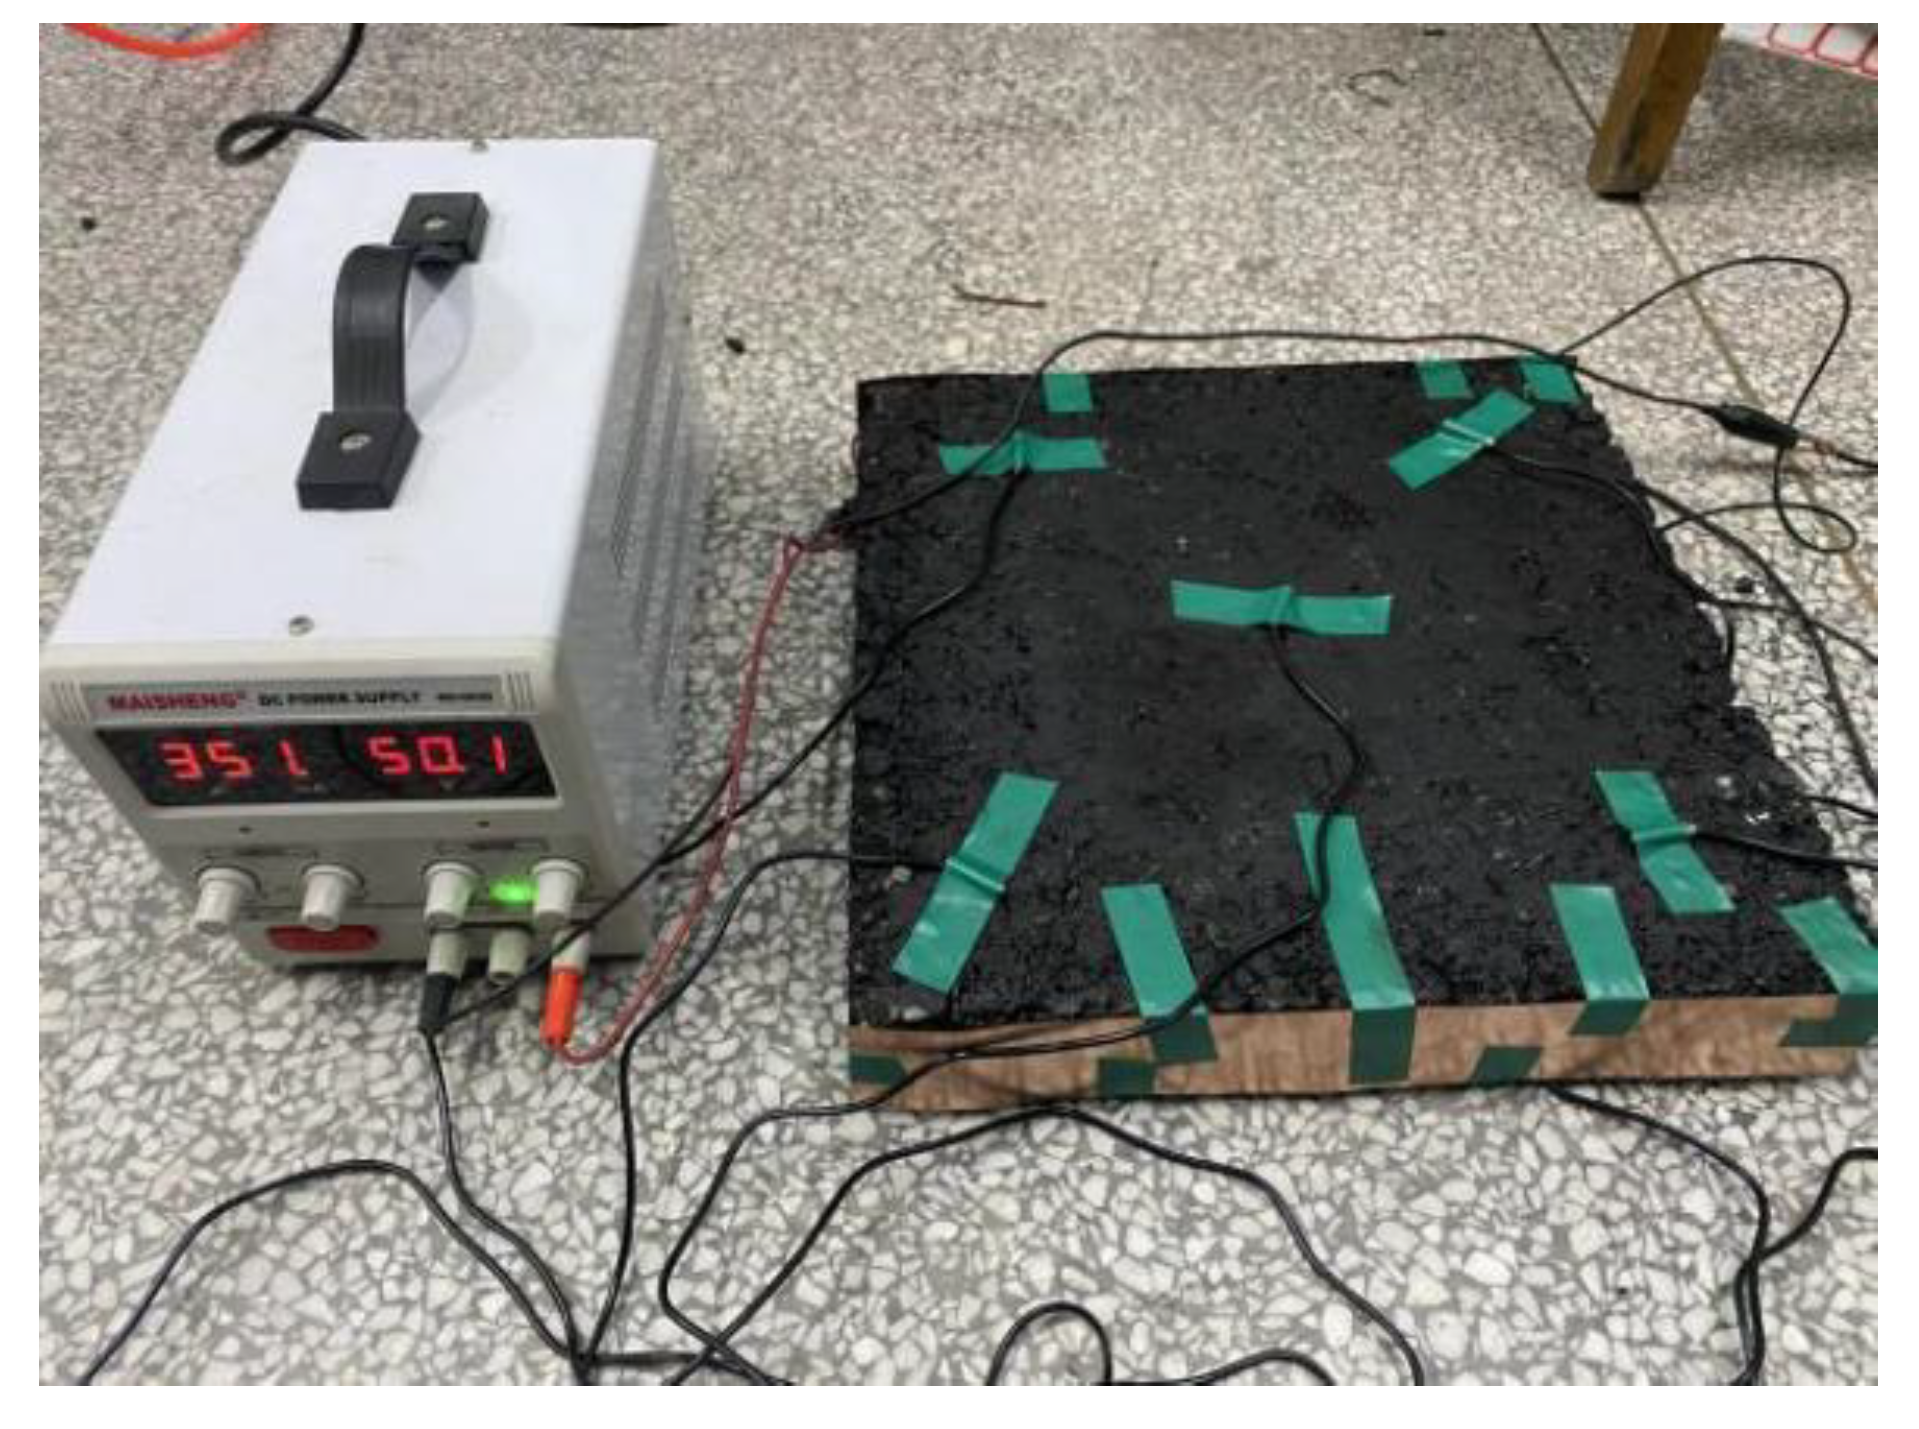
6.2. Resistance Test of Rutting Plate
6.3. Mechanism Analysis of Graphene and Carbon-Fiber-Reinforced Conductivity
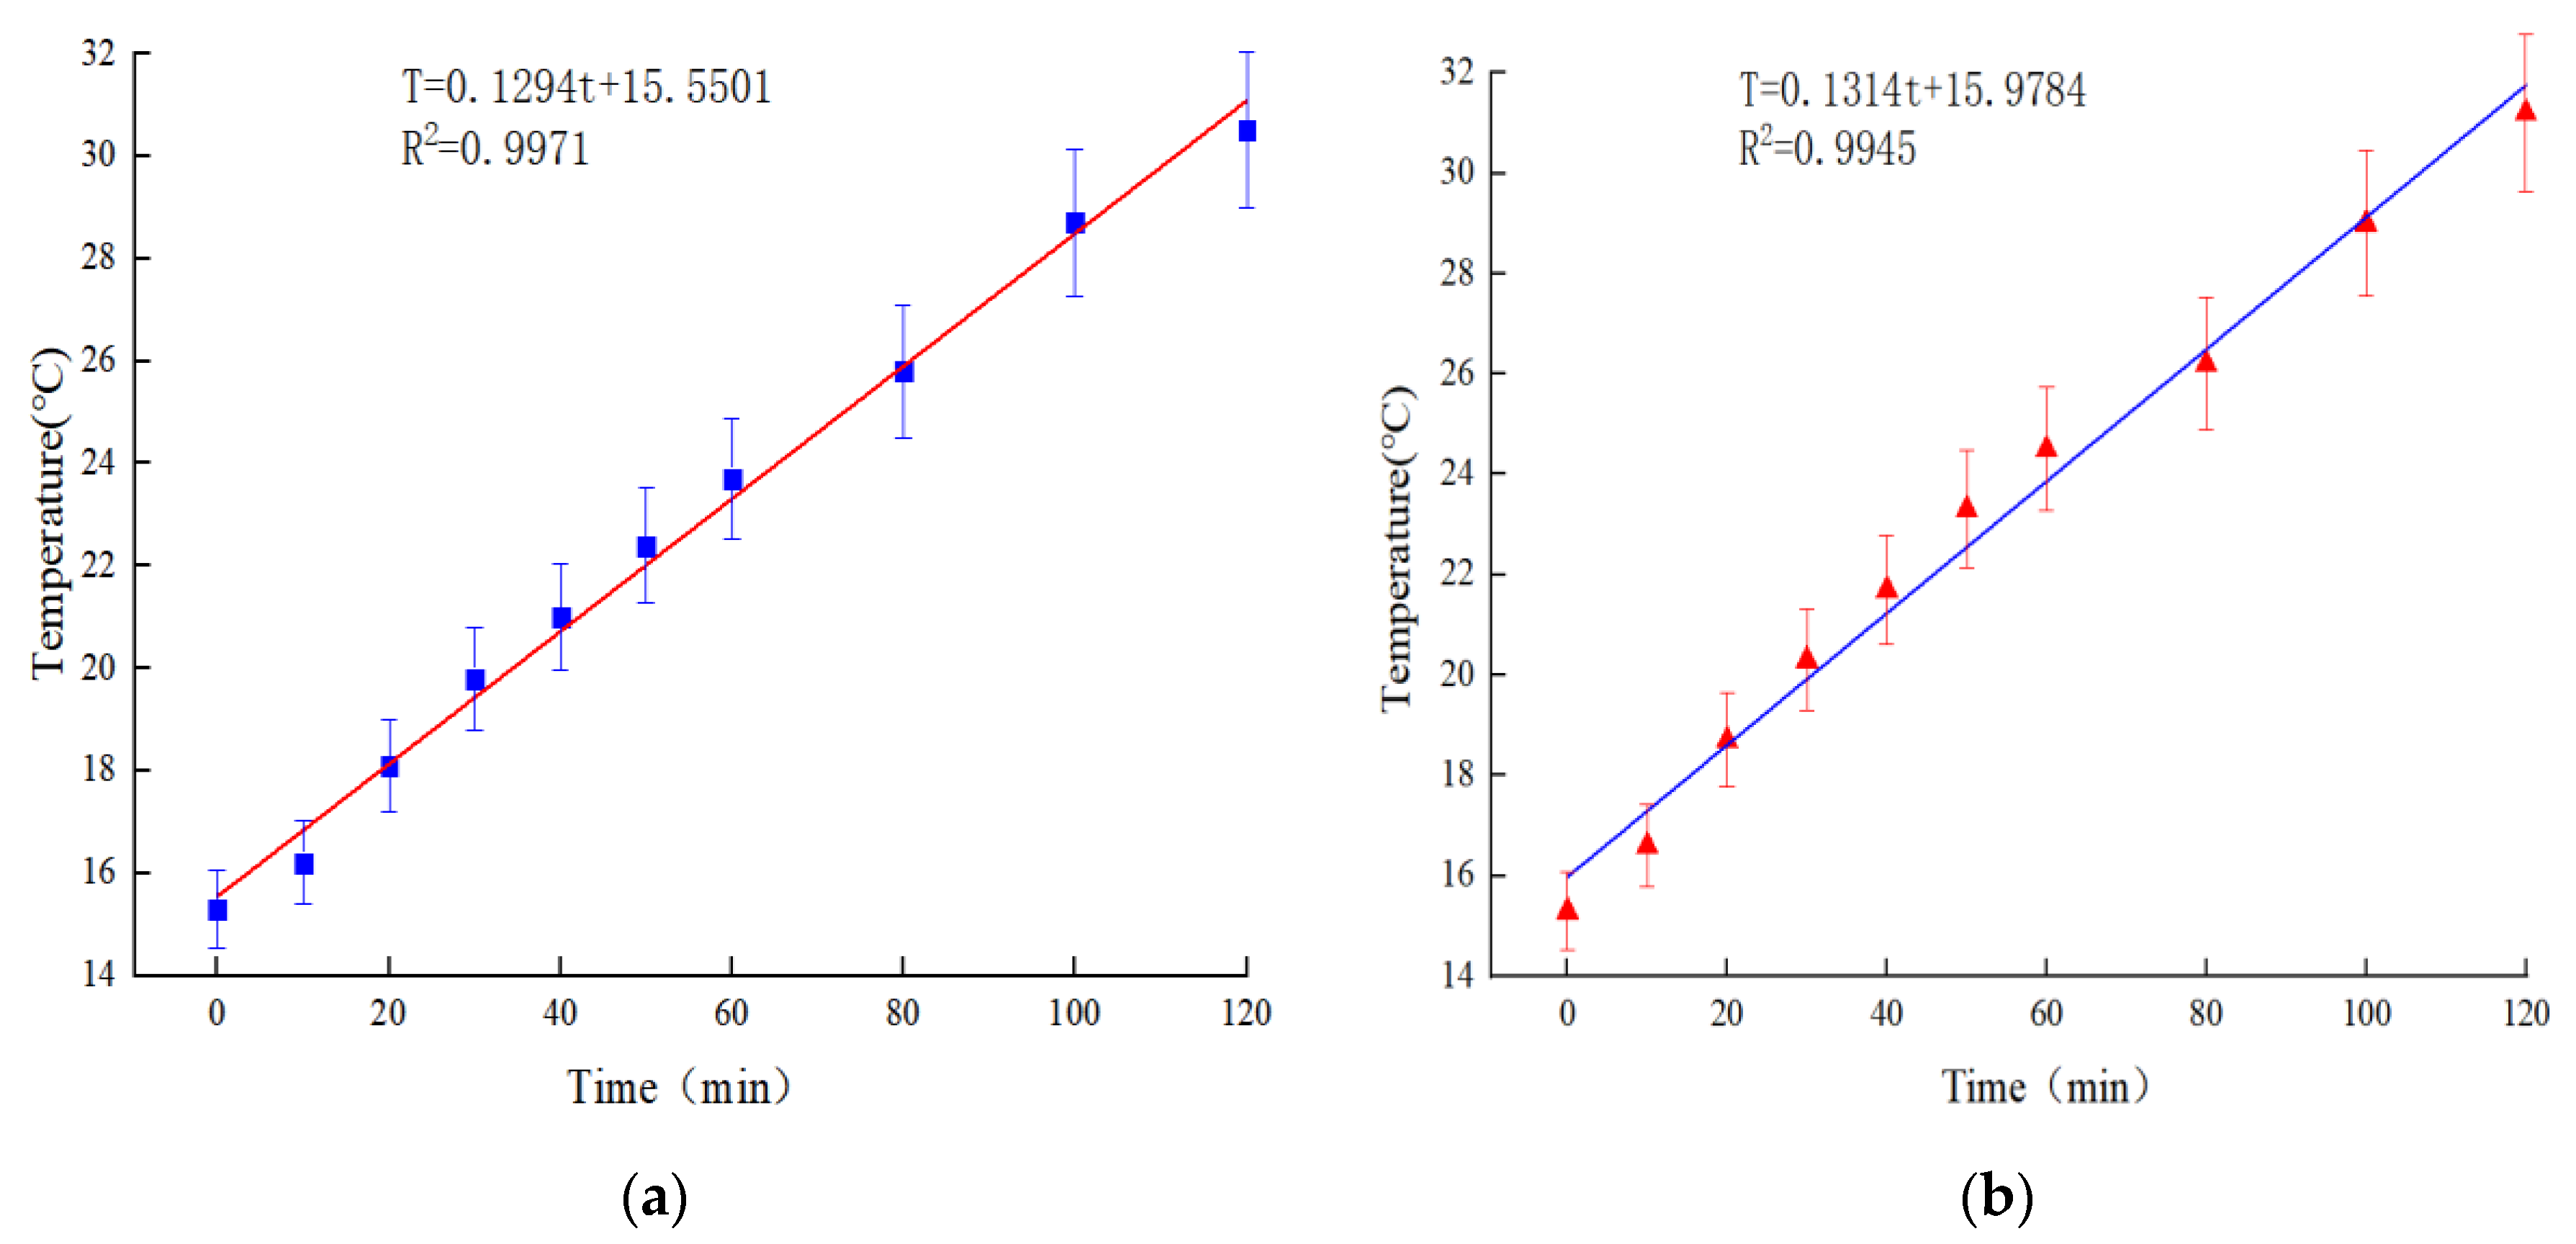
6.4. Temperature Rise Test of Rutting Plate Specimen
0.3% carbon fiber + 0.6 graphene: T = 0.1314t + 15.9784, R2 = 0.9945
6.5. Simulated Snow Melting Experiment
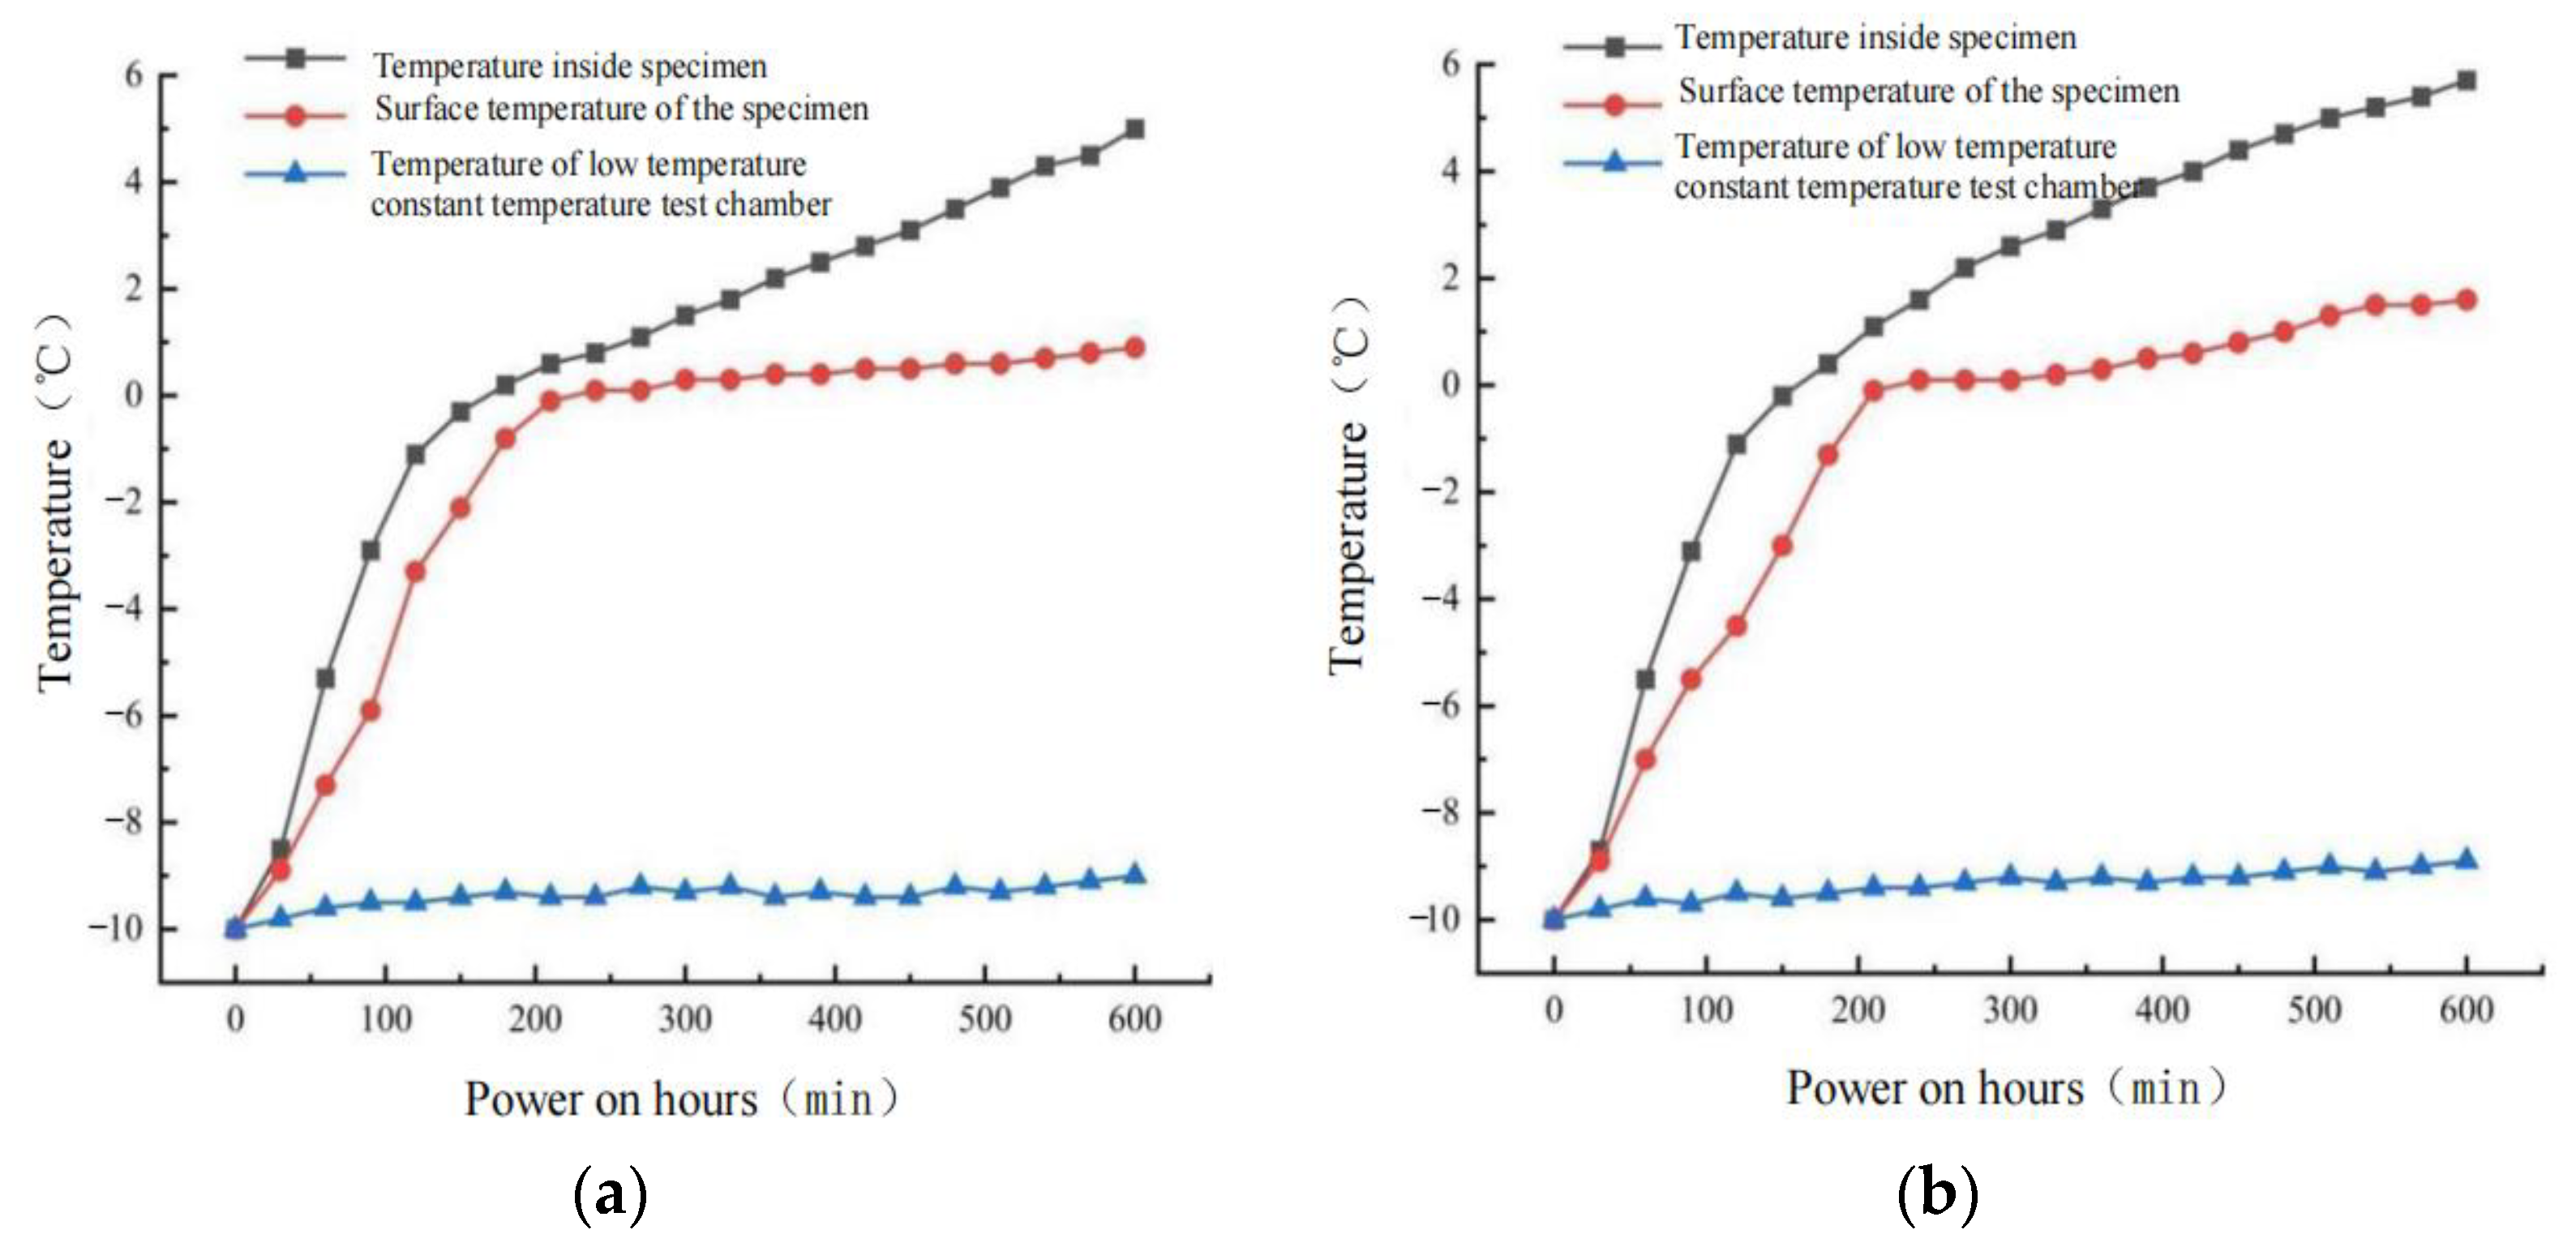
- Under the condition that the input voltage of 50 V is continuously electrified for 600 min, the bottom temperature changes of the rutting plate specimens with 0.3% carbon fiber + 0.5 graphene and 0.3% carbon fiber + 0.6 graphene are 15.0 °C and 15.7 °C, respectively. The surface temperature changes of the specimens are 10.9 °C and 11.6 °C, respectively. The time required for the bottom temperature of the specimens to rise from −10 to 0 °C is 180 min, and the time required for the surface temperature to rise to 0 °C is 240 min and 230 min, respectively. The temperature changes in the low-temperature constant temperature test box are 0.8 °C and 0.9 °C, respectively, with little change.
- Compared with the heating rate of the rutting plate specimen at room temperature, the heating rate of the specimen surface during the ice-snow melting test was significantly slow, and the heating rate at the bottom of the specimen was significantly higher than that at the surface. This is because the heat exchange rate is accelerated and the heat loss is increased under the external low temperature environment, thus slowing the heating rate at the bottom of the specimen. At the same time, when the surface of the specimen reaches 0 °C, the heat generated continues to exchange with the outside world and store heat within itself. All the heat is involved in the process of melting ice and snow, and the surface of the specimen is no longer heated before the complete melting of ice and snow.
- The whole snow melting test process can be divided into three stages. The first stage is the heating process of ice and snow on the specimen and its surface, which is characterized by fast heating rate and stable heating effect. The second stage is the melting process of ice and snow on the surface of the specimen. The surface temperature of the specimen is basically maintained at 0 °C, and the heat transferred to the surface is basically absorbed by the melting of ice and snow. Stage 3 is the end of melting ice and snow, the specimen surface began to heat up, characterized by slow heating rate.
- At 50 V input voltage, the input power of the power supply is only 26.59 W and 27.74 W with two kinds of conductive phase materials, which takes a long time to completely melt the ice and snow. Therefore, the time used in the ice-snow melting process can be shortened by increasing the input power and increasing the input power can be achieved by reducing the resistance of the specimen and increasing the voltage. Among them, increasing the input voltage threatens the safety of the test, and reducing the resistance provides higher safety.
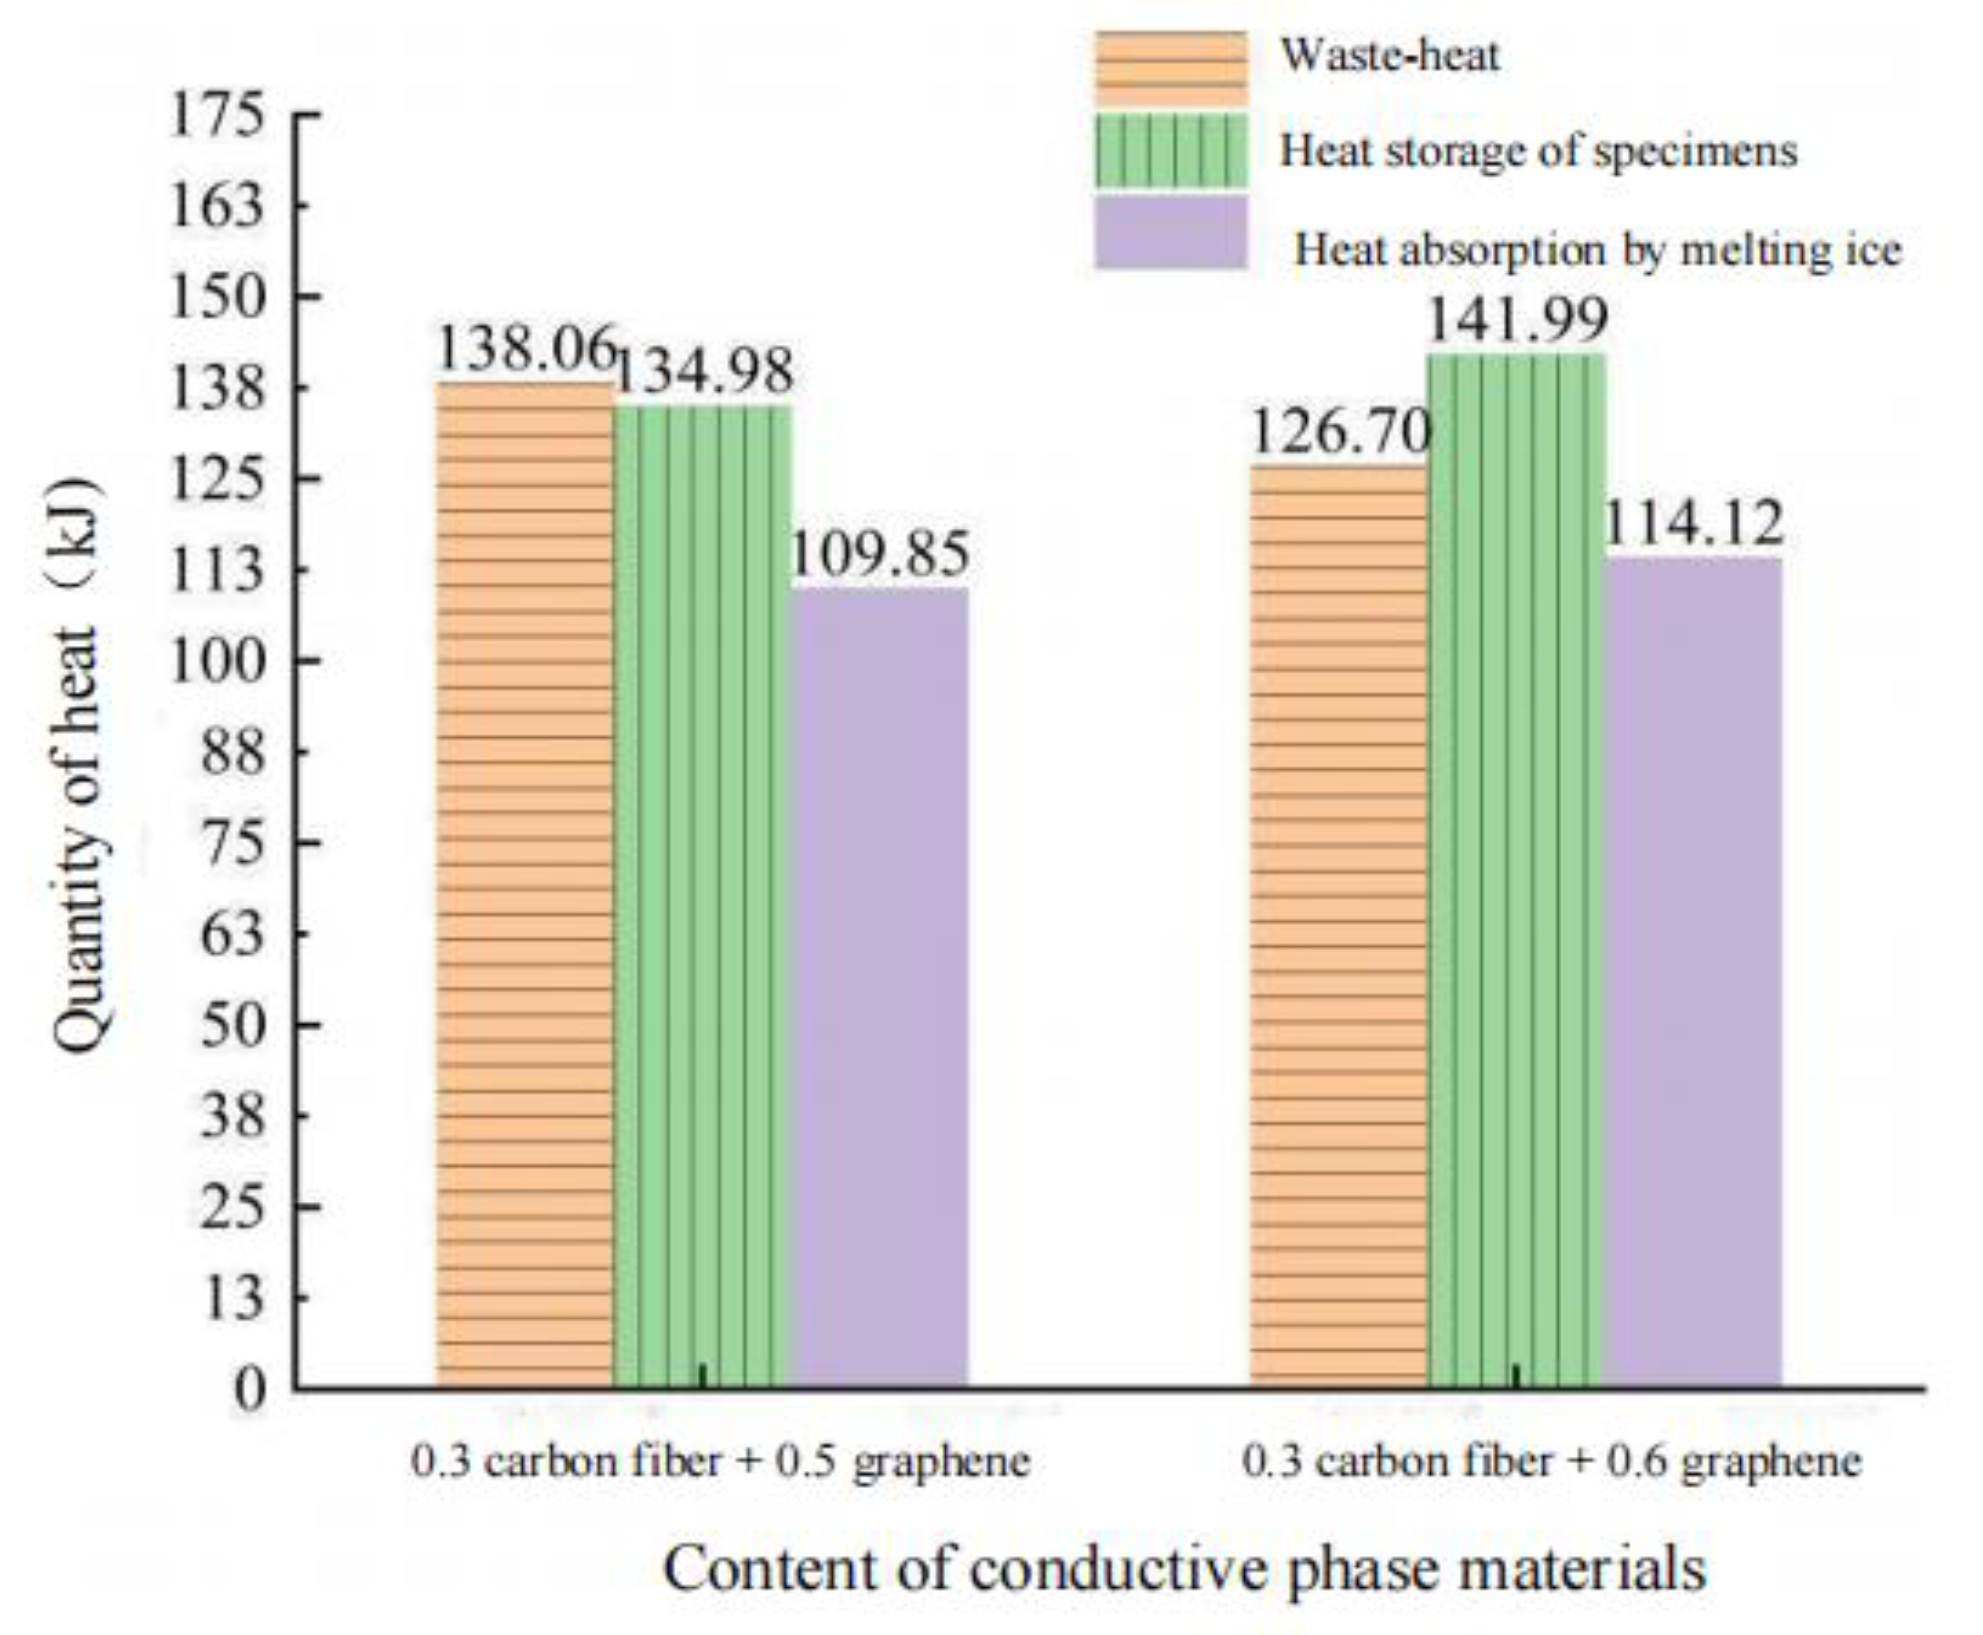
- In the ice melting test, the heat generated by CGA-10 using the current thermal effect mainly includes the heat exchanged with low temperature environment (heat loss), the heat absorbed by ice melting and the heat saved by the specimen itself. The ice-snow melting efficiency of the two conductive phase materials was 28.73% and 29.81%, respectively. The heat storage energy of the specimen is 134.98 kJ and 141.99 kJ, respectively. The heat required for heating and melting of ice and snow is 109.85 kJ and 114.12 kJ, respectively. The heat loss was 138.06 kJ and 126.70 kJ, respectively, accounting for 36.1% and 33.1% of the total heat, respectively. There was little difference in snow melting efficiency between the two groups of rutting plate specimens, and more heat was transferred to the external environment in the form of heat conduction.
- By analyzing the energy conversion relationship, it can be found that heat loss accounts for a high proportion of the total heat, resulting in a decrease in snow melting efficiency. Therefore, to further improve the efficiency of ice and snow melting of CGA-10 and make more heat involved in the process of ice and snow melting, an insulation layer can be added below the conductive layer to prevent the downward transfer of heat and reduce heat loss, so that the heat energy transformed by conductive asphalt concrete can be effectively transferred to the road surface to ensure more efficient use of energy.
7. Conclusions
- The mix design of GA-10 was optimized. The optimum content of Sasobit was determined to be 3.0% by flow test, and the optimum oil–stone ratio of GA-10 was determined to be 8.5% by penetration and penetration increment test. On this basis, the fluidity test, penetration, and penetration increment test were carried out with the addition of 0.3% carbon fiber + graphene (0.4%, 0.5%, 0.6%) three groups of content to determine that the optimum oil–stone ratio of CGA-10 was 9.8%. At this time, CGA-10 demonstrated good fluidity and plastic-deformation resistance.
- Compared with the specimen doped with 0.3% carbon fiber, the dynamic stability of CGA-10 doped with conductive phase materials increased by 12.3%, 17.6% and 22.9%, respectively, the flexural strength decreased by 5.4%, 10.0% and 16.4%, and the maximum flexural strain decreased by 5.8%, 8.0% and 9.9%, respectively. The results of the immersion Marshall test showed that the residual stability of CGA-10 Marshall specimen with conductive phase materials was reduced by 0.7%, 0.9% and 1.9%, respectively, compared with the specimen with 0.3% carbon fiber alone, with the increase of graphene content. The freeze–thaw splitting test results are consistent with the immersion Marshall test results. Overall, compared with GA-10, the water stability of CGA-10 with graphene and carbon fiber is better. The content of conductive phase materials was positively correlated with the fatigue resistance of CGA-10. Compared with the fatigue specimen doped with 0.3% carbon fiber alone, the average fatigue times of CGA-10 doped with conductive phase materials increased by 4.5%, 5.8% and 7.7%, respectively, with the increase of graphene content.
- It is recommended that the optimum graphite distribution between the specimen and the electrode contact surface is 600 g/m2, and the contact resistance is the smallest. When the conductive phase material content is 0.3% carbon fiber + 0.4% graphene, the resistivity of the specimen is the largest, which is 6.81 Ω·m. When the graphene content increases from 0.4% to 0.5%, the resistivity of the specimen decreases by 2.11 Ω·m. When the graphene content continues to increase, the resistivity of the specimen changes slightly, and the conductivity of CGA-10 has reached the percolation threshold. When the conductive phase material is 0.3% carbon fiber + 0.5% graphene and 0.3% carbon fiber + 0.6% graphene, the resistivity of rut plate specimen is 4.70 Ω·m and 4.51 Ω·m, respectively, which has good electrical conductivity.
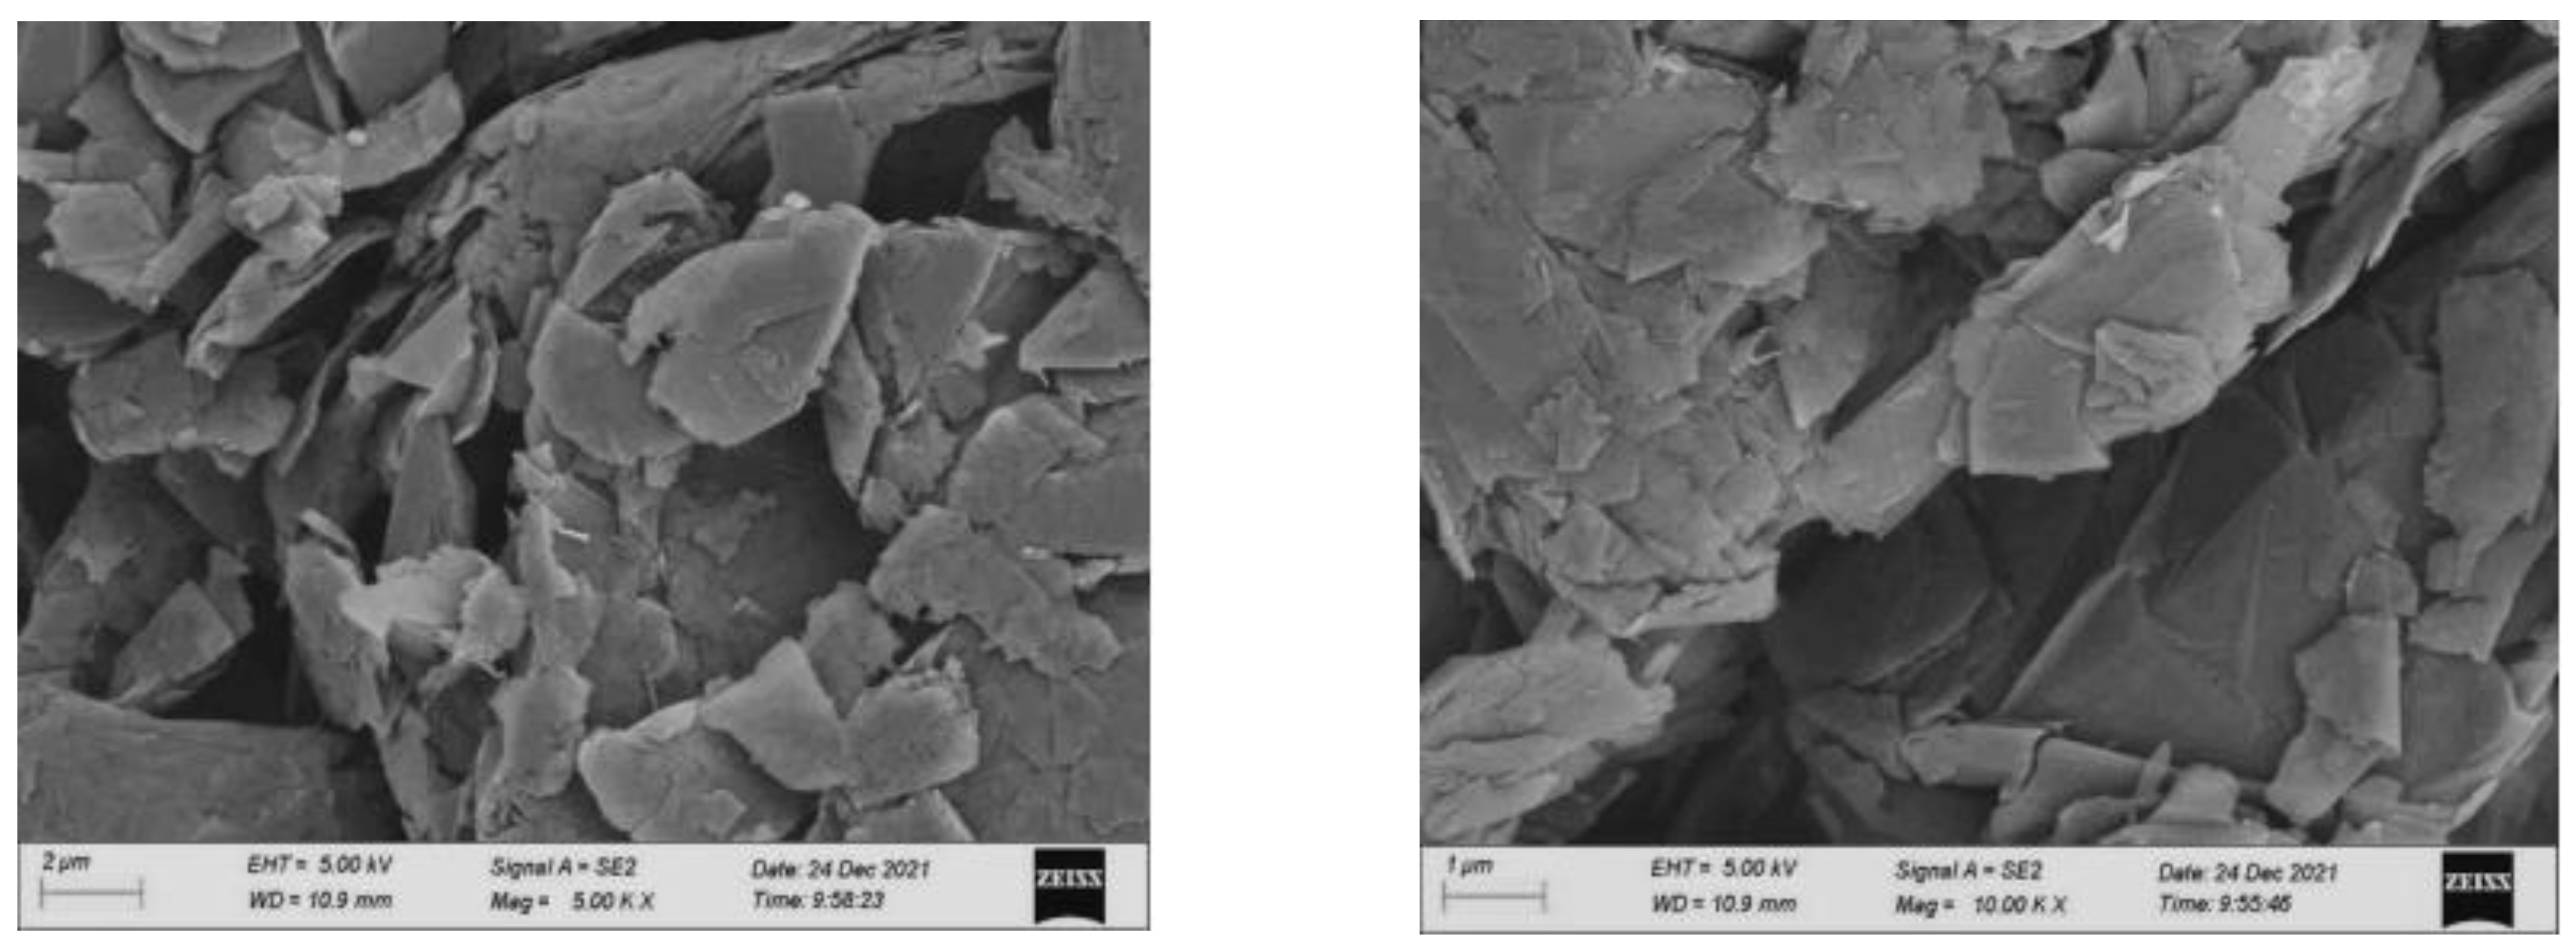
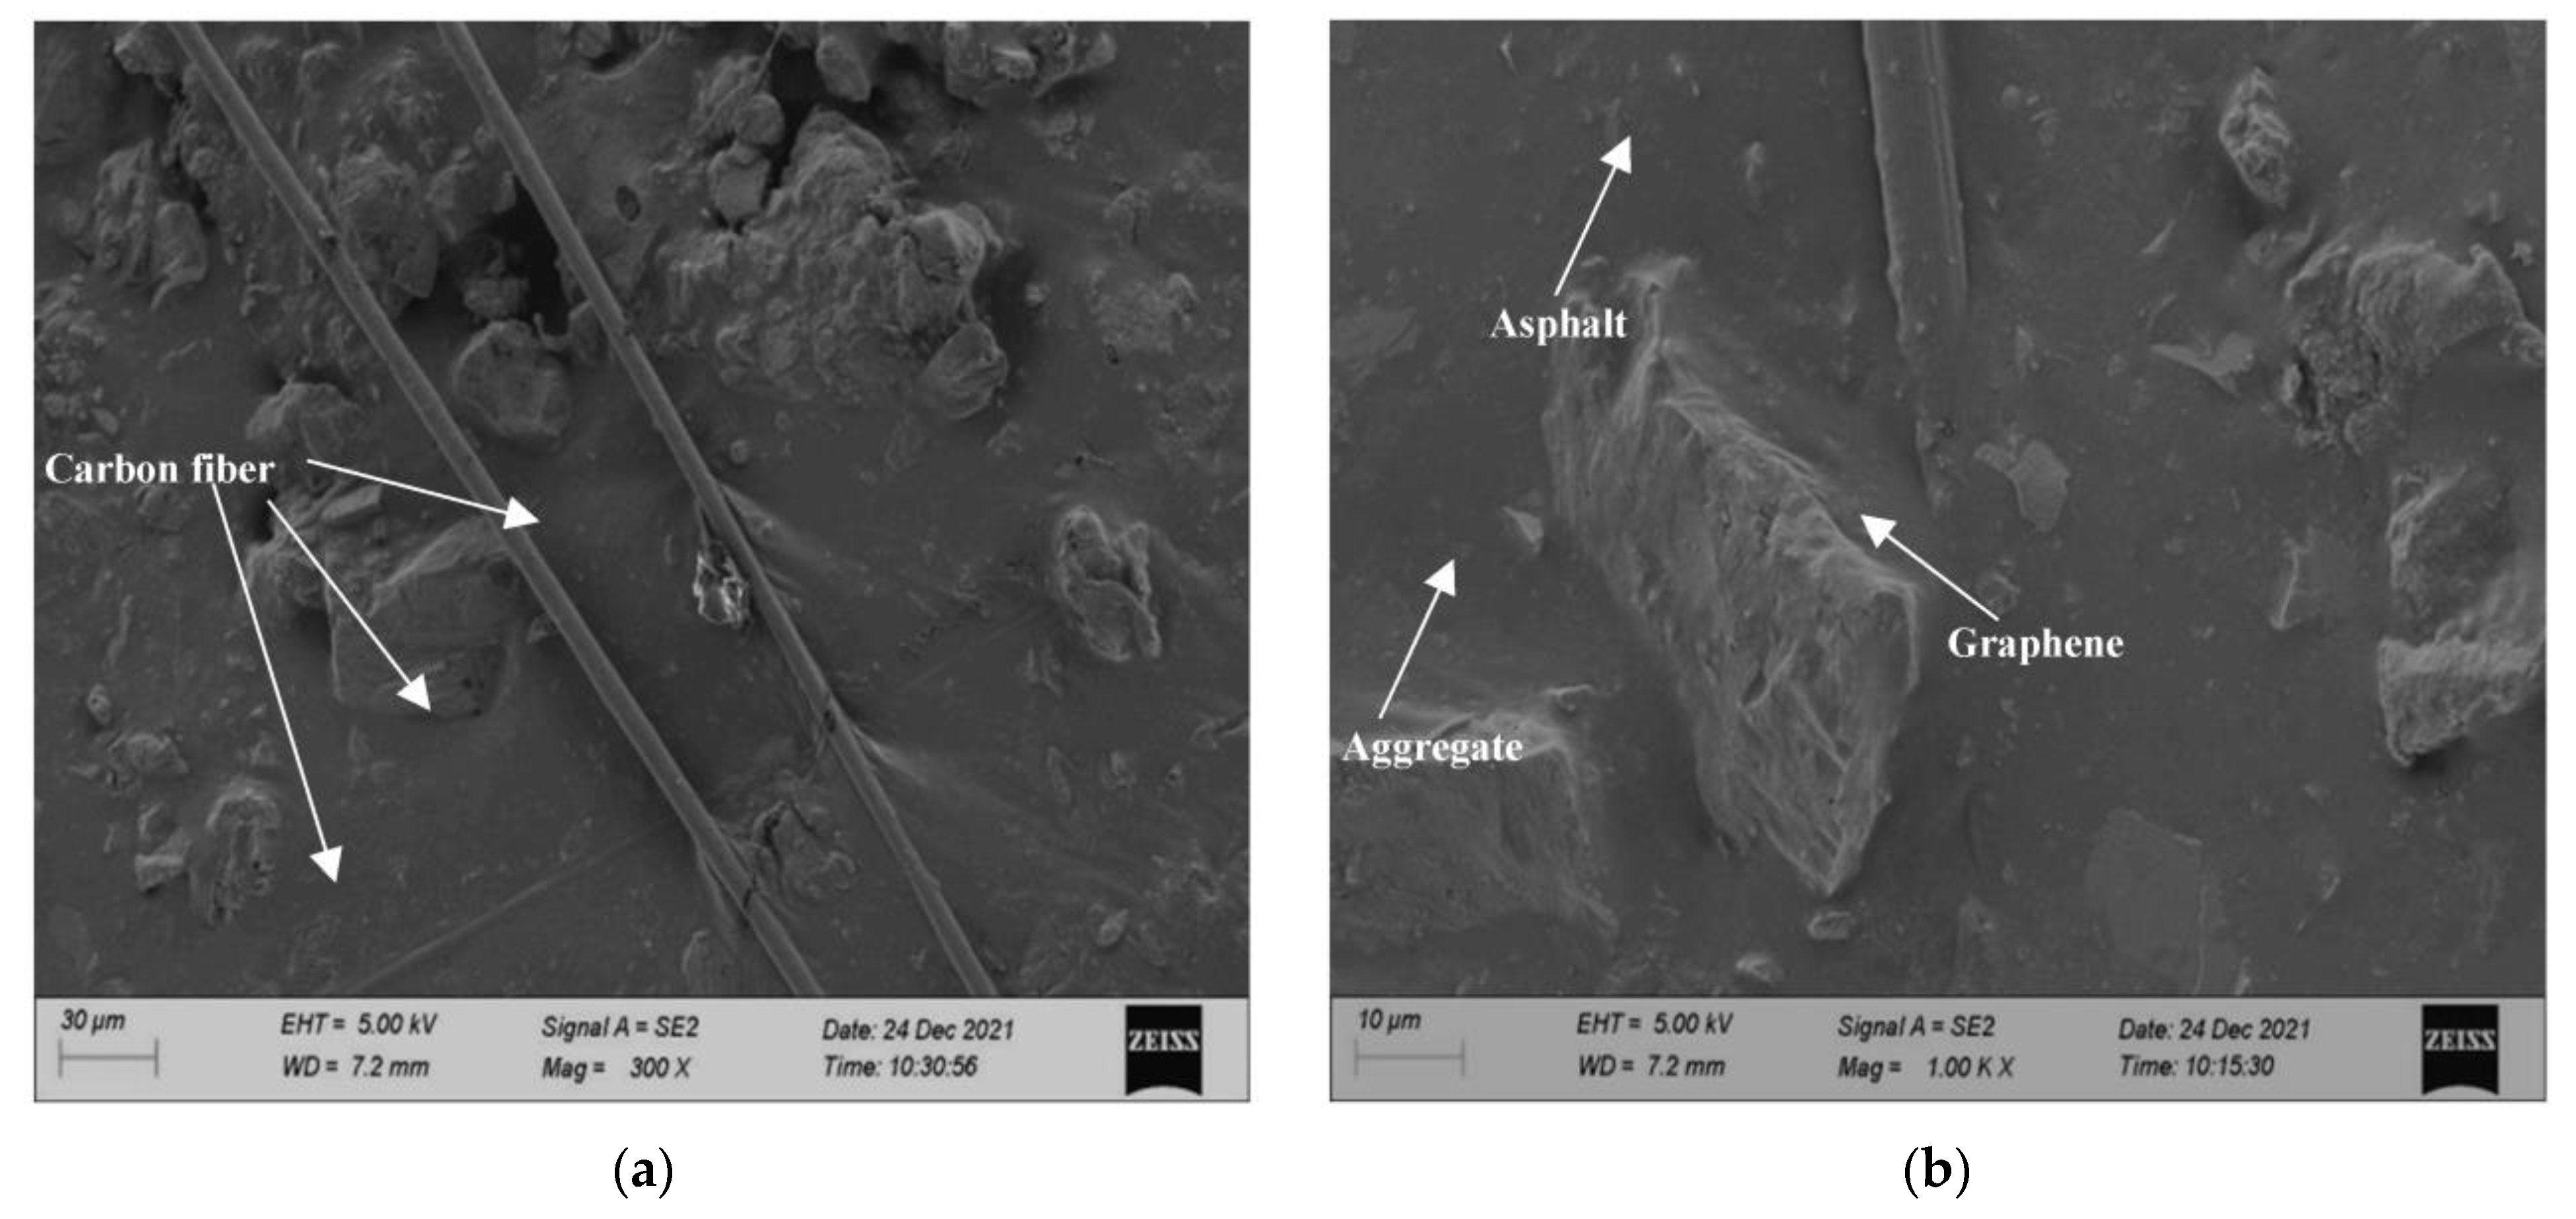
- Based on the SEM microscopic analysis, it is found that graphene is a multilayer sheet stacking structure, and there are many stripes on the surface of carbon fiber. The carbon fiber overlapped with each other is well combined and wrapped with minerals and asphalt. Due to the large aspect ratio of carbon fiber, it can play the role of a conductive bridge in CGA-10, connect graphene uniformly distributed in asphalt mortar, and construct a complete conductive network.
- The electrified heating test showed that when 0.3% carbon fiber + 0.5% graphene and 0.3% carbon fiber + 0.6% graphene were mixed, the correlation coefficients between the surface temperature of the rutting plate specimen and the electrified time were 0.9971 and 0.9945, respectively. The two showed good correlation, and the heating efficiency of the specimen was 71.4% and 72.0%, respectively, with high electrothermal conversion efficiency.
- When 0.3% carbon fiber + 0.5% graphene and 0.3% carbon fiber + 0.6% graphene are mixed, the heat loss of rut plate specimens account for 36.1% and 33.1% of the total heat, respectively. The heat insulation layer can be added below the conductive layer to prevent downward heat transfer and reduce heat loss. The snow-melting efficiency of the two groups of rut plate specimens is 28.73% and 29.81%, respectively, and the difference is small. However, the low-temperature crack resistance and water stability of CGA-10 will decrease with an increase in graphene content. Therefore, we recommend that the best content of conductive phase material in CGA-10 is 0.3% carbon fiber + 0.5% graphene.
Author Contributions
Funding
Institutional Review Board Statement
Informed Consent Statement
Data Availability Statement
Conflicts of Interest
References
- Zhang, X. Mechanical Properties of Orthotropic Steel Box Girder Bridge Deck Based on Corrugated Steel Plate; Southeast University: Nanjing, China, 2018. [Google Scholar]
- Liu, Y. Research on Coupling Dynamic Behavior of Temperature and Load of Steel Bridge Deck Pavement in Chongqing; Chongqing Jiaotong University: Chongqing, China, 2019. [Google Scholar]
- Zhang, C. Mix Design and Performance Study of Cast Asphalt Concrete; Chongqing Jiaotong University: Chongqing, China, 2015. [Google Scholar]
- Chen, Y.; Li, Z.; Zhao, C.; Guo, T.T.; Wang, C.H.; Li, J.X.; Gao, D.F. Research on environmentally friendly slow-release active melting ice and snow coating materials. Chin. J. Highw. 2020, 33, 155–167. [Google Scholar]
- Tan, Y.; Zhang, C.; Xu, H. Summarization of snow melting and ice melting characteristics and road performance of active deicing pavement. Chin. J. Highw. 2019, 32, 1–17. [Google Scholar]
- Chen, Q.; Wang, C.; Fan, Z. Heat conduction effect prediction model of cast conductive asphalt concrete composite structure. Mater. Rep. 2019, 33, 1659–1665. [Google Scholar]
- Notani, M.A.; Arabzadeh, A.; Ceylan, H.; Kim, S.; Gopalakrishnan, K. Effect of Carbon-Fiber Properties on Volumetrics and Ohmic Heating of Electrically Conductive Asphalt Concrete. J. Mater. Civ. Eng. 2019, 31, 04019200. [Google Scholar] [CrossRef]
- Li, C.; Ge, H.; Sun, D.; Zhou, X. Novel conductive wearing course using a graphite, carbon fiber, and epoxy resin mixture for active de-icing of asphalt concrete pavement. Mater. Struct. 2021, 54, 1–17. [Google Scholar] [CrossRef]
- Tang, N.; Pan, W.H.; Chen, Y.W.; Dai, M.; Wang, Q. Numerical and Experimental Investigation of Piezoresistance of Asphalt Concrete Containing Graphite. Mater. Sci. Forum 2016, 852, 1383–1390. [Google Scholar] [CrossRef]
- Wen, X.B.; Wang, H.P.; Yang, J. Electrical Conductivity and Rheological Properties of Asphalt Binder Containing Graphite. In Proceedings of the 19th COTA International Conference of Transportation Professionals, Nanjing, China, 6–8 July 2019. [Google Scholar]
- Kim, K.; Regan, W.; Geng, B.; Alemán, B.; Kessler, B.M.; Wang, F.; Crommie, M.F.; Zettl, A. High-temperature stability of suspended single-layer graphene. Phys. Status Solidi (RRL)-Rapid Res. Lett. 2010, 4, 302–304. [Google Scholar] [CrossRef]
- Huang, W.; Yang, Y.; Song, P. Study on properties of graphene-carbon fiber conductive asphalt concrete. J. Road Eng. 2021, 46, 144–149. [Google Scholar]
- Nejad, F.M.; Vadood, M.; Baeetabar, S. Investigating the mechanical properties of carbon fibre-reinforced asphalt concrete. Road Mater. Pavement Des. 2014, 15, 465–475. [Google Scholar] [CrossRef]
- Rizvi, H.; Khattak, M.J.; Madani, M.; Khattab, A. Piezoresistive response of conductive Hot Mix Asphalt mixtures modified with carbon nanofibers. Constr. Build. Mater. 2016, 106, 618–631. [Google Scholar] [CrossRef]
- Li, N.; Wu, S.P.; Ma, L.X.; Huang, J.F. Performance evaluation of graphite and carbon fiber modified conductive asphalt concrete. Advances in Heterogeneous Material Mechanics 2008. In Proceedings of the 2nd International Conference on Heterogeneous Material Mechanics, ICHMM 2008, Huangshan, China, 3–8 June 2008; pp. 1065–1068. [Google Scholar]
- Li, H.; Zhu, L.; Qi, X.K.; Sun, M.; Zhang, X. Properties of Asphalt Conductive Concrete Containing Carbon Fibers and Graphite Powder. In Proceedings of the International Conference on Transportation Information and Safety, Wuhan, China, 30 June–2 July 2011. [Google Scholar]
- Ullah, S.; Yang, C.; Cao, L.; Wang, P.; Chai, Q.; Li, Y.; Wang, L.; Dong, Z.; Lushinga, N.; Zhang, B. Material design and performance improvement of conductive asphalt concrete incorporating carbon fiber and iron tailings. Constr. Build. Mater. 2021, 303, 124446. [Google Scholar] [CrossRef]
- Rudi, S.G.; Faez, R.; Moravvej-Farshi, M.K.; Saghafi, K. Effect of Stone-Wales defect on an armchair graphene nanoribbon-based photodetector. Superlattices Microstruct. 2019, 130, 127–138. [Google Scholar] [CrossRef]
- Huq, A.M.A.; Goh, K.L.; Zhou, Z.R.; Liao, K. On defect interactions in axially loaded single-walled carbon nanotubes. J. Appl. Phys. 2008, 103, 054306. [Google Scholar] [CrossRef]
- Huq, A.M.A.; Bhuiyan, A.K.; Liao, K.; Goh, K.L. Defect–Defect Interaction in Single-Walled Carbon Nanotubes Under Torsional Loading. Int. J. Mod. Phys. B 2010, 24, 1215–1226. [Google Scholar] [CrossRef]
- Wang, H.P.; Yang, J.; Liao, H.; Chen, X. Electrical and mechanical properties of asphalt concrete containing conductive fibers and fillers. Constr. Build. Mater. 2016, 122, 184–190. [Google Scholar] [CrossRef] [Green Version]
- Karimi, M.M.; Darabi, M.K.; Jahanbakhsh, H.; Jahangiri, B.; Rushing, J.F. Effect of steel wool fibers on mechanical and induction heating response of conductive asphalt concrete. Int. J. Pavement Eng. 2019, 21, 1755–1768. [Google Scholar] [CrossRef]
- Liu, Q.T.; Schlangen, E.; Garcia, A.; van de Ven, M. Induction heating of electrically conductive porous asphalt concrete. Constr. Build. Mater. 2010, 24, 1207–1213. [Google Scholar] [CrossRef]
- Li, H.C.; Yu, J.Y.; Liu, Q.T.; Li, Y.; Wu, Y.; Xu, H. Induction Heating and Healing Behaviors of Asphalt Concretes Doped with Different Conductive Additives. Adv. Mater. Sci. Eng. 2019, 2019, 1–10. [Google Scholar] [CrossRef] [Green Version]
- Jiao, W.X.; Sha, A.M.; Liu, Z.Z.; Li, W.; Jiang, W.; Qin, W.; Hu, Y. Study on thermal properties of steel slag asphalt concrete for snow-melting pavement. J. Clean. Prod. 2020, 277, 123574. [Google Scholar] [CrossRef]
- JTG/T3364-02-2019; Technical Specification for Design and Construction of Highway Steel Bridge Deck Pavement. People’s Transportation Publishing House: Beijing, China, 2019.
- JTG E20-2011; Highway Engineering Asphalt and Asphalt Mixture Test Procedures. People’s Transportation Press: Beijing, China, 2011.
- JTG E42-2005; Highway Engineering Aggregate Test Procedure. People’s Transportation Press: Beijing, China, 2005.
- Tan, Y.; Liu, K.; Wang, Y. Nonlinear volt-ampere characteristics of carbon fiber/graphene conductive asphalt concrete. J. Build. Mater. 2019, 22, 278–283. [Google Scholar]
- Song, P. The Preparation and Performance of Graphene Conductive Asphalt Concrete; Chongqing Jiaotong University: Chongqing, China, 2019. [Google Scholar]
- Wang, X.; Gao, Y. The preparation and electrical conductivity of carbon fiber graphite conductive asphalt concrete. Highway 2012, 1, 139–142. [Google Scholar]
- Zhang, H.; Wu, X.H.; Wang, X.L. Conductive mechanism of PANI/PP composite conductive fiber asphalt concrete. J. Dalian Univ. Technol. 2010, 50, 564–569. [Google Scholar]


| Targets of Test | Penetration Degree (25 °C, 100 g, 5 s) (10−1 mm) | Softening Point (Global Method) (°C) | Ductility (5 cm/min, 10 °C) (cm) | Flash Point (°C) | Density (g/cm3) | Wax Content (%) | Solubility (%) | After RTFOT (%) | Ductility (5 cm/min, 10 °C) (cm) | |
|---|---|---|---|---|---|---|---|---|---|---|
| Mass Variation | Penetration Ratio | |||||||||
| Test result | 54.1 | 77.1 | 33 | 674 | 1.137 | 1.3 | 99.5 | -0.3 | 77 | 16 |
| Technical requirement | 40~60 | ≥60 | ≥20 | ≥230 | actual | ≤3.0 | ≥99.0 | ≤±1.0 | ≥65 | ≥15 |
| Targets of Test | Appearance | Chemical Composition | Drop Melting Point (°C) | Flash Point (°C) |
|---|---|---|---|---|
| Measured value | White solid small particles | Long-chain aliphatic alkanes | 110.0 | 285.0 |
| Test Index | Apparent Specific Gravity (g/cm3) | Relative Density of Bulk Volume (g/cm3) | Water Absorption (%) | Content of Needle Flake Particles in Mixture (%) | Water Washing Method < 0.075 mm Particle Content (%) | Soft Stone Content (%) |
|---|---|---|---|---|---|---|
| Test result | 2.718 | 2.643 | 0.54 | 12.5 | 0.3 | 0.2 |
| Technical requirement | ≥2.60 | actual | ≤2.0 | ≤15 | ≤1 | ≤3 |
| Test Index | Losangeles Weared Value (%) | Apparent Specific Gravity (g/cm3) | Relative Density of Bulk Volume (g/cm3) | Water Absorption(%) | Content of Needle Flake Particles in Mixture (%) | Water Washing Method < 0.075 mm Particle Content (%) | Soft Stone Content (%) |
|---|---|---|---|---|---|---|---|
| Test result | 18.1 | 2.723 | 2.645 | 0.52 | 13.1 | 0.5 | 0.4 |
| Technical requirement | ≤28 | ≥2.60 | actual | ≤2.0 | ≤15 | ≤1 | ≤3 |
| Test Index | Apparent Specific Gravity (g/cm3) | Sand Equivalent (%) | Angularity (%) |
|---|---|---|---|
| Test result | 2.714 | 72.6 | 33.2 |
| Technical requirement | ≥2.50 | ≥60 | ≥30 |
| Targets of Test | Apparent Density (t/m3) | Water Content (%) | Size Range <0.6 mm (%) | <0.15 mm (%) | <0.075 mm (%) | Hydrophilic Coefficient |
|---|---|---|---|---|---|---|
| Test result | 2.726 | 0.2 | 100 | 96.8 | 86.5 | 0.50 |
| Technical requirement | ≥2.50 | ≤1 | 100 | 90–100 | 75–100 | <1.0 |
| Performance Parameter | Appearance | Purity (wt%) | Thickness (nm) | Specific Surface Area (m2/g) | Layer Diameter (μm) |
|---|---|---|---|---|---|
| Actual | black powder | 95 | 6 | 89 | 47 |
| Technical requirement | black powder | >90 | 3~8 | 50~150 | 10~50 |
| Performance Parameter | Tensile Modulus (GPa) | Density (g/cm3) | Tensile Strength (MPa) | Fiber Diameter (μm) | Bulk Density (g/cm3) | Carbon Content (%) |
|---|---|---|---|---|---|---|
| Actual | 220 | 1.76 | 3800 | 7 | 0.43 | 98.35 |
| Technology index | >200 | >1.72 | >3500 | 6~8 | >0.4 | >97 |
| Aggregate | Percentage of Passing through Each Sieve Hole (%) | ||||||||
|---|---|---|---|---|---|---|---|---|---|
| 13.2 | 9.5 | 4.75 | 2.36 | 1.18 | 0.6 | 0.3 | 0.15 | 0.075 | |
| 1# | 100 | 91.6 | 1.3 | 0.4 | 0.4 | 0.3 | 0.4 | 0.4 | 0.3 |
| 2# | 100 | 100.0 | 86.0 | 4.8 | 1.2 | 1.0 | 1.0 | 1.0 | 1.0 |
| 3# | 100 | 100.0 | 100.0 | 96.5 | 69.7 | 44.8 | 22.8 | 13.3 | 8.7 |
| Mineral fines | 100 | 100.0 | 100.0 | 100.0 | 100.0 | 100.0 | 99.1 | 96.4 | 85.0 |
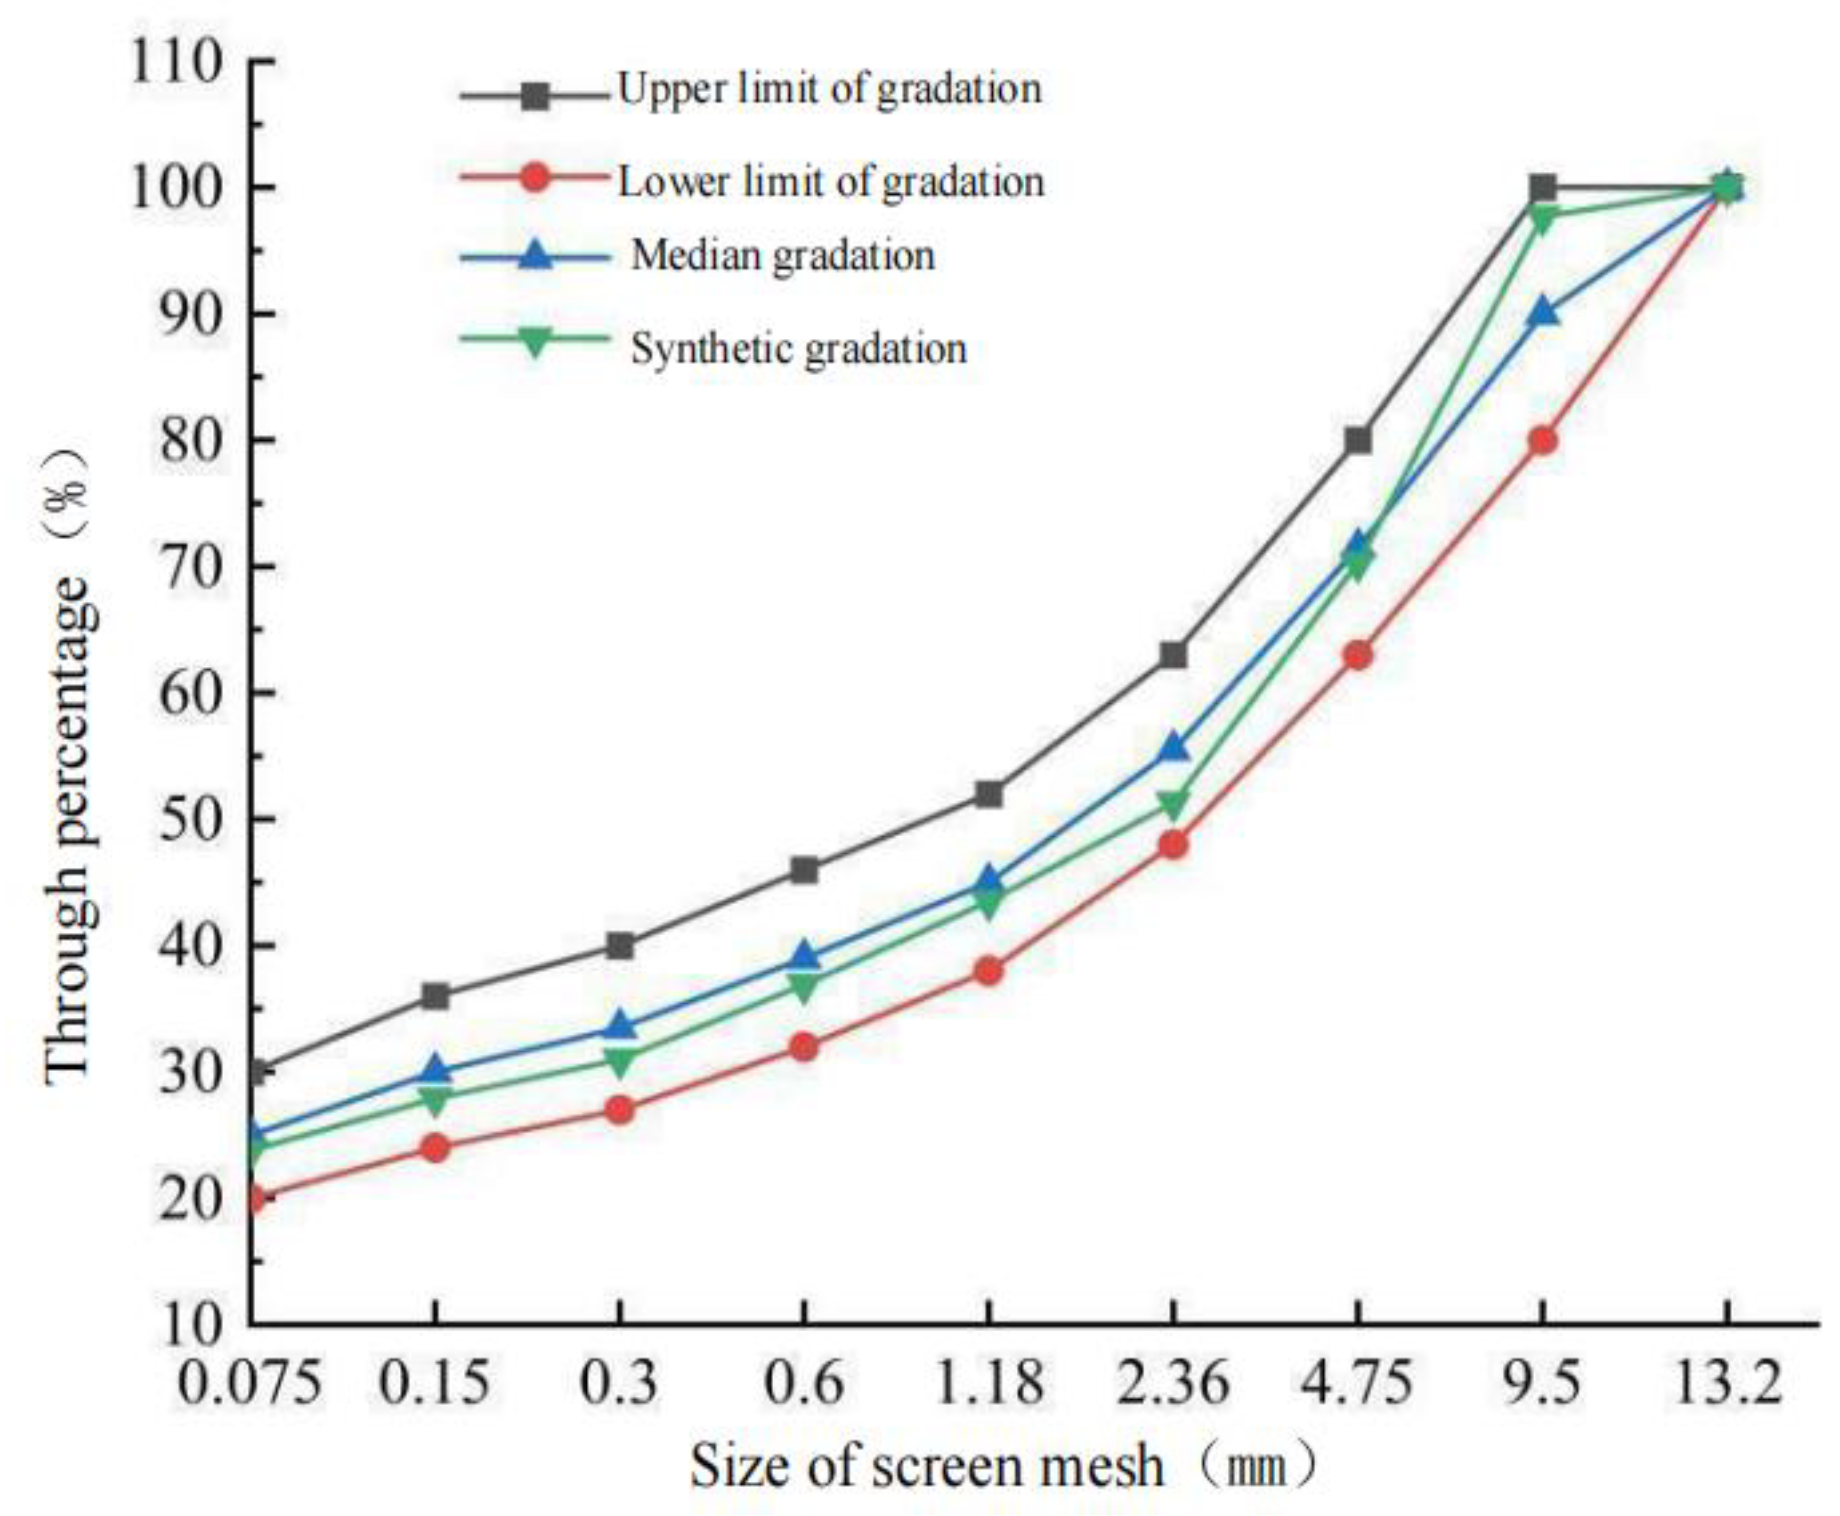
| Sieve Pore Diameter (mm) | 13.2 | 9.45 | 4.75 | 2.36 | 1.18 | 0.6 | 0.3 | 0.15 | 0.075 |
|---|---|---|---|---|---|---|---|---|---|
| Upper limit of gradation | 100 | 100 | 80 | 63 | 52 | 46 | 40 | 36 | 30 |
| Lower limit of gradation | 100 | 80 | 63 | 48 | 38 | 32 | 27 | 24 | 20 |
| Median gradation | 100 | 90 | 71.5 | 55.5 | 45 | 39 | 33.5 | 30 | 25 |
| Synthetic gradation | 100.0 | 97.7 | 70.3 | 51.3 | 43.5 | 36.9 | 31.0 | 27.9 | 23.8 |
| Mixture Type | Flexural Tensile Strength (MPa) | Maximum Bending Strength (με) | Bending Stiffness Modulus (MPa) |
|---|---|---|---|
| GA-10 | 10.073 | 3878.7 | 2597.0 |
| Technology index | — | 3000 | — |
| Content of Conductive Phase Materials | 45 min Deformation (mm) | 60 min Deformation (mm) | Dynamic Stability (times/mm) |
|---|---|---|---|
| 0.3% Carbon fiber + 0.4% graphene | 1.90 | 2.23 | 1885 |
| 0.3% Carbon fiber + 0.5% graphene | 1.76 | 2.08 | 1973 |
| 0.3% Carbon fiber + 0.6% graphene | 1.67 | 1.98 | 2063 |
| 0.3% Carbon fiber | 1.99 | 2.37 | 1678 |
| Undoped (GA-10) | 2.29 | 2.72 | 1473 |
| Technology index | — | — | 300 |
| Content of Conductive Phase Materials | Flexural Strength (MPa) | Maximum Bending Strength (με) | Bending Stiffness Modulus (MPa) |
|---|---|---|---|
| 0.3% Carbon fiber + 0.4% graphene | 12.958 | 4577.7 | 2800.7 |
| 0.3% Carbon fiber + 0.5% graphene | 12.335 | 4470.3 | 2759.3 |
| 0.3% Carbon fiber + 0.6% graphene | 11.773 | 4378.1 | 2689.1 |
| 0.3% Carbon fiber | 13.701 | 4857.8 | 2820.4 |
| Undoped (GA-10) | 10.022 | 3818.0 | 2624.9 |
| Technology index | — | 3000 | — |
| Standard deviation | 1.246 | 341.534 | 78.464 |
| Content of Conductive Phase Materials | 30 min Immersion Stability (kN) | 48h Stability of Immersion (kN) | Residual Stability (%) |
|---|---|---|---|
| 0.3% Carbon fiber + 0.4% graphene | 13.09 | 12.17 | 93.0 |
| 0.3% Carbon fiber + 0.5% graphene | 12.45 | 11.53 | 92.6 |
| 0.3% Carbon fiber + 0.6% graphene | 11.83 | 10.86 | 91.8 |
| 0.3% Carbon fiber | 13.75 | 12.88 | 93.7 |
| Undoped (GA-10) | 10.78 | 9.54 | 88.5 |
| Technology index | — | — | ≥80 |
| Content of Conductive Phase Materials | Splitting Strength before Freezing and Thawing (MPa) | Splitting Strength after Freezing and Thawing (MPa) | TSR (%) |
|---|---|---|---|
| 0.3% Carbon fiber + 0.4% graphene | 1.217 | 1.117 | 91.8 |
| 0.3% Carbon fiber + 0.5% graphene | 1.193 | 1.087 | 91.1 |
| 0.3% Carbon fiber + 0.6% graphene | 1.172 | 1.058 | 90.3 |
| 0.3% Carbon fiber | 1.383 | 1.195 | 92.8 |
| Undoped (GA-10) | 0.981 | 0.848 | 86.4 |
| Technology index | — | — | ≥80 |
| Content of Conductive Phase Materials | Average Fatigue Times (times) |
|---|---|
| 0.3% Carbon fiber + 0.4% graphene | 349,974 |
| 0.3% Carbon fiber + 0.5% graphene | 354,226 |
| 0.3% Carbon fiber + 0.6% graphene | 360,533 |
| 0.3% Carbon fiber | 334,787 |
| Undoped (GA-10) | 315,375 |
| Technology index | — |
| Standard deviation | 16,202.825 |
| Content of Conductive Phase Materials | Specimen Height H (mm) | Resistance R(Ω) | Average Resistance R(Ω) | Resistivity ρ (Ω·m) |
|---|---|---|---|---|
| 0.3% Carbon fiber + 0.4% graphene | 50.1 | 135.3 | 136.2 | 6.81 |
| 50.3 | 136.9 | |||
| 50.3 | 136.2 | |||
| 0.3% Carbon fiber + 0.5% graphene | 50.1 | 95.3 | 94.0 | 4.70 |
| 50.3 | 93.7 | |||
| 50.3 | 95.0 | |||
| 0.3% Carbon fiber + 0.6% graphene | 50.2 | 89.8 | 90.1 | 4.51 |
| 50.1 | 91.2 | |||
| 50.2 | 90.3 |
| Name of Material | Specific Heat Capacity J/(kg·K) | Density (kg/m3) |
|---|---|---|
| Ice | 2050.0 | 917 |
| Modified bituminous concrete | 813.2 | 2415 |
| Carbon fiber | 720.0 | 1760 |
| Graphene | 710.0 | 1800 |
| Time (min) | 0 | 10 | 20 | 30 | 40 | 50 | 60 | 80 | 100 | 120 |
| Temperature (°C) | 15.3 | 16.2 | 18.1 | 19.8 | 21.0 | 22.4 | 23.7 | 25.8 | 28.7 | 30.5 |
| Time (min) | 0 | 10 | 20 | 30 | 40 | 50 | 60 | 80 | 100 | 120 |
| Temperature (°C) | 15.3 | 16.6 | 18.7 | 20.3 | 21.7 | 23.3 | 24.5 | 26.2 | 29.0 | 31.2 |
| Content of Conductive Phase Materials | Resistance (Ω) | Resistivity (Ω·m) | Input Power (W) | Total Heat (kJ) | Specimen Specific Heat J/(kg·K) | Heating-Up (°C) | Heat Storage of Specimen (kJ) | Heat Generation Efficiency (%) |
|---|---|---|---|---|---|---|---|---|
| 0.3% Carbon fiber + 0.5% graphene | 94.0 | 6.64 | 26.59 | 191.45 | 820.3 | 15.2 | 136.78 | 71.4 |
| 0.3% Carbon fiber + 0.6% graphene | 90.1 | 6.36 | 27.74 | 199.73 | 827.5 | 15.9 | 143.81 | 72.0 |
| Parameter | Sign | Unit | Content of Conductive Phase Materials | |
|---|---|---|---|---|
| 0.3% Carbon Fiber + 0.5% Graphene | 0.3% Carbon Fiber + 0.6% Graphene | |||
| Resistance | R | Ω | 94.0 | 90.1 |
| Power on hours | t | s | 14,400 | 13,800 |
| Input power | P = U2/R | w | 26.59 | 27.74 |
| Total heat | Q = Pt | kJ | 382.89 | 382.81 |
| Specimen mass | M1 | kg | 10.97 | 10.93 |
| Specimen specific heat | C1 | J/(kg·K) | 820.3 | 827.5 |
| Ice quality | M2 | kg | 0.309 | 0.321 |
| Ice specific heat | C2 | J/(kg·K) | 2050.0 | 2050.0 |
| the solution heat of ice | Qi | J/(kg·K) | 3.35 × 10⁵ | 3.35 × 10⁵ |
| Temperature rises of specimen | T1 | °C | 15.0 | 15.7 |
| Ice rising temperature | T2 | °C | 10 | 10 |
| Heat storage energy of specimen | Q1 = M1C1T1 | kJ | 134.98 | 141.99 |
| Heat uptake by Ice | Q2 = M2C2T2 | kJ | 6.33 | 6.58 |
| Complete melting of ice absorbs heat | Q3 = M2Qi | kJ | 103.52 | 107.54 |
| Ice melting efficiency | H = (Q2 + Q3)/Q | % | 28.73% | 29.81% |
Disclaimer/Publisher’s Note: The statements, opinions and data contained in all publications are solely those of the individual author(s) and contributor(s) and not of MDPI and/or the editor(s). MDPI and/or the editor(s) disclaim responsibility for any injury to people or property resulting from any ideas, methods, instructions or products referred to in the content. |
© 2023 by the authors. Licensee MDPI, Basel, Switzerland. This article is an open access article distributed under the terms and conditions of the Creative Commons Attribution (CC BY) license (https://creativecommons.org/licenses/by/4.0/).
Share and Cite
Li, Z.; Guo, T.; Chen, Y.; Wang, Y.; Niu, X.; Tang, D.; Hao, M.; Zhao, X.; Liu, J. Preparation and Properties of Composite Graphene/Carbon Fiber Pouring Conductive Asphalt Concrete. Polymers 2023, 15, 1864. https://doi.org/10.3390/polym15081864
Li Z, Guo T, Chen Y, Wang Y, Niu X, Tang D, Hao M, Zhao X, Liu J. Preparation and Properties of Composite Graphene/Carbon Fiber Pouring Conductive Asphalt Concrete. Polymers. 2023; 15(8):1864. https://doi.org/10.3390/polym15081864
Chicago/Turabian StyleLi, Zhenxia, Tengteng Guo, Yuanzhao Chen, Yibin Wang, Xiangjie Niu, Deqing Tang, Menghui Hao, Xu Zhao, and Jinyuan Liu. 2023. "Preparation and Properties of Composite Graphene/Carbon Fiber Pouring Conductive Asphalt Concrete" Polymers 15, no. 8: 1864. https://doi.org/10.3390/polym15081864