
Chain Dynamics of Partially Disentangled UHMWPE around Melting Point Characterized by 1H Low-Field Solid-State NMR
 and
and
Abstract
:1. Introduction
2. Materials and Methods
2.1. Materials
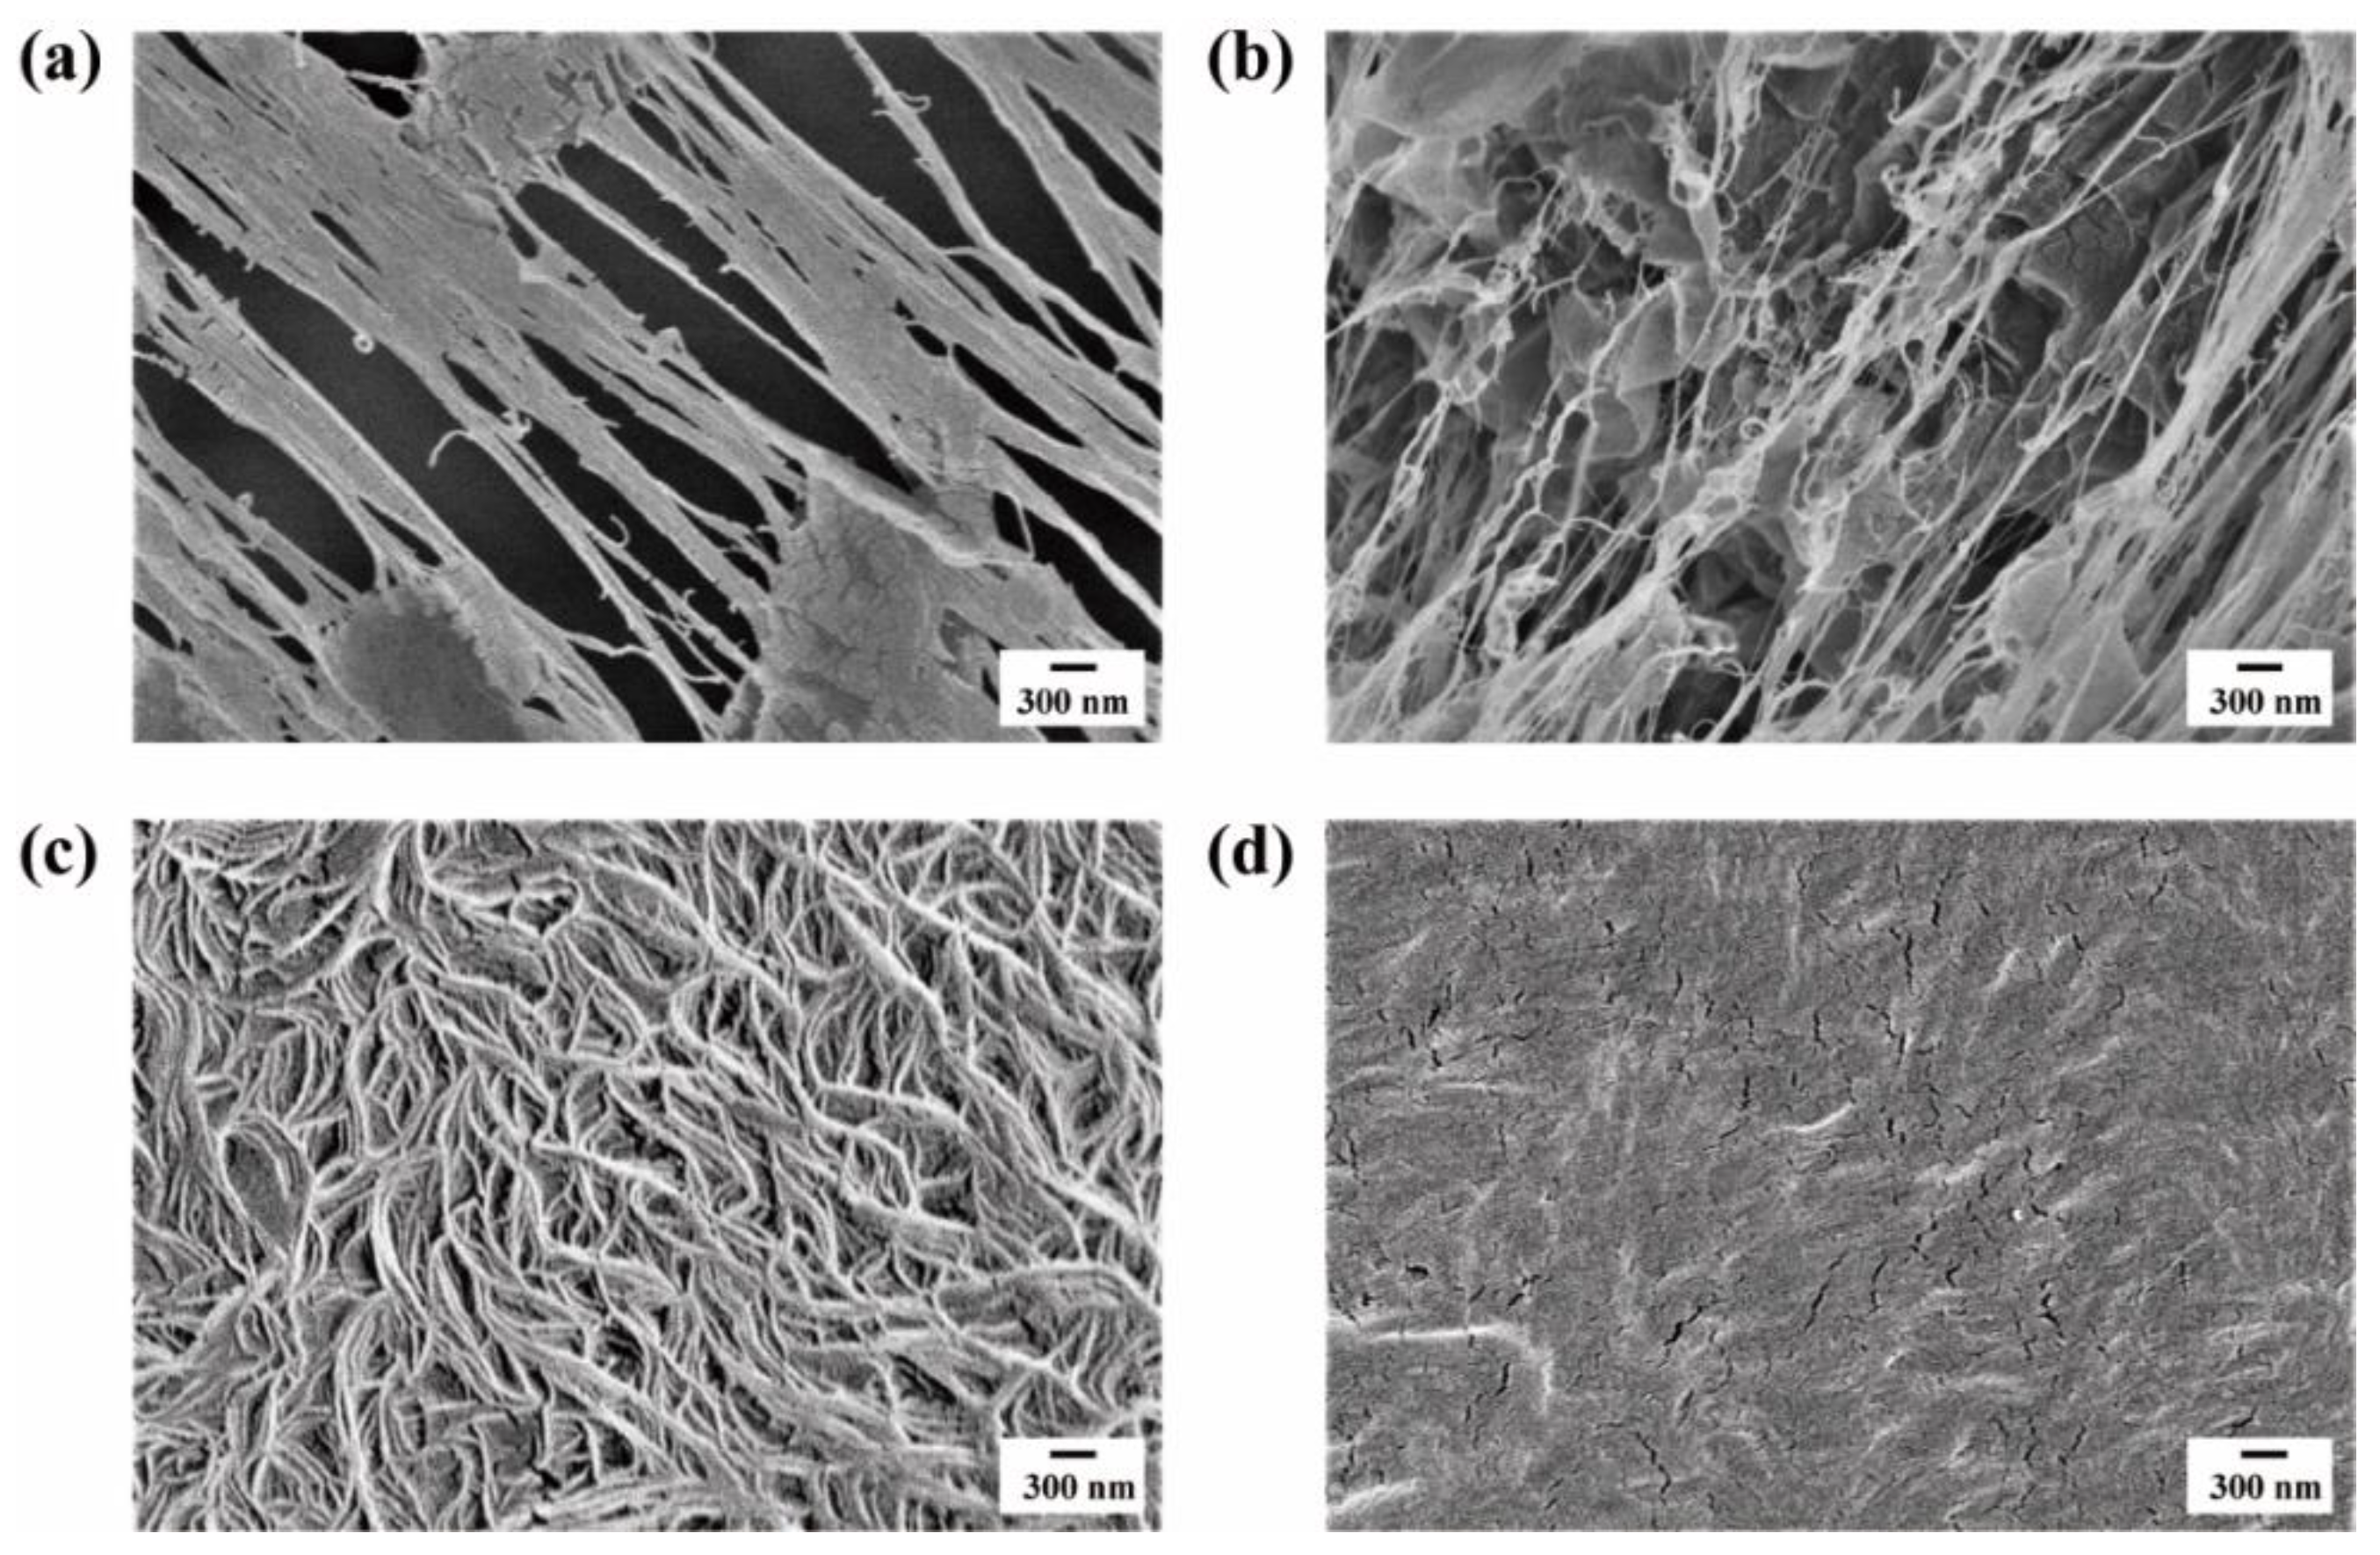
2.2. SEM
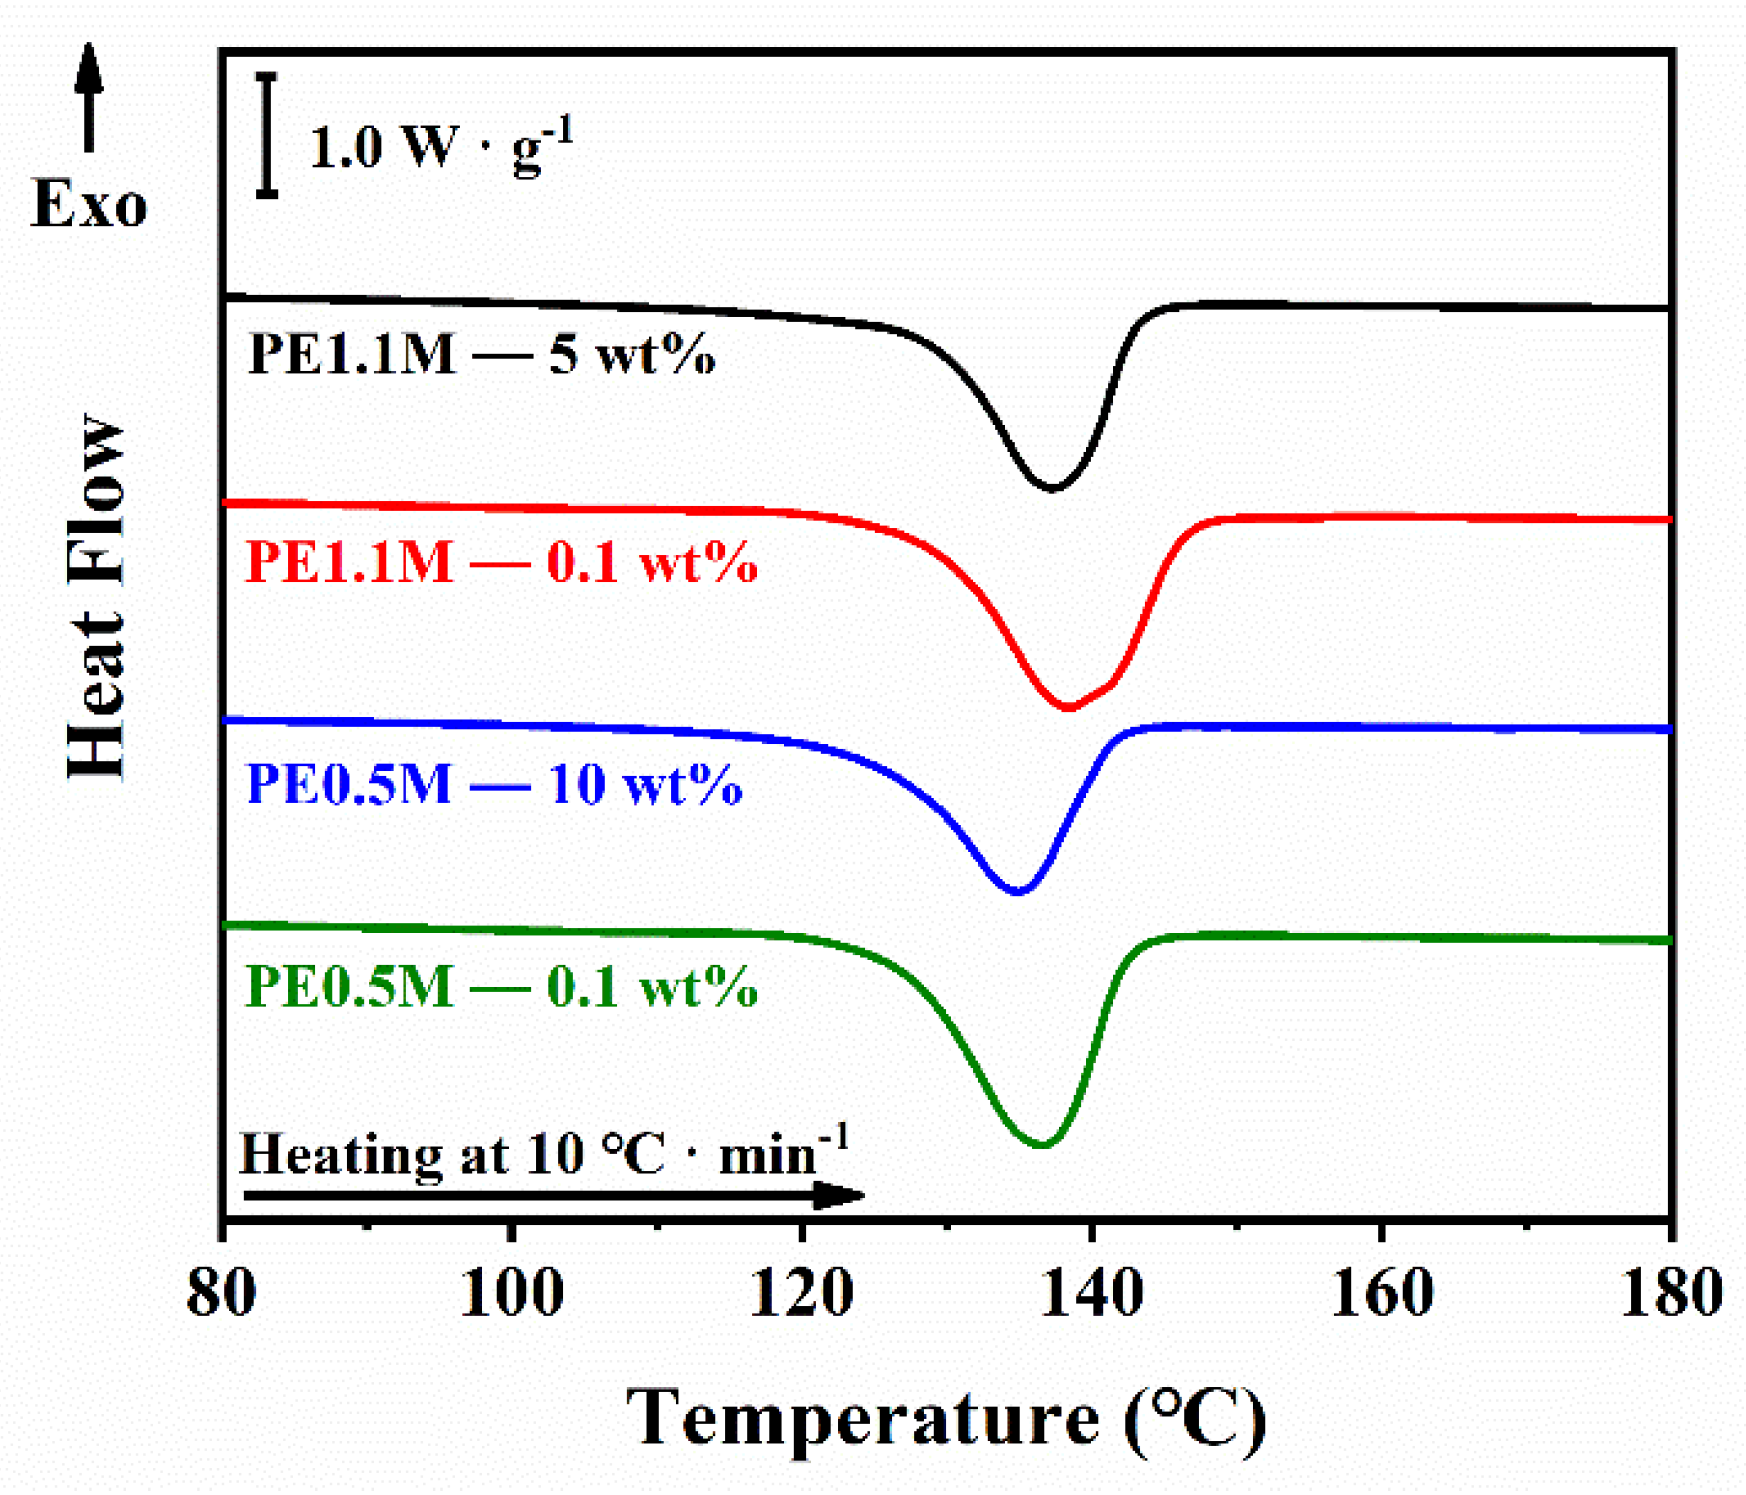
2.3. DSC
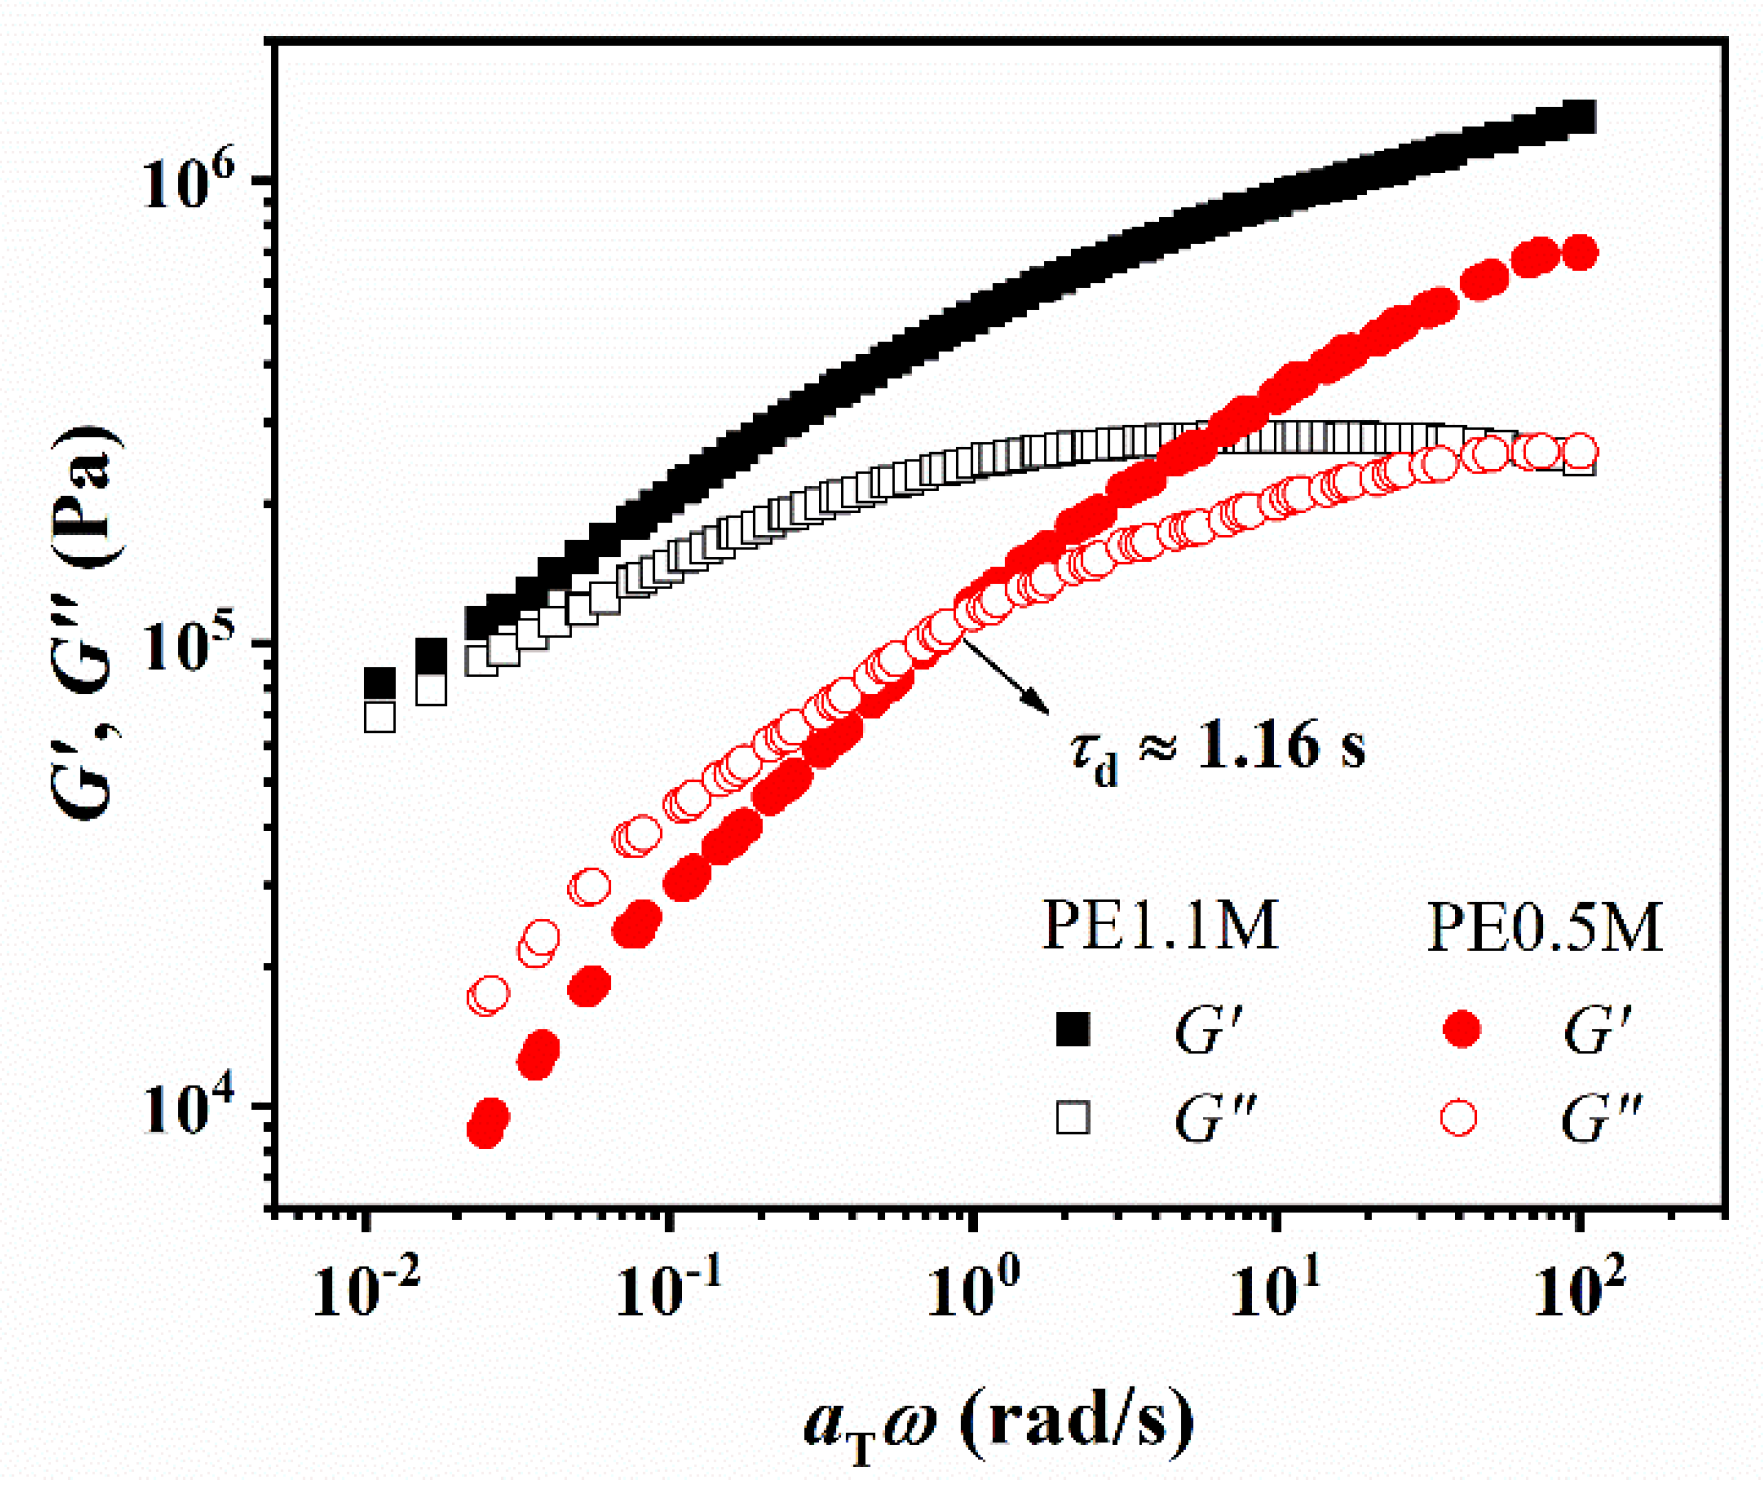
2.4. Rheological Measurement
2.5. Solid-State NMR
2.5.1. 1H MSE and 1H Hahn Echo NMR Measurements
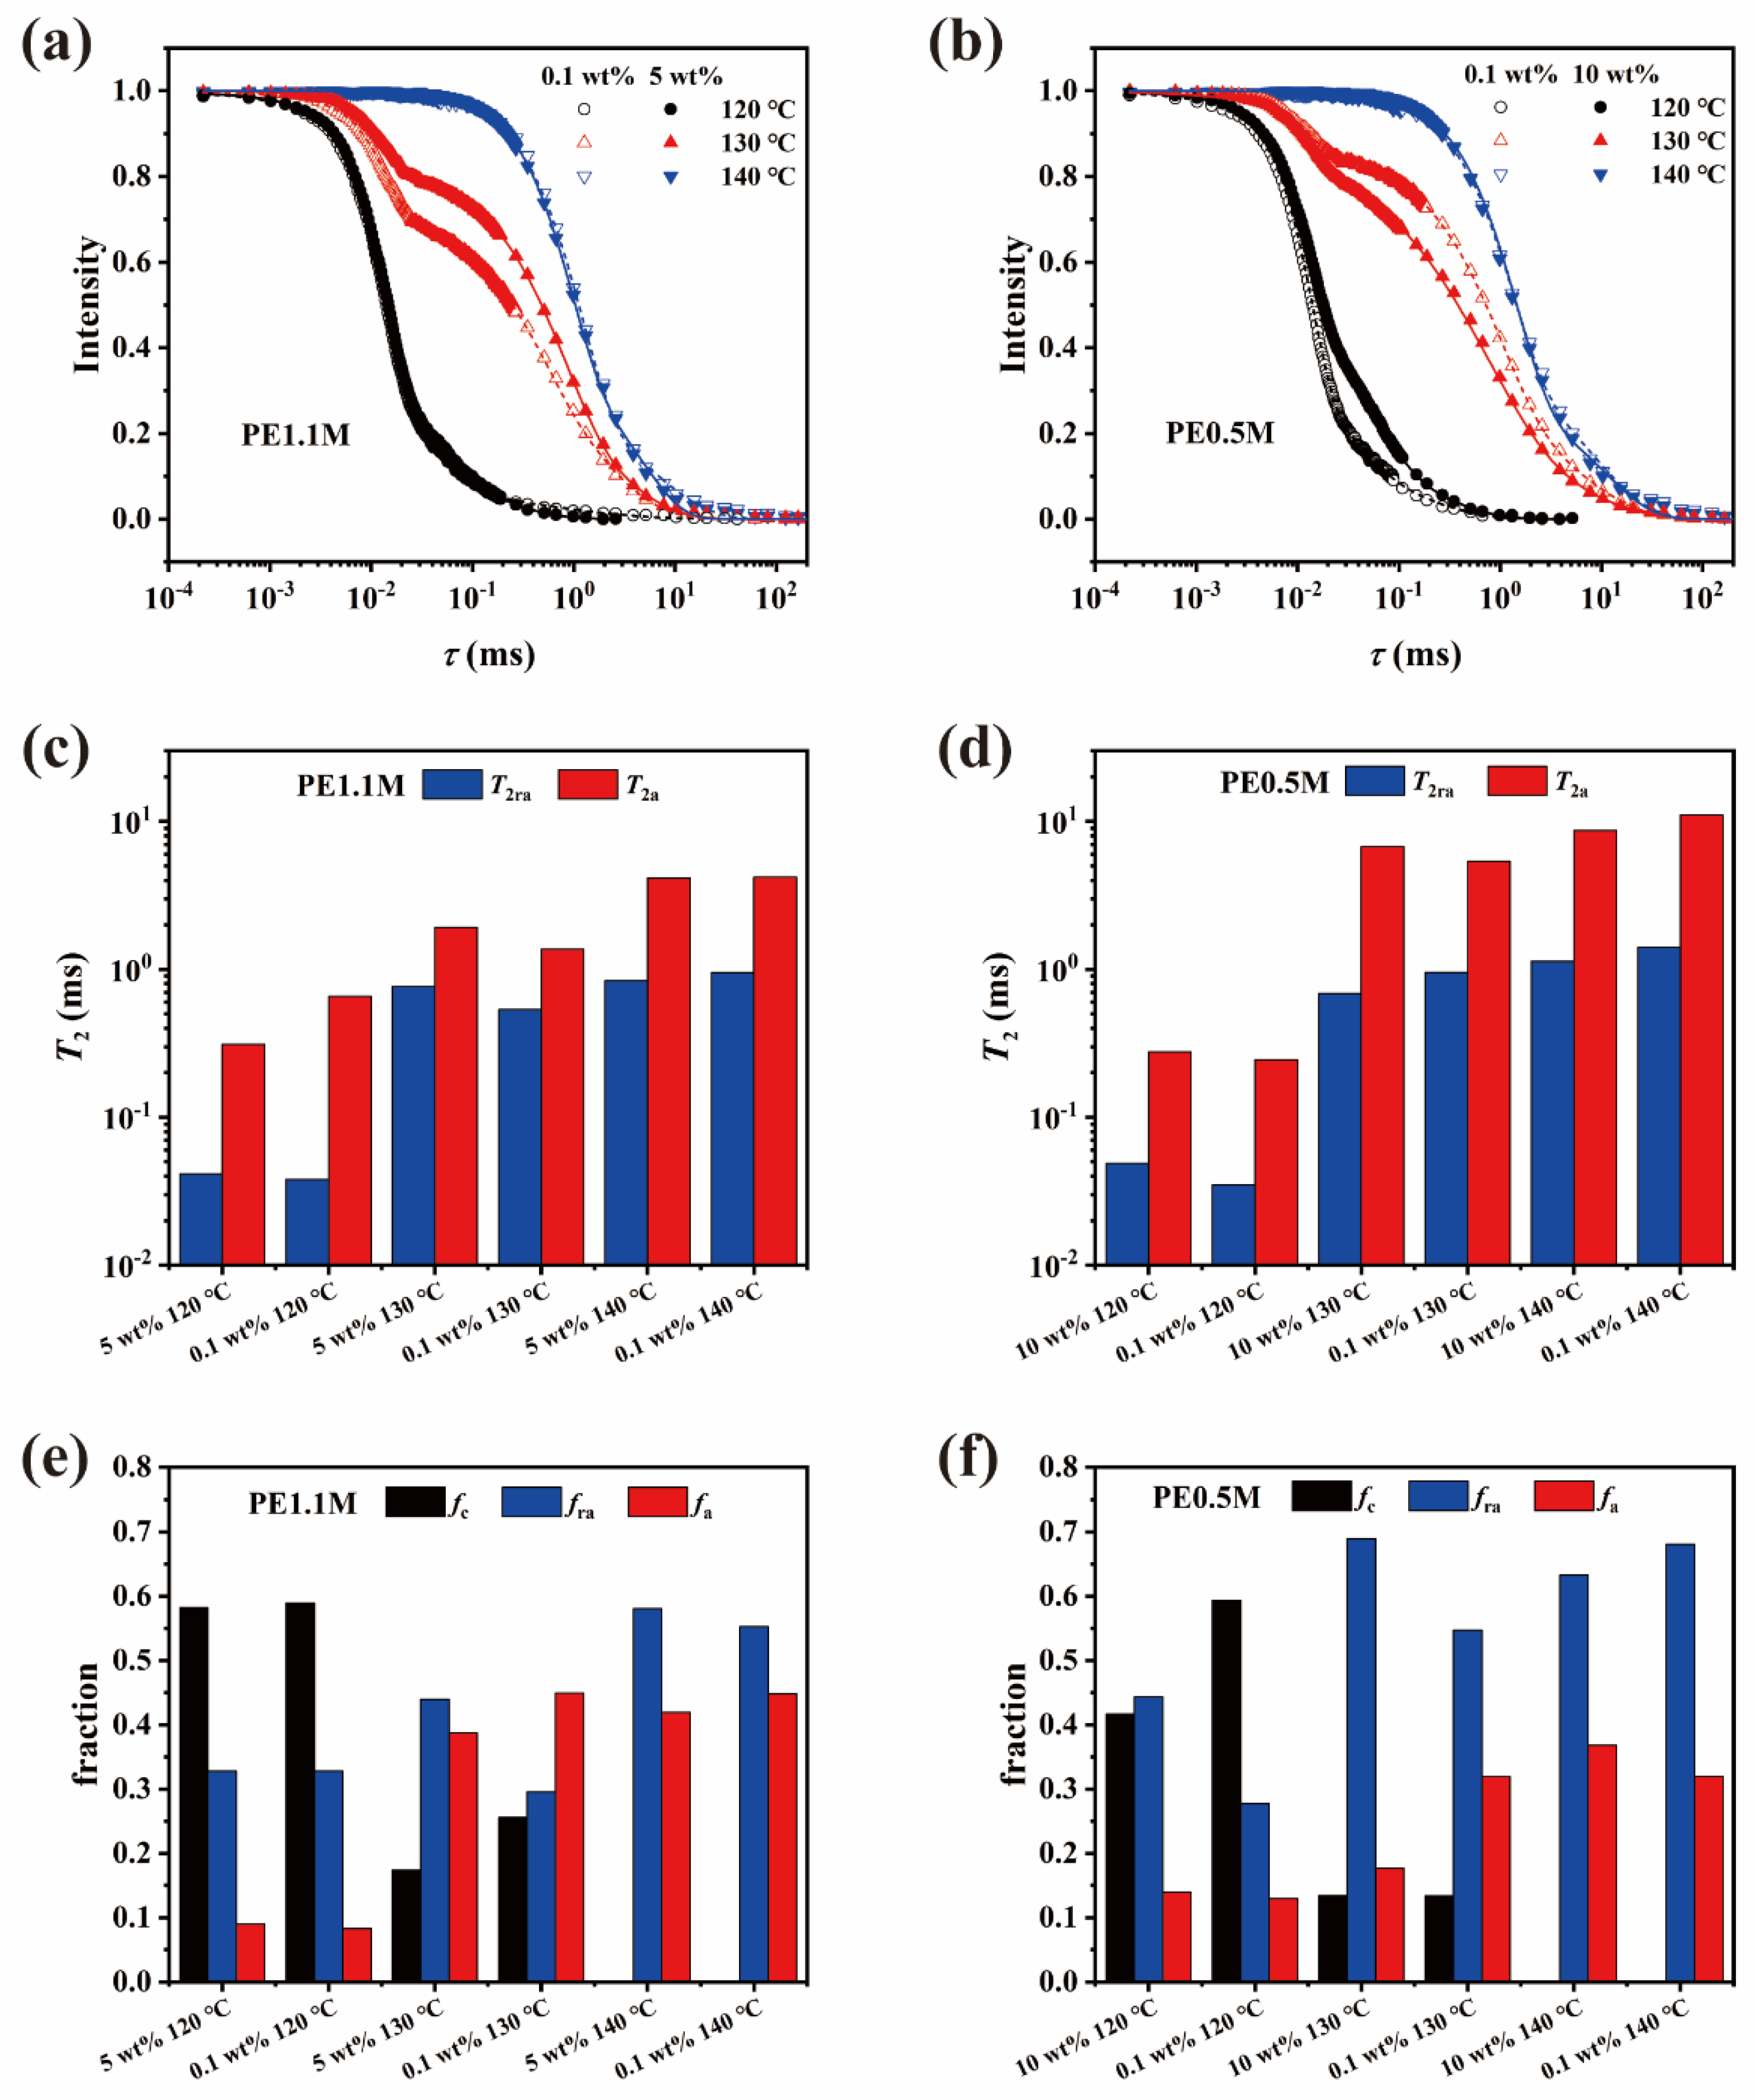
2.5.2. 1H DQ NMR Measurements
3. Results and Discussion
3.1. Crystallization
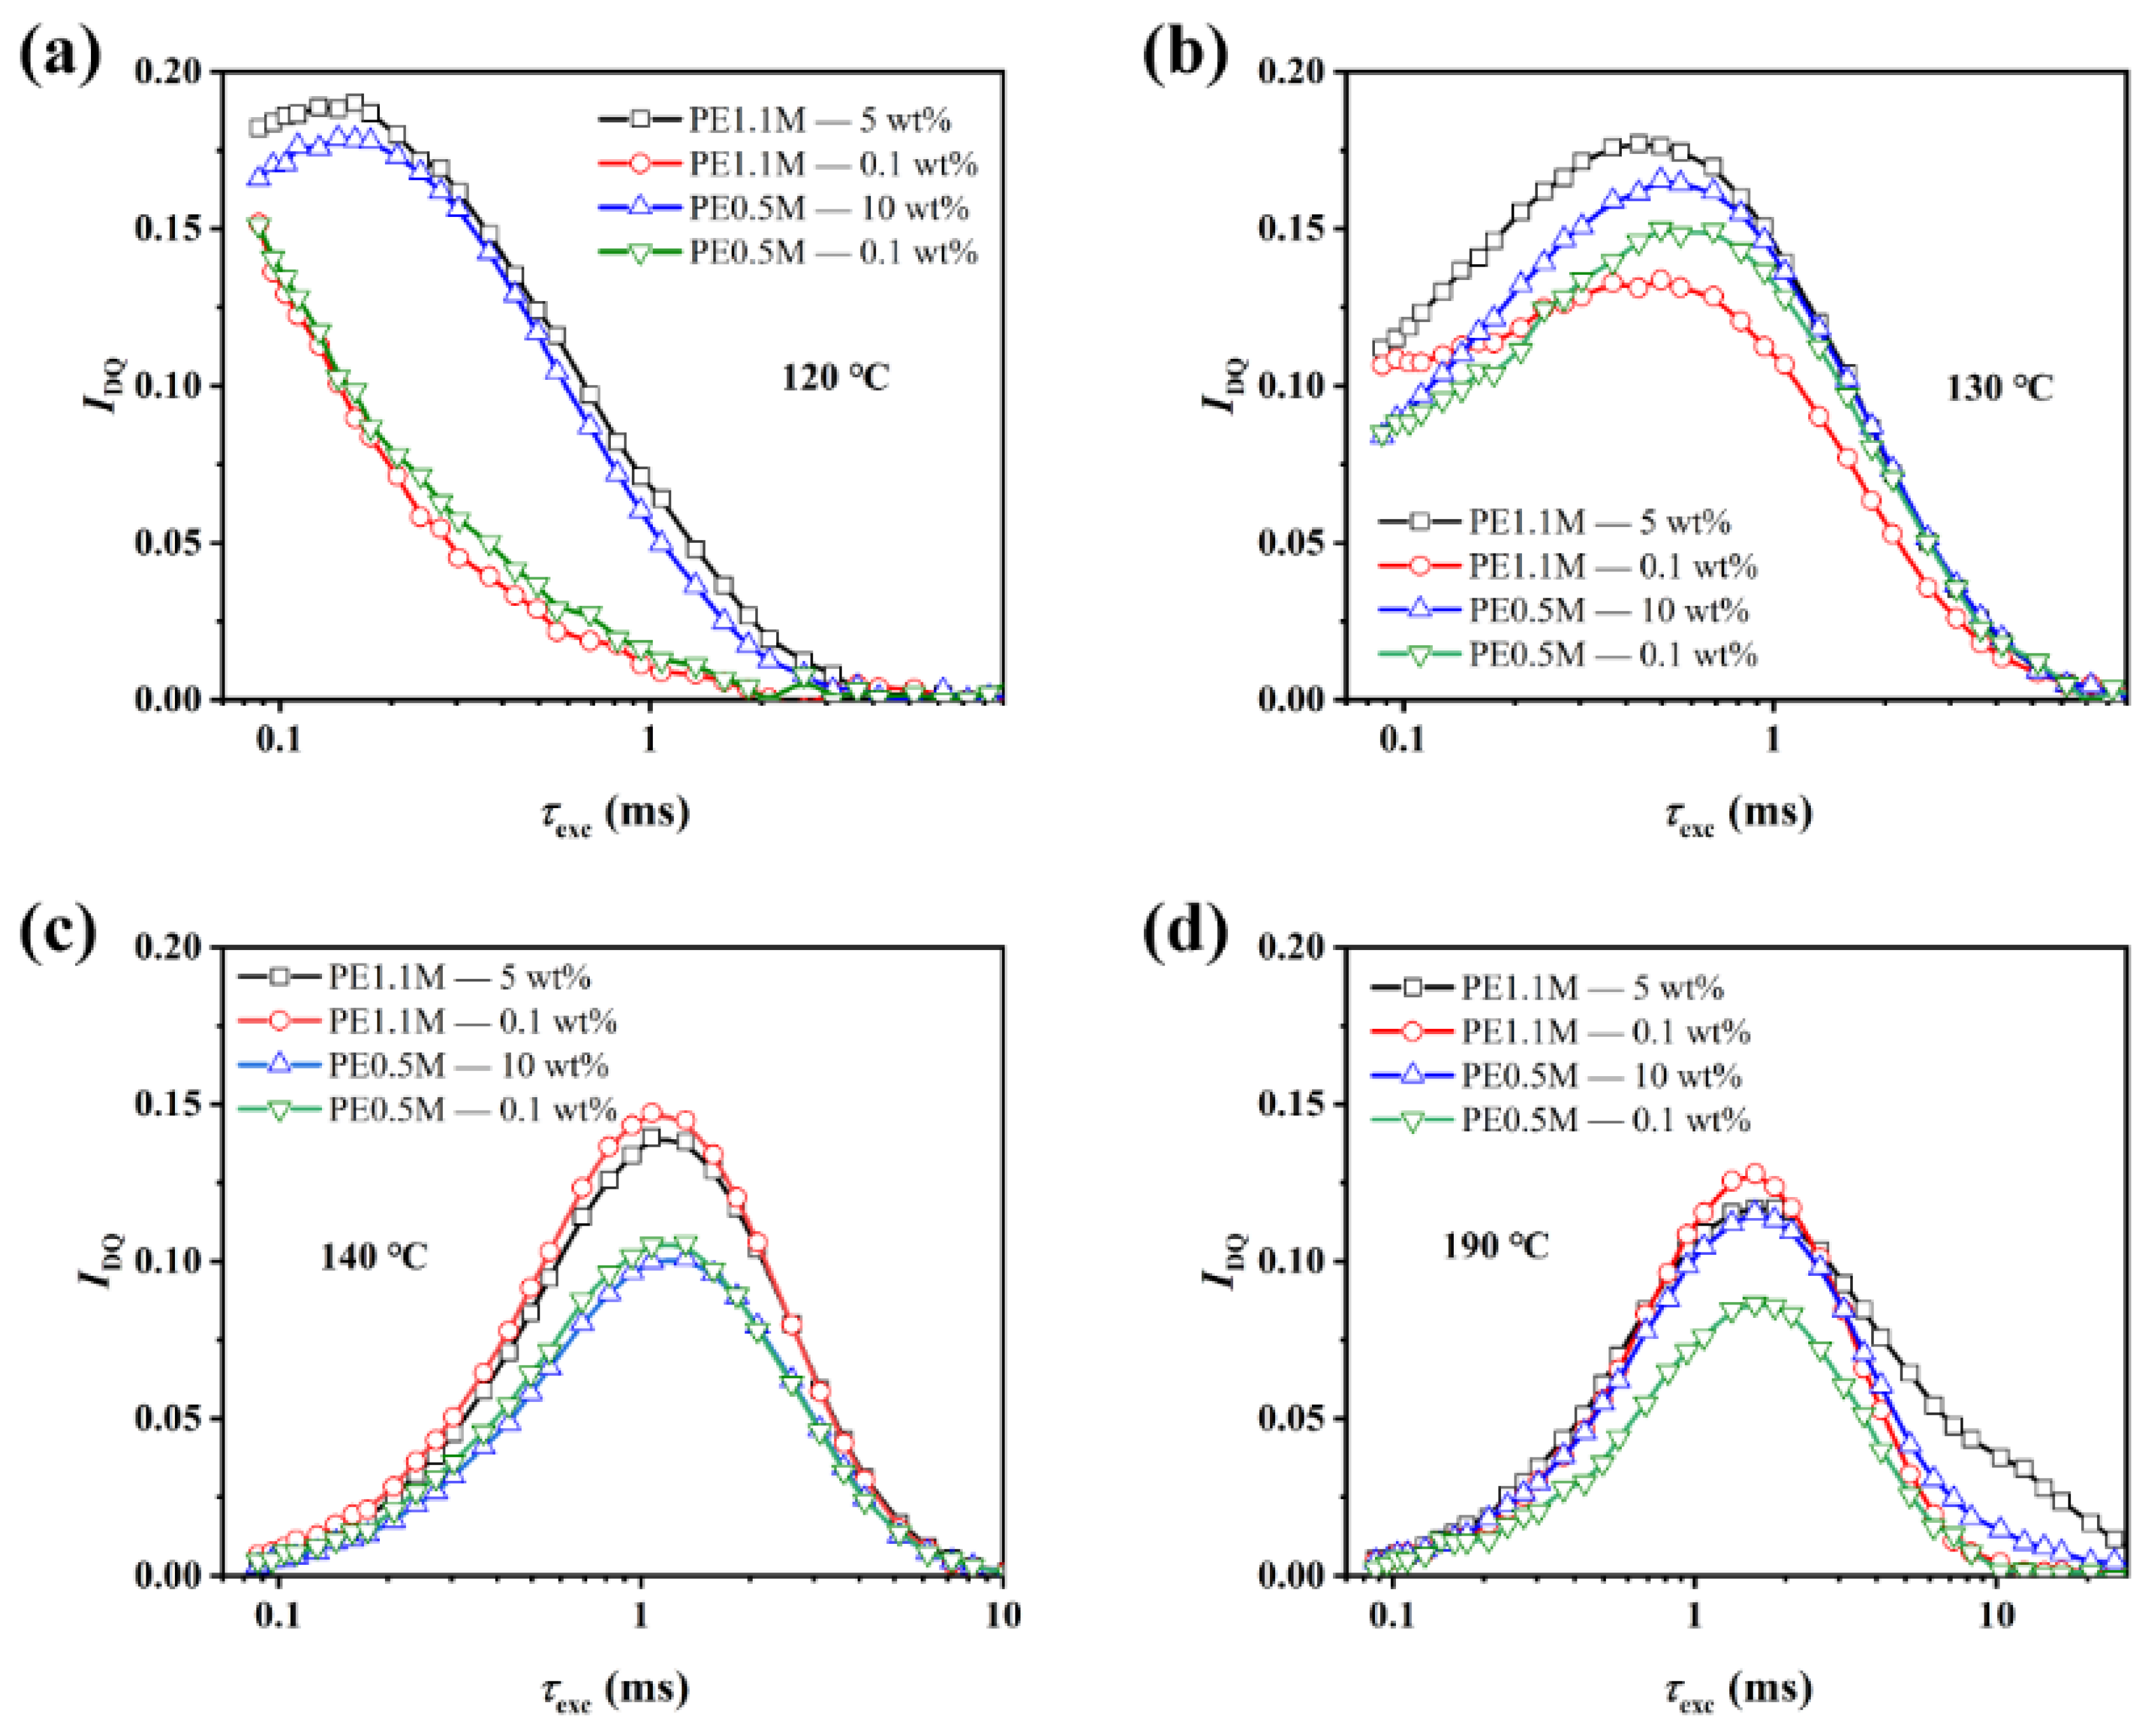
3.2. Chain Dynamics
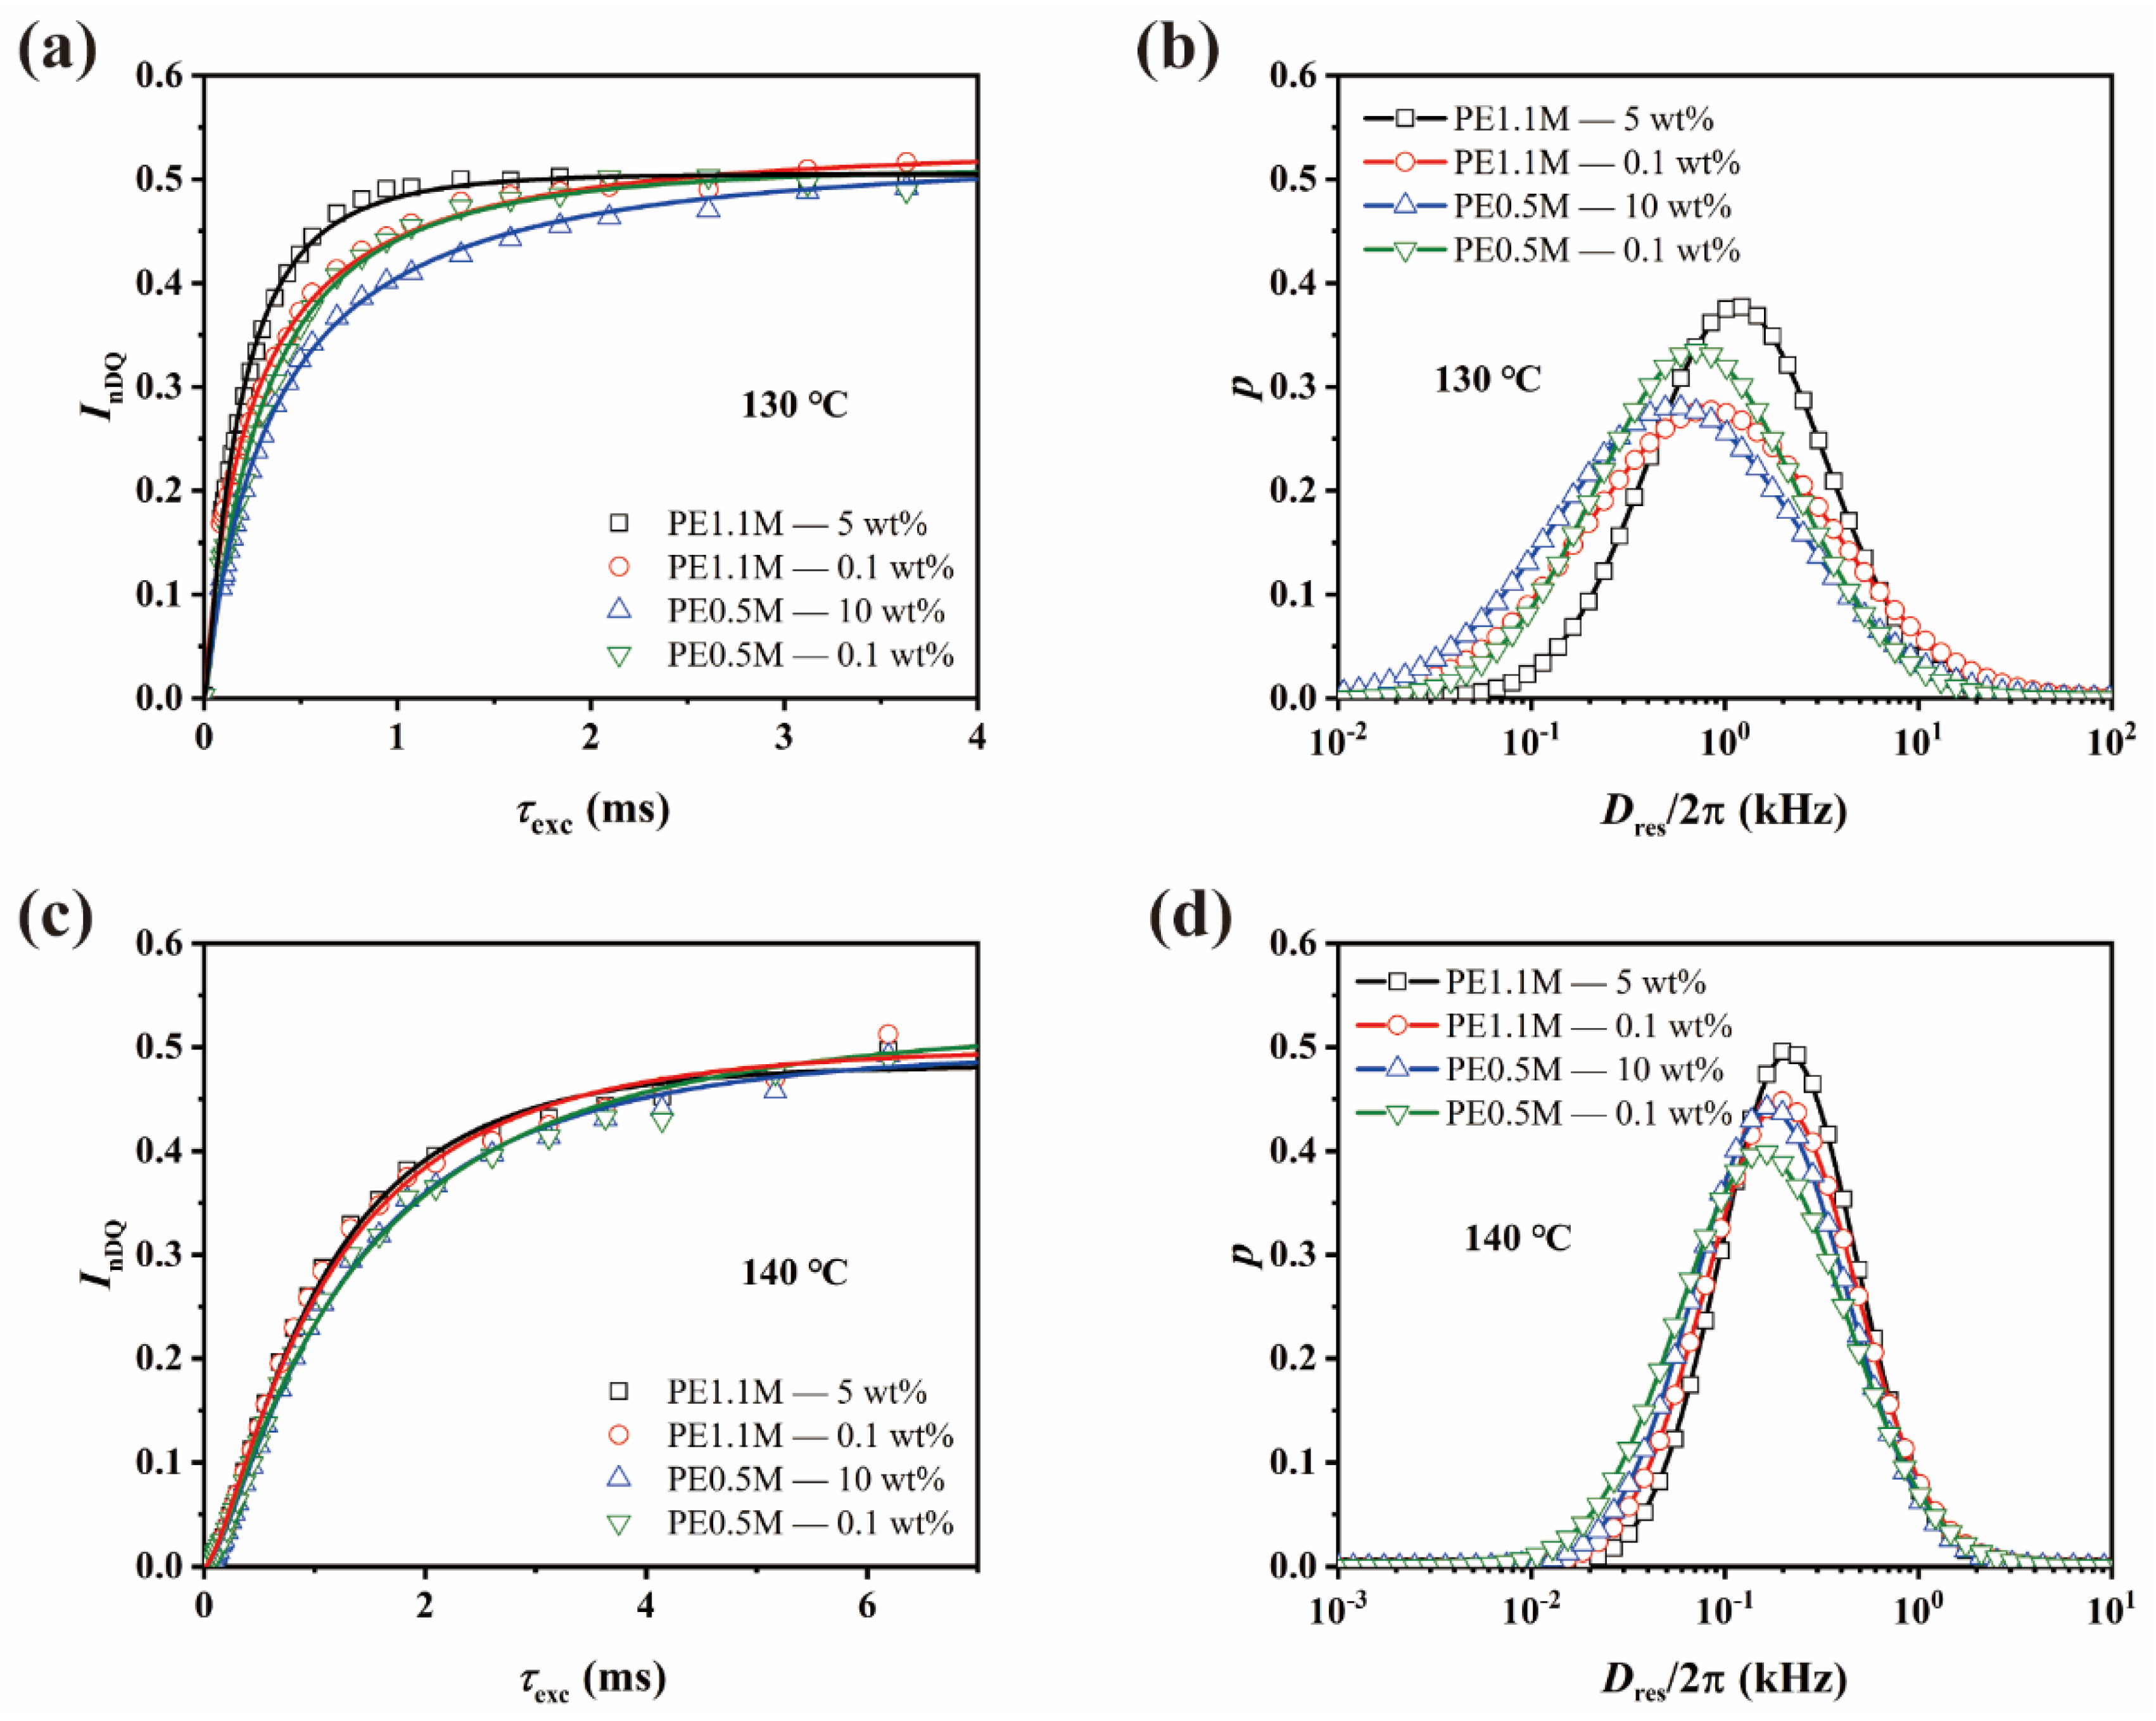
3.3. Entanglement Network
4. Conclusions
Supplementary Materials
Author Contributions
Funding
Institutional Review Board Statement
Informed Consent Statement
Data Availability Statement
Acknowledgments
Conflicts of Interest
References
- Kurtz, S.M. Editorial Comment: Advances in UHMWPE Biomaterials. Clin. Orthop. Relat. Res. 2015, 473, 926–927. [Google Scholar] [CrossRef]
- Kurtz, S.M. Advances in the processing, sterilization, and crosslinking of ultra-high molecular weight polyethylene for total joint arthroplasty. Biomaterials 1999, 20, 1659–1688. [Google Scholar] [CrossRef] [PubMed]
- Li, S.; Burstein, A.H. Ultra-high molecular weight polyethylene. The material and its use in total joint implants. J. Bone Jt. Surg. 1994, 76, 1080–1090. [Google Scholar] [CrossRef] [PubMed]
- Gao, Q.; Hu, J.-T.; Yang, Y.; Wang, M.; Zhang, M.; Tang, Z.; Zhang, M.; Liu, W.; Wu, G.-Z. Fabrication of New High-Performance UHMWPE-Based Conductive Fibers in a Universal Process. Ind. Eng. Chem. Res. 2018, 58, 935–943. [Google Scholar] [CrossRef]
- Liu, S.; Zhou, C.; Yu, W. Phase separation and structure control in ultra-high molecular weight polyethylene microporous membrane. J. Membr. Sci. 2011, 379, 268–278. [Google Scholar] [CrossRef]
- Oral, E.; Wannomae, K.K.; Hawkins, N.; Harris, W.H.; Muratoglu, O.K. α-Tocopherol-doped irradiated UHMWPE for high fatigue resistance and low wear. Biomaterials 2004, 25, 5515–5522. [Google Scholar] [CrossRef]
- Liu, X.; Yu, W. Role of chain dynamics in the melt memory effect of crystallization. Macromolecules 2020, 53, 7887–7898. [Google Scholar] [CrossRef]
- Milner, S.T.; McLeish, T. Reptation and Contour-Length Fluctuations in Melts of Linear Polymers. Phys. Rev. Lett. 1998, 81, 725–728. [Google Scholar] [CrossRef]
- Psarski, M.; Piorkowska, E.; Galeski, A. Crystallization of Polyethylene from Melt with Lowered Chain Entanglements. Macromolecules 2000, 33, 916–932. [Google Scholar] [CrossRef]
- Rastogi, S.; Spoelstra, A.B.; Goossens, J.G.P.; Lemstra, P.J. Chain Mobility in Polymer Systems: On the Borderline between Solid and Melt. 1. Lamellar Doubling during Annealing of Polyethylene. Macromolecules 1997, 30, 7880–7889. [Google Scholar] [CrossRef]
- Everaers, R.; Sukumaran, S.K.; Grest, G.S.; Svaneborg, C.; Sivasubramanian, A.; Kremer, K. Rheology and Microscopic Topology of Entangled Polymeric Liquids. Science 2004, 303, 823–826. [Google Scholar] [CrossRef]
- Pandey, A.; Champouret, Y.; Rastogi, S. Heterogeneity in the Distribution of Entanglement Density during Polymerization in Disentangled Ultrahigh Molecular Weight Polyethylene. Macromolecules 2011, 44, 4952–4960. [Google Scholar] [CrossRef]
- Rastogi, S.; Lippits, D.R.; Peters, G.W.M.; Graf, R.; Yao, Y.; Spiess, H. Heterogeneity in polymer melts from melting of polymer crystals. Nat. Mater. 2005, 4, 635–641. [Google Scholar] [CrossRef]
- Wool, R.P. Polymer entanglements. Macromolecules 1993, 26, 1564–1569. [Google Scholar] [CrossRef]
- Pawlak, A. The Entanglements of Macromolecules and Their Influence on the Properties of Polymers. Macromol. Chem. Phys. 2019, 220, 1900043. [Google Scholar] [CrossRef]
- Kong, D.; Yang, M.; Zhang, X.; Du, Z.; Fu, Q.; Gao, X.; Gong, J. Control of Polymer Properties by Entanglement: A Review. Macromol. Mater. Eng. 2021, 306, 2100536. [Google Scholar] [CrossRef]
- Pawlak, A.; Krajenta, J.; Galeski, A. The crystallization of polypropylene with reduced density of entanglements. J. Polym. Sci. Part B Polym. Phys. 2017, 27, 748–756. [Google Scholar] [CrossRef]
- Schulz, M.; Schäfer, M.; Saalwächter, K.; Thurn-Albrecht, T. Competition between crystal growth and intracrystalline chain diffusion determines the lamellar thickness in semicrystalline polymers. Nat. Commun. 2022, 13, 119. [Google Scholar] [CrossRef] [PubMed]
- Li, Z.; Hong, Y.-L.; Yuan, S.; Kang, J.; Kamimura, A.; Otsubo, A.; Miyoshi, T. Determination of Chain-Folding Structure of Isotactic Polypropylene in Melt-Grown α Crystals by 13C–13C Double Quantum NMR and Selective Isotopic Labeling. Macromolecules 2015, 48, 5752–5760. [Google Scholar] [CrossRef]
- Schulz, M.; Seidlitz, A.; Kurz, R.; Bärenwald, R.; Petzold, A.; Saalwächter, K.; Thurn-Albrecht, T. The Underestimated Effect of Intracrystalline Chain Dynamics on the Morphology and Stability of Semicrystalline Polymers. Macromolecules 2018, 51, 8377–8385. [Google Scholar] [CrossRef]
- Yao, Y.-F.; Graf, R.; Spiess, H.; Rastogi, S. Restricted Segmental Mobility Can Facilitate Medium-Range Chain Diffusion: A NMR Study of Morphological Influence on Chain Dynamics of Polyethylene. Macromolecules 2008, 41, 2514–2519. [Google Scholar] [CrossRef]
- Rastogi, S.; Yao, Y.; Ronca, S.; Bos, J.; van der Eem, J. Unprecedented High-Modulus High-Strength Tapes and Films of Ultrahigh Molecular Weight Polyethylene via Solvent-Free Route. Macromolecules 2011, 44, 5558–5568. [Google Scholar] [CrossRef]
- Bärenwald, R.; Champouret, Y.; Saalwächter, K.; Schäler, K. Determination of Chain Flip Rates in Poly(ethylene) Crystallites by Solid-State Low-Field 1H NMR for Two Different Sample Morphologies. J. Phys. Chem. B 2012, 116, 13089–13097. [Google Scholar] [CrossRef] [PubMed]
- Litvinov, V.; Deblieck, R.; Clair, C.; Fonteyne, W.V.D.; Lallam, A.; Kleppinger, R.; Ivanov, D.A.; Ries, M.E.; Boerakker, M. Molecular Structure, Phase Composition, Melting Behavior, and Chain Entanglements in the Amorphous Phase of High-Density Polyethylenes. Macromolecules 2020, 53, 5418–5433. [Google Scholar] [CrossRef]
- Sun, Q.; Fu, Q.; Xue, G.; Chen, W. Crystallization Behavior of Syndiotactic Poly(propylene) Freeze-Dried from Toluene at Very Dilute Concentration. Macromol. Rapid Commun. 2001, 22, 1182–1185. [Google Scholar] [CrossRef]
- Chen, J.; Sun, Q.; Zou, Y.; Xue, G. DSC studies on the melting crystallization of polyethylenes prepared from alkanes of varying molecular size. Polymer 2002, 43, 6887–6891. [Google Scholar] [CrossRef]
- Xiao, Z.; Sun, Q.; Xue, G.; Yuan, Z.; Dai, Q.; Hu, Y. Thermal behavior of isotactic polypropylene freeze-extracted from solutions with varying concentrations. Eur. Polym. J. 2003, 39, 927–931. [Google Scholar] [CrossRef]
- Frisch, H.L.; Simha, R. Chapter 14—The Viscosity of Colloidal Suspensions and Macromolecular Solutions. In Rheology, 1st ed.; Eirich, F.R., Ed.; Academic Press: Cambridge, MA, USA, 1956; pp. 525–613. [Google Scholar]
- Wang, X.; Tao, F.; Sun, P.; Zhou, D.; Wang, Z.; Gu, Q.; Hu, J.; Xue, G. Probing Chain Interpenetration in Polymer Glasses by 1H Dipolar Filter Solid-State NMR under Fast Magic Angle Spinning. Macromolecules 2007, 40, 4736–4739. [Google Scholar] [CrossRef]
- Chang, L.P.; Morawetz, H. Study of the interpenetration of monodisperse polystyrene in semidilute solution by fluorescence after freeze-drying. Macromolecules 1987, 20, 428–431. [Google Scholar] [CrossRef]
- Li, W.; Yue, Z.; Lozovoi, A.; Petrov, O.; Mattea, C.; Stapf, S. Heterogeneous distribution of chain mobility in nascent UHMWPE in the less entangled state. J. Polym. Res. 2018, 25, 239. [Google Scholar] [CrossRef]
- Ahmadi, M.; Seiffert, S. Coordination Geometry Preference Regulates the Structure and Dynamics of Metallo-Supramolecular Polymer Networks. Macromolecules 2021, 54, 1388–1400. [Google Scholar] [CrossRef]
- Maus, A.; Hertlein, C.; Saalwächter, K. A Robust Proton NMR Method to Investigate Hard/Soft Ratios, Crystallinity, and Component Mobility in Polymers. Macromol. Chem. Phys. 2006, 207, 1150–1158. [Google Scholar] [CrossRef]
- Mauri, M.; Thomann, Y.; Schneider, H.; Saalwächter, K. Spin-diffusion NMR at low field for the study of multiphase solids. Solid State Nucl. Magn. Reson. 2008, 34, 125–141. [Google Scholar] [CrossRef] [PubMed]
- Schäler, K.; Ostas, E.; Schröter, K.; Thurn-Albrecht, T.; Binder, W.H.; Saalwächter, K. Influence of Chain Topology on Polymer Dynamics and Crystallization. Investigation of Linear and Cyclic Poly(ε-caprolactone)s by 1H Solid-State NMR Methods. Macromolecules 2011, 44, 2743–2754. [Google Scholar] [CrossRef]
- Litvinov, V.M.; Orza, R.A.; Klüppel, M.; van Duin, M.; Magusin, P.C.M.M. Rubber–Filler Interactions and Network Structure in Relation to Stress–Strain Behavior of Vulcanized, Carbon Black Filled EPDM. Macromolecules 2011, 44, 4887–4900. [Google Scholar] [CrossRef]
- Gao, Y.; Zhang, R.; Lv, W.; Liu, Q.; Wang, X.; Sun, P.; Winter, H.H.; Xue, G. Critical Effect of Segmental Dynamics in Polybutadiene/Clay Nanocomposites Characterized by Solid State 1H NMR Spectroscopy. J. Phys. Chem. C 2014, 118, 5606–5614. [Google Scholar] [CrossRef]
- Lange, F.; Schwenke, K.; Kurakazu, M.; Akagi, Y.; Chung, U.-I.; Lang, M.; Sommer, J.-U.; Sakai, T.; Saalwächter, K. Connectivity and Structural Defects in Model Hydrogels: A Combined Proton NMR and Monte Carlo Simulation Study. Macromolecules 2011, 44, 9666–9674. [Google Scholar] [CrossRef]
- Chassé, W.; Lang, M.; Sommer, J.-U.; Saalwächter, K. Cross-Link Density Estimation of PDMS Networks with Precise Consideration of Networks Defects. Macromolecules 2011, 45, 899–912. [Google Scholar] [CrossRef]
- Wang, H.; Peng, W.-S.; Wu, Q.; Zhao, Y.; Wang, S.-T.; Yang, Y.; Wu, J.-R.; Wang, X.-L.; Zhang, R.-C. Interplay of Crosslinking Structures and Segmental Dynamics in Solid-Liquid Elastomers. Chin. J. Polym. Sci. 2022, 40, 1297–1306. [Google Scholar] [CrossRef]
- Hoffman, J.D.; Miller, R.L. Kinetic of crystallization from the melt and chain folding in polyethylene fractions revisited: Theory and experiment. Polymer 1997, 38, 3151–3212. [Google Scholar] [CrossRef]
- Hu, W. Intramolecular Crystal Nucleation. In Progress in Understanding of Polymer Crystallization; Reiter, G., Strobl, G.R., Eds.; Springer: Berlin/Heidelberg, Germany, 2007; pp. 47–63. [Google Scholar]
- Hoffman, J.D.; Lauritzen, J.I. Crystallization of bulk polymers with chain folding: Theory of growth of lamellar spherulites. J. Res. Natl. Bur. Stand. Sect. A Phys. Chem. 1961, 65, 297–336. [Google Scholar] [CrossRef]
- Hoffman, J.D.; Davis, G.T.; Lauritzen, J.I. The Rate of Crystallization of Linear Polymers with Chain Folding. In Treatise on Solid State Chemistry; Hannay, N.B., Ed.; Springer: Boston, MA, USA, 1976; Volume 3, pp. 497–614. [Google Scholar]
- Li, Z.; Ye, C.; Feng, L.; Xia, J.; Zhang, L.; Zhao, W.; Hu, Y. Crystal morphology and corresponding physical properties of nascent ultra-high molecular weight polyethylene powder with short-branched chains. Polymer 2019, 181, 121758. [Google Scholar] [CrossRef]
- Flory, P.J. On the Morphology of the Crystalline State in Polymers. J. Am. Chem. Soc. 1962, 84, 2857–2867. [Google Scholar] [CrossRef]
- Mandelkern, L.; Alamo, R.G.; Kennedy, M.A. The interphase thickness of linear polyethylene. Macromolecules 1990, 23, 4721–4723. [Google Scholar] [CrossRef]
- Doi, M.; Edwards, S.F. Dynamics of concentrated polymer systems. Part 3.—The constitutive equation. J. Chem. Soc. Faraday Trans. 2 1978, 74, 1818–1832. [Google Scholar] [CrossRef]
- Röthemeyer, F.; Sommer, F. Kautschuktechnologie. In Kautschuk Technologie: Werkstoffe–Verarbeitung–Produkte, 3rd ed.; Carl Hanser Verlag GmbH & Co. KG: Munich, Germany, 2013; pp. I–XXXIII. [Google Scholar]
- Shahsavan, F.; Beiner, M.; Saalwächter, K. Chain dynamics in partially cross-linked polyethylene by combined rheology and NMR -based molecular rheology. J. Polym. Sci. 2021, 60, 1266–1276. [Google Scholar] [CrossRef]
- Zhang, R.; Yu, S.; Chen, S.; Wu, Q.; Chen, T.; Sun, P.; Li, B.; Ding, D. Reversible Cross-Linking, Microdomain Structure, and Heterogeneous Dynamics in Thermally Reversible Cross-Linked Polyurethane as Revealed by Solid-State NMR. J. Phys. Chem. B 2014, 118, 1126–1137. [Google Scholar] [CrossRef]
- Chávez, F.V.; Saalwächter, K. Time-Domain NMR Observation of Entangled Polymer Dynamics: Universal Behavior of Flexible Homopolymers and Applicability of the Tube Model. Macromolecules 2011, 44, 1549–1559. [Google Scholar] [CrossRef]
- Chávez, F.V.; Saalwächter, K. Time-Domain NMR Observation of Entangled Polymer Dynamics: Analytical Theory of Signal Functions. Macromolecules 2011, 44, 1560–1569. [Google Scholar] [CrossRef]
- Teng, C.; Gao, Y.; Wang, X.; Jiang, W.; Zhang, C.; Wang, R.; Zhou, D.; Xue, G. Reentanglement Kinetics of Freeze-Dried Polymers above the Glass Transition Temperature. Macromolecules 2012, 45, 6648–6651. [Google Scholar] [CrossRef]
- De Gennes, P.G. Tight knots. Macromolecules 1984, 17, 703–704. [Google Scholar] [CrossRef]
- Wang, H.; Yan, Z.; Li, D.; Wang, X.; Zhang, R. Solid-State NMR Spectroscopy. In Encyclopedia of Polymer Science and Technology, 4th ed.; Herman, F.M., Ed.; Wiley: New York City, NY, USA, 2022; pp. 1–30. [Google Scholar]
- Saalwächter, K. Proton multiple-quantum NMR for the study of chain dynamics and structural constraints in polymeric soft materials. Prog. Nucl. Magn. Reson. Spectrosc. 2007, 51, 1–35. [Google Scholar] [CrossRef]
- Lorthioir, C.; Randriamahefa, S.; Deloche, B. Some aspects of the orientational order distribution of flexible chains in a diblock mesophase. J. Chem. Phys. 2013, 139, 224903. [Google Scholar] [CrossRef] [PubMed]
- Jakisch, L.; Garaleh, M.; Schäfer, M.; Mordvinkin, A.; Saalwächter, K.; Böhme, F. Synthesis and Structural NMR Characterization of Novel PPG/PCL Conetworks Based upon Heterocomplementary Coupling Reactions. Macromol. Chem. Phys. 2017, 219, 1700327. [Google Scholar] [CrossRef]
- Zhang, R.; Zhang, C.; Yang, Z.; Wu, Q.; Sun, P.; Wang, X. Hierarchical Dynamics in a Transient Polymer Network Cross-Linked by Orthogonal Dynamic Bonds. Macromolecules 2020, 53, 5937–5949. [Google Scholar] [CrossRef]


| Samples | fc, 30 °C (%) | Tm (°C) | Xc (%) | l/nm |
|---|---|---|---|---|
| PE1.1M—0.1 wt% | 70.7 ± 1.7 | 139.2 ± 0.9 | 38.1 ± 3.3 | 41.9 ± 6.5 |
| PE1.1M—5 wt% | 64.2 ± 1.7 | 137.8 ± 0.6 | 34.8 ± 3.1 | 34.0 ± 2.7 |
| PE0.5M—0.1 wt% | 70.0 ± 1.9 | 136.5 ± 0.2 | 37.8 ± 1.4 | 28.9 ± 0.7 |
| PE0.5M—10 wt% | 59.2 ± 0.6 | 135.8 ± 0.6 | 34.5 ± 2.2 | 27.0 ± 1.7 |
Disclaimer/Publisher’s Note: The statements, opinions and data contained in all publications are solely those of the individual author(s) and contributor(s) and not of MDPI and/or the editor(s). MDPI and/or the editor(s) disclaim responsibility for any injury to people or property resulting from any ideas, methods, instructions or products referred to in the content. |
© 2023 by the authors. Licensee MDPI, Basel, Switzerland. This article is an open access article distributed under the terms and conditions of the Creative Commons Attribution (CC BY) license (https://creativecommons.org/licenses/by/4.0/).
Share and Cite
Zhao, Y.; Liang, Y.; Yao, Y.; Wang, H.; Lin, T.; Gao, Y.; Wang, X.; Xue, G. Chain Dynamics of Partially Disentangled UHMWPE around Melting Point Characterized by 1H Low-Field Solid-State NMR. Polymers 2023, 15, 1910. https://doi.org/10.3390/polym15081910
Zhao Y, Liang Y, Yao Y, Wang H, Lin T, Gao Y, Wang X, Xue G. Chain Dynamics of Partially Disentangled UHMWPE around Melting Point Characterized by 1H Low-Field Solid-State NMR. Polymers. 2023; 15(8):1910. https://doi.org/10.3390/polym15081910
Chicago/Turabian StyleZhao, Yan, Yuling Liang, Yingjie Yao, Hao Wang, Tong Lin, Yun Gao, Xiaoliang Wang, and Gi Xue. 2023. "Chain Dynamics of Partially Disentangled UHMWPE around Melting Point Characterized by 1H Low-Field Solid-State NMR" Polymers 15, no. 8: 1910. https://doi.org/10.3390/polym15081910