Figure 1.
Schematic diagram of cement concrete pavement lattice structure layer.
Figure 1.
Schematic diagram of cement concrete pavement lattice structure layer.
Figure 2.
KH400G automatic data acquisition system.
Figure 2.
KH400G automatic data acquisition system.
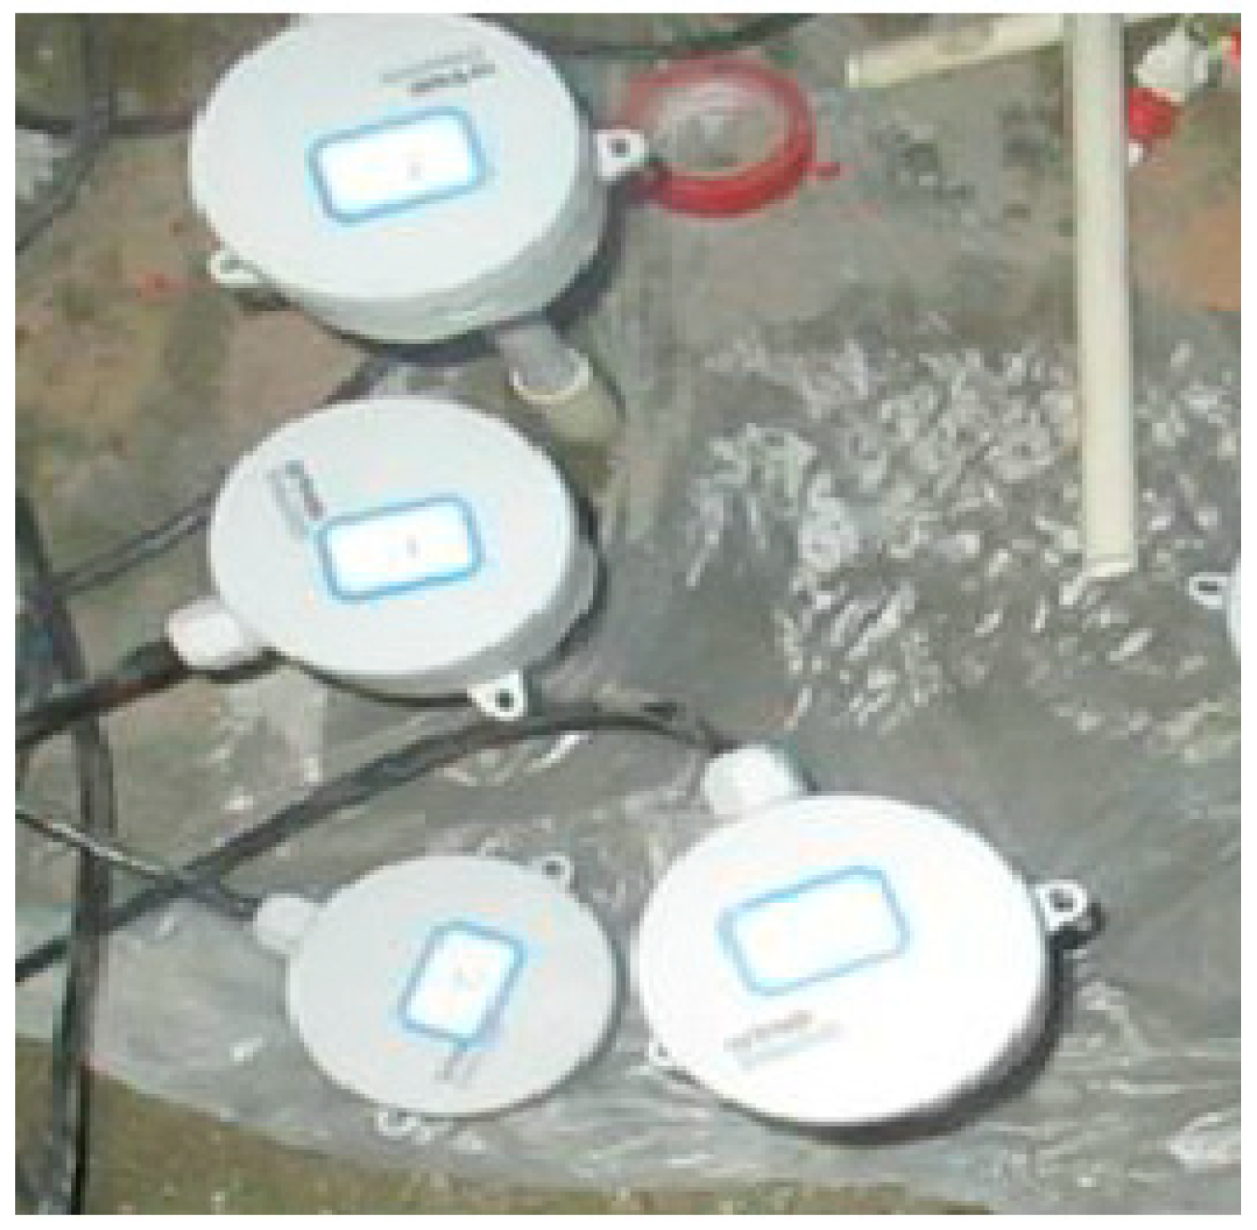
Figure 3.
TCA-TIH resistive integrated temperature and humidity sensors.
Figure 3.
TCA-TIH resistive integrated temperature and humidity sensors.
Figure 4.
Average temperature field of pavement surface at different times in different seasons. (a) Spring. (b) Summer. (c) Autumn. (d) Winter.
Figure 4.
Average temperature field of pavement surface at different times in different seasons. (a) Spring. (b) Summer. (c) Autumn. (d) Winter.
Figure 5.
Top of plat temperature–temperature difference in spring.
Figure 5.
Top of plat temperature–temperature difference in spring.
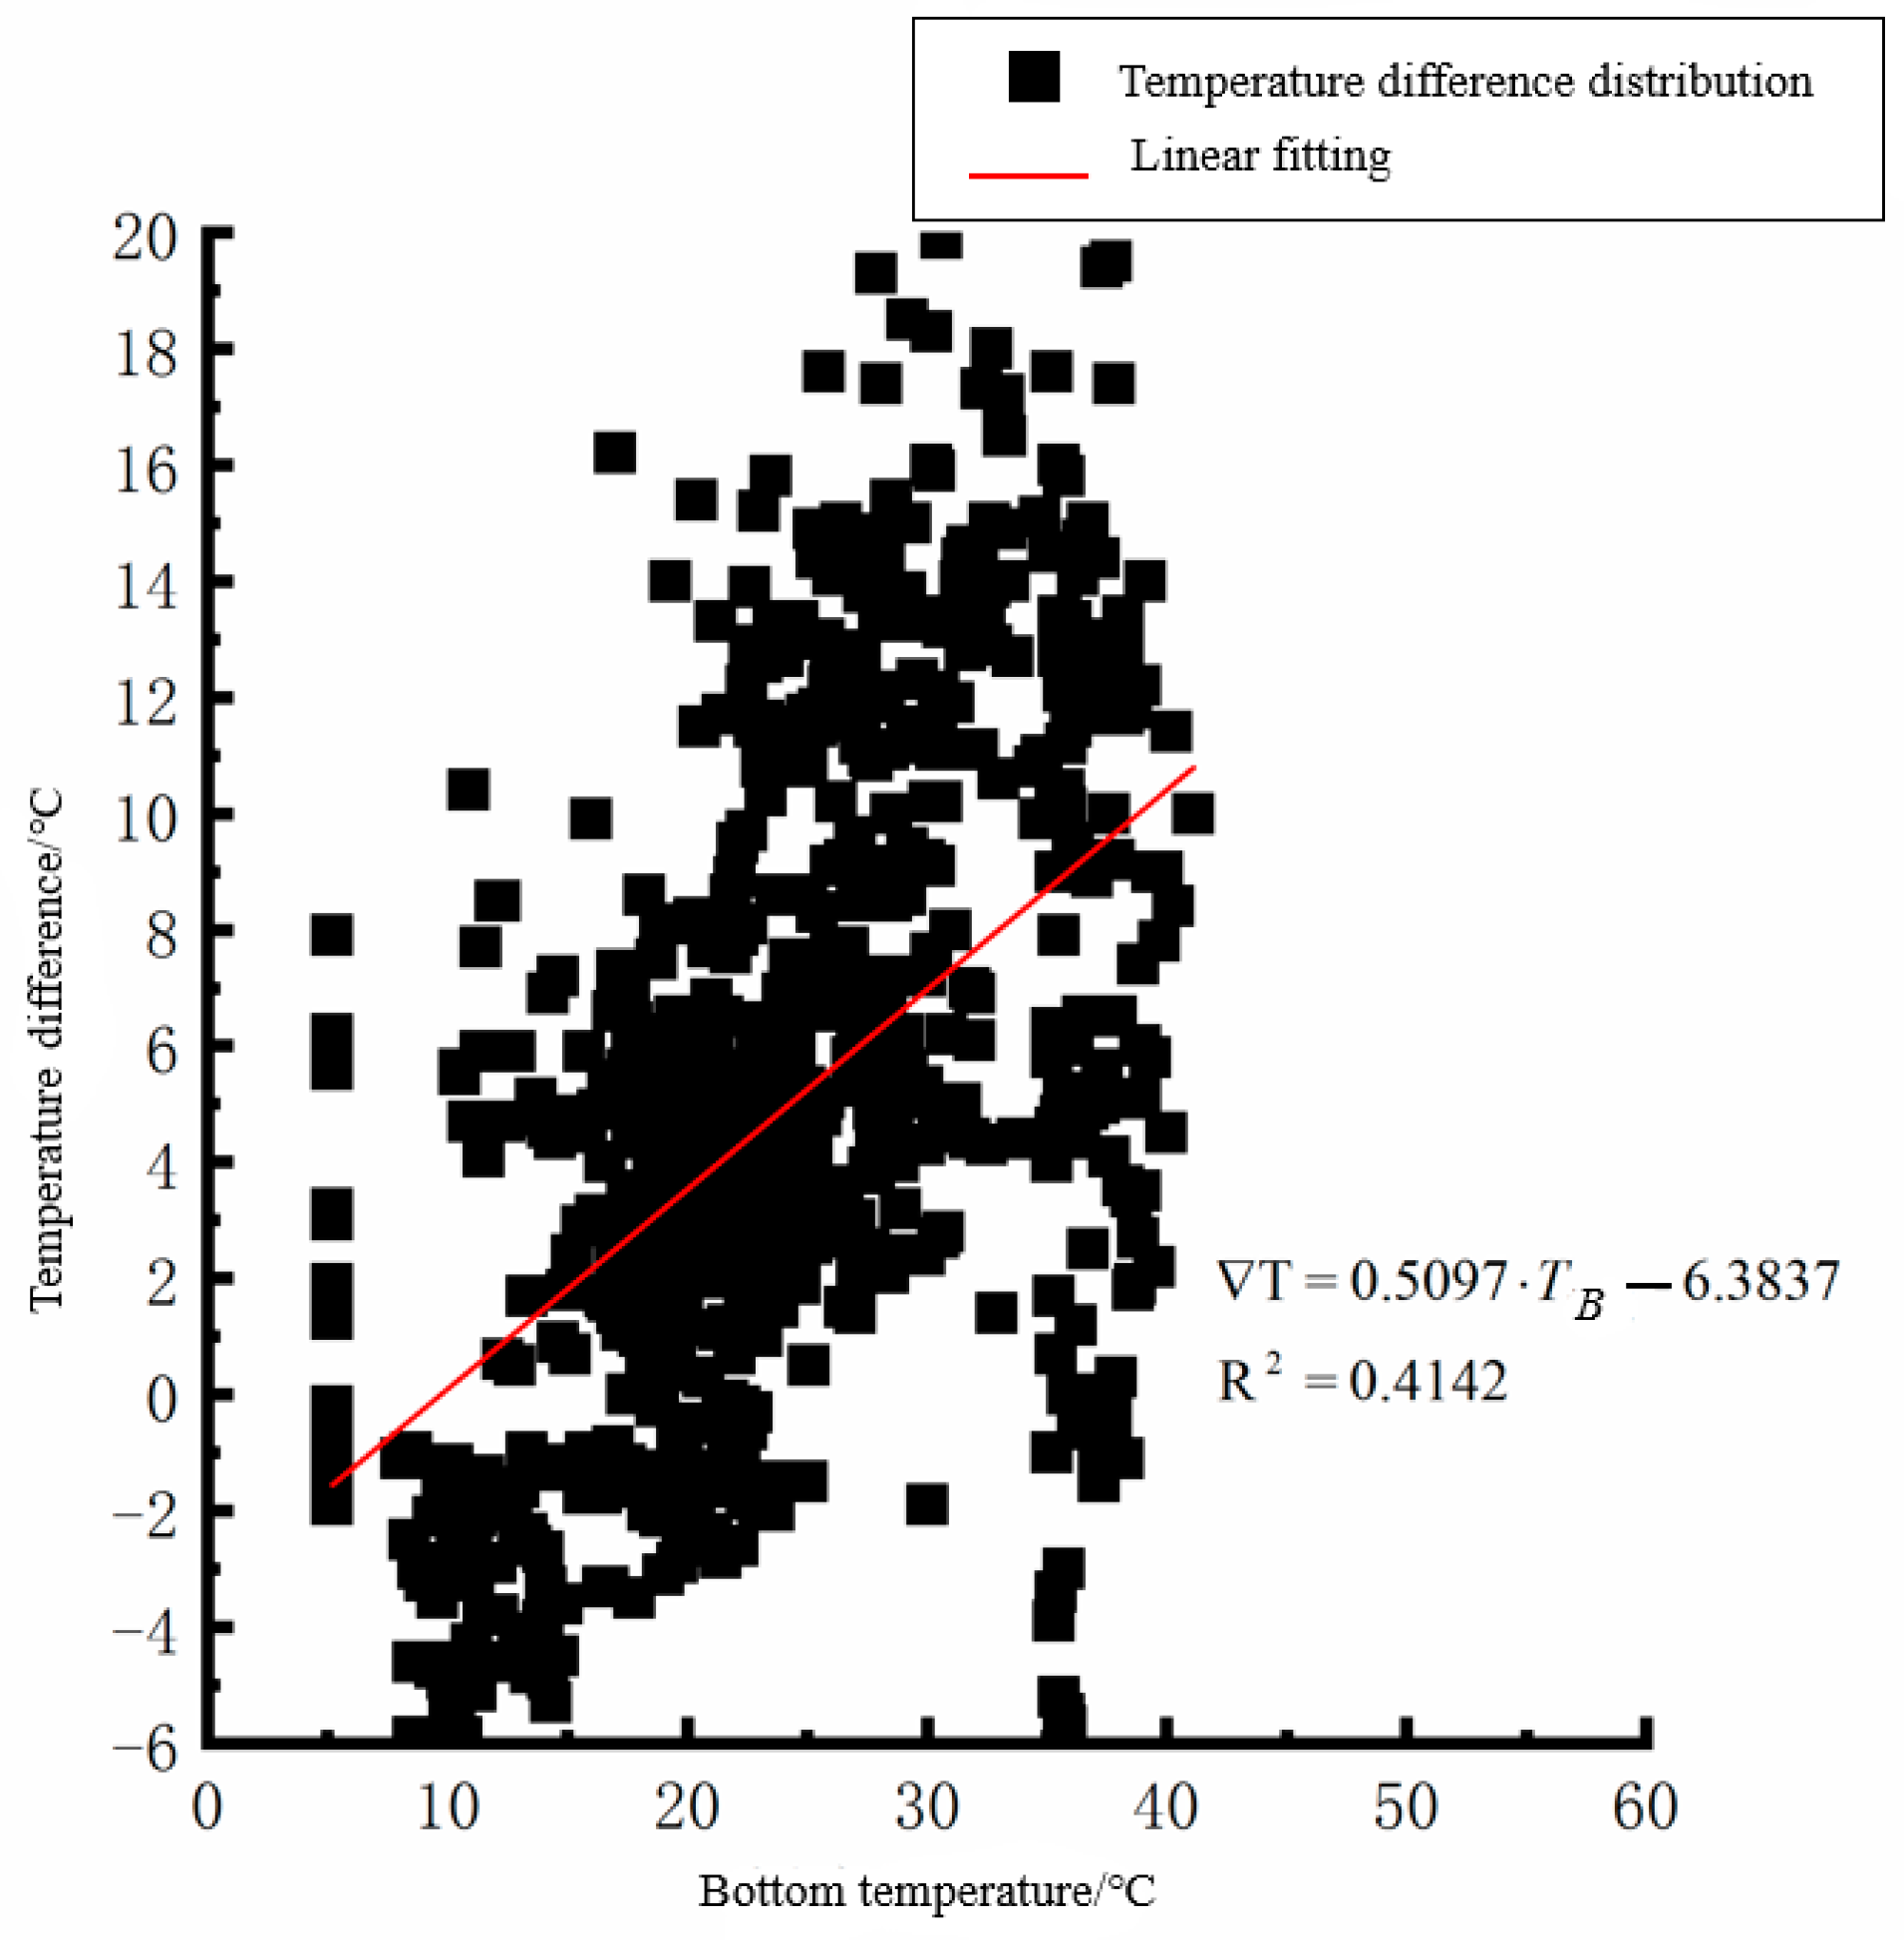
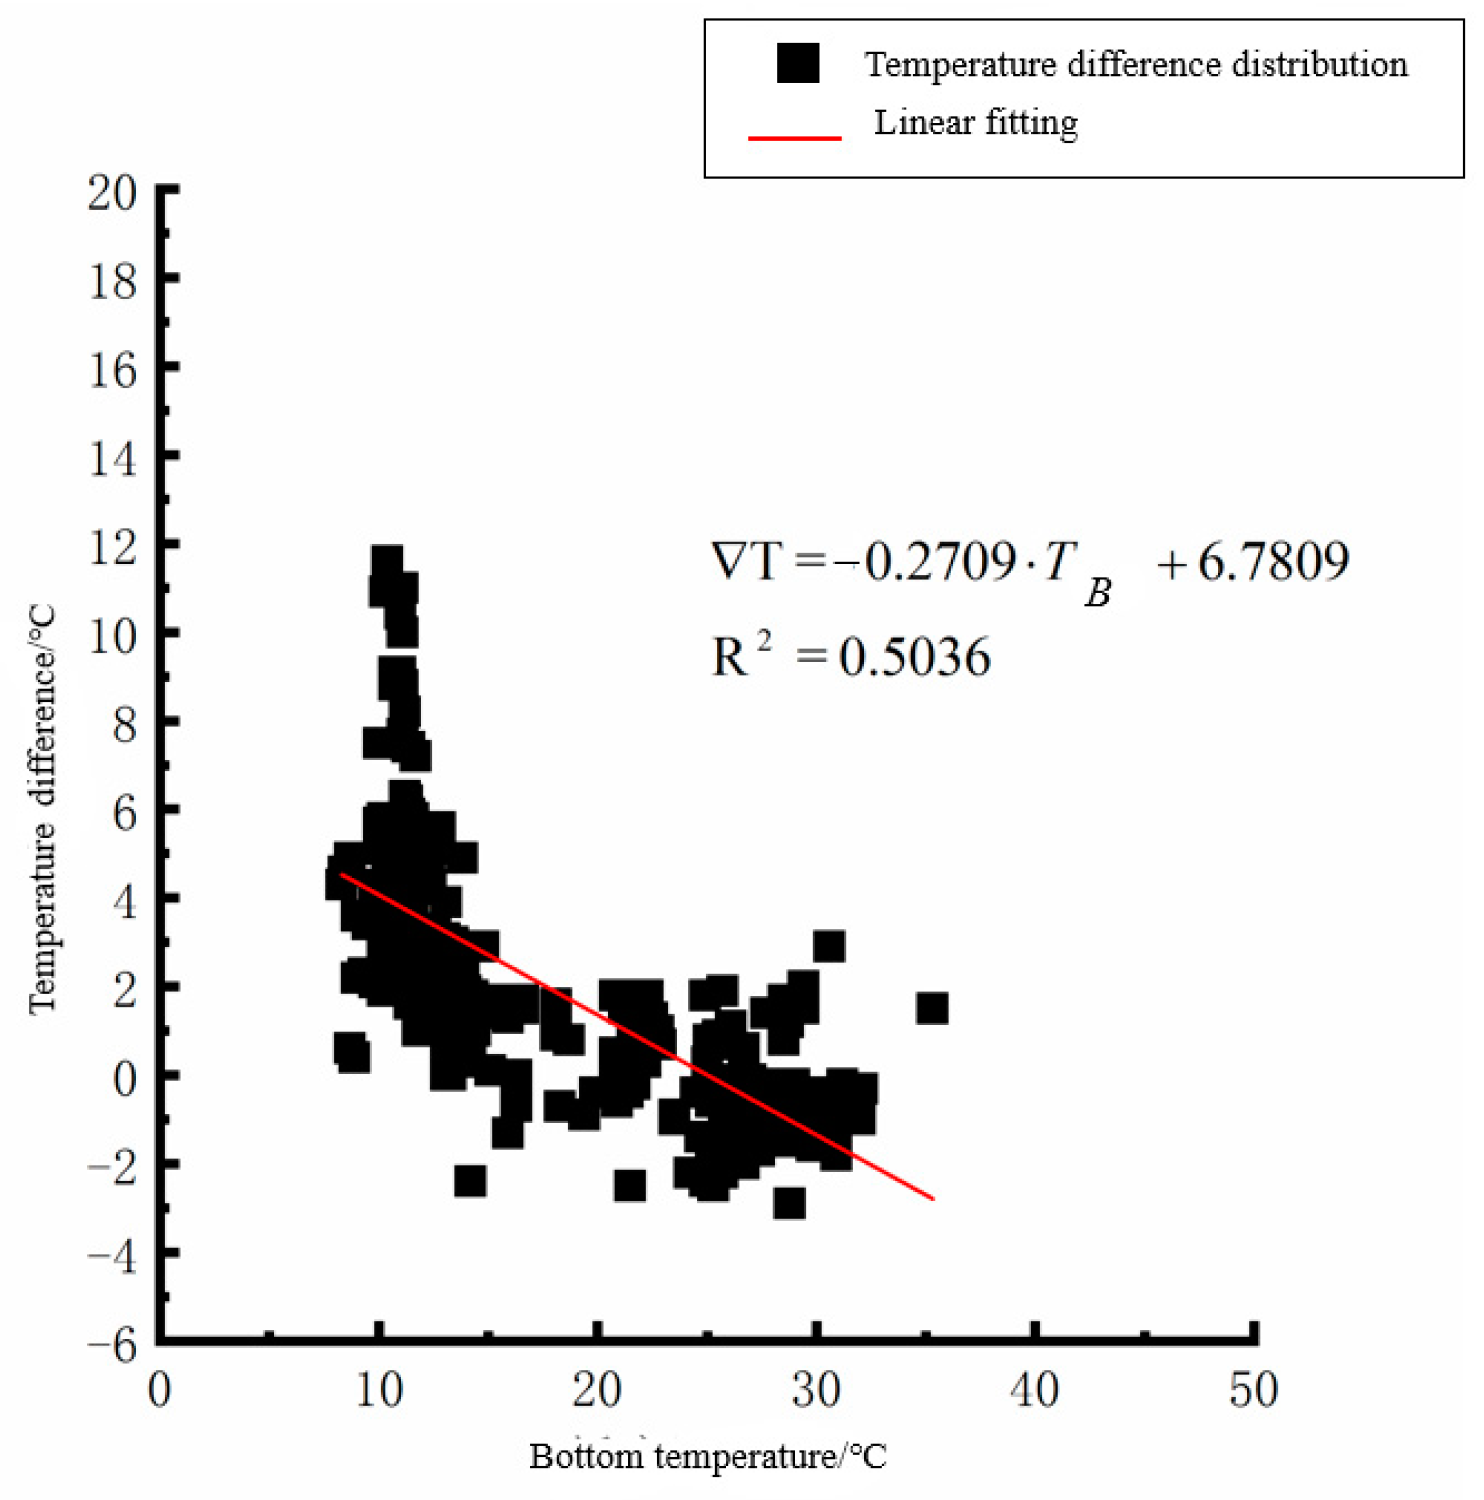
Figure 6.
Bottom of plat temperature–temperature difference in spring.
Figure 6.
Bottom of plat temperature–temperature difference in spring.
Figure 7.
Top of plat temperature–temperature difference in summer.
Figure 7.
Top of plat temperature–temperature difference in summer.
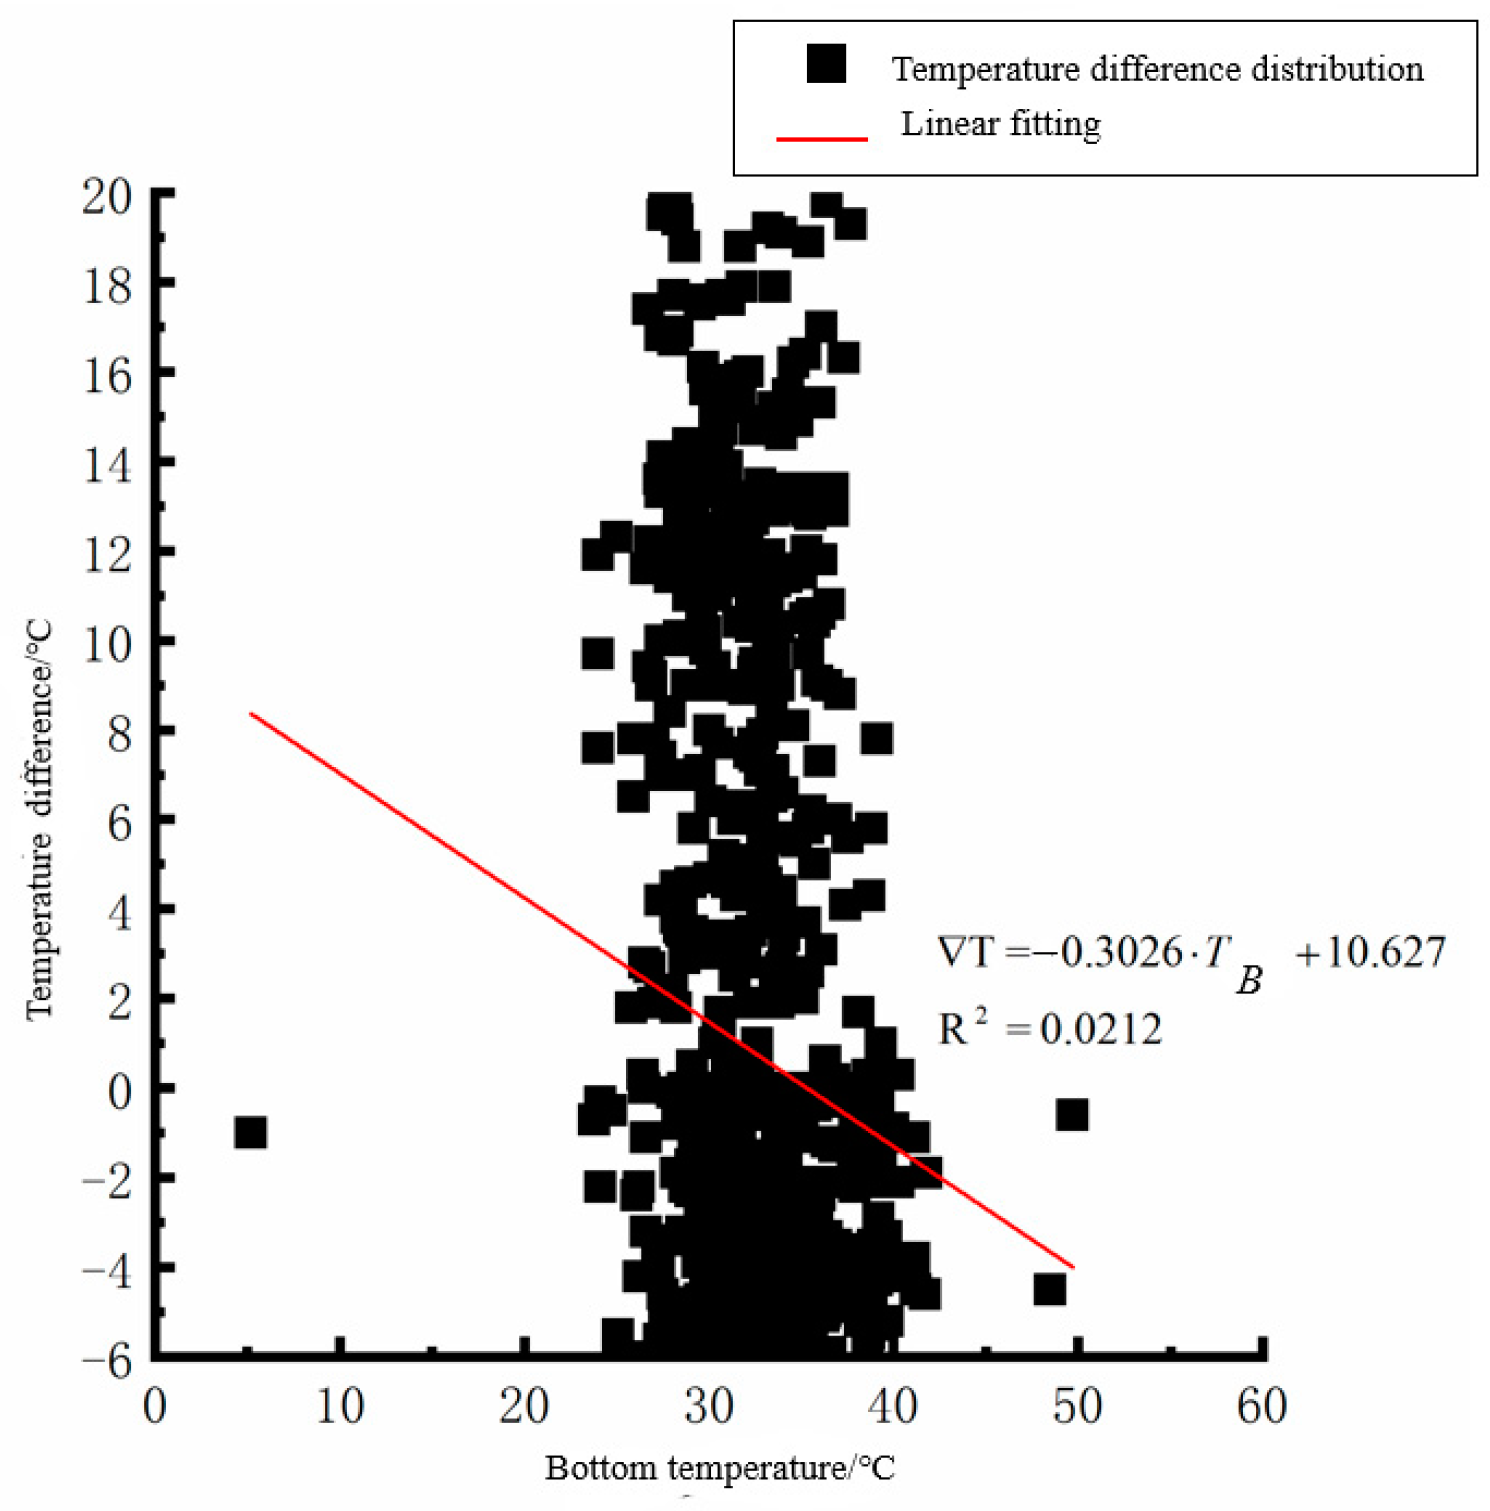
Figure 8.
Bottom of plat temperature–temperature difference in summer.
Figure 8.
Bottom of plat temperature–temperature difference in summer.
Figure 9.
Top of plat temperature–temperature difference in autumn.
Figure 9.
Top of plat temperature–temperature difference in autumn.
Figure 10.
Bottom of plat temperature–temperature difference in autumn.
Figure 10.
Bottom of plat temperature–temperature difference in autumn.
Figure 11.
Top of plat temperature–temperature difference in winter.
Figure 11.
Top of plat temperature–temperature difference in winter.
Figure 12.
Bottom of plat temperature–temperature difference in winter.
Figure 12.
Bottom of plat temperature–temperature difference in winter.
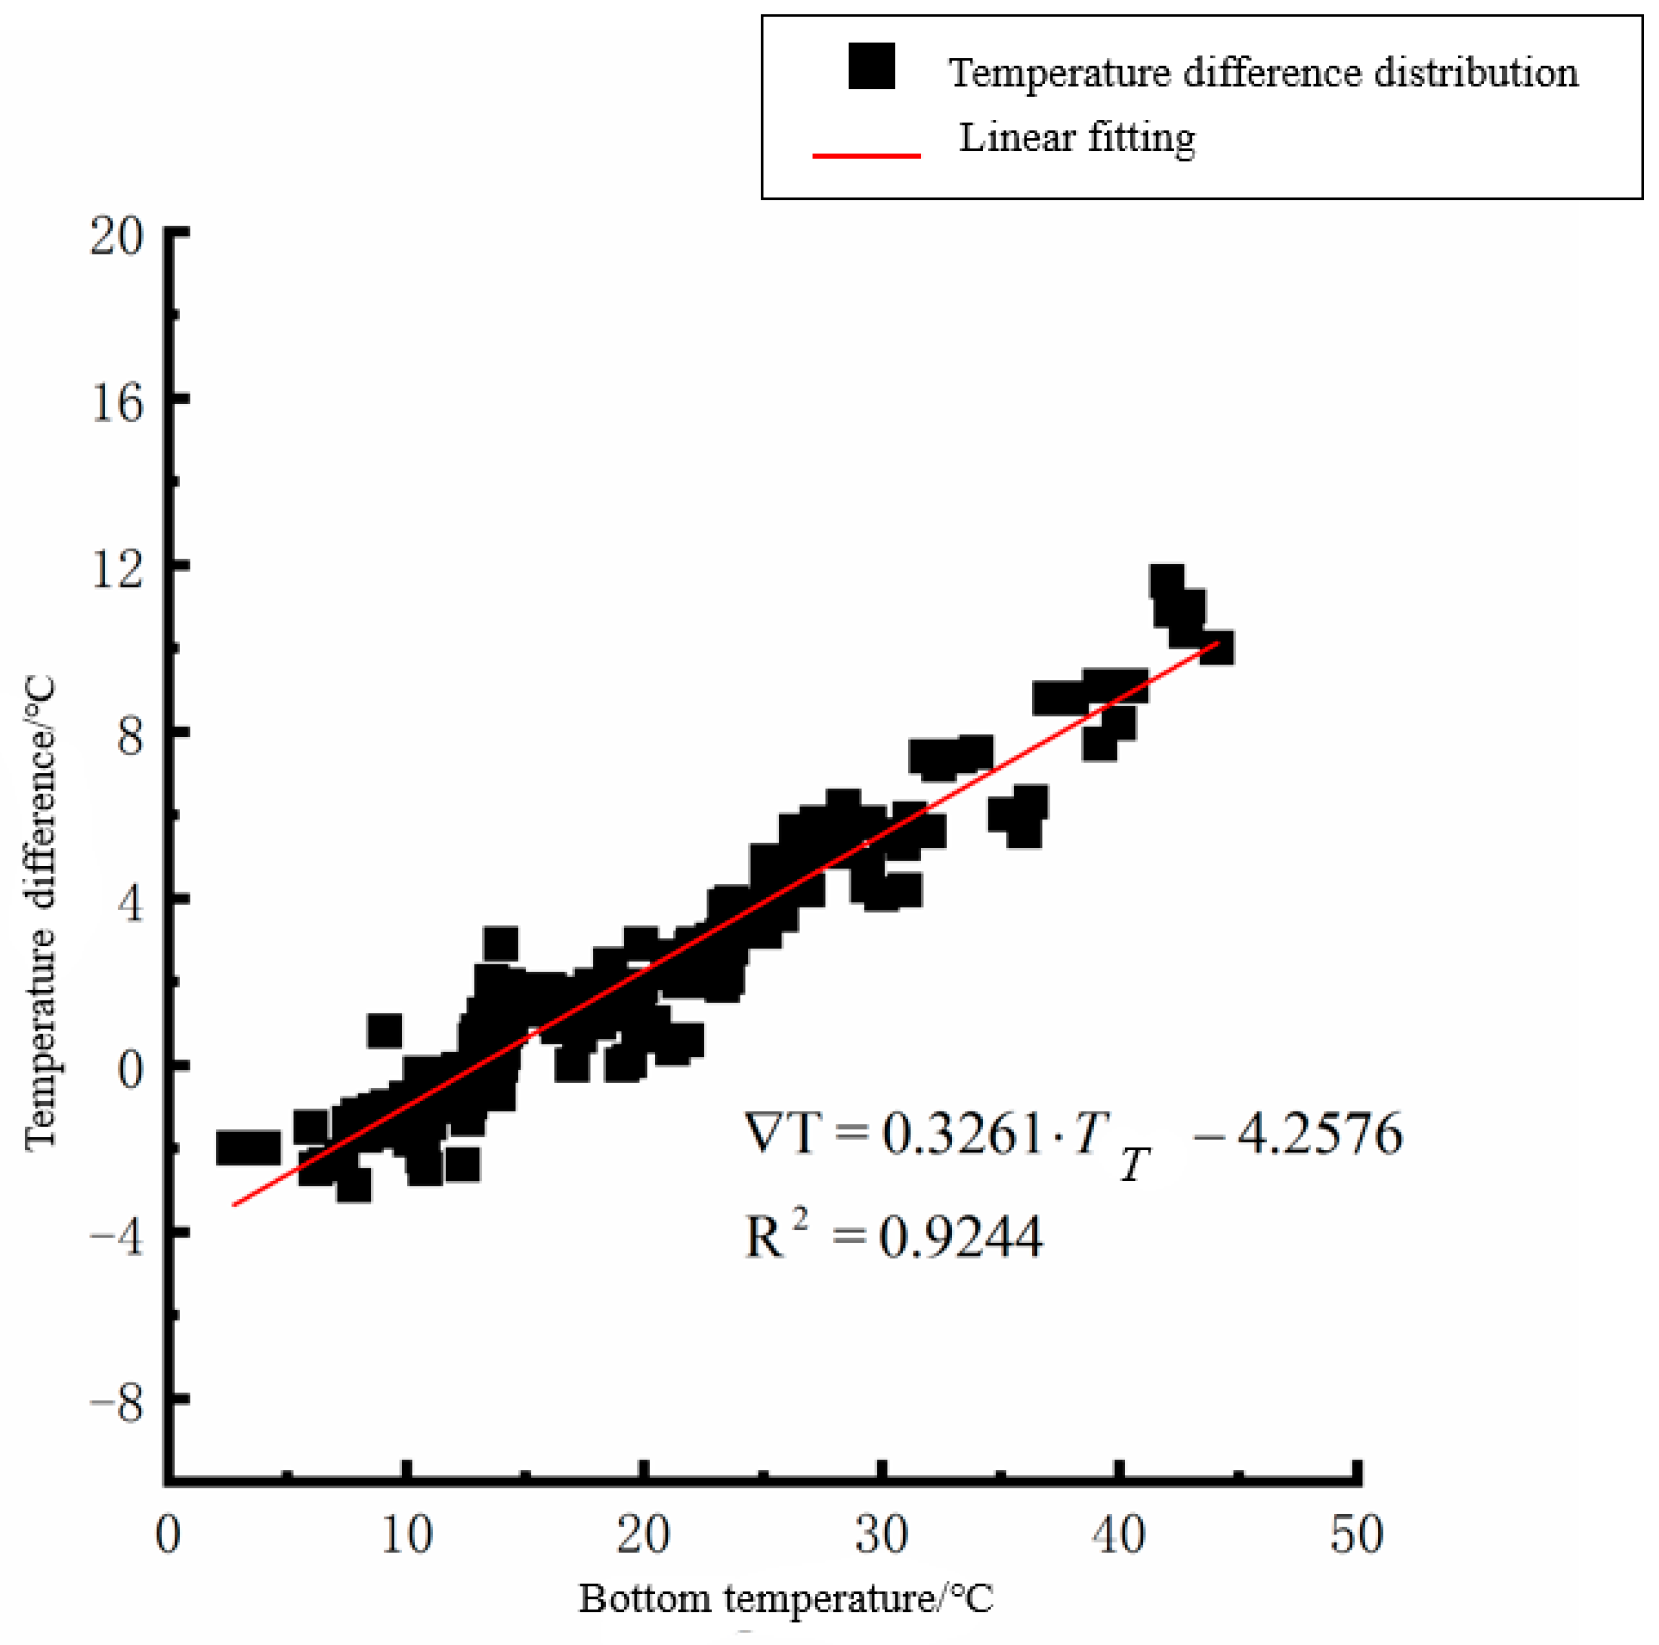
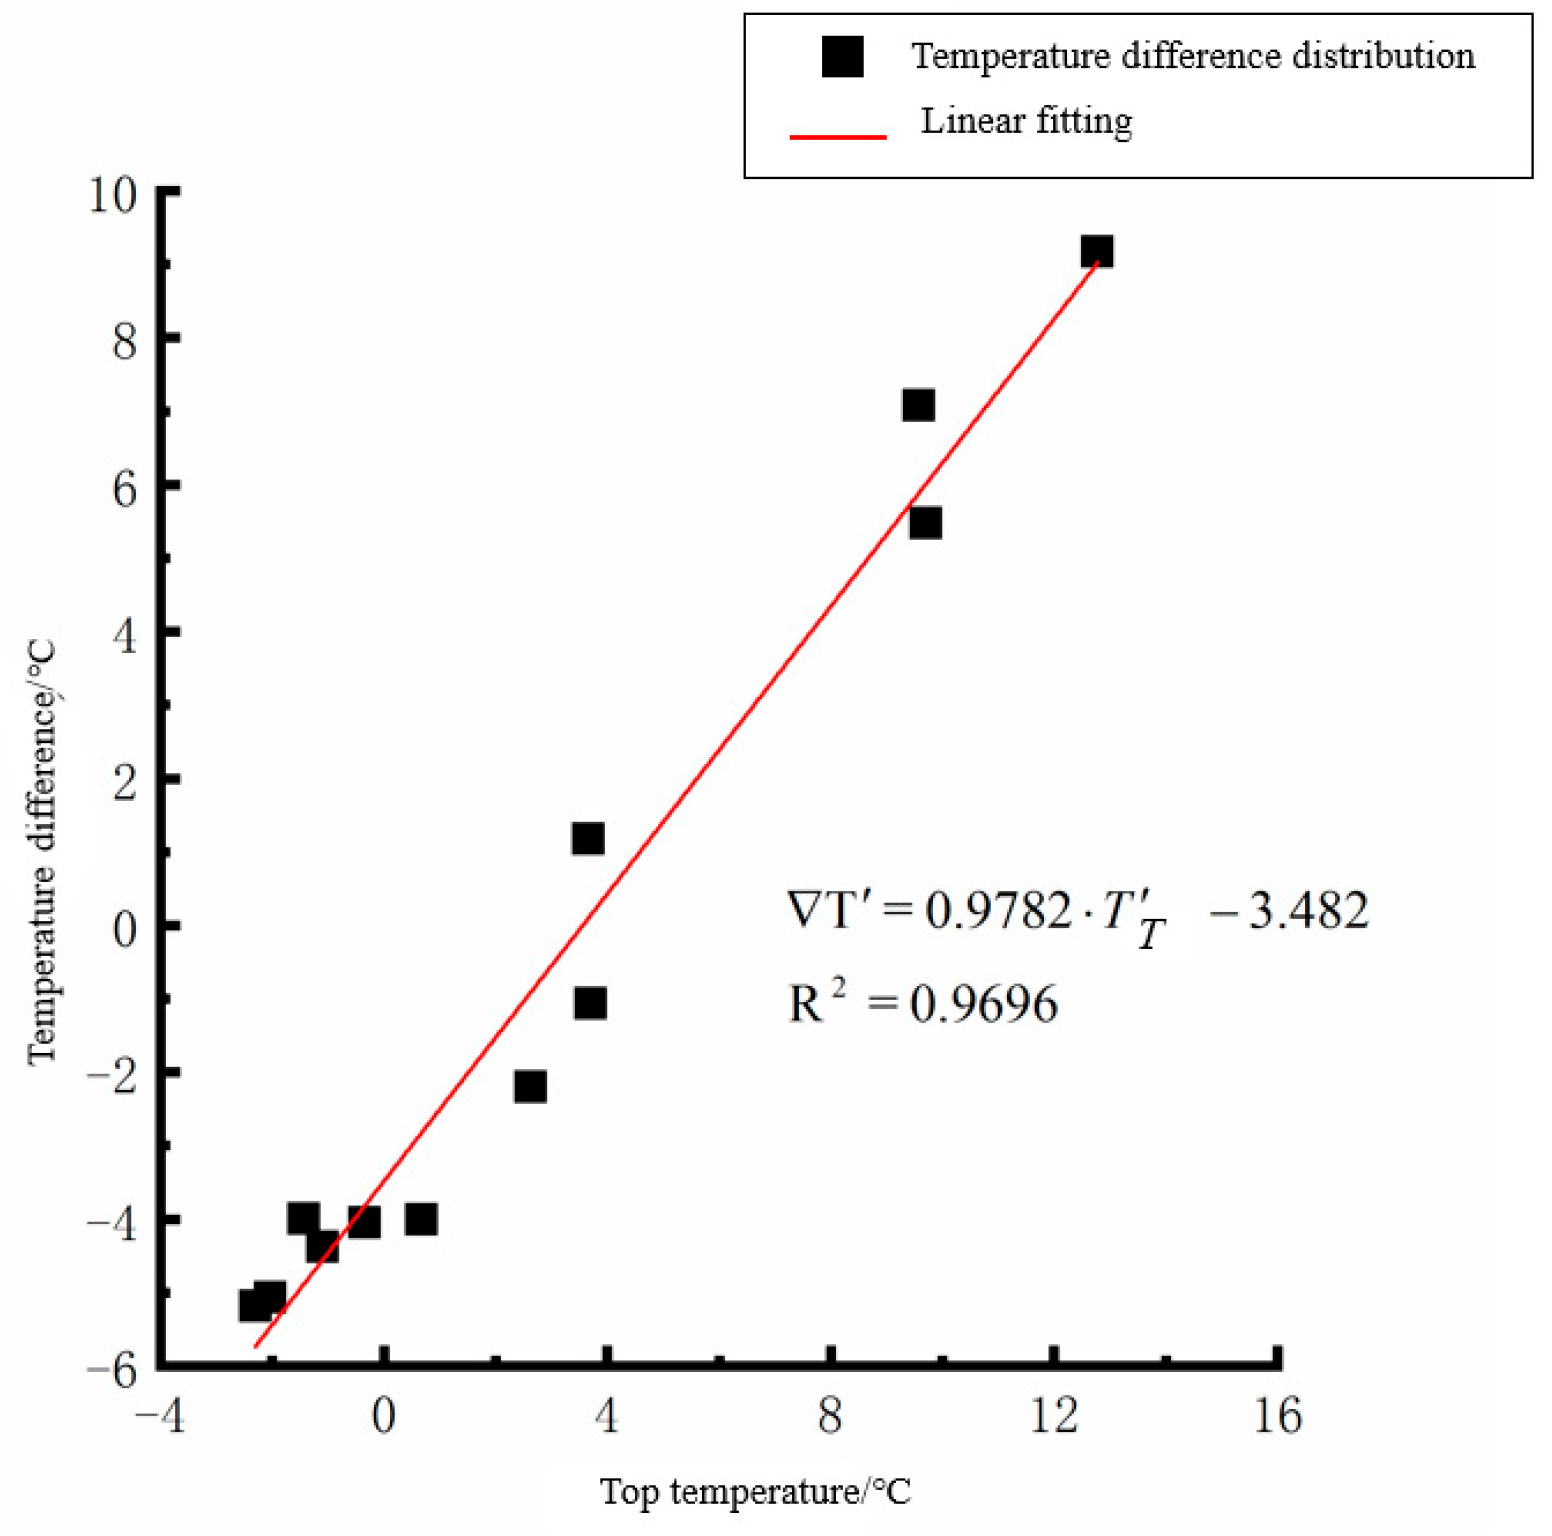
Figure 13.
Average daily top temperature in spring—temperature difference.
Figure 13.
Average daily top temperature in spring—temperature difference.
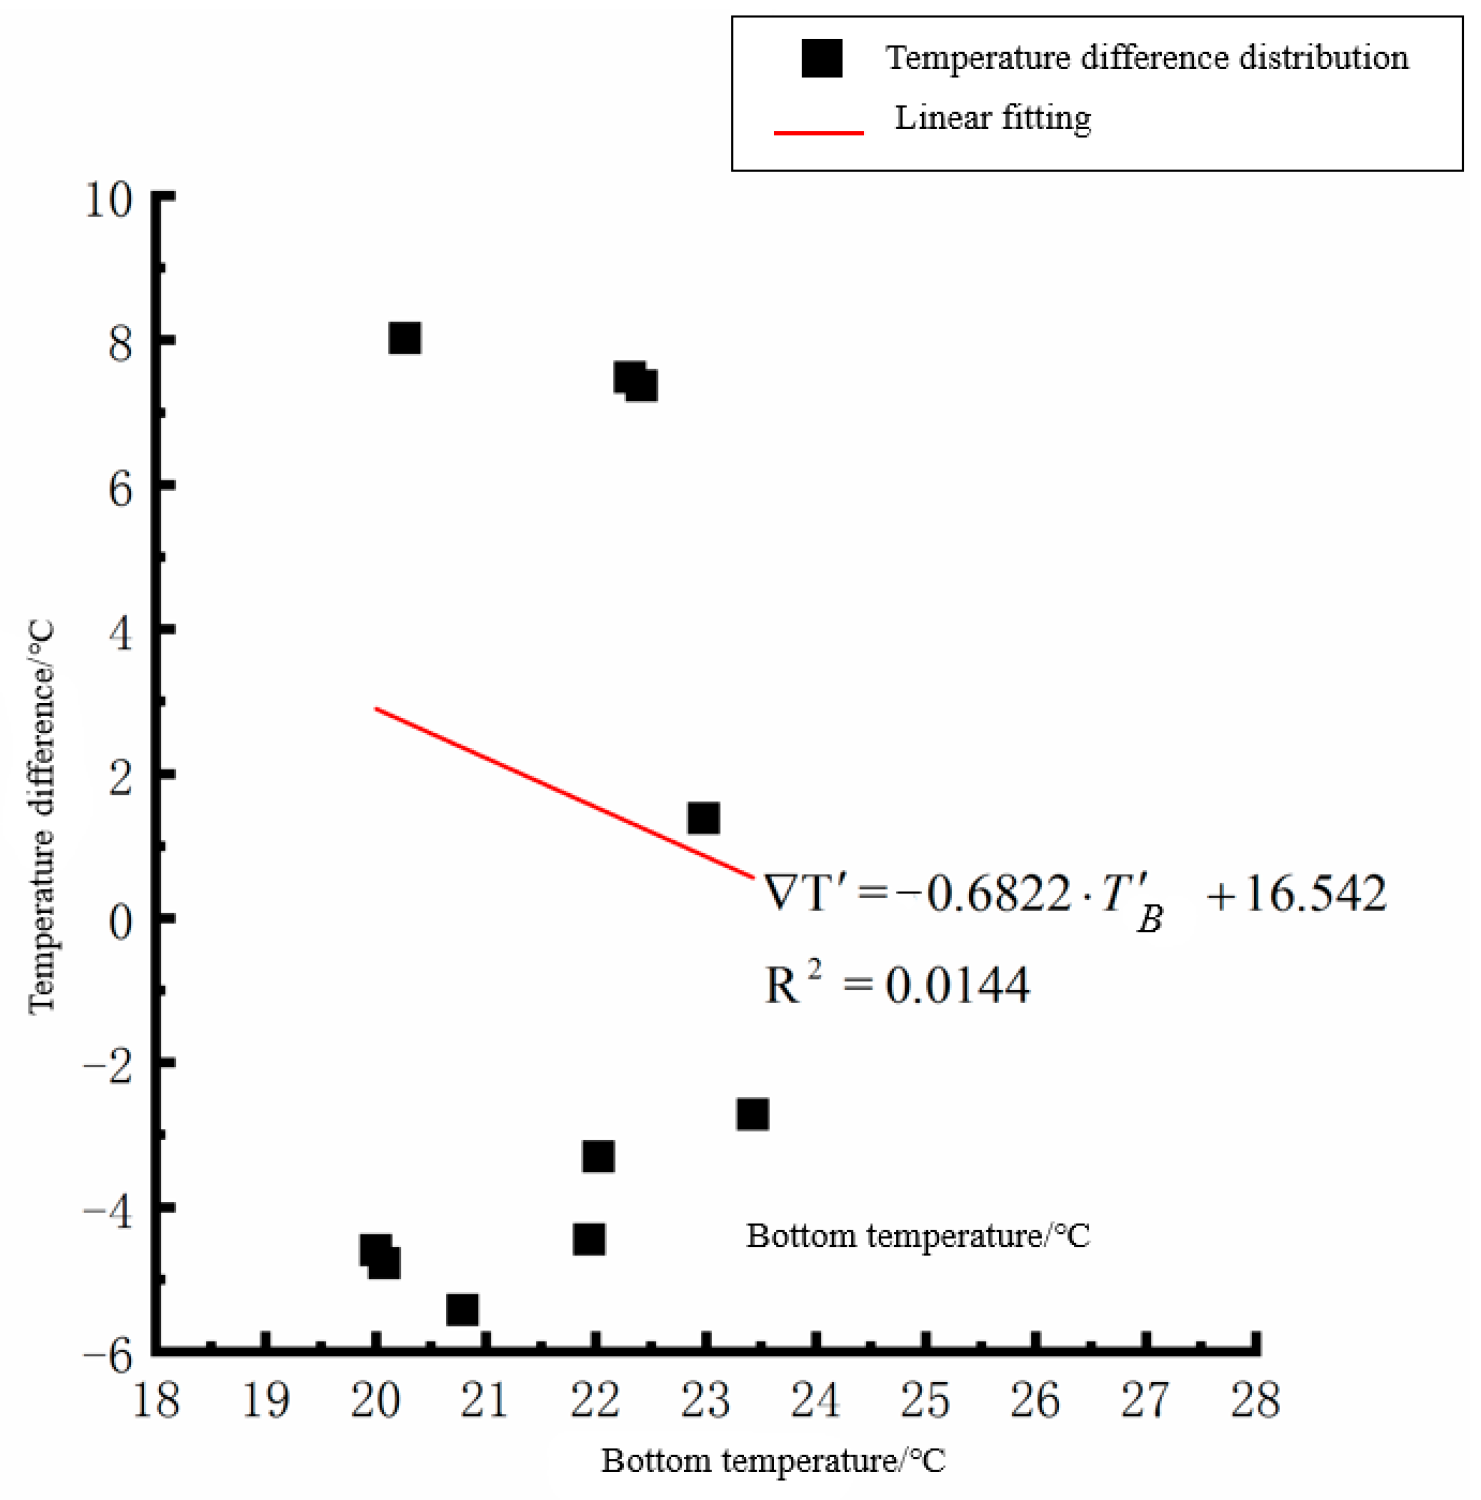
Figure 14.
Average daily plate bottom temperature in spring—temperature difference.
Figure 14.
Average daily plate bottom temperature in spring—temperature difference.
Figure 15.
Average daily top temperature in summer—temperature difference.
Figure 15.
Average daily top temperature in summer—temperature difference.
Figure 16.
Average daily plate bottom temperature in summer—temperature difference.
Figure 16.
Average daily plate bottom temperature in summer—temperature difference.
Figure 17.
Average daily top temperature in autumn—temperature difference.
Figure 17.
Average daily top temperature in autumn—temperature difference.
Figure 18.
Average daily plate bottom temperature in autumn—temperature difference.
Figure 18.
Average daily plate bottom temperature in autumn—temperature difference.
Figure 19.
Average daily top temperature in winter—temperature difference.
Figure 19.
Average daily top temperature in winter—temperature difference.
Figure 20.
Average daily plate bottom temperature in winter—temperature difference.
Figure 20.
Average daily plate bottom temperature in winter—temperature difference.
Figure 21.
Comparison of the calculated and measured values of the two analysis methods in each season. (a) Comparison of correlation in spring. (b) Comparison of correlation in summer. (c) Comparison of correlation in autumn. (d) Comparison of correlation in winter.
Figure 21.
Comparison of the calculated and measured values of the two analysis methods in each season. (a) Comparison of correlation in spring. (b) Comparison of correlation in summer. (c) Comparison of correlation in autumn. (d) Comparison of correlation in winter.
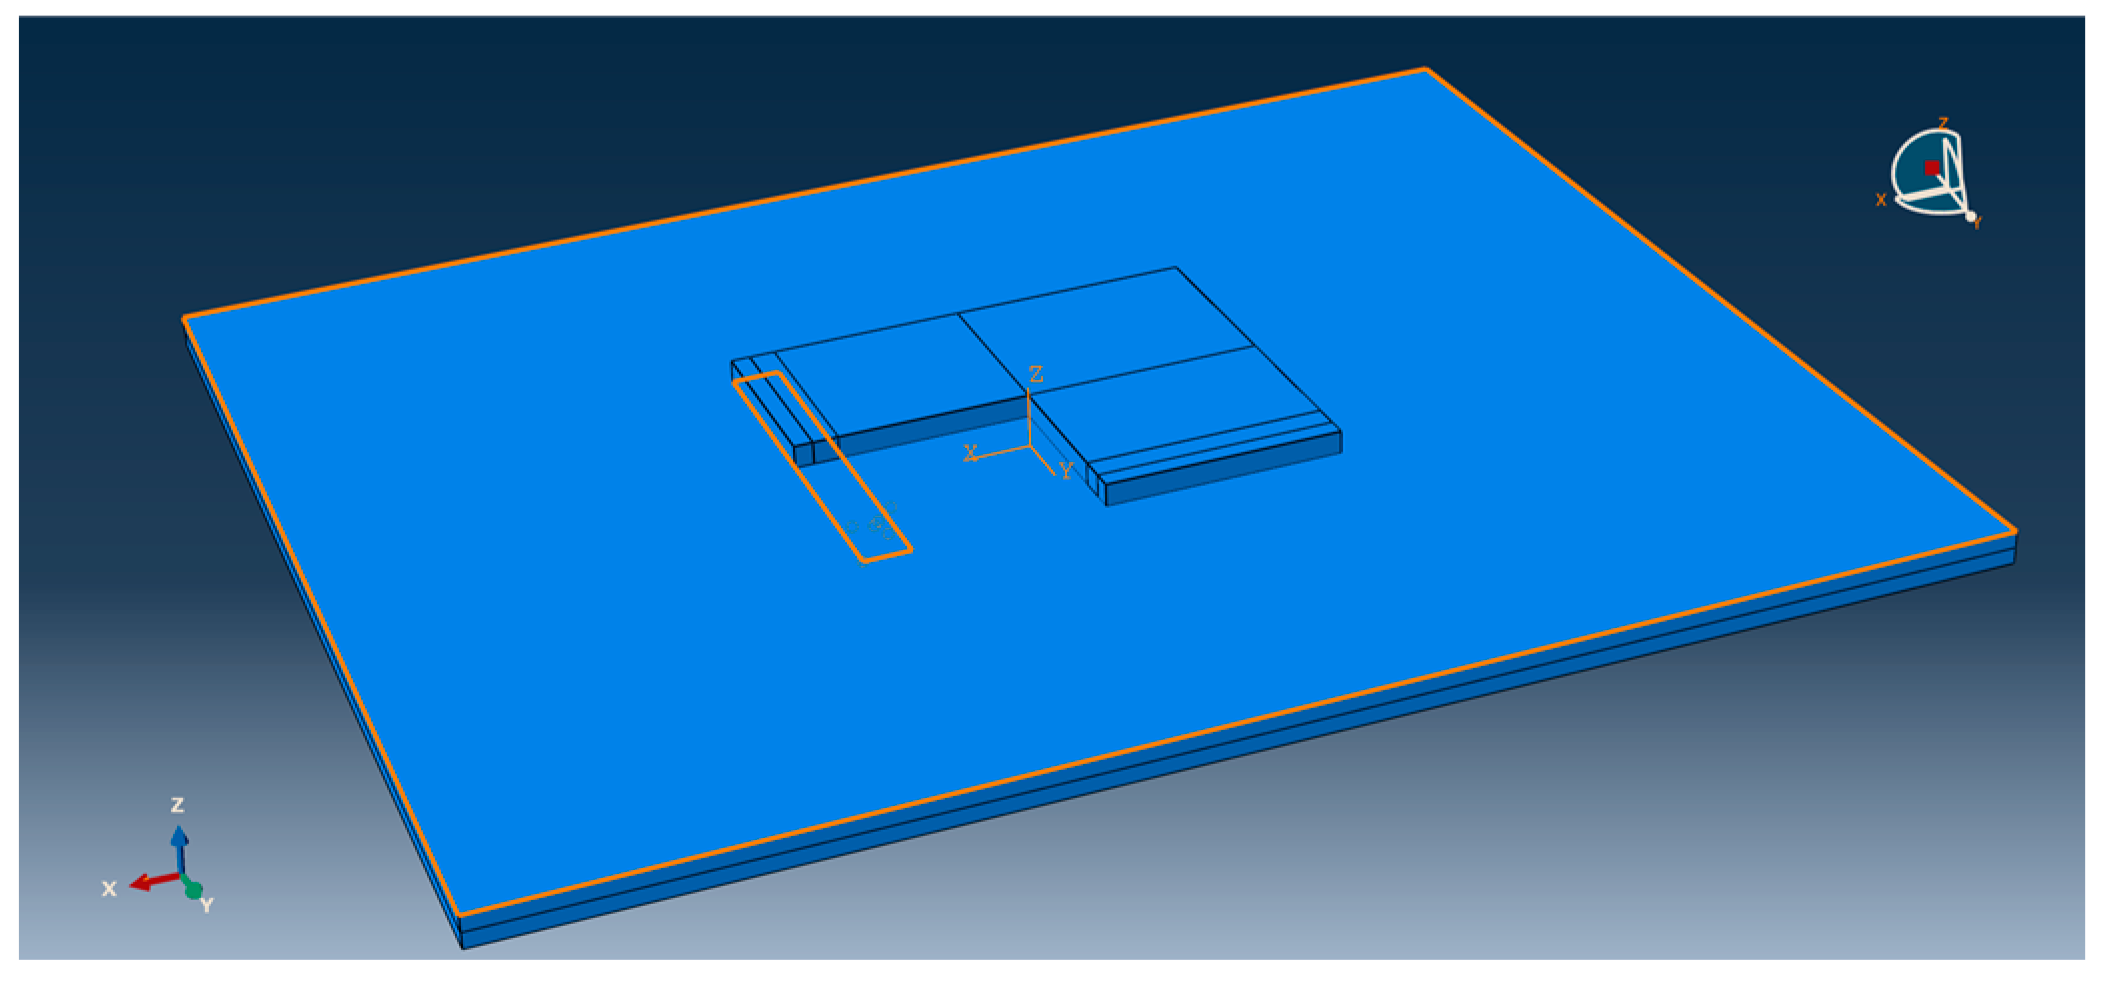
Figure 22.
Cement pavement slab edge void (hidden 1/4 pavement slab).
Figure 22.
Cement pavement slab edge void (hidden 1/4 pavement slab).
Figure 23.
Overall mesh division effect of 3D finite element model of cement pavement.
Figure 23.
Overall mesh division effect of 3D finite element model of cement pavement.
Figure 24.
Mesh division effect of cement road panel model.
Figure 24.
Mesh division effect of cement road panel model.
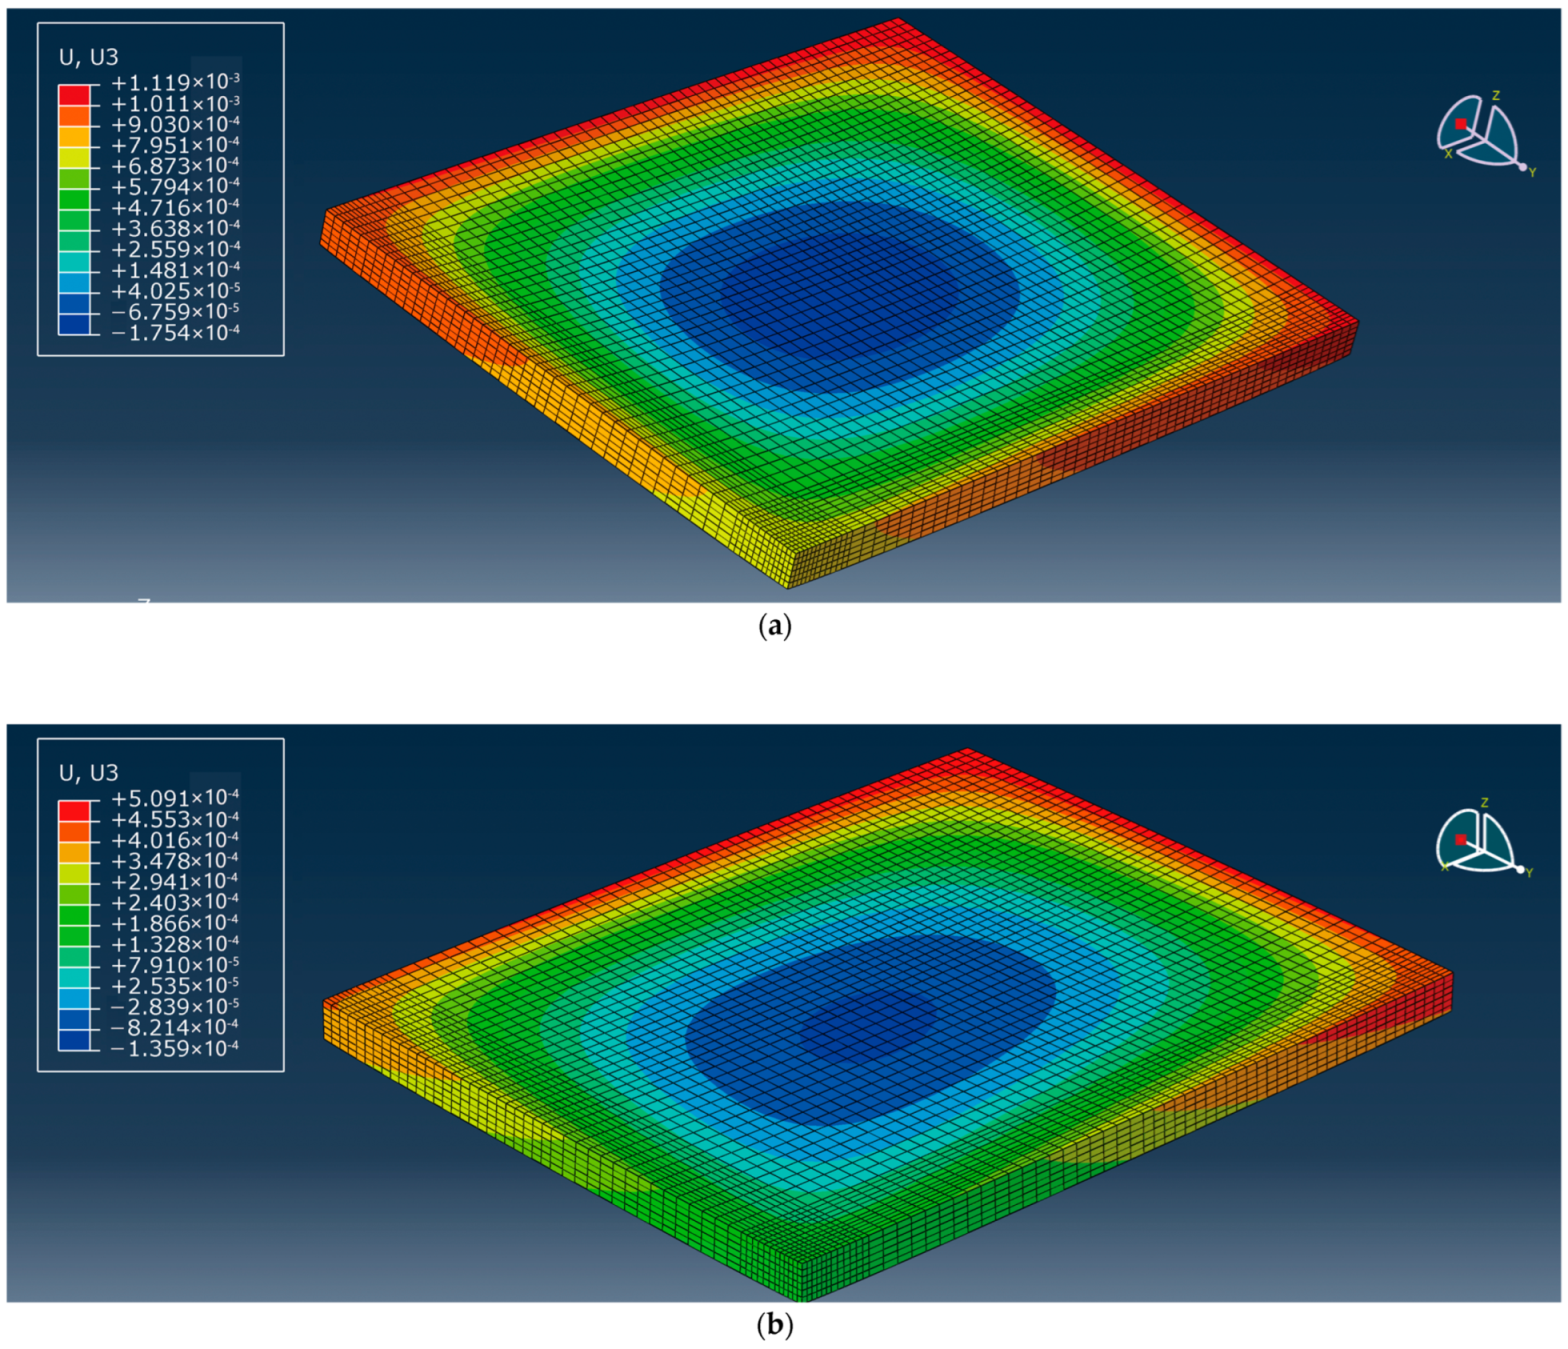
Figure 25.
Deformation nephograph under different temperature stresses at the side of cement road panel. (a) Panel temperature difference −20 °C. (b) Panel temperature difference −10 °C. (c) Panel temperature difference 0 °C. (d) Panel temperature difference 10 °C. (e) Panel temperature difference 20 °C.
Figure 26.
Deformation caused only by temperature stress in different seasons during plate edge hollowing. (a) Spring. (b) Summer. (c) Autumn. (d) Winter.
Figure 26.
Deformation caused only by temperature stress in different seasons during plate edge hollowing. (a) Spring. (b) Summer. (c) Autumn. (d) Winter.
Figure 27.
Deformation generated by coupling effect of temperature stress and load (50 KN) stress field in different seasons. (a) Spring. (b) Summer. (c) Autumn. (d) Winter.
Figure 27.
Deformation generated by coupling effect of temperature stress and load (50 KN) stress field in different seasons. (a) Spring. (b) Summer. (c) Autumn. (d) Winter.
Figure 28.
Deformation generated by coupling effect of temperature stress and load (70 KN) stress field in different seasons. (a) Spring. (b) Summer. (c) Autumn. (d) Winter.
Figure 28.
Deformation generated by coupling effect of temperature stress and load (70 KN) stress field in different seasons. (a) Spring. (b) Summer. (c) Autumn. (d) Winter.
Figure 29.
Deformation generated by coupling effect of temperature stress and load (90 KN) stress field in different seasons. (a) Spring. (b) Summer. (c) Autumn. (d) Winter.
Figure 29.
Deformation generated by coupling effect of temperature stress and load (90 KN) stress field in different seasons. (a) Spring. (b) Summer. (c) Autumn. (d) Winter.
Figure 30.
Bending considering the influence of temperature in different seasons (load 50 KN). (a) Spring. (b) Summer. (c) Autumn. (d) Winter.
Figure 30.
Bending considering the influence of temperature in different seasons (load 50 KN). (a) Spring. (b) Summer. (c) Autumn. (d) Winter.
Figure 31.
Bending considering the influence of temperature in different seasons (load 70 KN). (a) Spring. (b) Summer. (c) Autumn. (d) Winter.
Figure 31.
Bending considering the influence of temperature in different seasons (load 70 KN). (a) Spring. (b) Summer. (c) Autumn. (d) Winter.
Figure 32.
Bending under the influence of temperature in different seasons (load 90 KN). (a) Spring. (b) Summer. (c) Autumn. (d) Winter.
Figure 32.
Bending under the influence of temperature in different seasons (load 90 KN). (a) Spring. (b) Summer. (c) Autumn. (d) Winter.
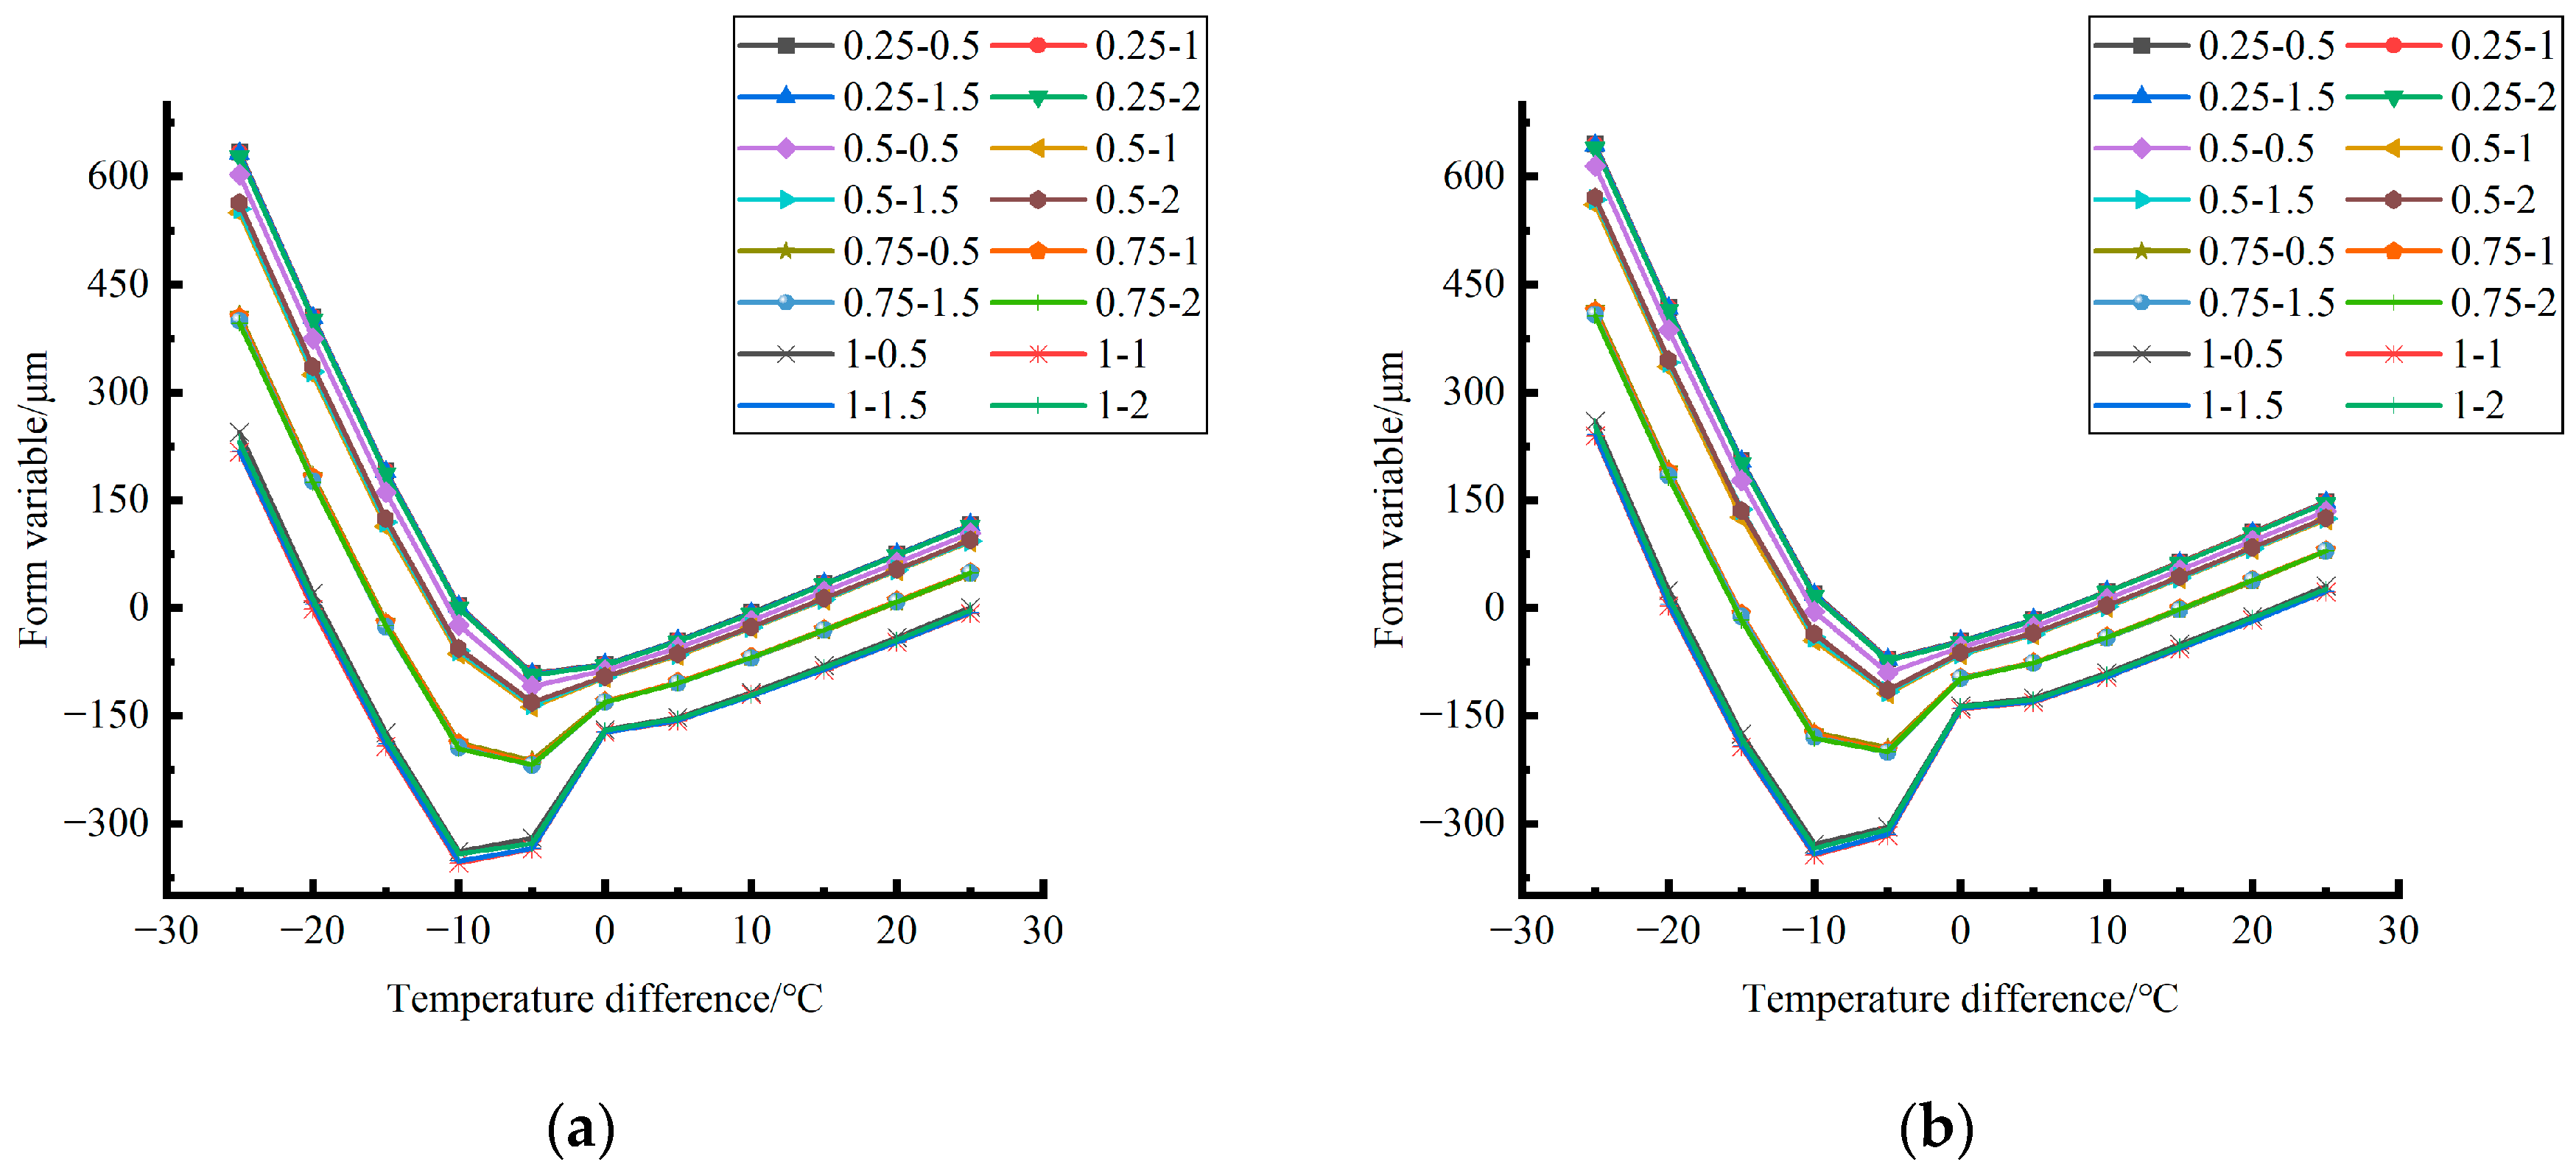
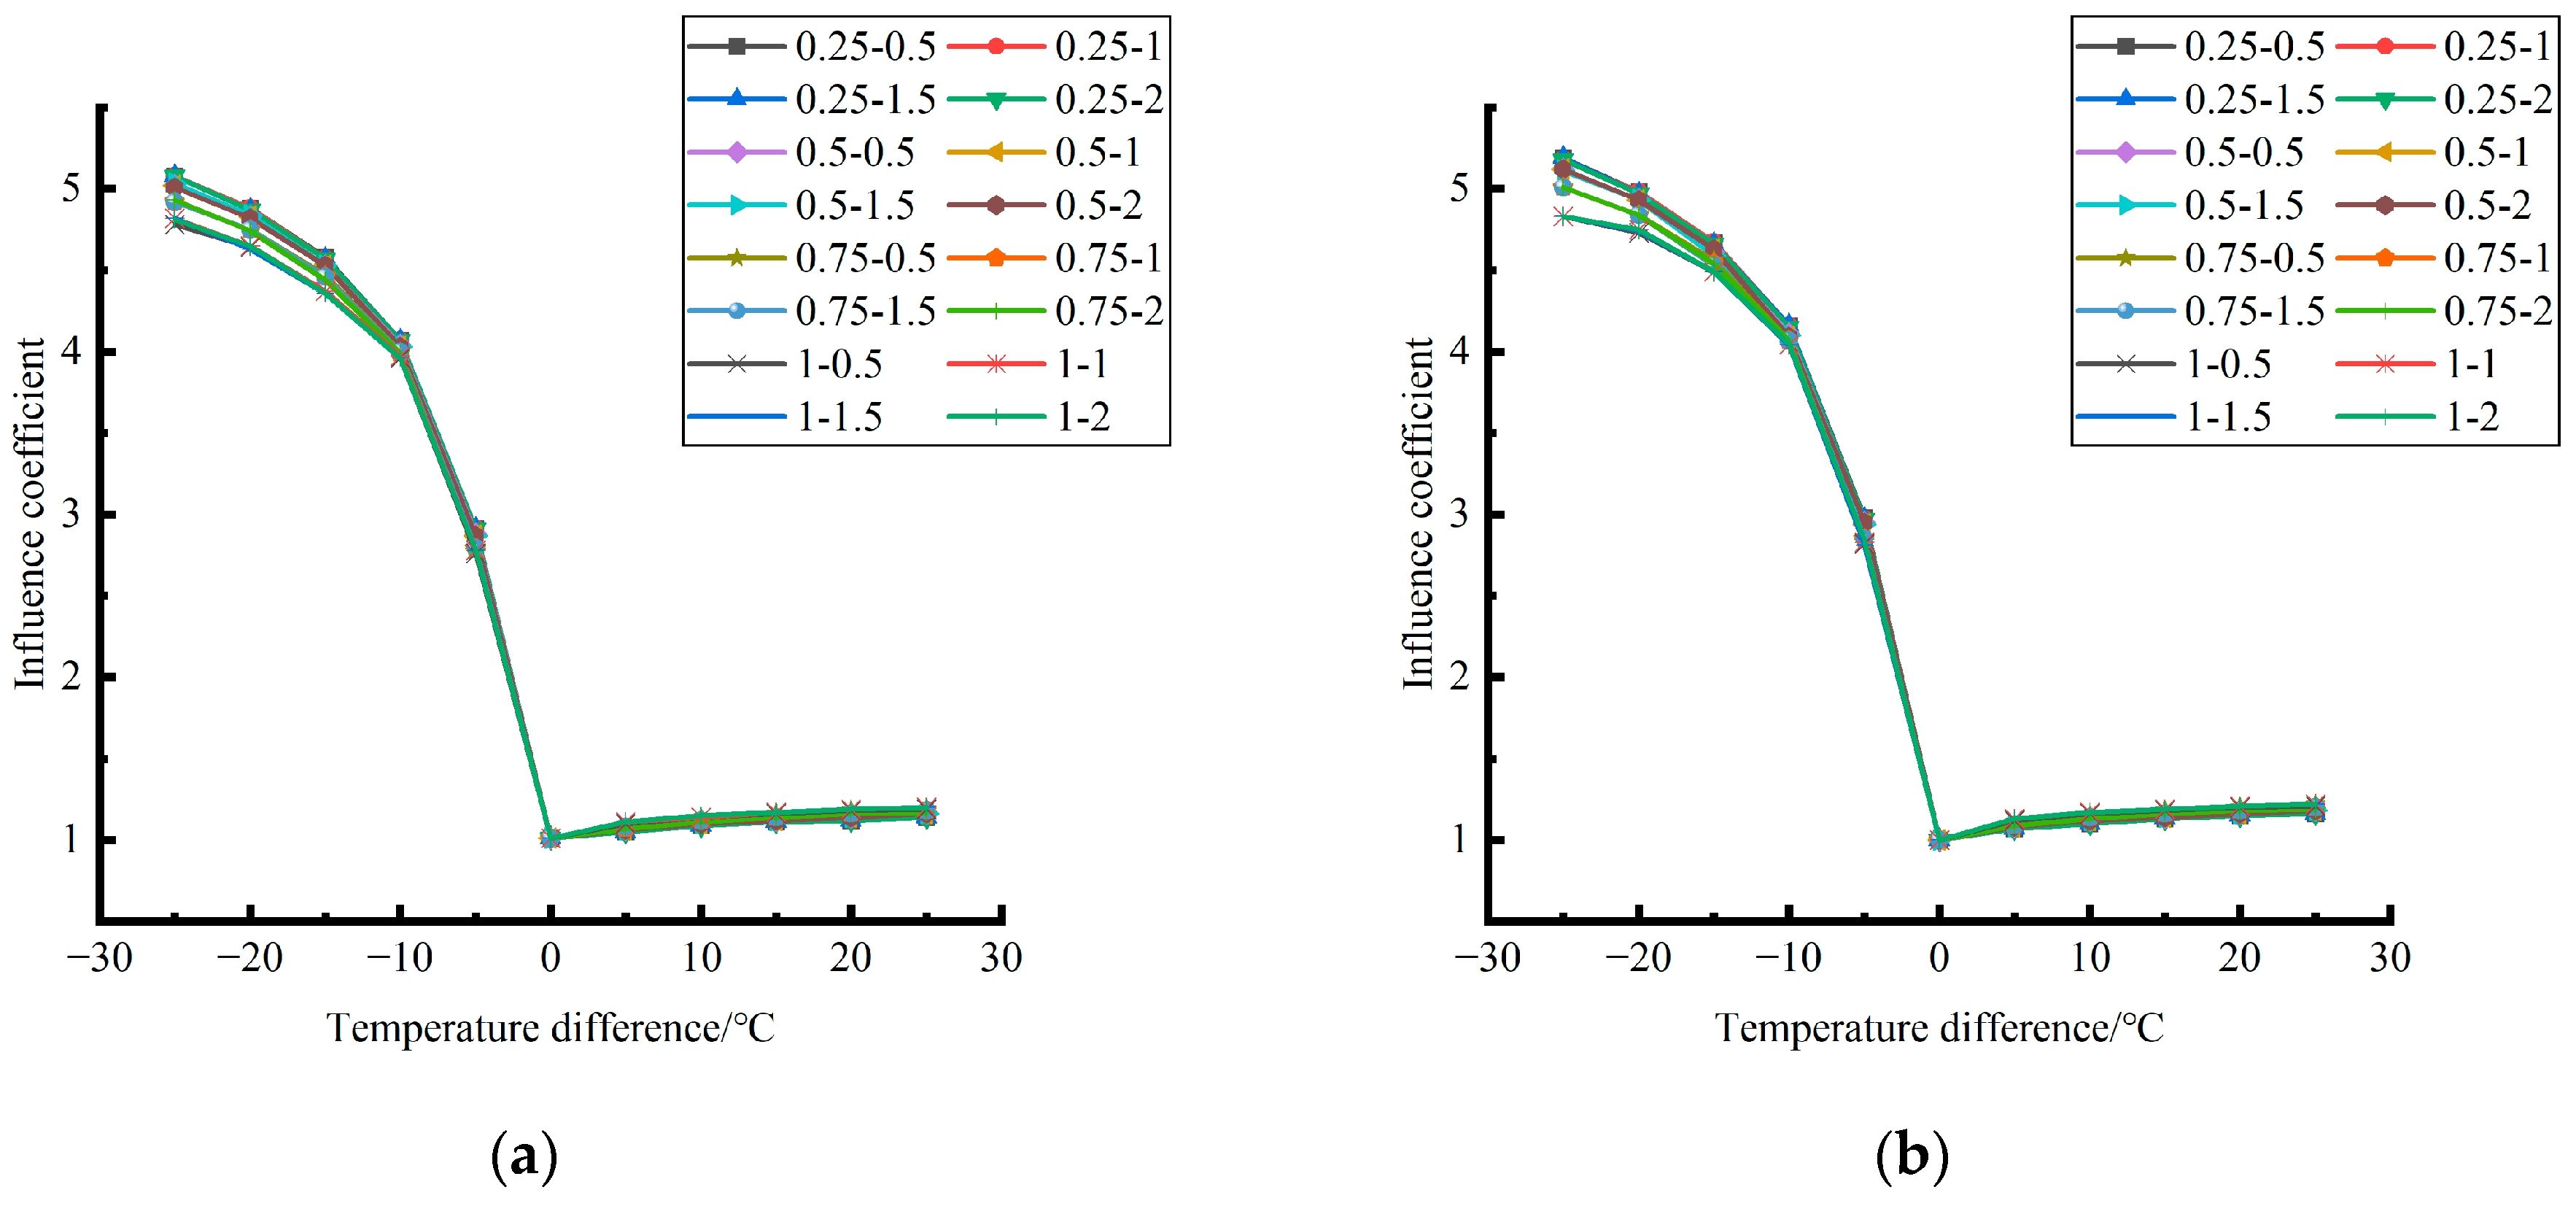
Figure 33.
Influence coefficient of temperature in different seasons (load 50 KN). (a) Spring. (b) Summer. (c) Autumn. (d) Winter.
Figure 33.
Influence coefficient of temperature in different seasons (load 50 KN). (a) Spring. (b) Summer. (c) Autumn. (d) Winter.
Figure 34.
Influence coefficient of temperature in different seasons (load 70 KN). (a) Spring. (b) Summer. (c) Autumn. (d) Winter.
Figure 34.
Influence coefficient of temperature in different seasons (load 70 KN). (a) Spring. (b) Summer. (c) Autumn. (d) Winter.
Figure 35.
Influence coefficient of temperature in different seasons (load 90 KN). (a) Spring. (b) Summer. (c) Autumn. (d) Winter.
Figure 35.
Influence coefficient of temperature in different seasons (load 90 KN). (a) Spring. (b) Summer. (c) Autumn. (d) Winter.
Figure 36.
Correlation between positive and negative temperature differences and influence coefficient. (a) Range of negative temperature differences. (b) Range of positive temperature differences.
Figure 36.
Correlation between positive and negative temperature differences and influence coefficient. (a) Range of negative temperature differences. (b) Range of positive temperature differences.
Figure 37.
Deformation caused by the coupling of temperature stress and load (50 KN) stress field after plate edge cavity grouting in different seasons. (a) Spring. (b) Summer. (c) Autumn. (d) Winter.
Figure 37.
Deformation caused by the coupling of temperature stress and load (50 KN) stress field after plate edge cavity grouting in different seasons. (a) Spring. (b) Summer. (c) Autumn. (d) Winter.
Figure 38.
Deformation caused by the coupling of temperature stress and load (70 KN) stress field after plate edge cavity grouting in different seasons. (a) Spring. (b) Summer. (c) Autumn. (d) Winter.
Figure 38.
Deformation caused by the coupling of temperature stress and load (70 KN) stress field after plate edge cavity grouting in different seasons. (a) Spring. (b) Summer. (c) Autumn. (d) Winter.
Figure 39.
Deformation caused by the coupling of temperature stress and load (90 KN) stress field after angular cavity grouting in different seasons. (a) Spring. (b) Summer. (c) Autumn. (d) Winter.
Figure 39.
Deformation caused by the coupling of temperature stress and load (90 KN) stress field after angular cavity grouting in different seasons. (a) Spring. (b) Summer. (c) Autumn. (d) Winter.
Figure 40.
Bending considering the influence of temperature after plate angle unloading grouting in different seasons (load 50 KN). (a) Spring. (b) Summer. (c) Autumn. (d) Winter.
Figure 40.
Bending considering the influence of temperature after plate angle unloading grouting in different seasons (load 50 KN). (a) Spring. (b) Summer. (c) Autumn. (d) Winter.
Figure 41.
Bending of slab edge with temperature influence considered after hollow grouting in different seasons (load 70 KN). (a) Spring. (b) Summer. (c) Autumn. (d) Winter.
Figure 41.
Bending of slab edge with temperature influence considered after hollow grouting in different seasons (load 70 KN). (a) Spring. (b) Summer. (c) Autumn. (d) Winter.
Figure 42.
Deflection considering the influence of temperature after plate angle unloading grouting in different seasons (load 90 KN). (a) Spring. (b) Summer. (c) Autumn. (d) Winter.
Figure 42.
Deflection considering the influence of temperature after plate angle unloading grouting in different seasons (load 90 KN). (a) Spring. (b) Summer. (c) Autumn. (d) Winter.
Figure 43.
Influence coefficient of temperature after plate angle unloading grouting in different seasons (load 50 KN). (a) Spring. (b) Summer. (c) Autumn. (d) Winter.
Figure 43.
Influence coefficient of temperature after plate angle unloading grouting in different seasons (load 50 KN). (a) Spring. (b) Summer. (c) Autumn. (d) Winter.
Figure 44.
Influence coefficient of temperature after plate angle unloading grouting in different seasons (load 70 KN). (a) Spring. (b) Summer. (c) Autumn. (d) Winter.
Figure 44.
Influence coefficient of temperature after plate angle unloading grouting in different seasons (load 70 KN). (a) Spring. (b) Summer. (c) Autumn. (d) Winter.
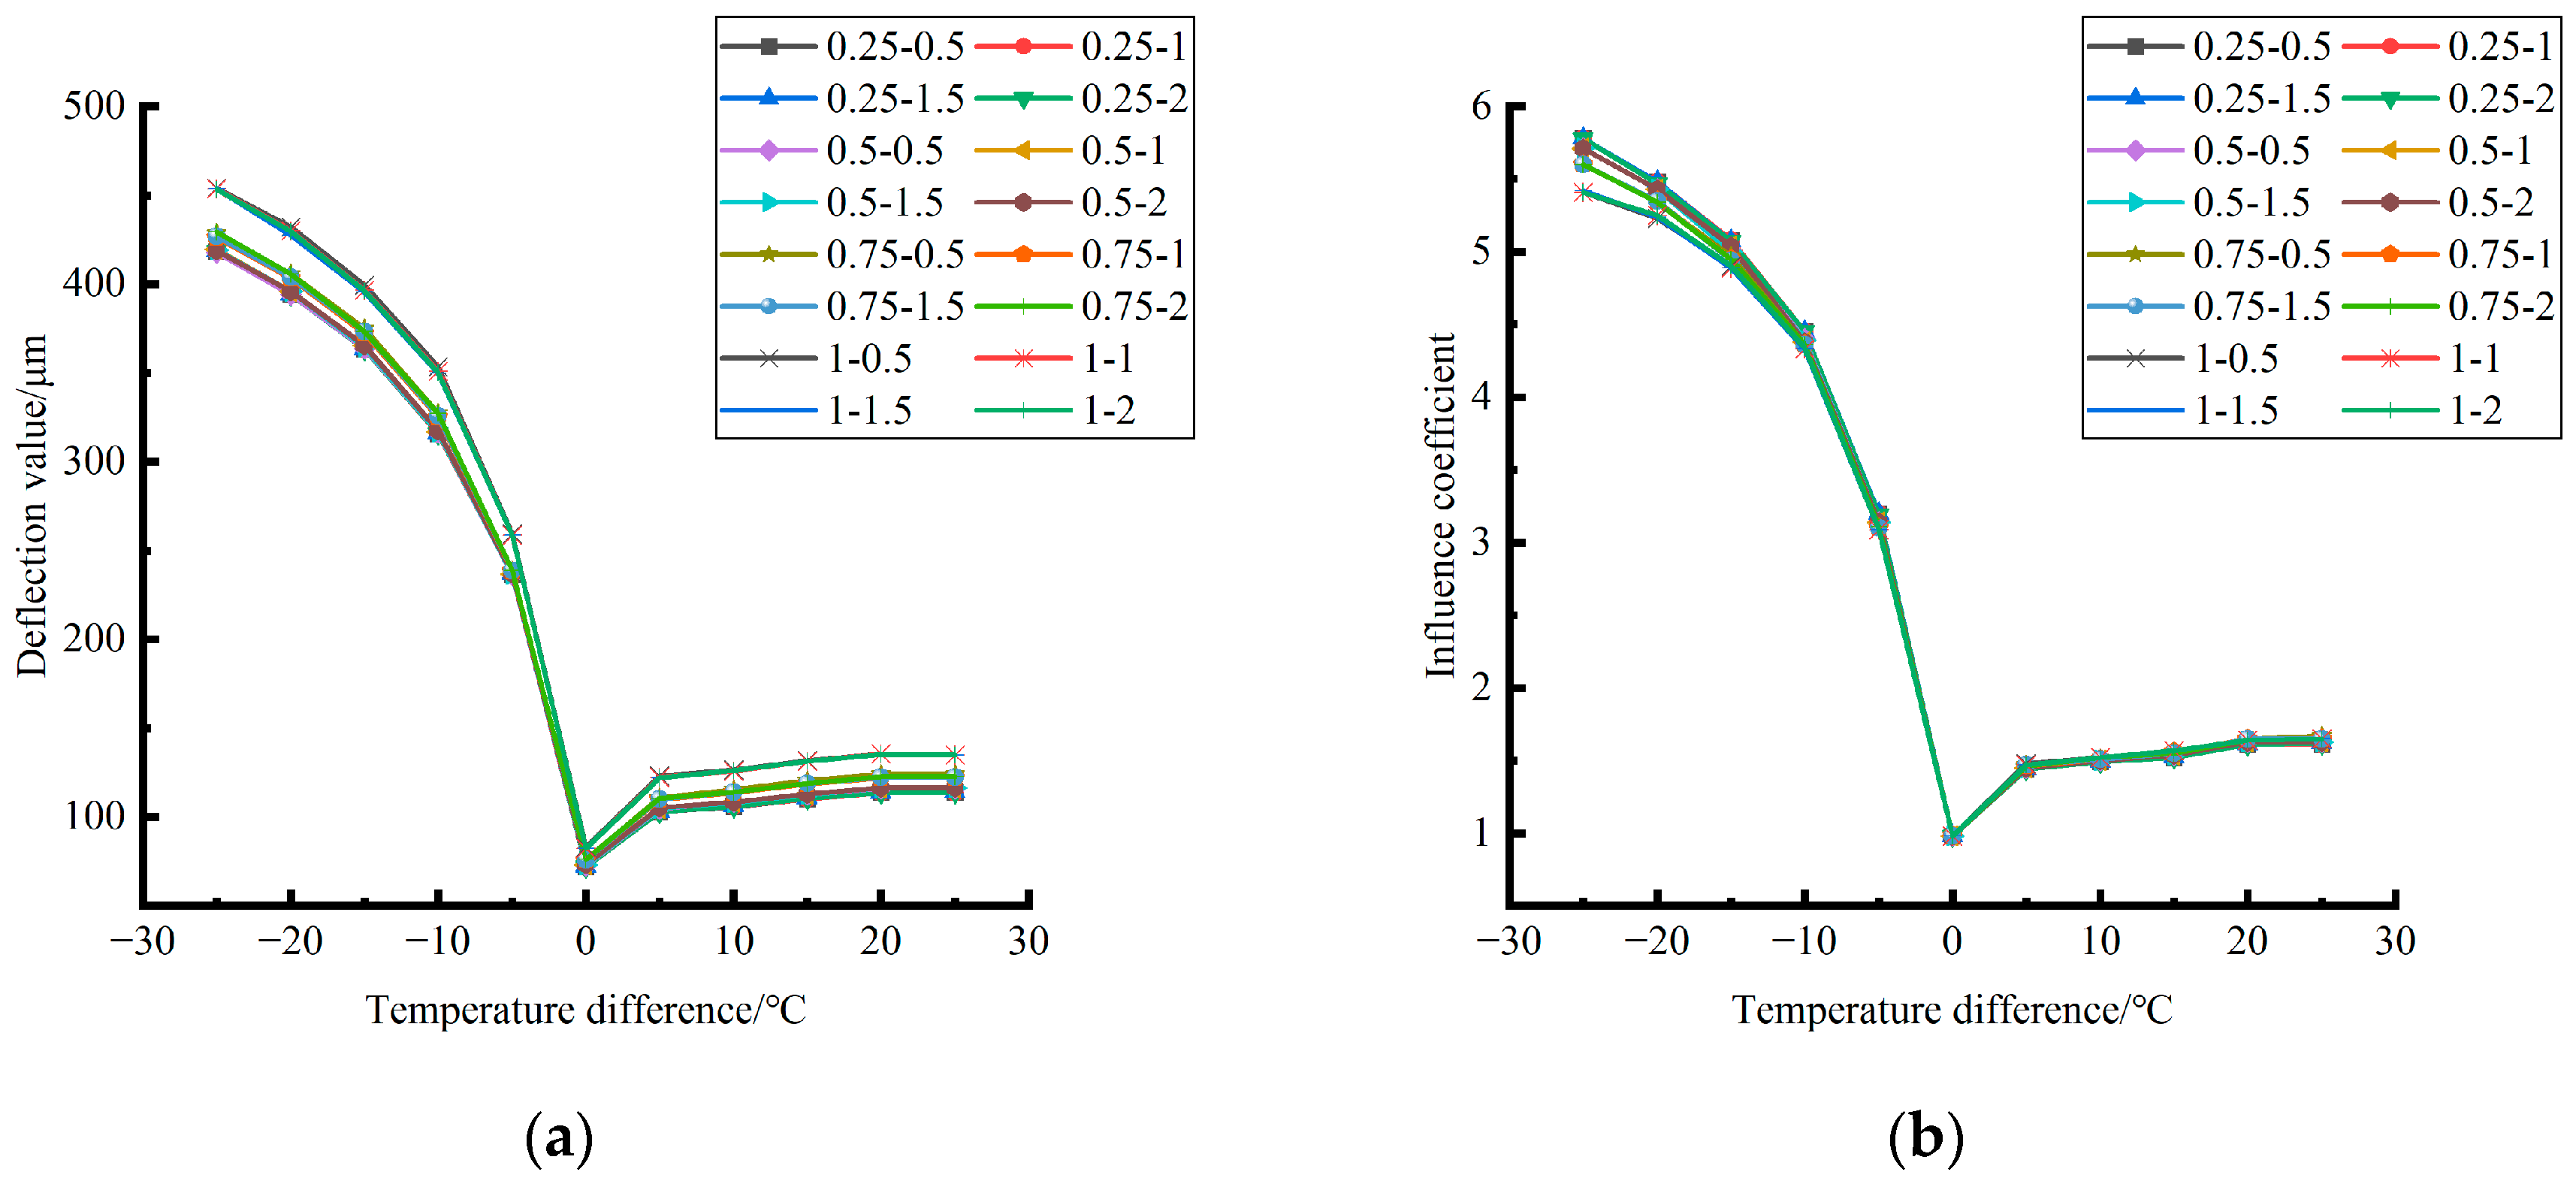
Figure 45.
Influence coefficient of temperature after plate edge unloading grouting in different seasons (load 90 KN). (a) Spring. (b) Summer. (c) Autumn. (d) Winter.
Figure 45.
Influence coefficient of temperature after plate edge unloading grouting in different seasons (load 90 KN). (a) Spring. (b) Summer. (c) Autumn. (d) Winter.
Figure 46.
Correlation between positive and negative temperature differences and influence coefficient. (a) Range of negative temperature differences. (b) Range of positive temperature differences.
Figure 46.
Correlation between positive and negative temperature differences and influence coefficient. (a) Range of negative temperature differences. (b) Range of positive temperature differences.
Figure 47.
The temperature sensor was buried and blocked.
Figure 47.
The temperature sensor was buried and blocked.
Figure 48.
A void was arranged at the corresponding edge of the base plate.
Figure 48.
A void was arranged at the corresponding edge of the base plate.
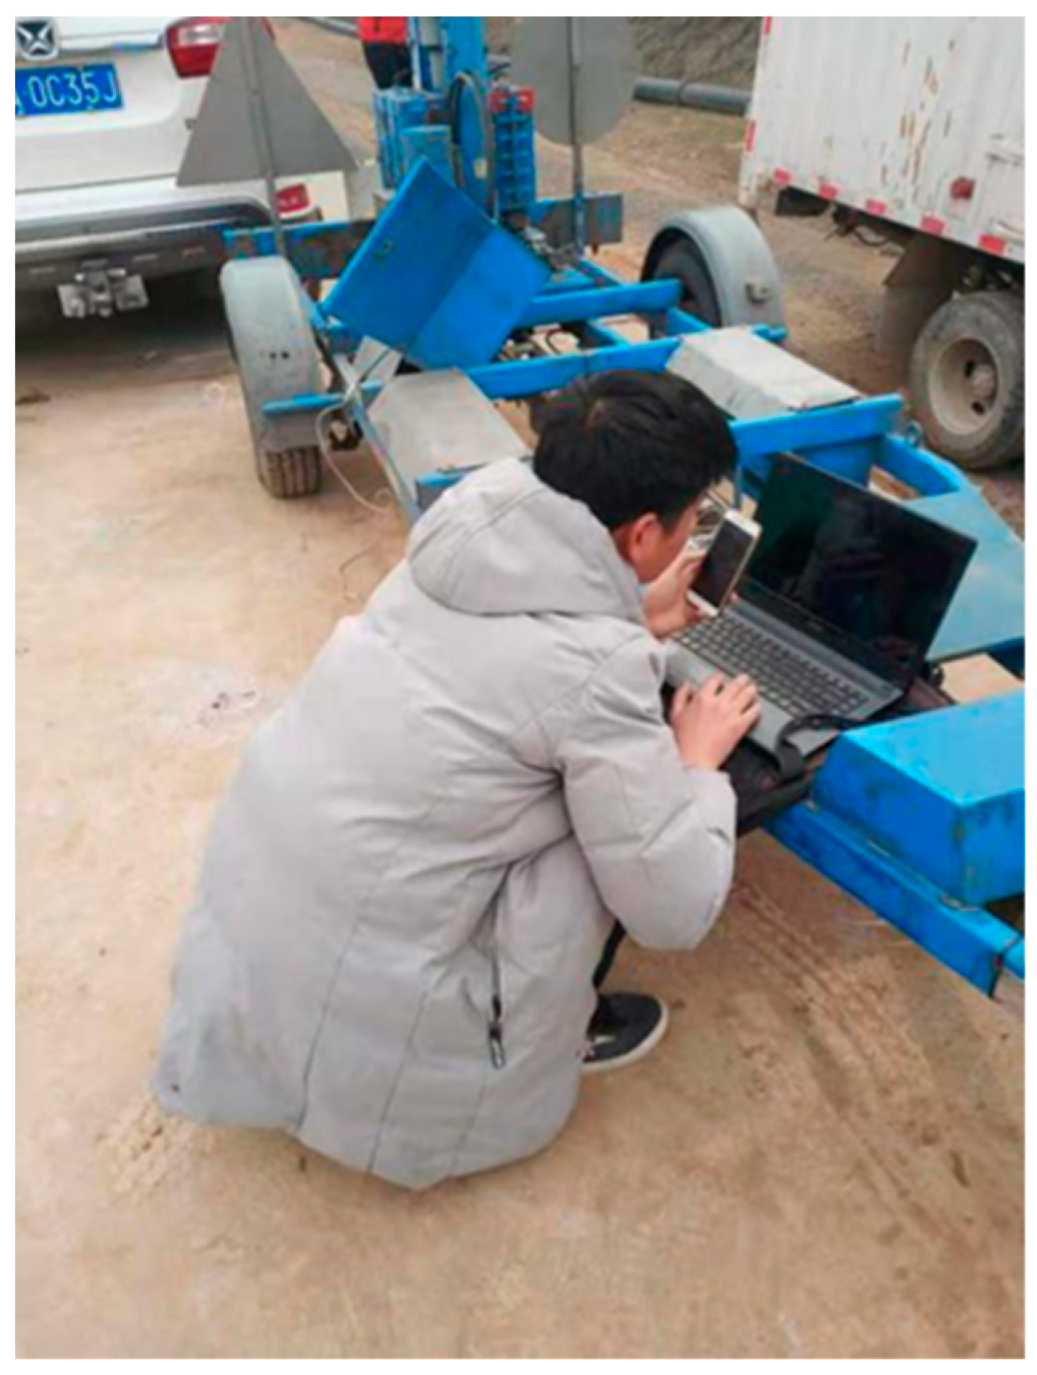
Figure 49.
Measuring the pavement temperature.
Figure 49.
Measuring the pavement temperature.
Figure 50.
Measuring the bending data.
Figure 50.
Measuring the bending data.
Figure 51.
Drilling polymer grouting holes in the release area.
Figure 51.
Drilling polymer grouting holes in the release area.
Figure 52.
Polymer grouting in the void zone.
Figure 52.
Polymer grouting in the void zone.
Figure 53.
Range of negative temperature differences before grouting.
Figure 53.
Range of negative temperature differences before grouting.
Figure 54.
Range of positive temperature differences before grouting.
Figure 54.
Range of positive temperature differences before grouting.
Figure 55.
Range of negative temperature differences after grouting.
Figure 55.
Range of negative temperature differences after grouting.
Figure 56.
Range of positive temperature differences after grouting.
Figure 56.
Range of positive temperature differences after grouting.
Table 1.
Design parameters of each structural layer of cement concrete pavement.
Table 1.
Design parameters of each structural layer of cement concrete pavement.
| Structural Layer | Surface Layer | Foundation Layer | Subbase Layer |
|---|
| Type of material | Cement Concrete | Cement-stabilized macadam base | Graded gravel |
| Thickness (dimension) | 24 cm (4 m × 5 m) | 18 cm | 16 cm |
Table 2.
Material parameters of the cement concrete pavement lattice structure.
Table 2.
Material parameters of the cement concrete pavement lattice structure.
| | Plane Size/m2 | Thickness/cm | Modulus of Elasticity/MPa | Poisson Ratio | Thermal Conductivity/
ω m−1 °C−1 | Coefficient of Expansion/°C−1 |
|---|
| Surface layer | 5 × 4 | 24 | 30,000 | 0.15 | 1.34 | 1.00 × 10⁻⁵ |
| Foundation layer | 15 × 12 | 16 | 500 | 0.3 | - | - |
| Subbase layer | 15 × 12 | 18 | 400 | 0.3 | - | - |


