


From Waste to Value Added Products: Manufacturing High Electromagnetic Interference Shielding Composite from End-of-Life Vehicle (ELV) Waste


Abstract
:
1. Introduction
2. Experimental
2.1. Materials
2.2. Composite Preparation
2.3. Characterization
3. Results and Discussion
3.1. Morphology Analysis
3.2. Fourier-Transform Infrared Spectroscopy
3.3. Thermogravimetric Analysis
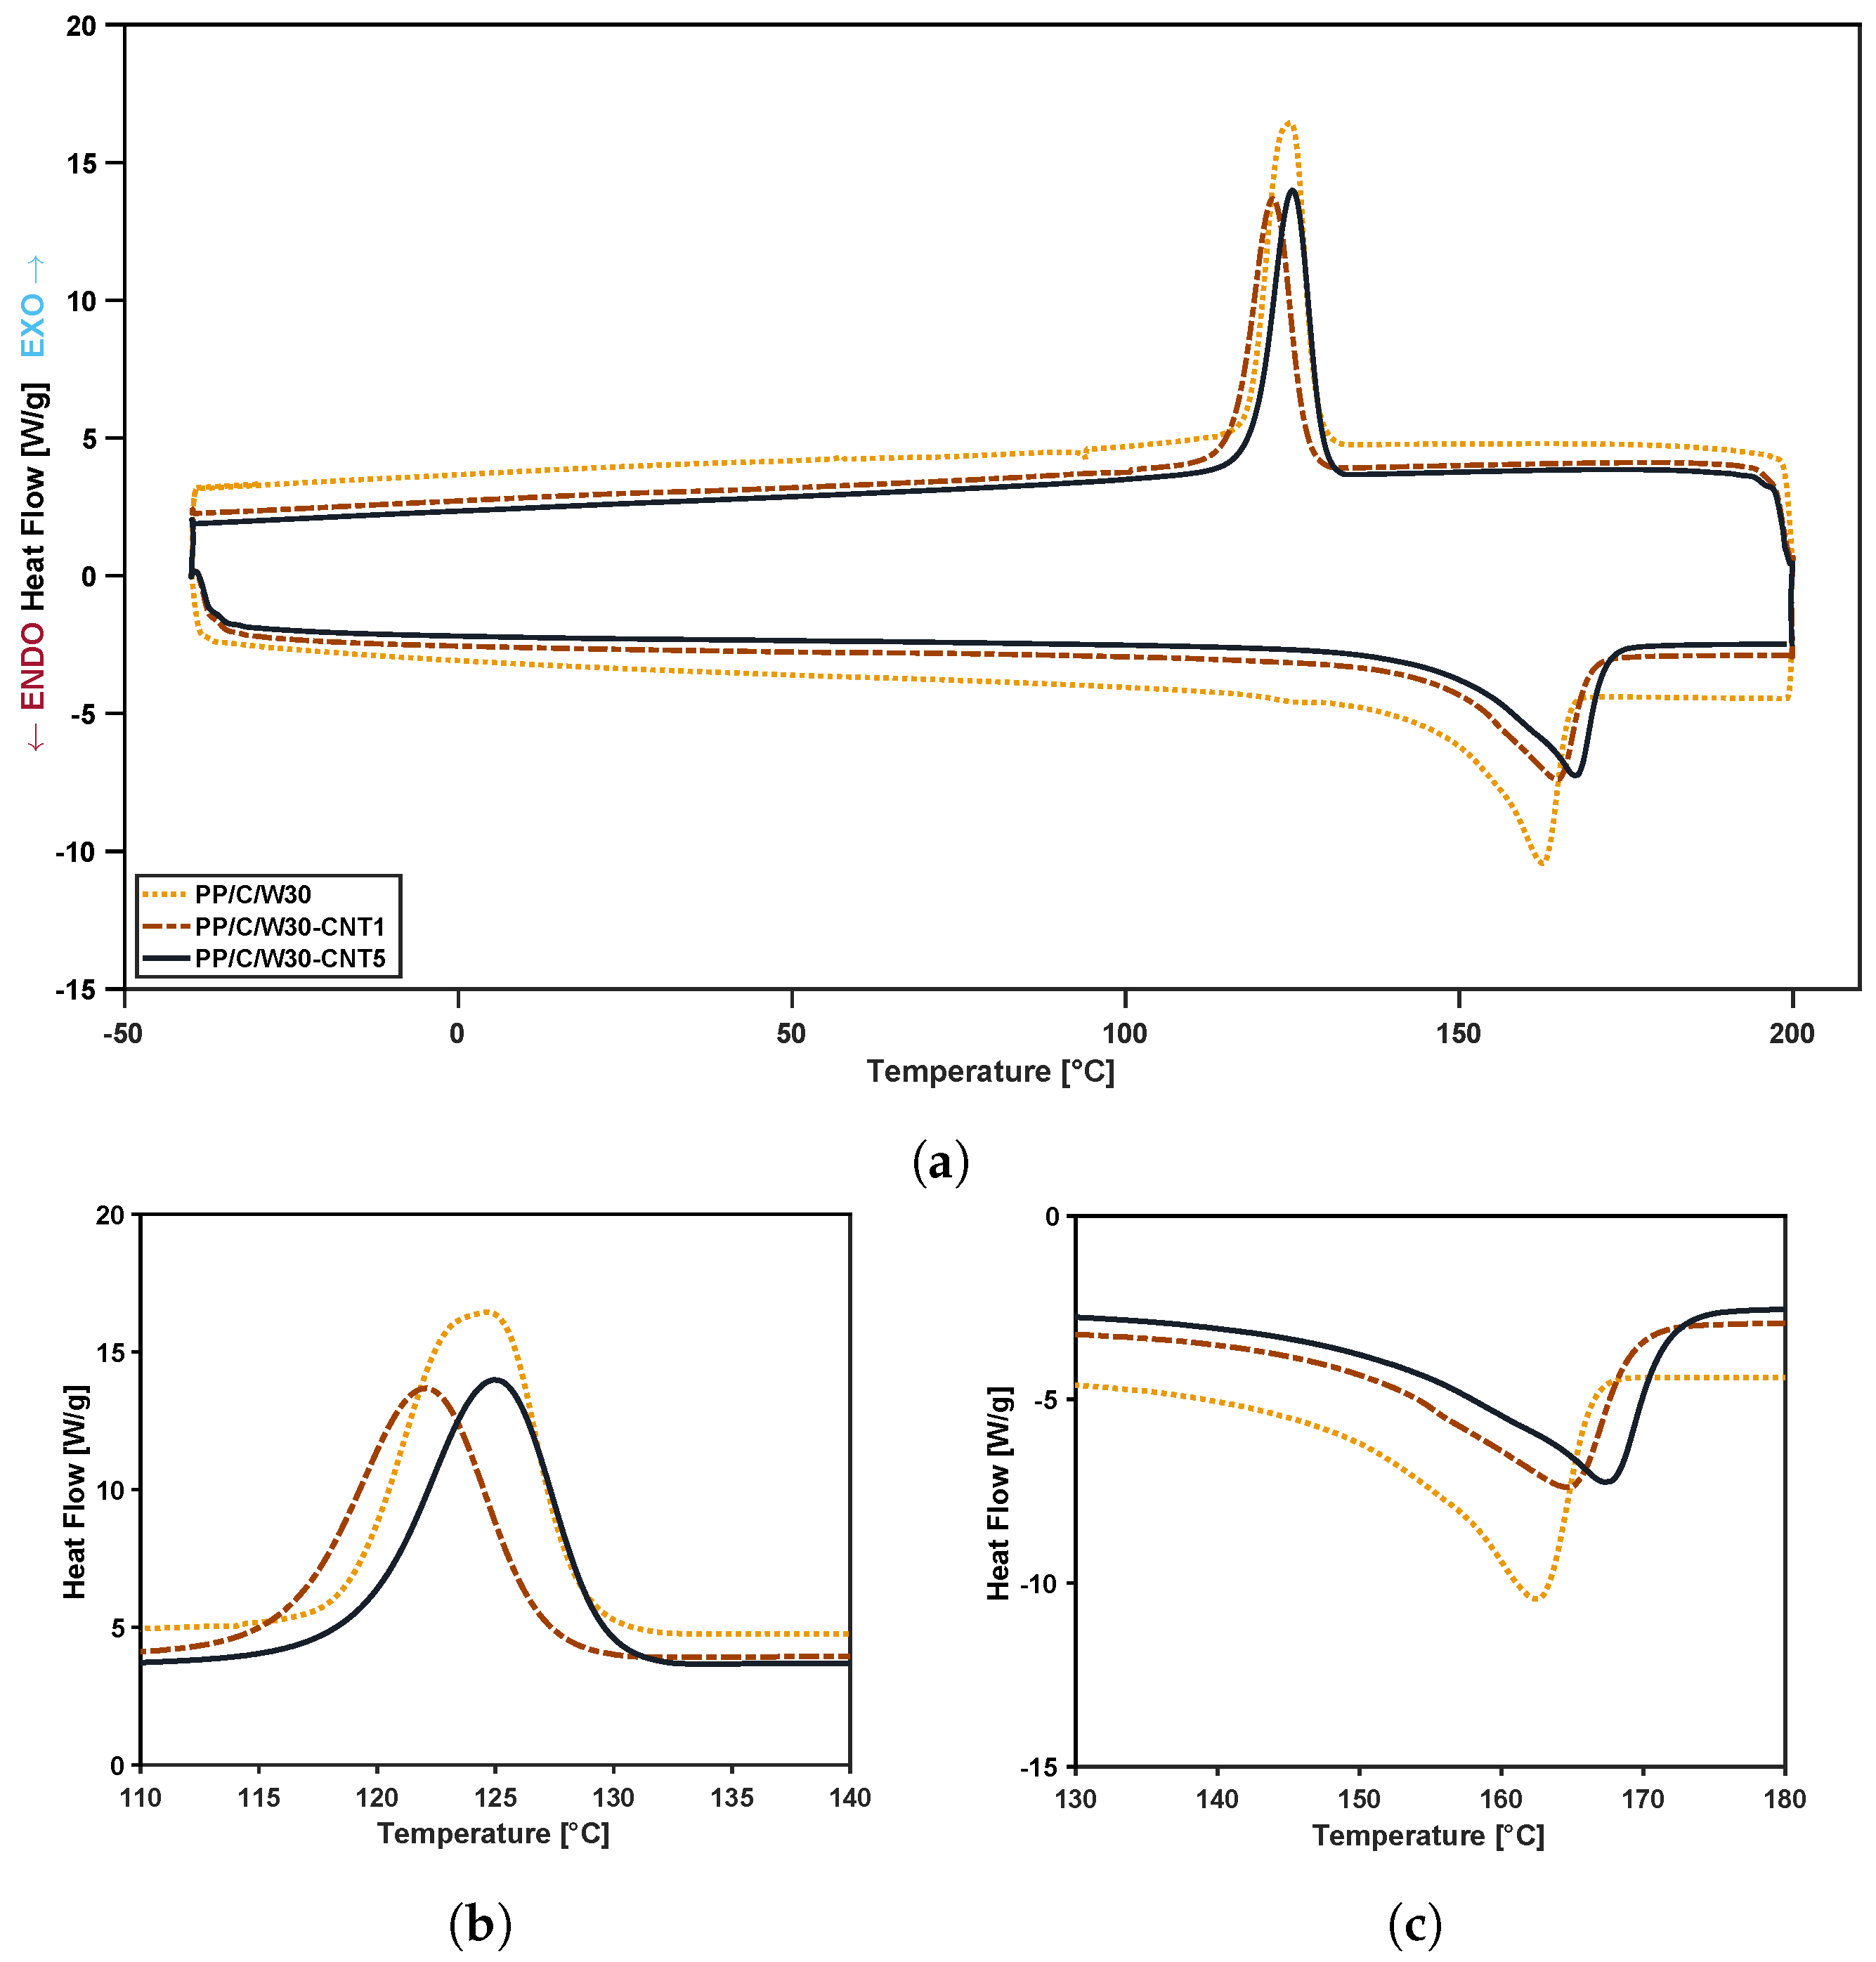
3.4. Differential Scanning Calorimetry (DSC)
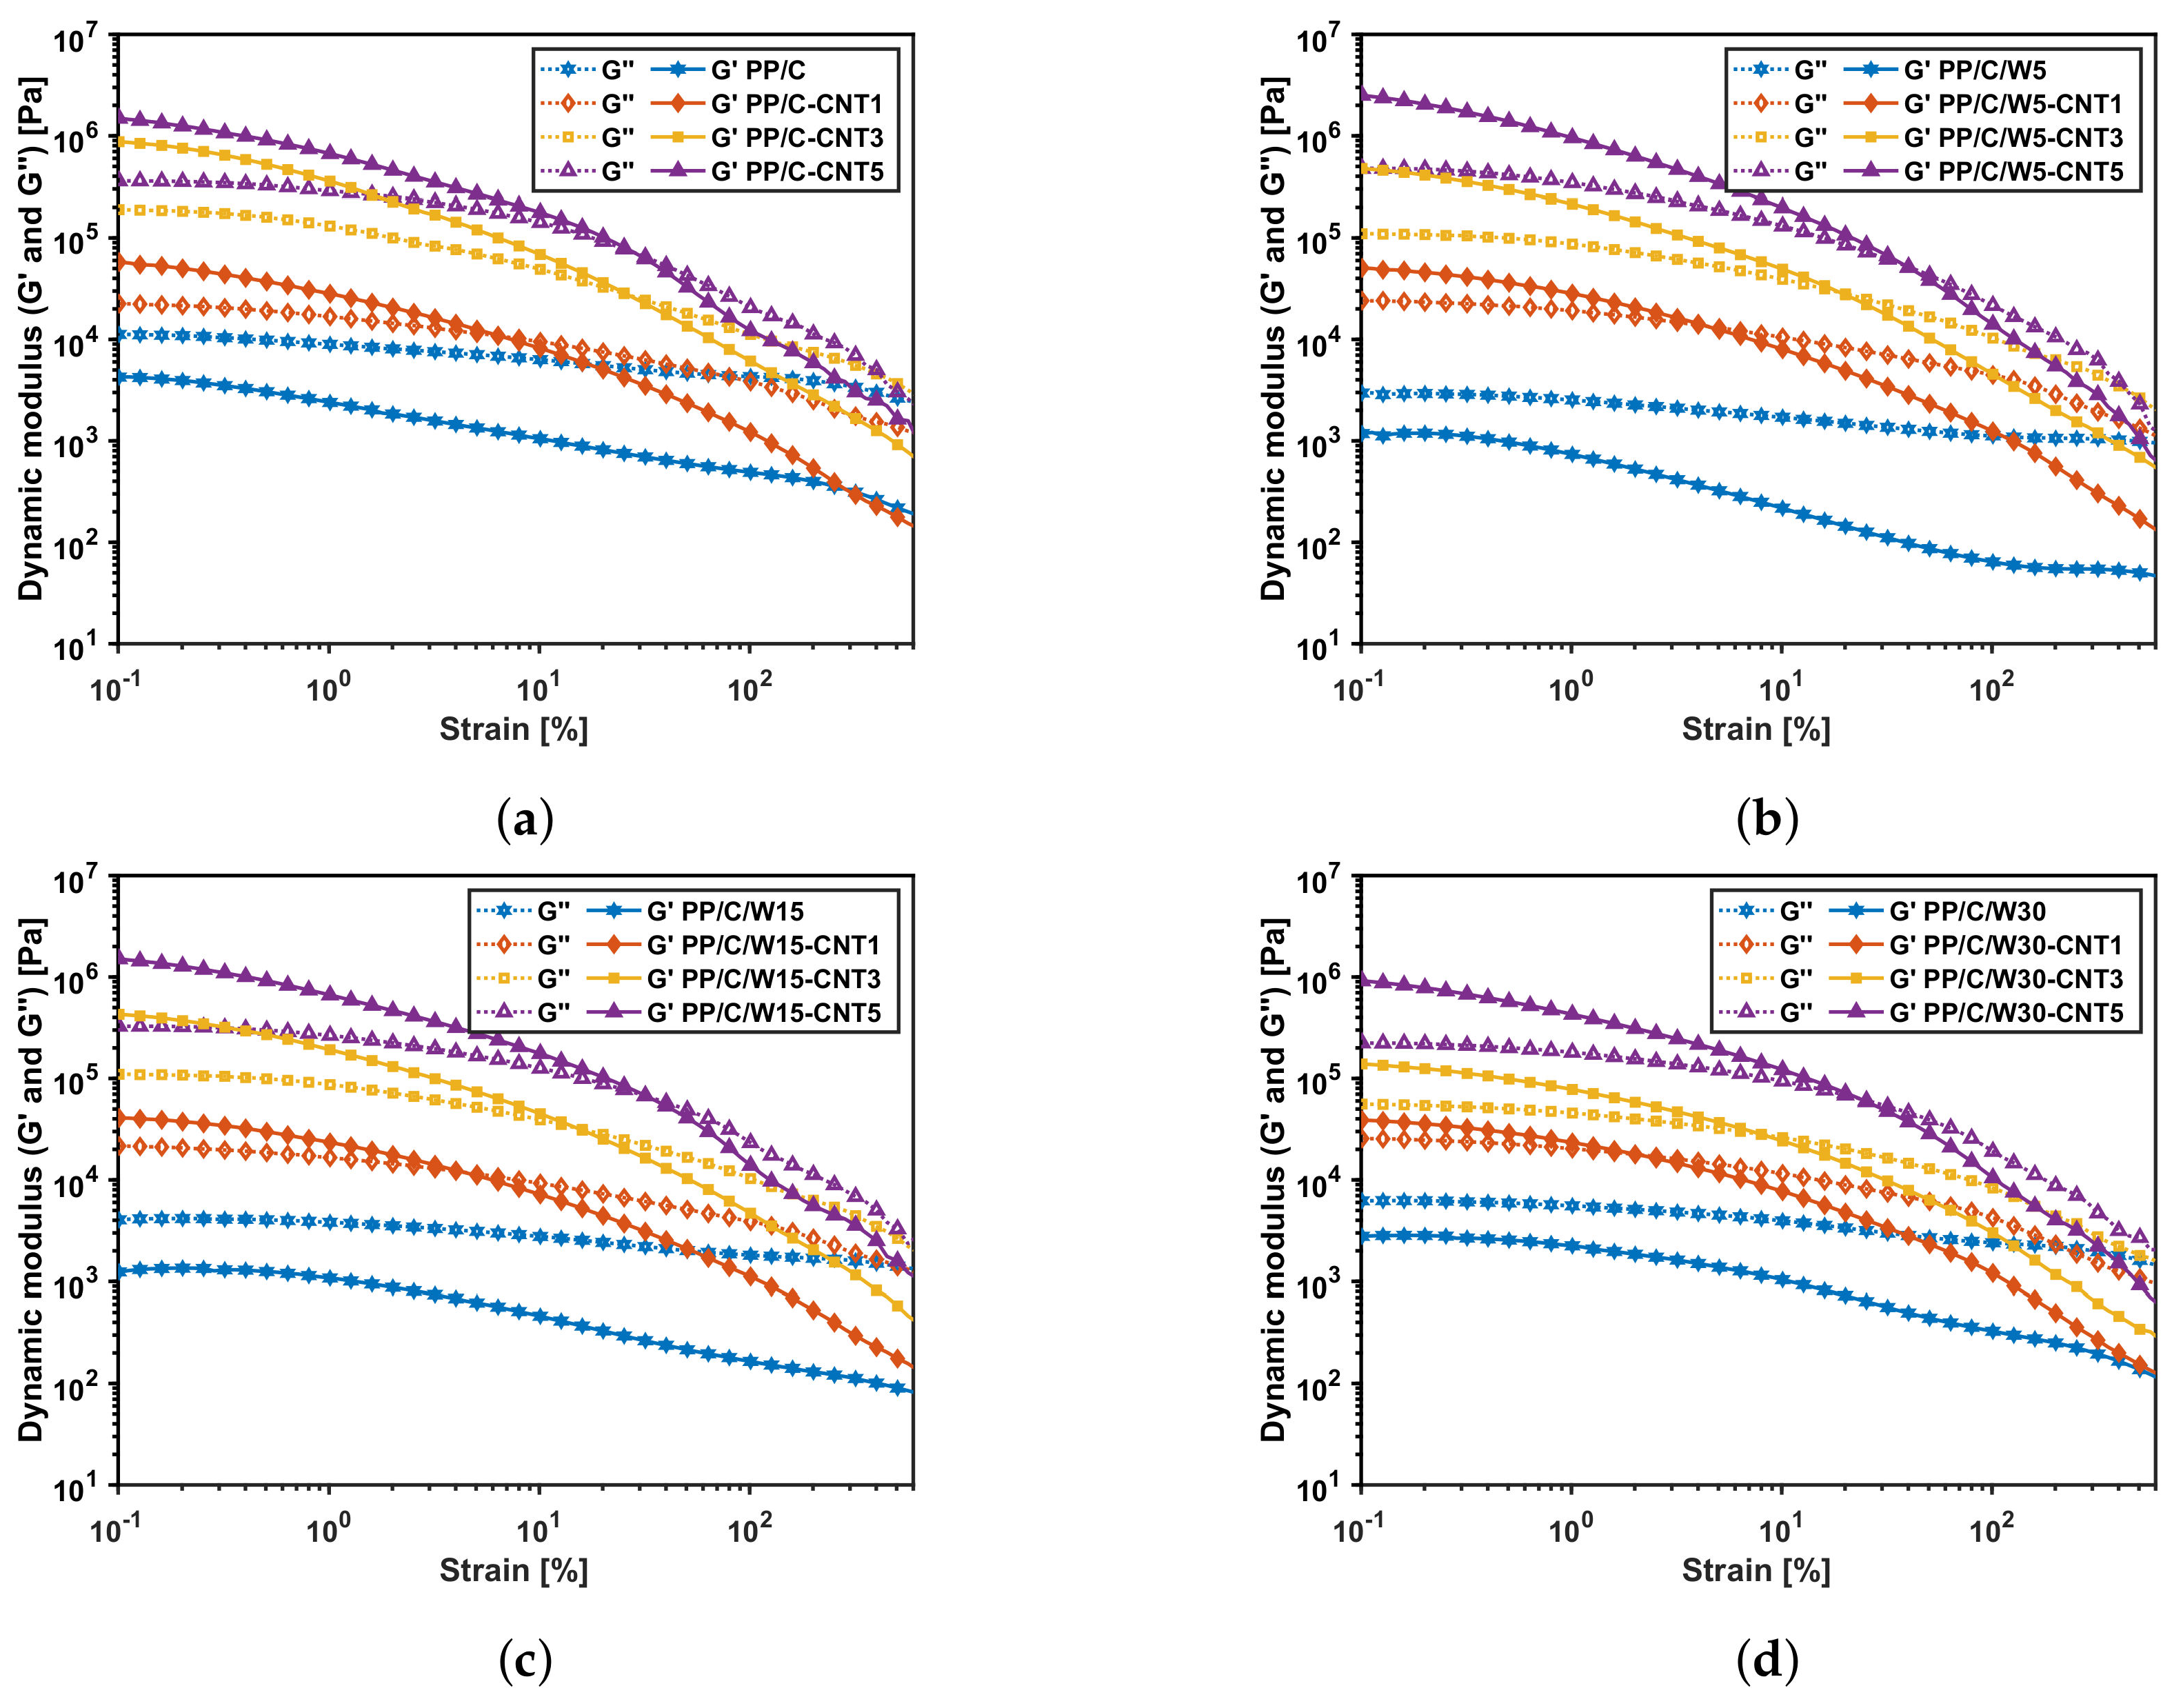
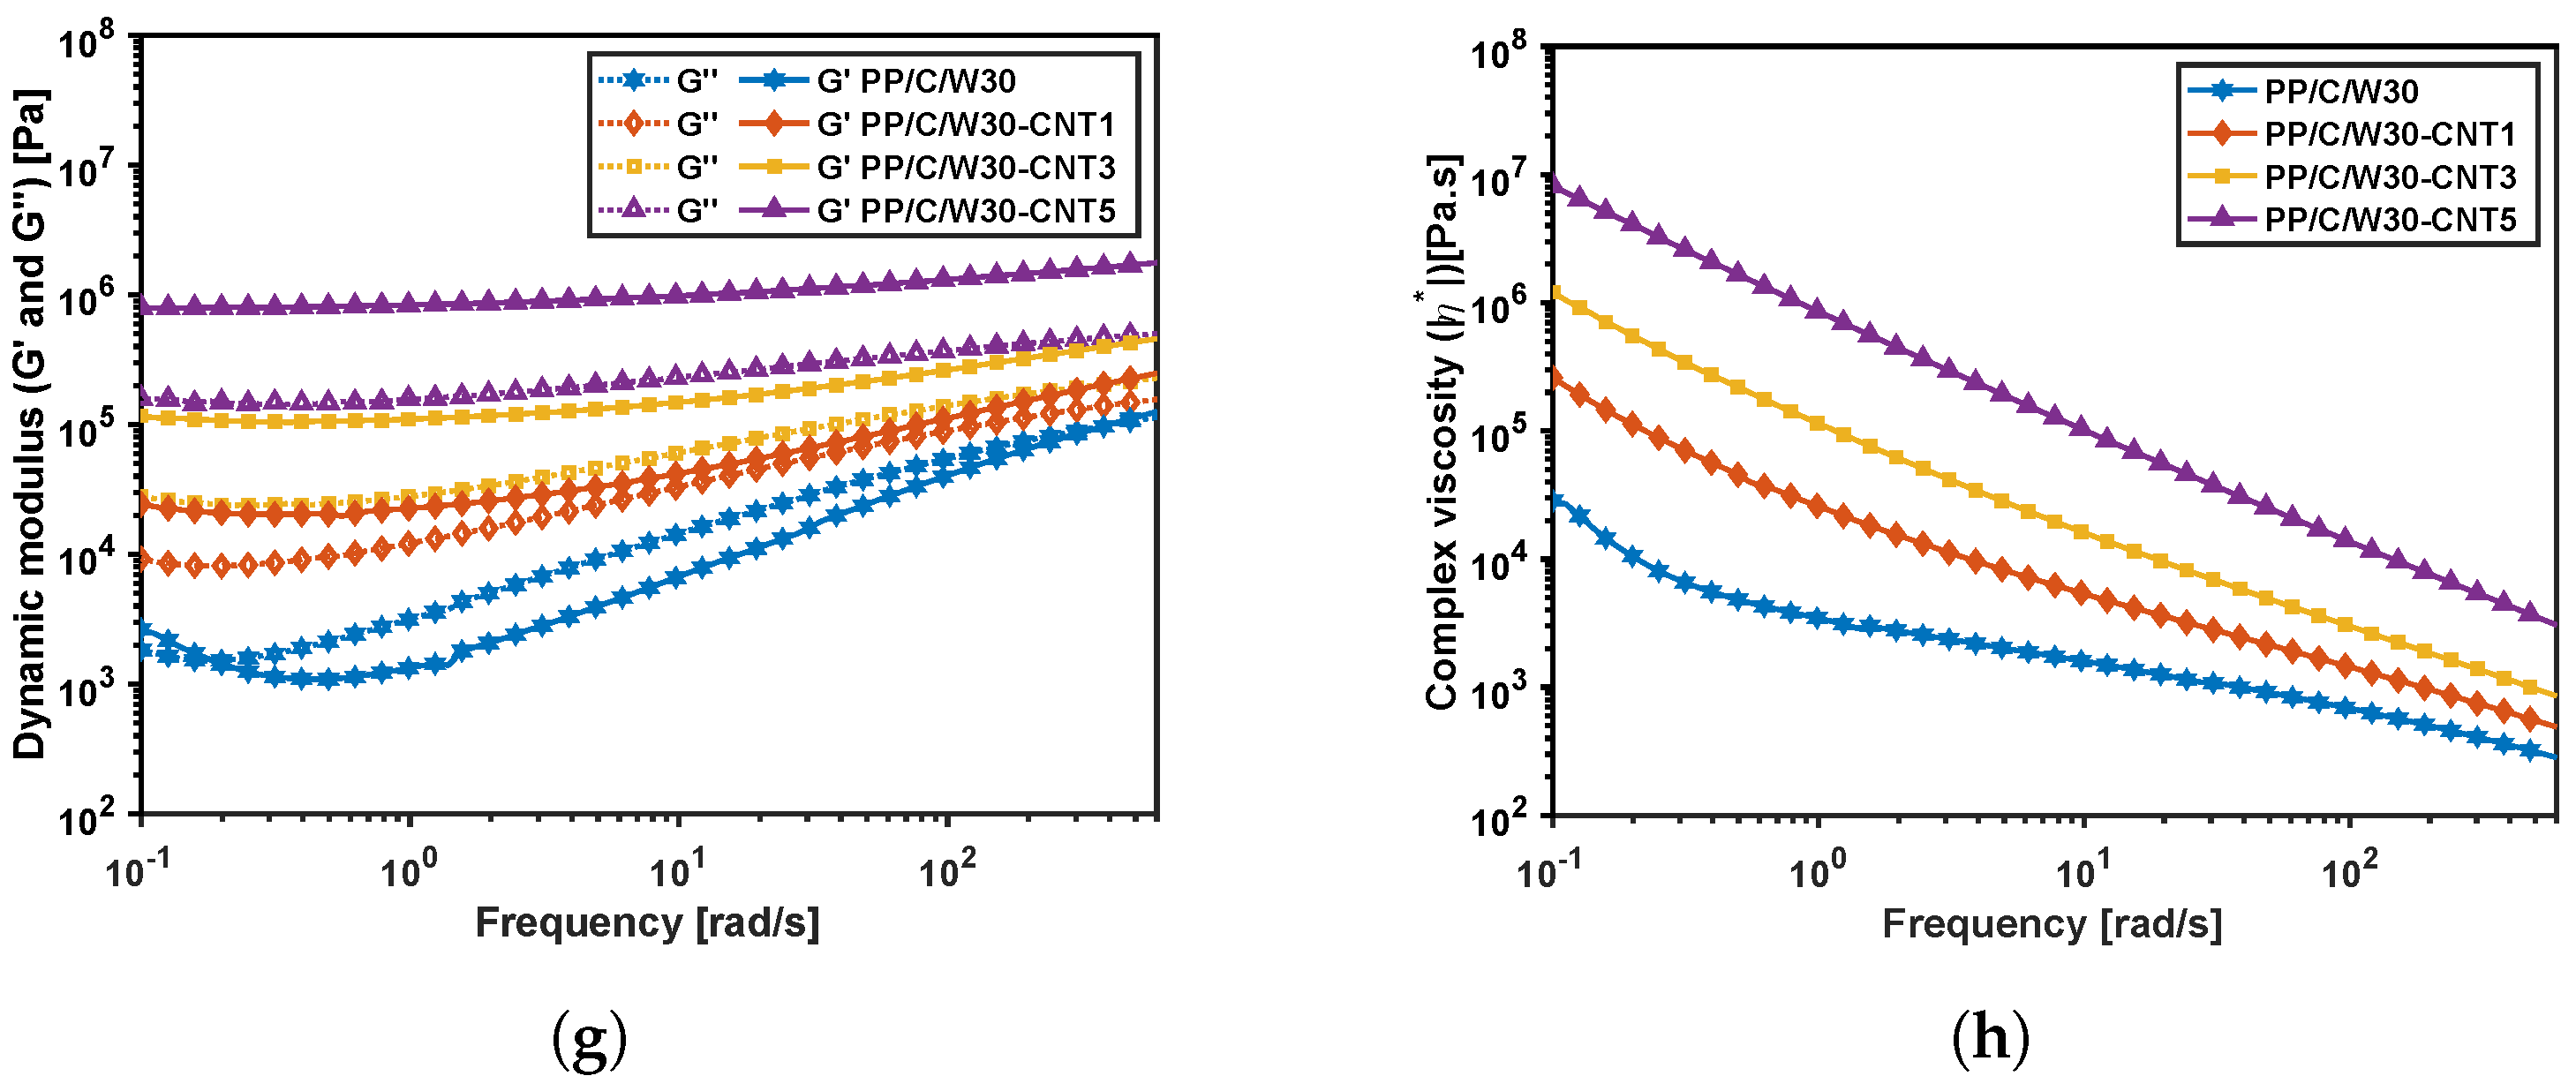
3.5. Rheology
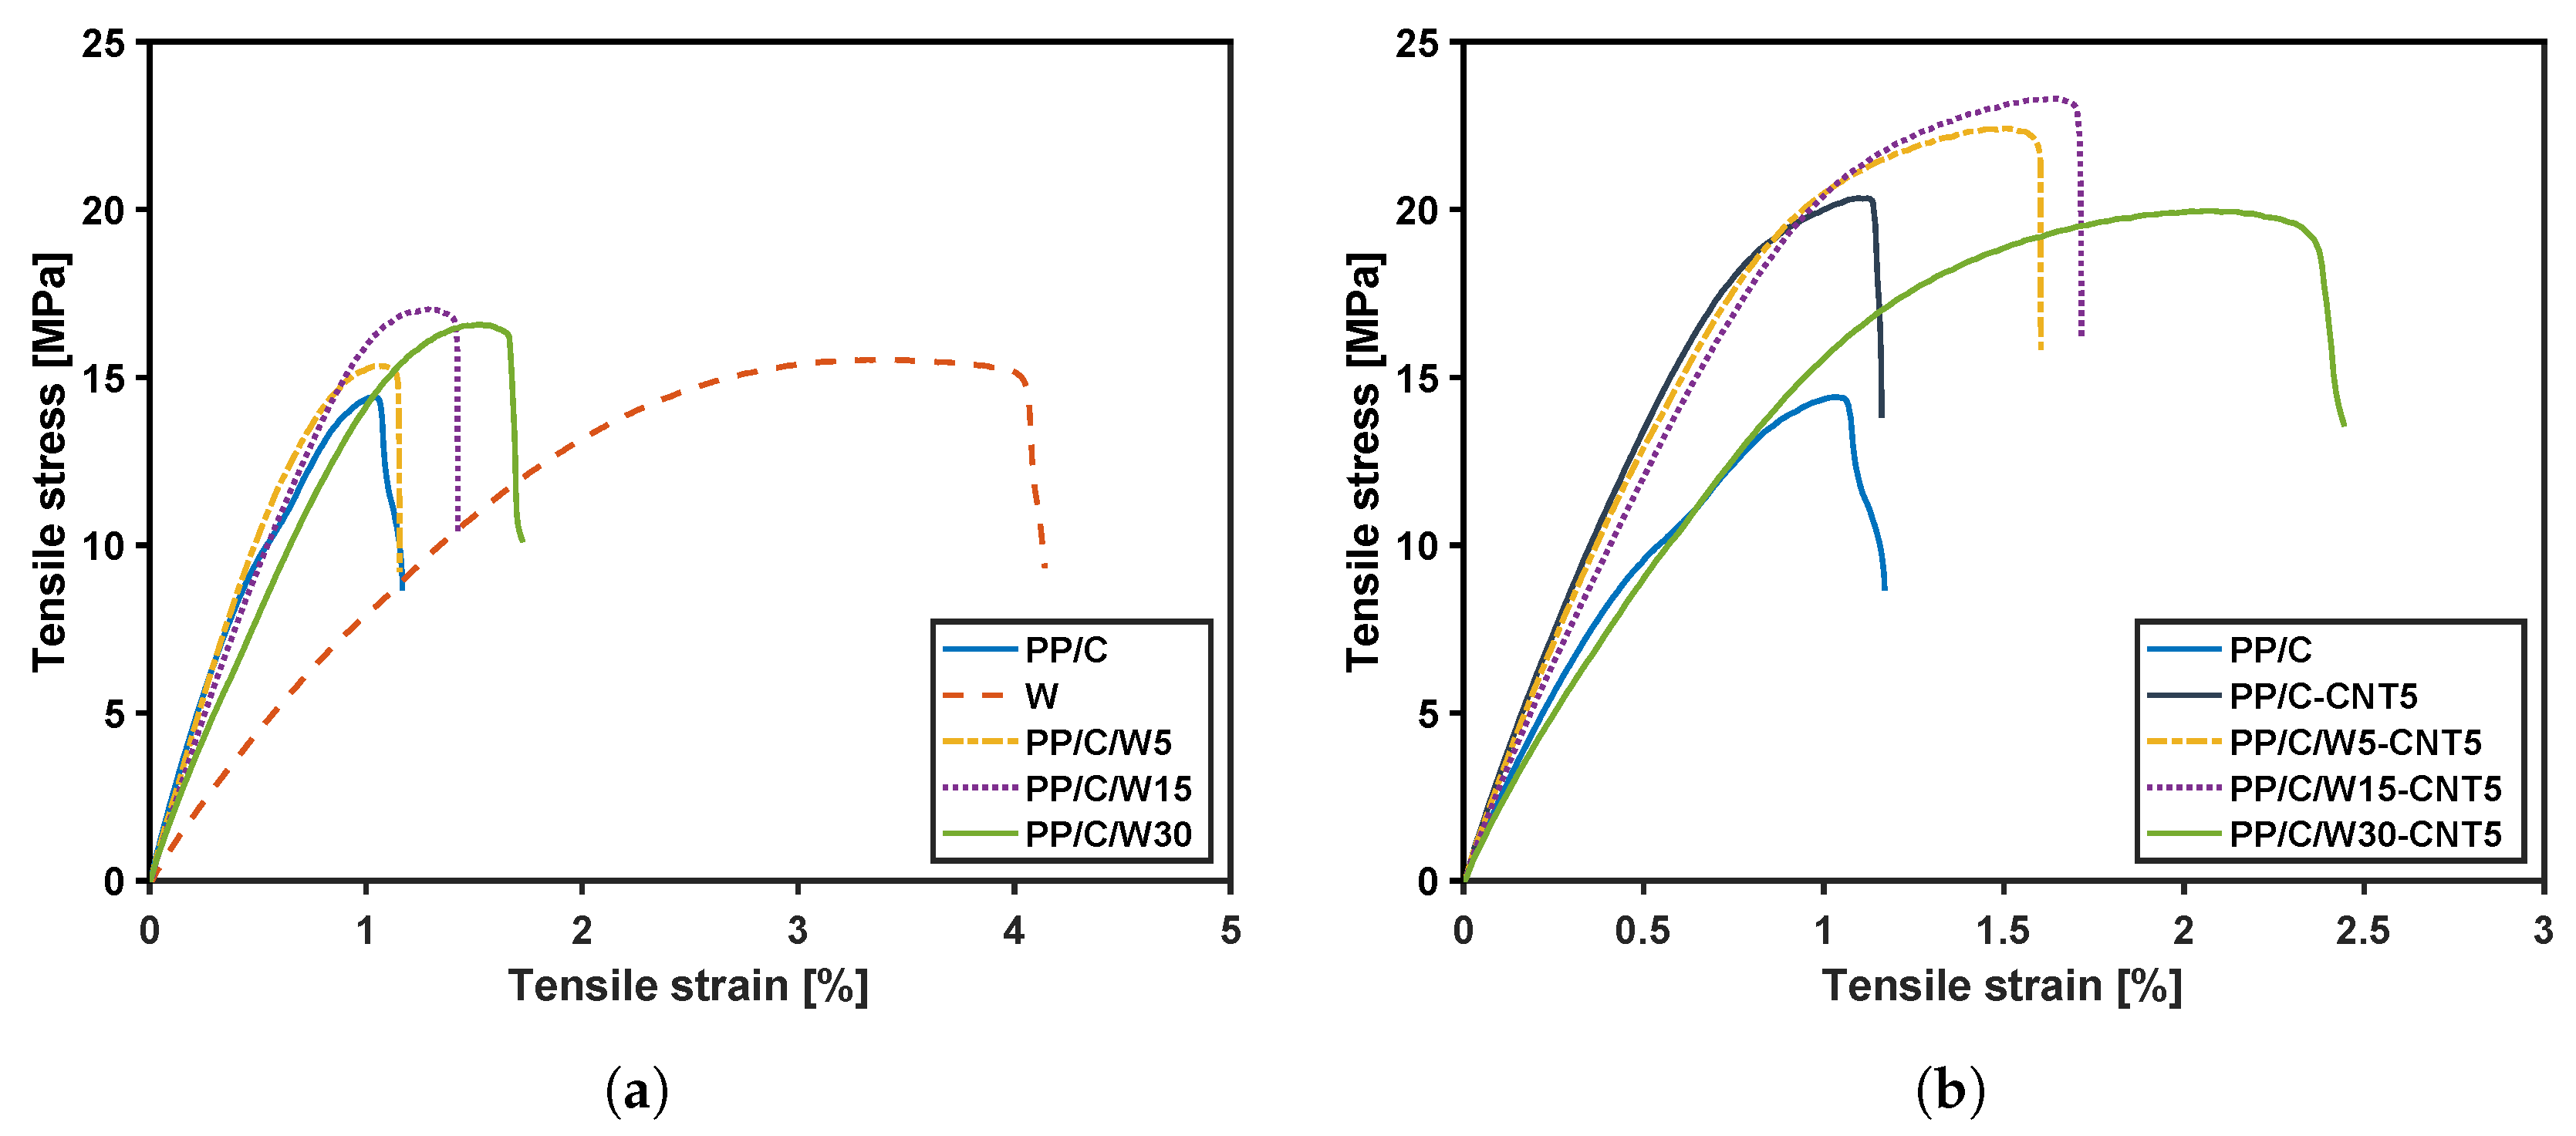
3.6. Mechanical Properties
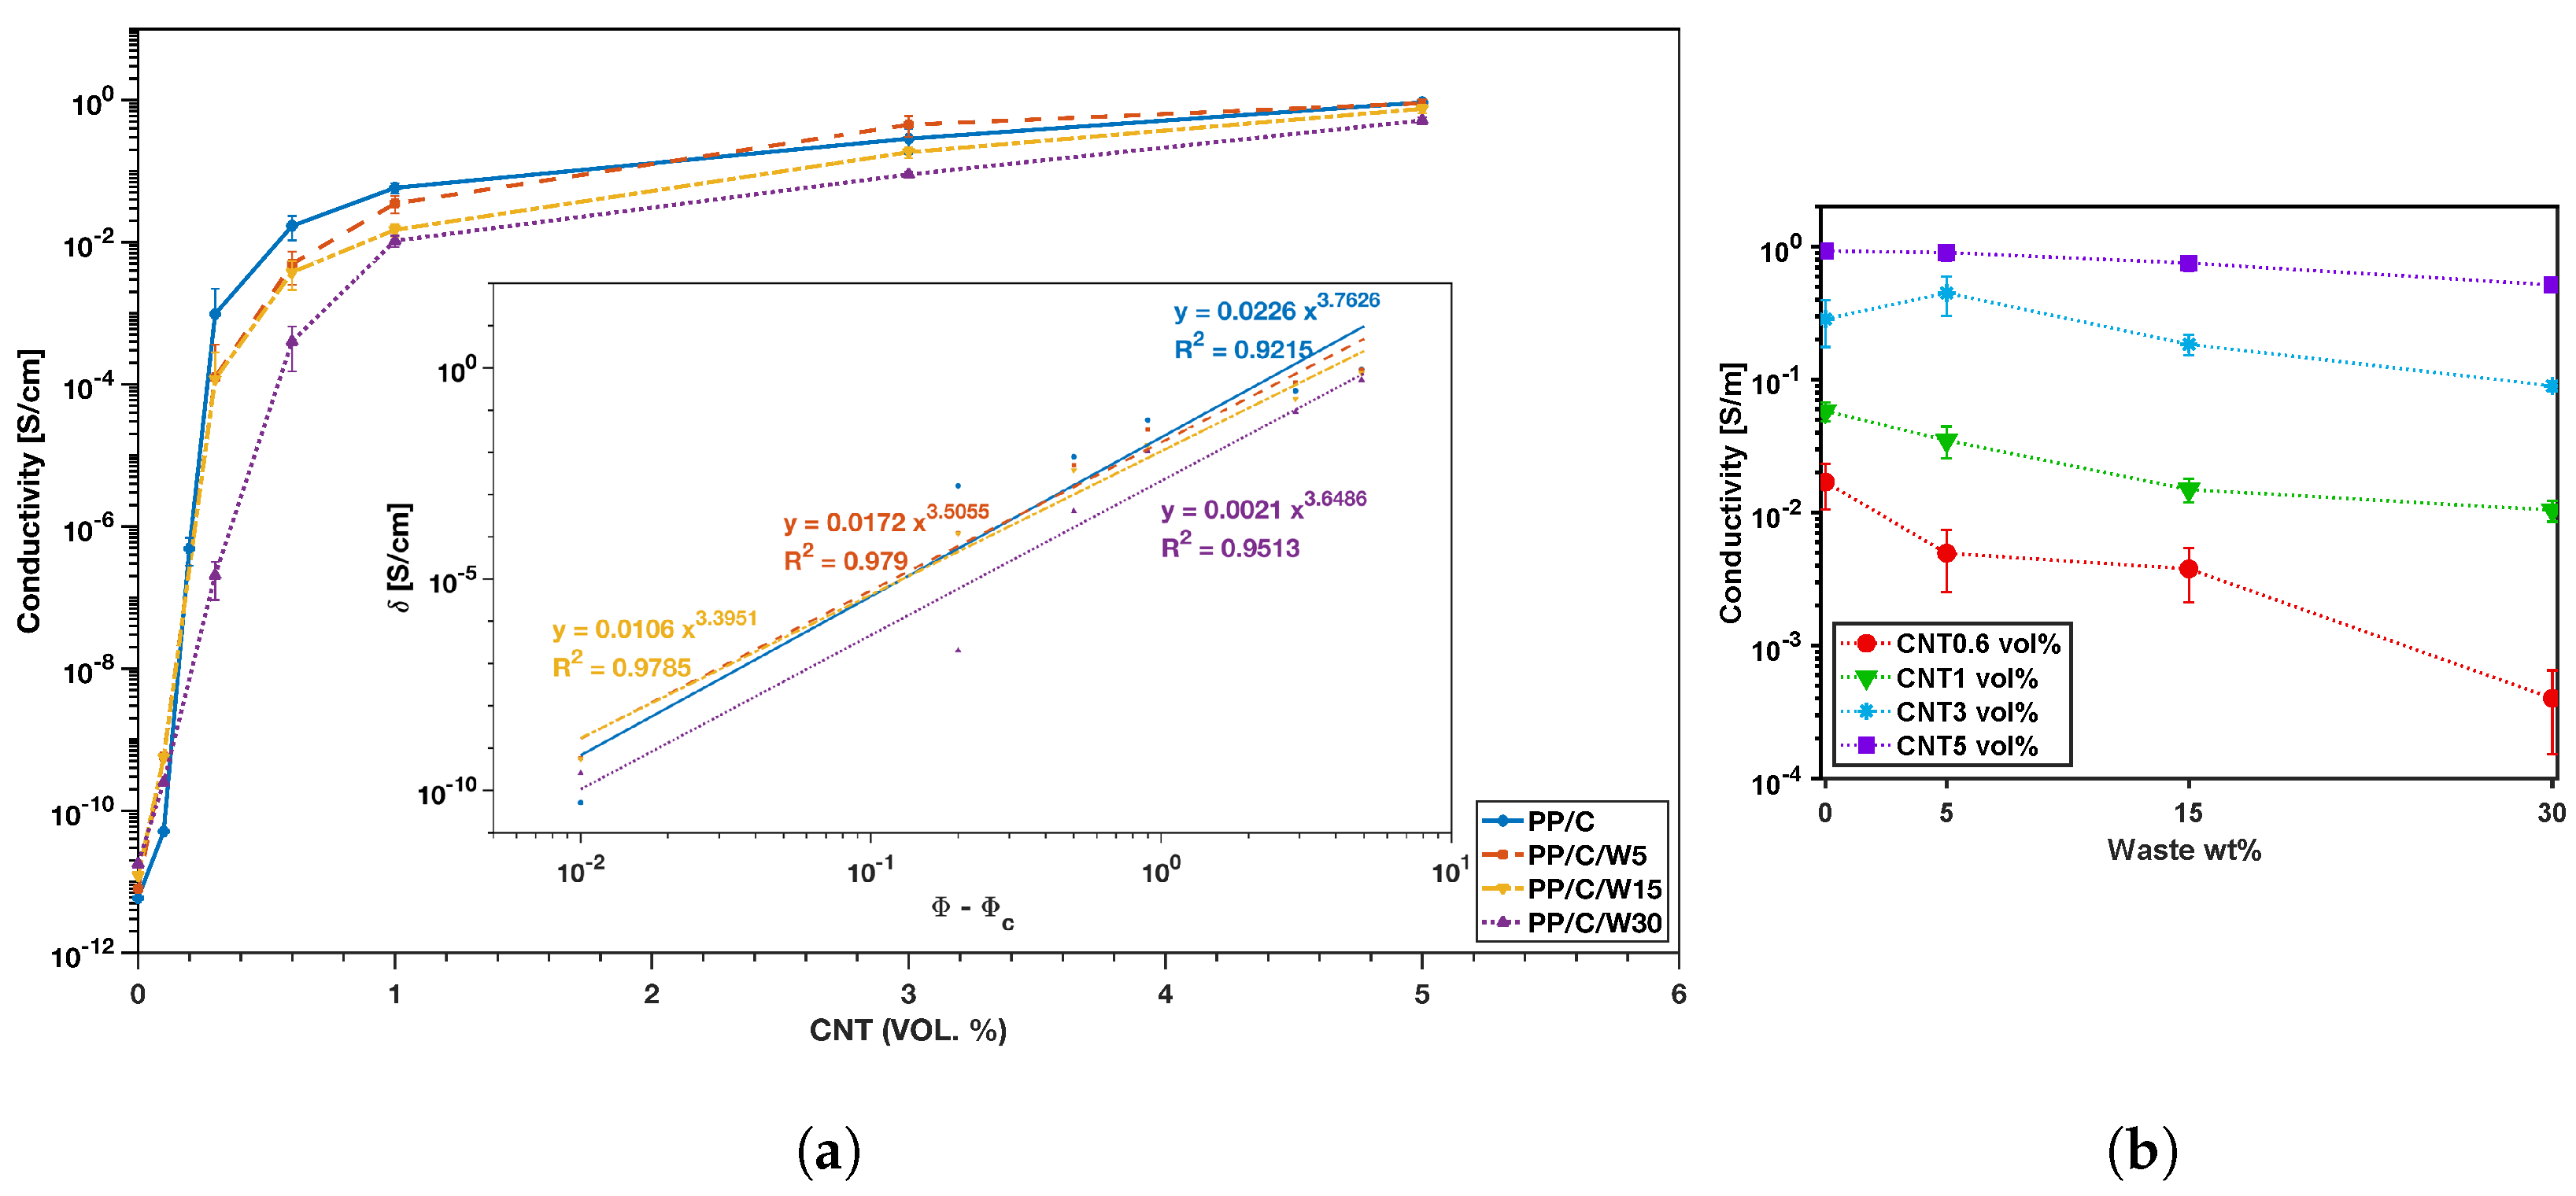
3.7. Electrical Conductivity
3.8. Electromagnetic Interference Shielding
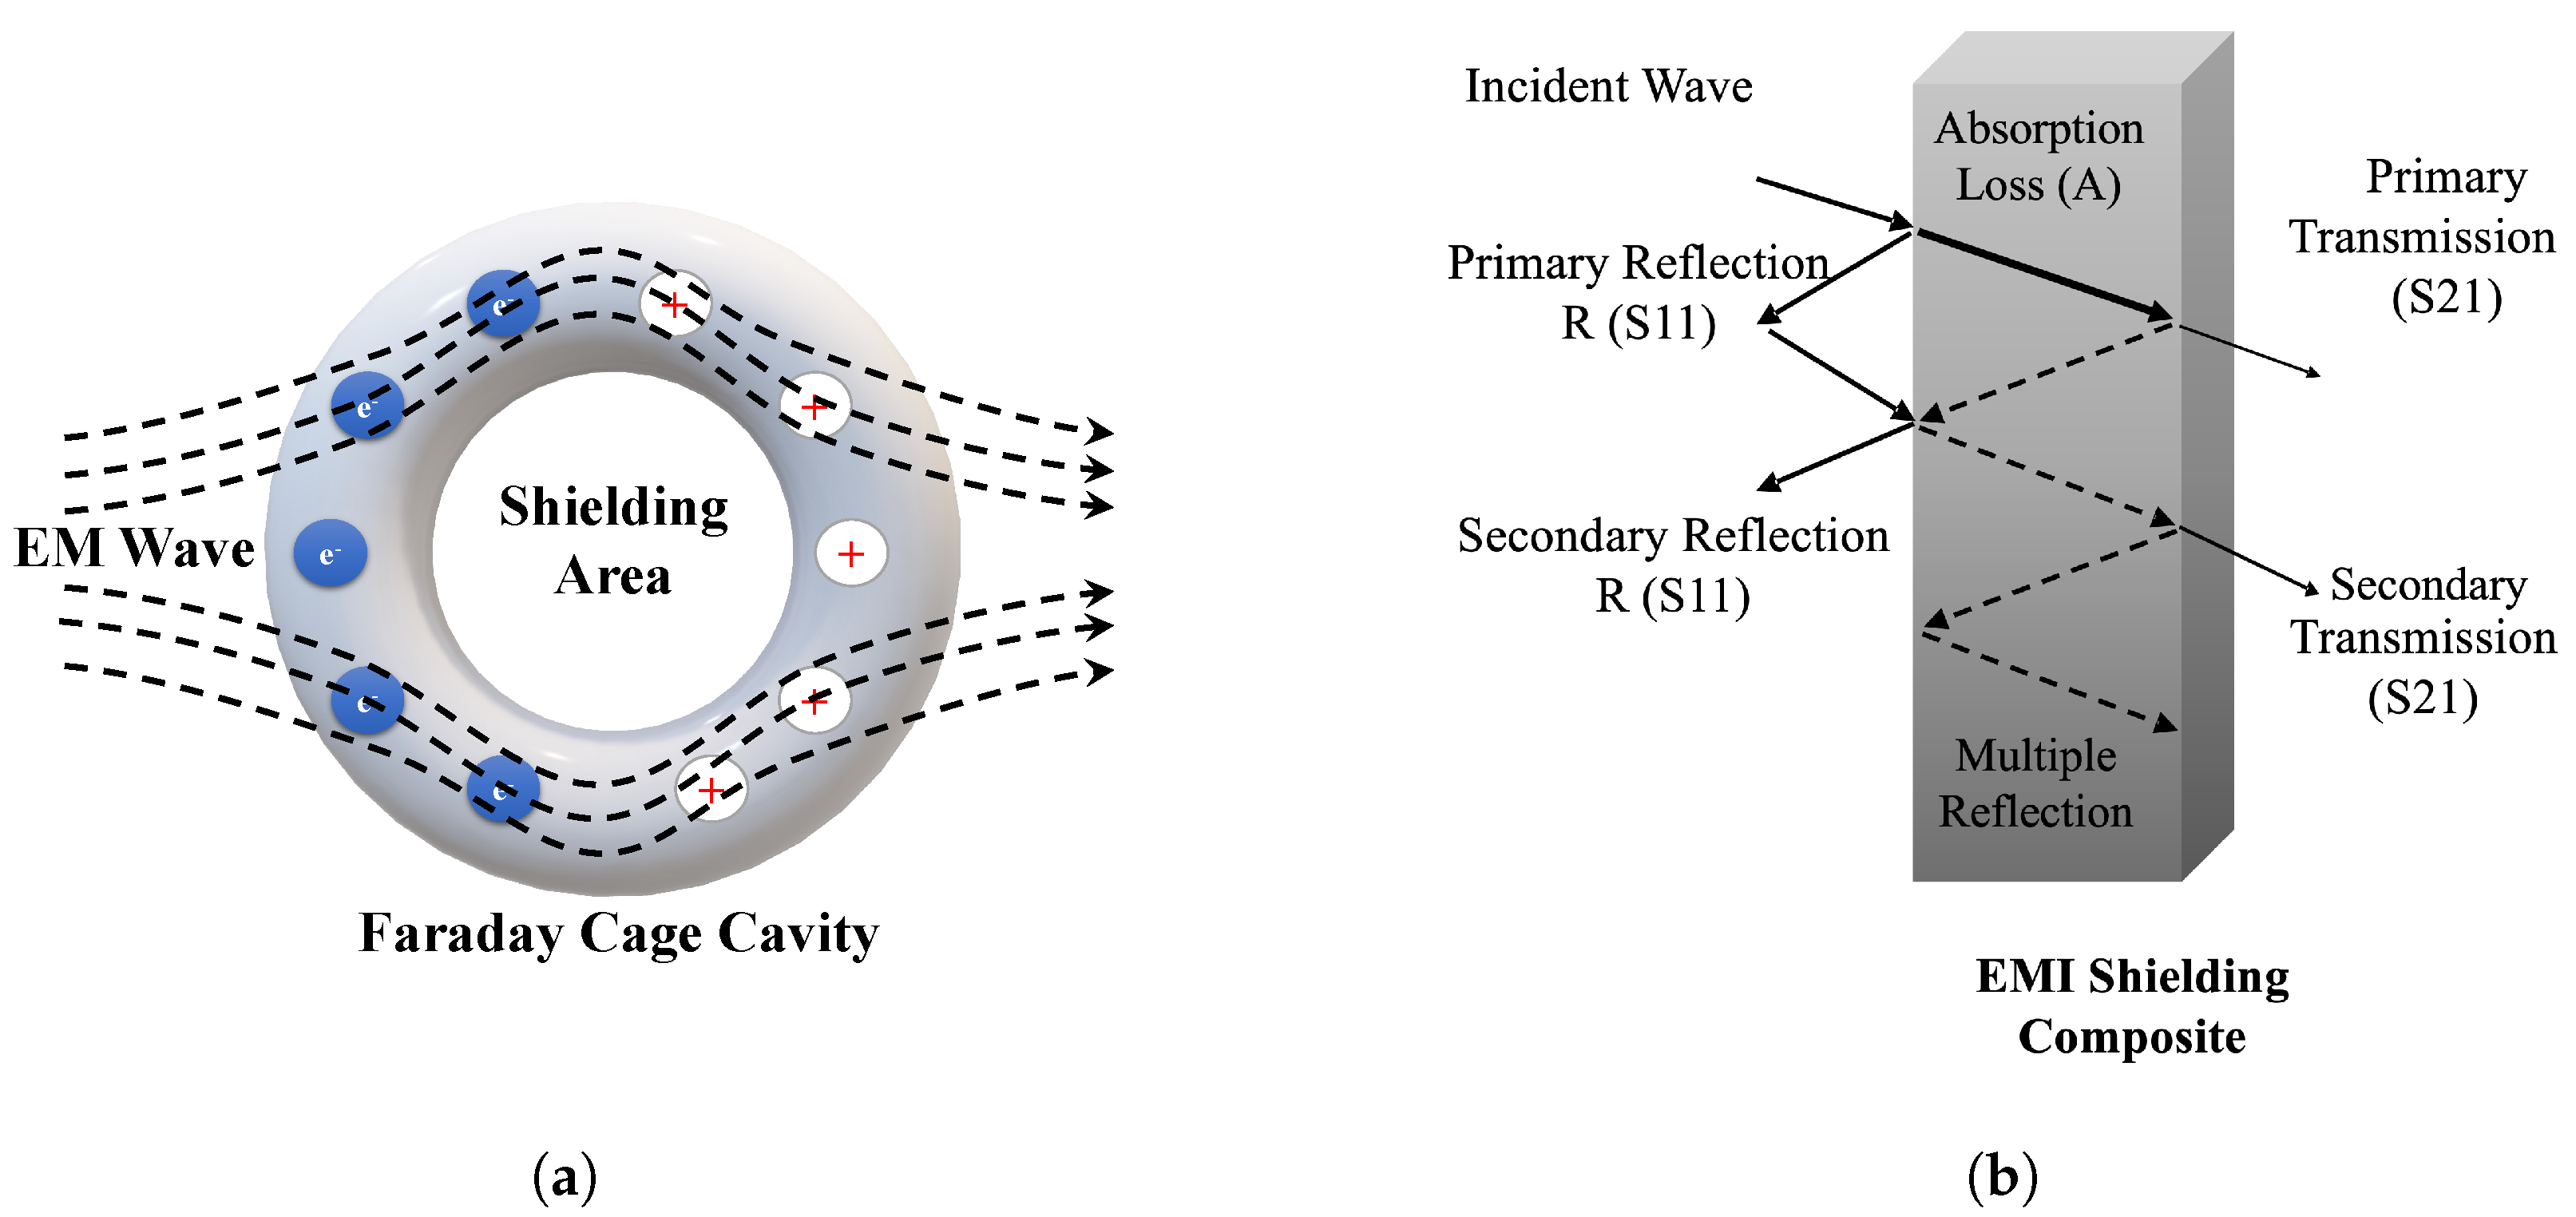
3.8.1. Theory of EMI Shielding
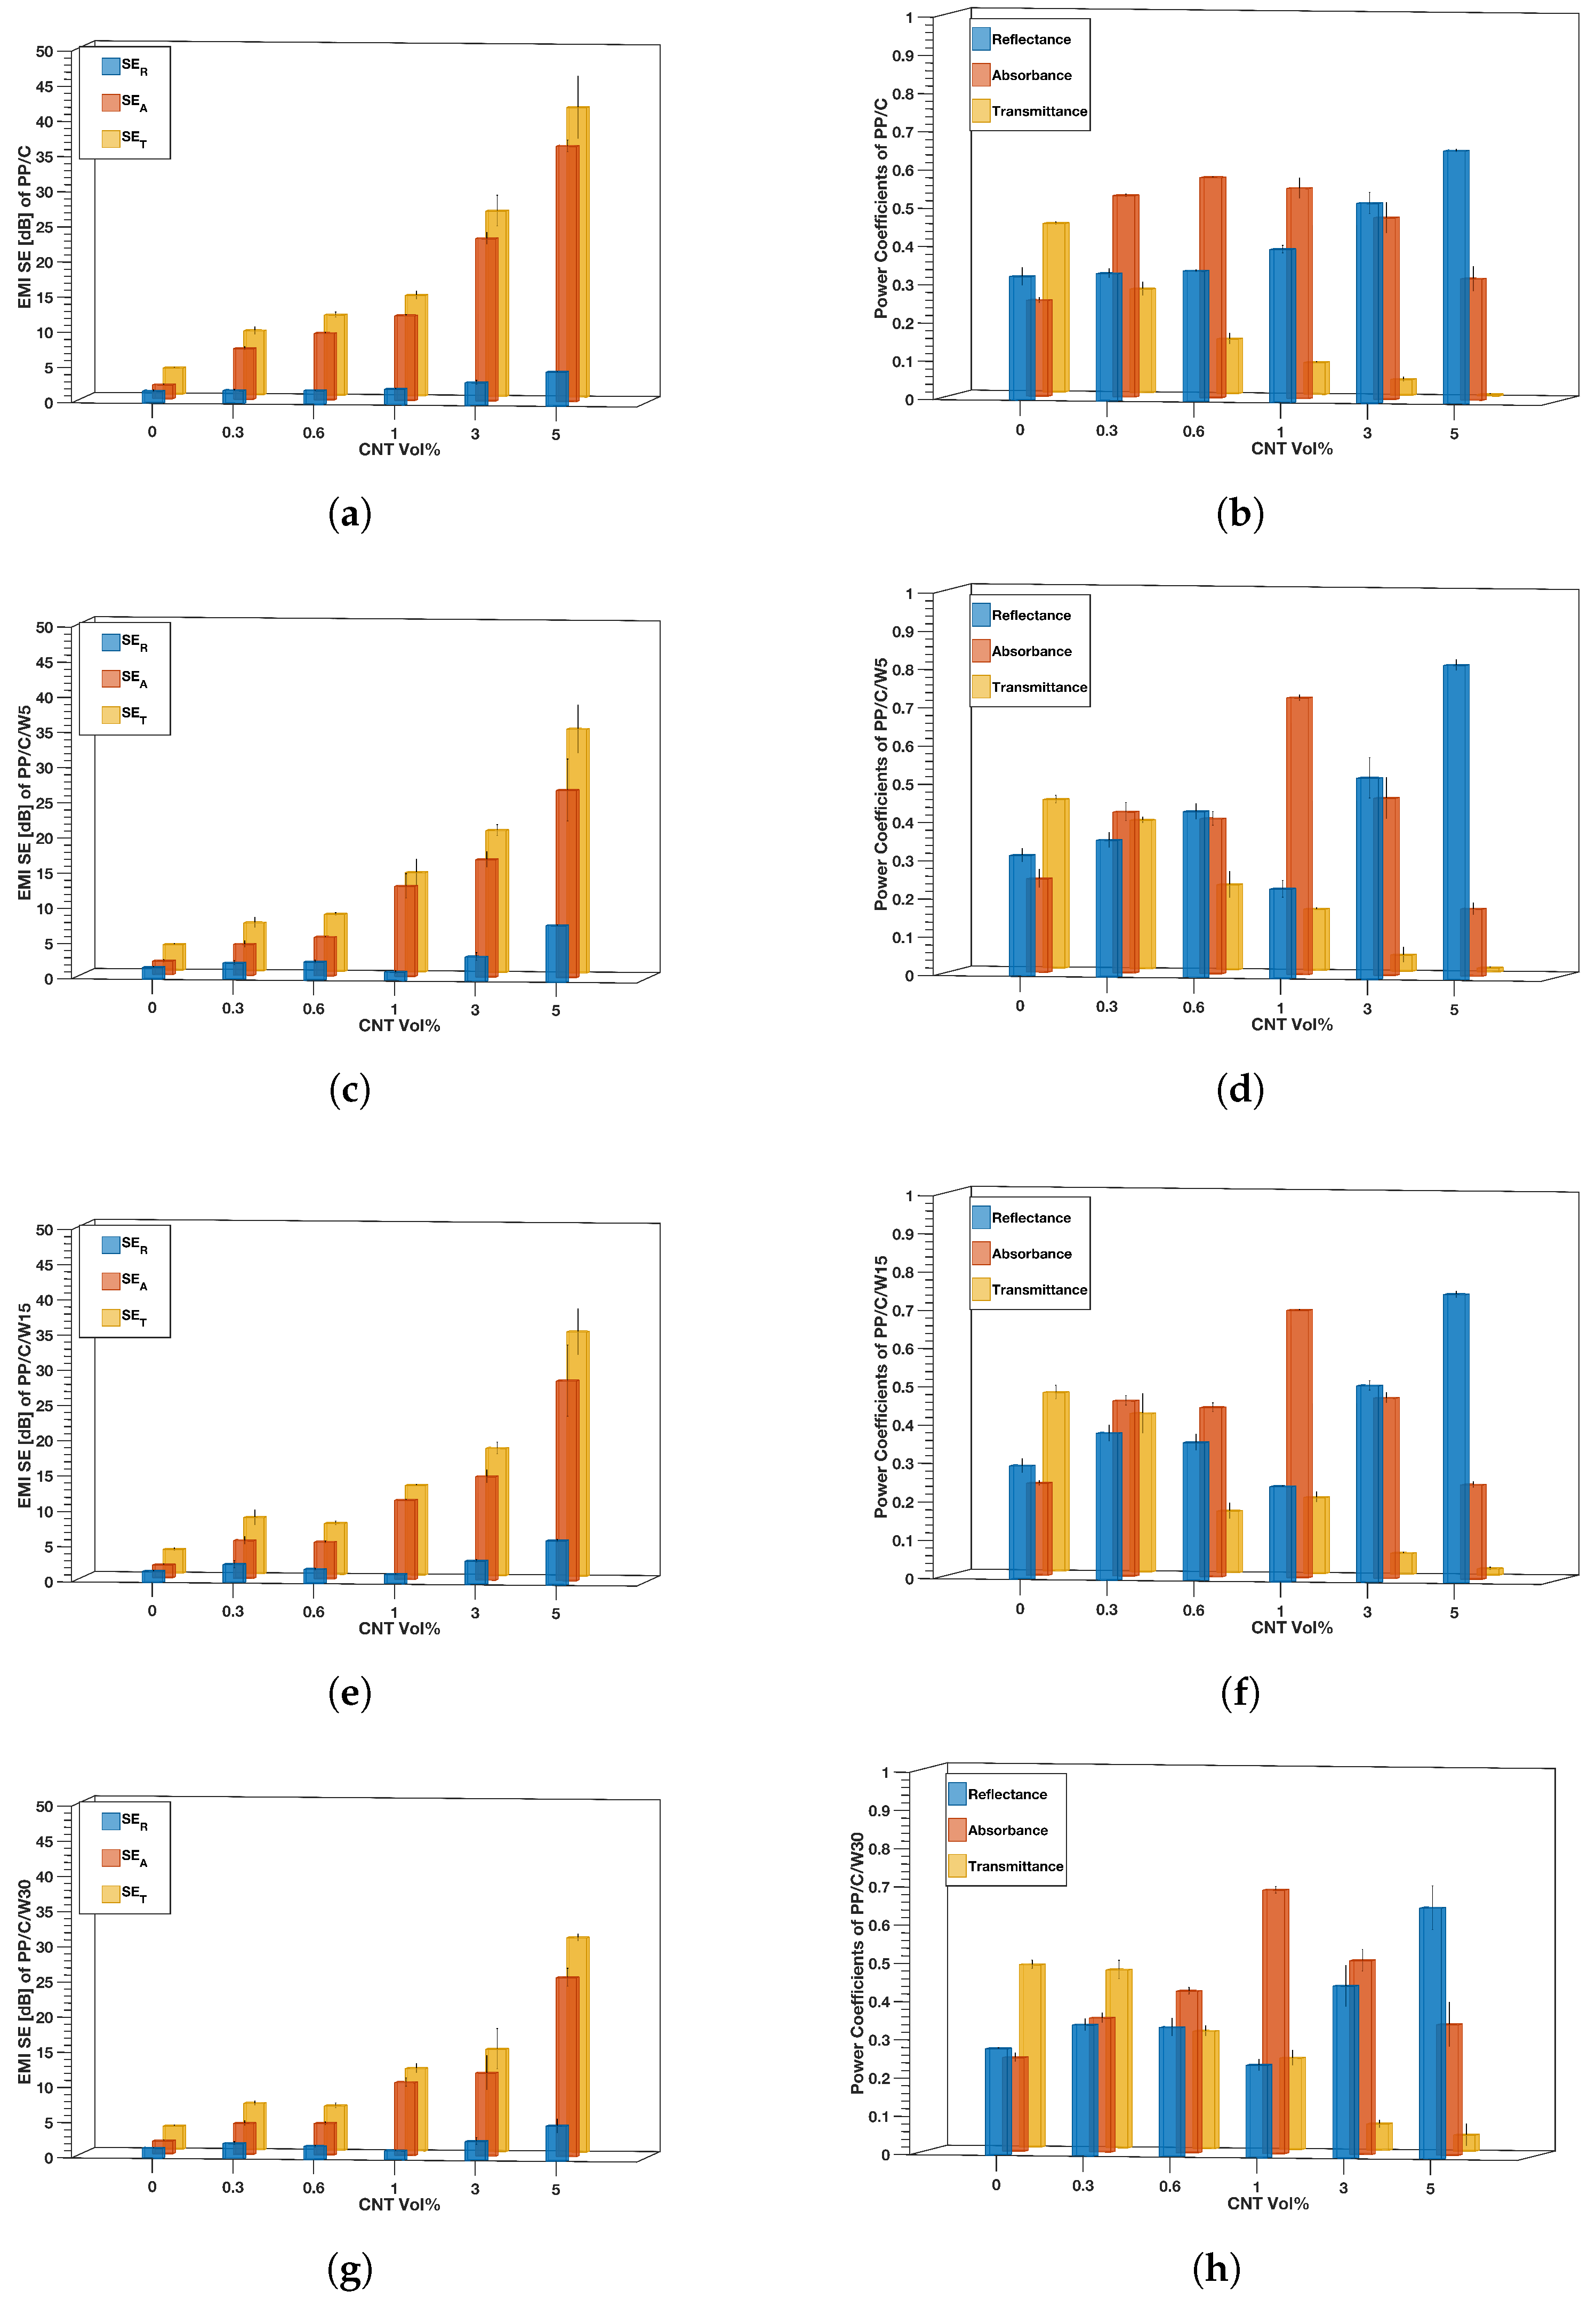
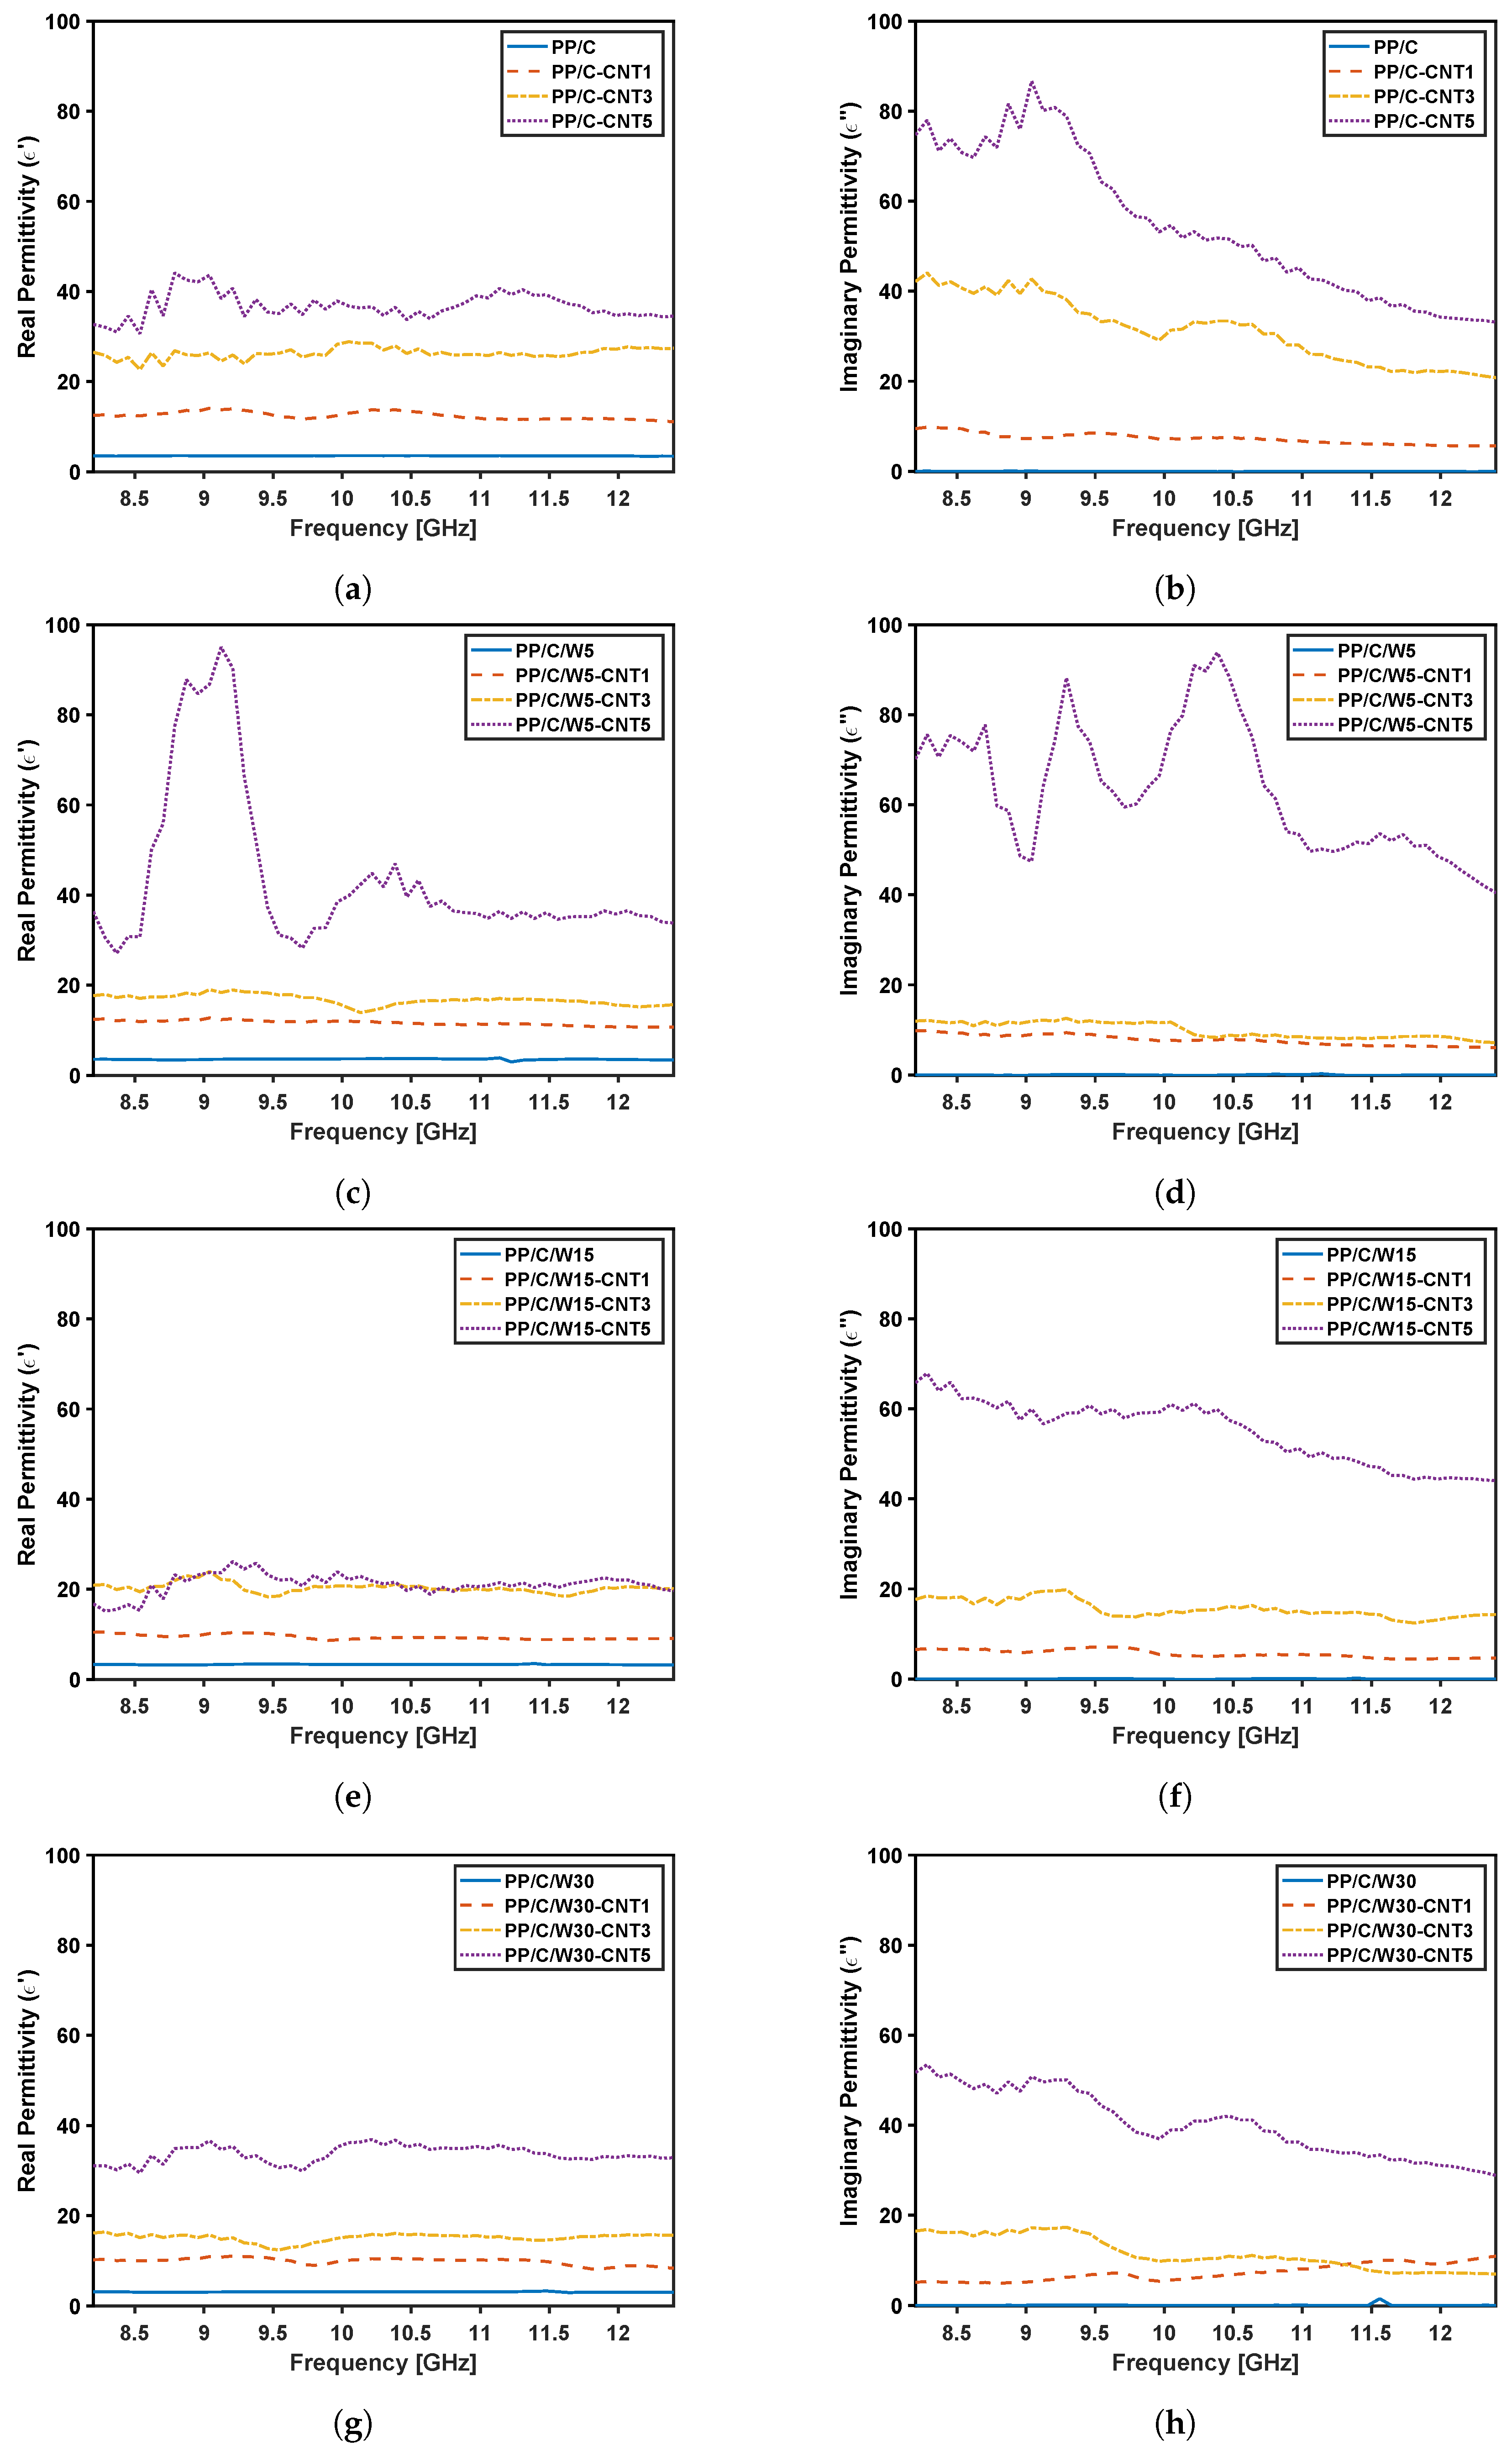
3.8.2. EMI Shielding Results of the Composites
4. Conclusions
Author Contributions
Funding
Institutional Review Board Statement
Data Availability Statement
Acknowledgments
Conflicts of Interest
References
- Xing, D.; Lu, L.; Xie, Y.; Tang, Y.; Teh, K. Highly flexible and ultra-thin carbon-fabric/Ag/waterborne polyurethane film for ultra-efficient EMI shielding. Mater. Des. 2020, 185, 108227. [Google Scholar] [CrossRef]
- Duan, H.; Zhu, H.; Gao, J.; Yan, D.; Dai, K.; Yang, Y.; Zhao, G.; Liu, Y.; Li, Z. Asymmetric conductive polymer composite foam for absorption dominated ultra-efficient electromagnetic interference shielding with extremely low reflection characteristics. J. Mater. Chem. A 2020, 8, 9146–9159. [Google Scholar] [CrossRef]
- Bhattacharjee, Y.; Bapari, S.; Bose, S. Mechanically robust, UV screener core–double-shell nanostructures provide enhanced shielding for EM radiations over wide angle of incidence. Nanoscale 2020, 12, 15775–15790. [Google Scholar] [CrossRef] [PubMed]
- Zhu, X.; Xu, J.; Qin, F.; Yan, Z.; Guo, A.; Kan, C. Highly efficient and stable transparent electromagnetic interference shielding films based on silver nanowires. Nanoscale 2020, 12, 14589–14597. [Google Scholar] [CrossRef] [PubMed]
- Thomassin, J.; Jérôme, C.; Pardoen, T.; Bailly, C.; Huynen, I.; Detrembleur, C. Polymer/carbon based composites as electromagnetic interference (EMI) shielding materials. Mater. Sci. Eng. R Rep. 2013, 74, 211–232. [Google Scholar] [CrossRef]
- Wang, M.; You, X.; Liao, C.; Ren, X.; Xiu, F.; Yang, J.; Dong, S. Ultrathin and flexible hybrid films decorated by copper nanoparticles with a sandwich-like structure for electromagnetic interference shielding. Mater. Chem. Front. 2022, 6, 2256–2265. [Google Scholar] [CrossRef]
- Lee, S.; Park, J.; Kim, M.C.; Kim, M.; Park, P.; Yoon, I.J.; Nah, J. Polyvinylidene fluoride core–shell nanofiber membranes with highly conductive shells for electromagnetic interference shielding. ACS Appl. Mater. Interfaces 2021, 13, 25428–25437. [Google Scholar] [CrossRef] [PubMed]
- Ha, J.H.; Hong, S.K.; Ryu, J.K.; Bae, J.; Park, S.H. Development of multi-functional graphene polymer composites having electromagnetic interference shielding and de-icing properties. Polymers 2019, 11, 2101. [Google Scholar] [CrossRef]
- Zhong, L.; Yu, R.; Hong, X. Review of carbon-based electromagnetic shielding materials: Film, composite, foam, textile. Text. Res. J. 2021, 91, 1167–1183. [Google Scholar] [CrossRef]
- Li, C.; Li, Y.; Zhao, Q.; Luo, Y.; Yang, G.; Hu, Y.; Jiang, J. Electromagnetic Interference Shielding of Graphene Aerogel with Layered Microstructure Fabricated via Mechanical Compression. ACS Appl. Mater. Interfaces 2020, 12, 30686–30694. [Google Scholar] [CrossRef]
- Fan, X.; Zhang, G.; Gao, Q.; Li, J.; Shang, Z.; Zhang, H.; Zhang, Y.; Shi, X.; Qin, J. Highly expansive, thermally insulating epoxy/Ag nanosheet composite foam for electromagnetic interference shielding. Chem. Eng. J. 2019, 372, 191–202. [Google Scholar] [CrossRef]
- Sarkar, B.; Li, X.; Quenneville, E.; Carignan, L.P.; Wu, K.; Cicoira, F. Lightweight and flexible conducting polymer sponges and hydrogels for electromagnetic interference shielding. J. Mater. Chem. C 2021, 9, 16558–16565. [Google Scholar] [CrossRef]
- Wanasinghe, D.; Aslani, F.; Ma, G.; Habibi, D. Review of Polymer Composites with Diverse Nanofillers for Electromagnetic Interference Shielding. Nanomaterials 2020, 10, 541. [Google Scholar] [CrossRef] [PubMed]
- Soares, B.G.; Barra, G.M.O.; Indrusiak, T. Conducting polymeric composites based on intrinsically conducting polymers as electromagnetic interference shielding/microwave absorbing materials—A review. J. Compos. Sci. 2021, 5, 173. [Google Scholar] [CrossRef]
- Kruželák, J.; Kvasničáková, A.; Hložeková, K.; Hudec, I. Progress in polymers and polymer composites used as efficient materials for EMI shielding. Nanoscale Adv. 2021, 3, 123–172. [Google Scholar] [CrossRef] [PubMed]
- Guo, W.; Li, K.; Fang, Z.; Feng, T.; Shi, T. A sustainable recycling process for end-of-life vehicle plastics: A case study on waste bumpers. Waste Manag. 2022, 154, 187–198. [Google Scholar] [CrossRef] [PubMed]
- Memon, M. Integrated solid waste management based on the 3R approach. J. Mater. Cycles Waste Manag. 2010, 12, 30–40. [Google Scholar] [CrossRef]
- Wyss, K.; Kleine, R.D.; Couvreur, R.; Kiziltas, A.; Mielewski, D.; Tour, J. Upcycling end-of-life vehicle waste plastic into flash graphene. Commun. Eng. 2022, 1, 3. [Google Scholar] [CrossRef]
- Asgari, M.; Abouelmagd, A.; Sundararaj, U. Silane functionalization of sodium montmorillonite nanoclay and its effect on rheological and mechanical properties of HDPE/clay nanocomposites. Appl. Clay Sci. 2017, 146, 439–448. [Google Scholar] [CrossRef]
- Wang, G.; Zhang, D.; Wan, G.; Li, B.; Zhao, G. Glass fiber reinforced PLA composite with enhanced mechanical properties, thermal behavior, and foaming ability. Polymer 2019, 181, 121803. [Google Scholar] [CrossRef]
- Thenepalli, T.; Jun, A.; Han, C.; Ramakrishna, C.; Ahn, J. A strategy of precipitated calcium carbonate (CaCO3) fillers for enhancing the mechanical properties of polypropylene polymers. Korean J. Chem. Eng. 2015, 32, 1009–1022. [Google Scholar] [CrossRef]
- Wang, M.; Lin, L.; Peng, Q.; Ou, W.; Li, H. Crystallization and mechanical properties of isotactic polypropylene/calcium carbonate nanocomposites with a stratified distribution of calcium carbonate. J. Appl. Polym. Sci. 2014, 131. [Google Scholar] [CrossRef]
- Gupta, A.; Choudhary, V. Electrical conductivity and shielding effectiveness of poly(trimethylene terephthalate)/multiwalled carbon nanotube composites. J. Mater. Sci. 2011, 46, 6416–6423. [Google Scholar] [CrossRef]
- Verma, P.; Saini, P.; Malik, R.; Choudhary, V. Excellent electromagnetic interference shielding and mechanical properties of high loading carbon-nanotubes/polymer composites designed using melt recirculation equipped twin-screw extruder. Carbon 2015, 89, 308–317. [Google Scholar] [CrossRef]
- Al-Saleh, M.; Sundararaj, U. Electromagnetic interference shielding mechanisms of CNT/polymer composites. Carbon 2009, 47, 1738–1746. [Google Scholar] [CrossRef]
- Shajari, S.; Arjmand, M.; Pawar, S.; Sundararaj, U.; Sudak, L. Synergistic effect of hybrid stainless steel fiber and carbon nanotube on mechanical properties and electromagnetic interference shielding of polypropylene nanocomposites. Compos. Part B Eng. 2019, 165, 662–670. [Google Scholar] [CrossRef]
- Xie, Y.; Ye, L.; Chen, W.; Liu, P.; Liu, Y. Electrically Conductive and All-Weather Materials from Waste Cross-Linked Polyethylene Cables for Electromagnetic Interference Shielding. Ind. Eng. Chem. Res. 2022, 61, 3610–3619. [Google Scholar] [CrossRef]
- Zhang, J.; Wang, Q.; Huang, B.; Xue, X.; Li, M.; Zhang, W.; Lu, C. Flexible and High-Performance Electromagnetic Shielding Materials from Waste Polyurethane Foams. Ind. Eng. Chem. Res. 2022, 61, 13083–13091. [Google Scholar] [CrossRef]
- Zhang, P.; Kraus, T. Anisotropic nanoparticles as templates for the crystalline structure of an injection-molded isotactic polypropylene/TiO2 nanocomposite. Polymer 2017, 130, 161–169. [Google Scholar] [CrossRef]
- Han, C.; Sahle-Demessie, E.; Zhao, A.; Richardson, T.; Wang, J. Environmental aging and degradation of multiwalled carbon nanotube reinforced polypropylene. Carbon 2018, 129, 137–151. [Google Scholar] [CrossRef]
- ASTM D638; Standard Test Method for Tensile Properties of Plastics. ASTM: West Conshohocken, PA, USA, 2022.
- ASTM D257; Standard Test Methods for DC Resistance or Conductance of Insulating Materials. ASTM: West Conshohocken, PA, USA, 2021.
- Arjmand, M.; Mahmoodi, M.; Gelves, G.; Park, S.; Sundararaj, U. Electrical and electromagnetic interference shielding properties of flow-induced oriented carbon nanotubes in polycarbonate. Carbon 2011, 49, 3430–3440. [Google Scholar] [CrossRef]
- Dai, Y.; Wang, B.; Wang, S.; Jiang, T.; Cheng, S. Study on the microstructure and miscibility of dynamically vulcanized EPDM/PP blend by positron annihilation. Radiat. Phys. Chem. 2003, 68, 493–496. [Google Scholar] [CrossRef]
- Ajitha, A.; Thomas, S. Chapter 1—Introduction: Polymer blends, thermodynamics, miscibility, phase separation, and compatibilization. In Compatibilization of Polymer Blends; Elsevier: Amsterdam, The Netherlands, 2020; pp. 1–29. [Google Scholar] [CrossRef]
- Al-Saleh, M. Electrically conductive carbon nanotube/polypropylene nanocomposite with improved mechanical properties. Mater. Des. 2015, 85, 76–81. [Google Scholar] [CrossRef]
- Wang, C.; Wang, Y.; Dang, Y.; Jiao, Q.; Li, H.; Wu, Q.; Zhao, Y. Synthesis of a novel titanium complex catalyst and its catalytic performance for olefin polymerization. Russ. J. Appl. Chem. 2015, 88, 1723–1727. [Google Scholar] [CrossRef]
- Sugatri, R.I.; Wirasadewa, Y.C.; Saputro, K.E.; Muslih, E.Y.; Ikono, R.; Nasir, M. Recycled carbon black from waste of tire industry: Thermal study. Microsyst. Technol. 2018, 24, 749–755. [Google Scholar] [CrossRef]
- Zappielo, C.D.; Nanicuacua, D.M.; dos Santos, W.N.; da Silva, D.L.; Dall’Antônia, L.H.; Oliveira, F.M.d.; Clausen, D.N.; Tarley, C.R. Solid phase extraction to on-line preconcentrate trace cadmium using chemically modified nano-carbon black with 3-mercaptopropyltrimethoxysilane. J. Braz. Chem. Soc. 2016, 27, 1715–1726. [Google Scholar] [CrossRef]
- Dos Santos, V.H.J.M.; Pontin, D.; Ponzi, G.G.D.; e Stepanha, A.S.d.G.; Martel, R.B.; Schütz, M.K.; Einloft, S.M.O.; Dalla Vecchia, F. Application of Fourier Transform infrared spectroscopy (FTIR) coupled with multivariate regression for calcium carbonate (CaCO3) quantification in cement. Constr. Build. Mater. 2021, 313, 125413. [Google Scholar] [CrossRef]
- Mokhtarifar, M.; Arab, H.; Maghrebi, M.; Baniadam, M. Amine-functionalization of carbon nanotubes assisted by electrochemical generation of chlorine. Appl. Phys. A 2018, 124, 1–9. [Google Scholar] [CrossRef]
- Yamaguchi, N.; Masuda, Y.; Yamada, Y.; Narusawa, H.; Han-Cheol, C.; Tamaki, Y.; Miyazaki, T. Synthesis of CaO-SiO2 Compounds Using Materials Extracted from Industrial Wastes. Open J. Inorg.-Non-Met. Mater. 2015, 5, 1–10. [Google Scholar] [CrossRef]
- Zhou, T.; Tsui, G.C.; Liang, J.; Zou, S.; Tang, C.Y.; Mišković-Stanković, V. Thermal properties and thermal stability of PP/MWCNT composites. Compos. Part B Eng. 2016, 90, 107–114. [Google Scholar] [CrossRef]
- Assouline, E.; Pohl, S.; Fulchiron, R.; Gerard, J.F.; Lustiger, A.; Wagner, H.; Marom, G. The kinetics of α and β transcrystallization in fibre-reinforced polypropylene. Polymer 2000, 41, 7843–7854. [Google Scholar] [CrossRef]
- Varga, J. β-modification of isotactic polypropylene: Preparation, structure, processing, properties, and application. J. Macromol. Sci. Part B 2002, 41, 1121–1171. [Google Scholar] [CrossRef]
- Arroyo, M.; Zitzumbo, R.; Avalos, F. Composites based on PP/EPDM blends and aramid short fibres. Morphology/behaviour relationship. Polymer 2000, 41, 6351–6359. [Google Scholar] [CrossRef]
- Shi, M.; Zhang, D.; Zhu, J.; Shi, Y.; Sun, J.; Ji, Y. Morphology, crystallization, and thermal and mechanical properties of dynamic vulcanization EPDM/PP] thermoplastic elastomer. J. Thermoplast. Compos. Mater. 2019, 32, 922–935. [Google Scholar] [CrossRef]
- Stelescu, D.; Airinei, A.; Homocianu, M.; Fifere, N.; Timpu, D.; Aflori, M. Structural characteristics of some high density polyethylene/EPDM blends. Polym. Test. 2013, 32, 187–196. [Google Scholar] [CrossRef]
- Tuo, X.; Ma, G.; Tan, Q.; Gong, Y.; Guo, J. A study on dispersions of CB and CNT in PP/EPDM composites and their mechanical reinforcement. Polym. Polym. Compos. 2020, 28, 35–44. [Google Scholar] [CrossRef]
- Lotz, B. α and β phases of isotactic polypropylene: A case of growth kinetics ‘phase reentrency’ in polymer crystallization. Polymer 1998, 39, 4561–4567. [Google Scholar] [CrossRef]
- Yetgin, S.H. Effect of multi walled carbon nanotube on mechanical, thermal and rheological properties of polypropylene. J. Mater. Res. Technol. 2019, 8, 4725–4735. [Google Scholar] [CrossRef]
- Kamkar, M.; Aliabadian, E.; Shayesteh Zeraati, A.; Sundararaj, U. Application of nonlinear rheology to assess the effect of secondary nanofiller on network structure of hybrid polymer nanocomposites. Phys. Fluids 2018, 30. [Google Scholar] [CrossRef]
- Teng, C.; Ma, C.; Huang, Y.; Yuen, S.; Weng, C.; Chen, C.; Su, S. Effect of MWCNT content on rheological and dynamic mechanical properties of multiwalled carbon nanotube/polypropylene composites. Compos. Part A Appl. Sci. Manuf. 2008, 39, 1869–1875. [Google Scholar] [CrossRef]
- Ismail, H. Thermoplastic elastomers based on polypropylene/natural rubber and polypropylene/recycle rubber blends. Polym. Test. 2002, 21, 389–395. [Google Scholar] [CrossRef]
- Jang, B.; Uhlmann, D.; Sande, J.V. Rubber-toughening in polypropylene. J. Appl. Polym. Sci. 1985, 30, 2485–2504. [Google Scholar] [CrossRef]
- Bauhofer, W.; Kovacs, J. A review and analysis of electrical percolation in carbon nanotube polymer composites. Compos. Sci. Technol. 2009, 69, 1486–1498. [Google Scholar] [CrossRef]
- Ma, L.; Bao, R.; Dou, R.; Zheng, S.; Liu, Z.; Zhang, R.; Yang, M.; Yang, W. Conductive thermoplastic vulcanizates (TPVs) based on polypropylene (PP)/ethylene-propylene-diene rubber (EPDM) blend: From strain sensor to highly stretchable conductor. Compos. Sci. Technol. 2016, 128, 176–184. [Google Scholar] [CrossRef]
- Kargar, F.; Barani, Z.; Salgado, R.; Debnath, B.; Lewis, J.; Aytan, E.; Lake, R.; Balandin, A. Thermal Percolation Threshold and Thermal Properties of Composites with High Loading of Graphene and Boron Nitride Fillers. ACS Appl. Mater. Interfaces 2018, 10, 37555–37565. [Google Scholar] [CrossRef] [PubMed]
- Niu, H.; Ren, Y.; Guo, H.; Małycha, K.; Orzechowski, K.; Bai, S. Recent progress on thermally conductive and electrical insulating rubber composites: Design, processing and applications. Compos. Commun. 2020, 22, 100430. [Google Scholar] [CrossRef]
- Stan, F.; Sandu, I.; Turcanu, A.C.; Stanciu, N.; Fetecau, C. The Influence of Carbon Nanotubes and Reprocessing on the Morphology and Properties of High-Density Polyethylene/Carbon Nanotube Composites. J. Manuf. Sci. Eng. 2021, 144, 041011. [Google Scholar] [CrossRef]
- Sandu, I.; Stan, F.; Fetecau, C. Mechanical Recycling of Ethylene-Vinyl Acetate/Carbon Nanotube Nanocomposites: Processing, Thermal, Rheological, Mechanical and Electrical Behavior. Polymers 2023, 15, 583. [Google Scholar] [CrossRef]
- Shahapurkar, K.; Gelaw, M.; Tirth, V.; Soudagar, M.E.M.; Shahapurkar, P.; Mujtaba, M.; MC, K.; Ahmed, G.M.S. Comprehensive review on polymer composites as electromagnetic interference shielding materials. Polym. Polym. Compos. 2022, 30, 09673911221102127. [Google Scholar] [CrossRef]
- Liang, C.; Gu, Z.; Zhang, Y.; Ma, Z.; Qiu, H.; Gu, J. Structural Design Strategies of Polymer Matrix Composites for Electromagnetic Interference Shielding: A Review. Nano-Micro Lett. 2021, 13, 181. [Google Scholar] [CrossRef]
- Thostenson, E.; Chou, T. Microwave processing: Fundamentals and applications. Compos. Part A Appl. Sci. Manuf. 1999, 30, 1055–1071. [Google Scholar] [CrossRef]
- Clark, D.; Folz, D.; West, J. Processing materials with microwave energy. Mater. Sci. Eng. A 2000, 287, 153–158. [Google Scholar] [CrossRef]
- Das, S.; Mukhopadhyay, A.; Datta, S.; Basu, D. Prospects of microwave processing: An overview. Bull. Mater. Sci. 2008, 31, 943–956. [Google Scholar] [CrossRef]
- Han, M.; Gogotsi, Y. Perspectives for electromagnetic radiation protection with MXenes. Carbon 2023, 204, 17–25. [Google Scholar] [CrossRef]
- Caloz, C.; Itoh, T. Electromagnetic Metamaterials: Transmission Line Theory and Microwave Applications; Wiley: Hoboken, NJ, USA, 2005. [Google Scholar]
- Kumar, P. Ultrathin 2D Nanomaterials for Electromagnetic Interference Shielding. Adv. Mater. Interfaces 2019, 6, 1901454. [Google Scholar] [CrossRef]
- Bush, G. Measurement techniques for permeability, permittivity and EMI shielding: A review. In Proceedings of the IEEE Symposium on Electromagnetic Compatibility, Chicago, IL, USA, 22–26 August 1994; pp. 333–339. [Google Scholar] [CrossRef]
- Thomson, W. Reprint of Papers on Electrostatics and Magnetism; Cambridge University Press: Cambridge, UK, 2011. [Google Scholar] [CrossRef]
- Landau, L.; Bell, J.; Kearsley, M.; Pitaevskii, L.; Lifshitz, E.; Sykes, J. Electrodynamics of Continuous Media, 2nd ed.; Pergamon Press: Oxford, UK, 1984. [Google Scholar]
- Harrington, R. Time-Harmonic Electromagnetic Fields; Wiley-IEEE Press: Hoboken, NJ, USA, 2001. [Google Scholar]
- Ellingson, S. Electromagnetics, Volume 1; VT Publishing: Blacksburg, VA, USA, 2018. [Google Scholar] [CrossRef]
- Das, S.; Sharma, S.; Yokozeki, T.; Dhakate, S. Conductive layer-based multifunctional structural composites for electromagnetic interference shielding. Compos. Struct. 2021, 261, 113293. [Google Scholar] [CrossRef]
- Erfanian, E.; Moaref, R.; Ajdary, R.; Tam, K.C.; Rojas, O.J.; Kamkar, M.; Sundararaj, U. Electrochemically synthesized graphene/TEMPO-oxidized cellulose nanofibrils hydrogels: Highly conductive green inks for 3D printing of robust structured EMI shielding aerogels. Carbon 2023, 210, 118037. [Google Scholar] [CrossRef]
- Ghaffarkhah, A.; Kamkar, M.; Dijvejin, Z.A.; Riazi, H.; Ghaderi, S.; Golovin, K.; Soroush, M.; Arjmand, M. High-resolution extrusion printing of Ti3C2-based inks for wearable human motion monitoring and electromagnetic interference shielding. Carbon 2022, 191, 277–289. [Google Scholar] [CrossRef]
- Singh, A.; Shishkin, A.; Koppel, T.; Gupta, N. A review of porous lightweight composite materials for electromagnetic interference shielding. Compos. Part B Eng. 2018, 149, 188–197. [Google Scholar] [CrossRef]


| Materials | Density [g· cm] | Melt Flow Index [g/10 min, 230C/2.16 kg] | Average Diameter [m] | Average Length [m] | Specific Surface Area [m] |
|---|---|---|---|---|---|
| Polypropylene | N/A | N/A | N/A | ||
| MWCNT | N/A | 250–300 | |||
| Limestone (CaCO) | N/A | 0–45 | N/A | ||
| ELV waste | 1.12 | N/A | N/A | N/A | N/A |
| Sample Name | Polypropylene (wt%) | CaCO (wt%) | Waste (wt%) |
|---|---|---|---|
| PP/C | 40 | 60 | 0 |
| PP/C/W5 | 38 | 57 | 5 |
| PP/C/W15 | 34 | 51 | 15 |
| PP/C/W30 | 28 | 42 | 30 |
| W | 0 | 0 | 100 |
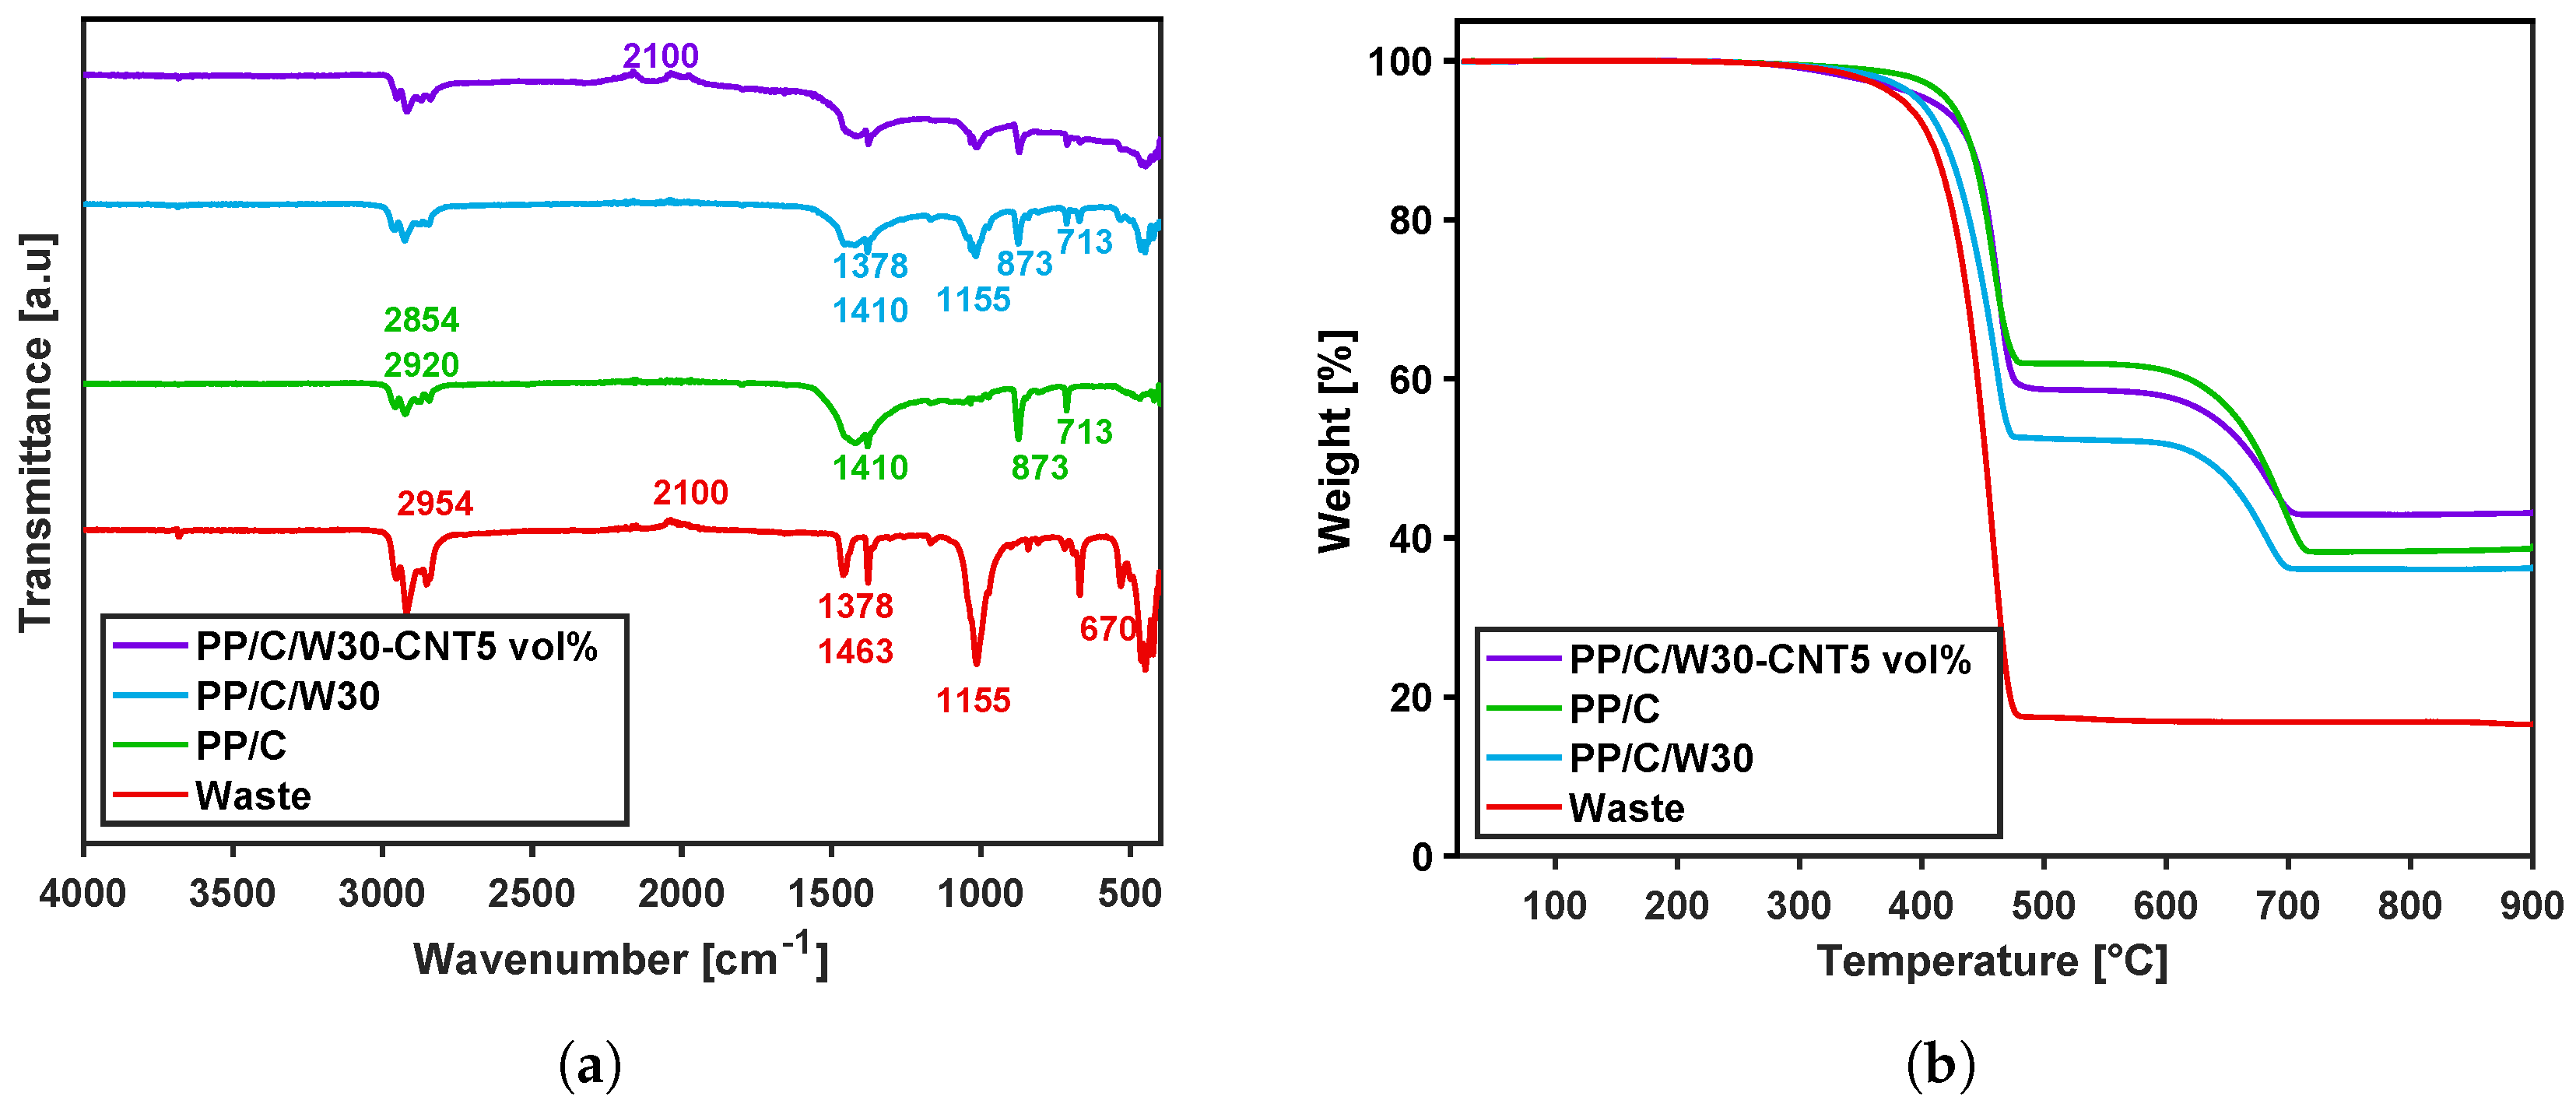
| Sample Name | First Mass Loss | Temperature Range | Second Mass Loss | Temperature Range | Remaining Mass |
|---|---|---|---|---|---|
| PP/C | 40 | 323–480 | 22 | 570–720 | 38 |
| W | 84 | 220–480 | N/A | N/A | 16 |
| PP/C/W30 | 49 | 292–480 | 15 | 580–700 | 36 |
| PP/C/W30-CNT5 | 42 | 240–450 | 15 | 550–720 | 43 |
| Sample Name | ||||
|---|---|---|---|---|
| PP/C | ||||
| W | ||||
| PP/C/W5 | ||||
| PP/C/W15 | ||||
| PP/C/W30 | ||||
| PP/C/W30-CNT1 | ||||
| PP/C/W30-CNT5 |
Disclaimer/Publisher’s Note: The statements, opinions and data contained in all publications are solely those of the individual author(s) and contributor(s) and not of MDPI and/or the editor(s). MDPI and/or the editor(s) disclaim responsibility for any injury to people or property resulting from any ideas, methods, instructions or products referred to in the content. |
© 2023 by the authors. Licensee MDPI, Basel, Switzerland. This article is an open access article distributed under the terms and conditions of the Creative Commons Attribution (CC BY) license (https://creativecommons.org/licenses/by/4.0/).
Share and Cite
Moaref, R.; Shajari, S.; Sundararaj, U. From Waste to Value Added Products: Manufacturing High Electromagnetic Interference Shielding Composite from End-of-Life Vehicle (ELV) Waste. Polymers 2024, 16, 120. https://doi.org/10.3390/polym16010120
Moaref R, Shajari S, Sundararaj U. From Waste to Value Added Products: Manufacturing High Electromagnetic Interference Shielding Composite from End-of-Life Vehicle (ELV) Waste. Polymers. 2024; 16(1):120. https://doi.org/10.3390/polym16010120
Chicago/Turabian StyleMoaref, Roxana, Shaghayegh Shajari, and Uttandaraman Sundararaj. 2024. "From Waste to Value Added Products: Manufacturing High Electromagnetic Interference Shielding Composite from End-of-Life Vehicle (ELV) Waste" Polymers 16, no. 1: 120. https://doi.org/10.3390/polym16010120
APA StyleMoaref, R., Shajari, S., & Sundararaj, U. (2024). From Waste to Value Added Products: Manufacturing High Electromagnetic Interference Shielding Composite from End-of-Life Vehicle (ELV) Waste. Polymers, 16(1), 120. https://doi.org/10.3390/polym16010120