
Study on Adsorption Characteristics and Water Retention Properties of Attapulgite–Sodium Polyacrylate and Polyacrylamide to Trace Metal Cadmium Ion

 and
and
Abstract
1. Introduction
2. Material and Methods
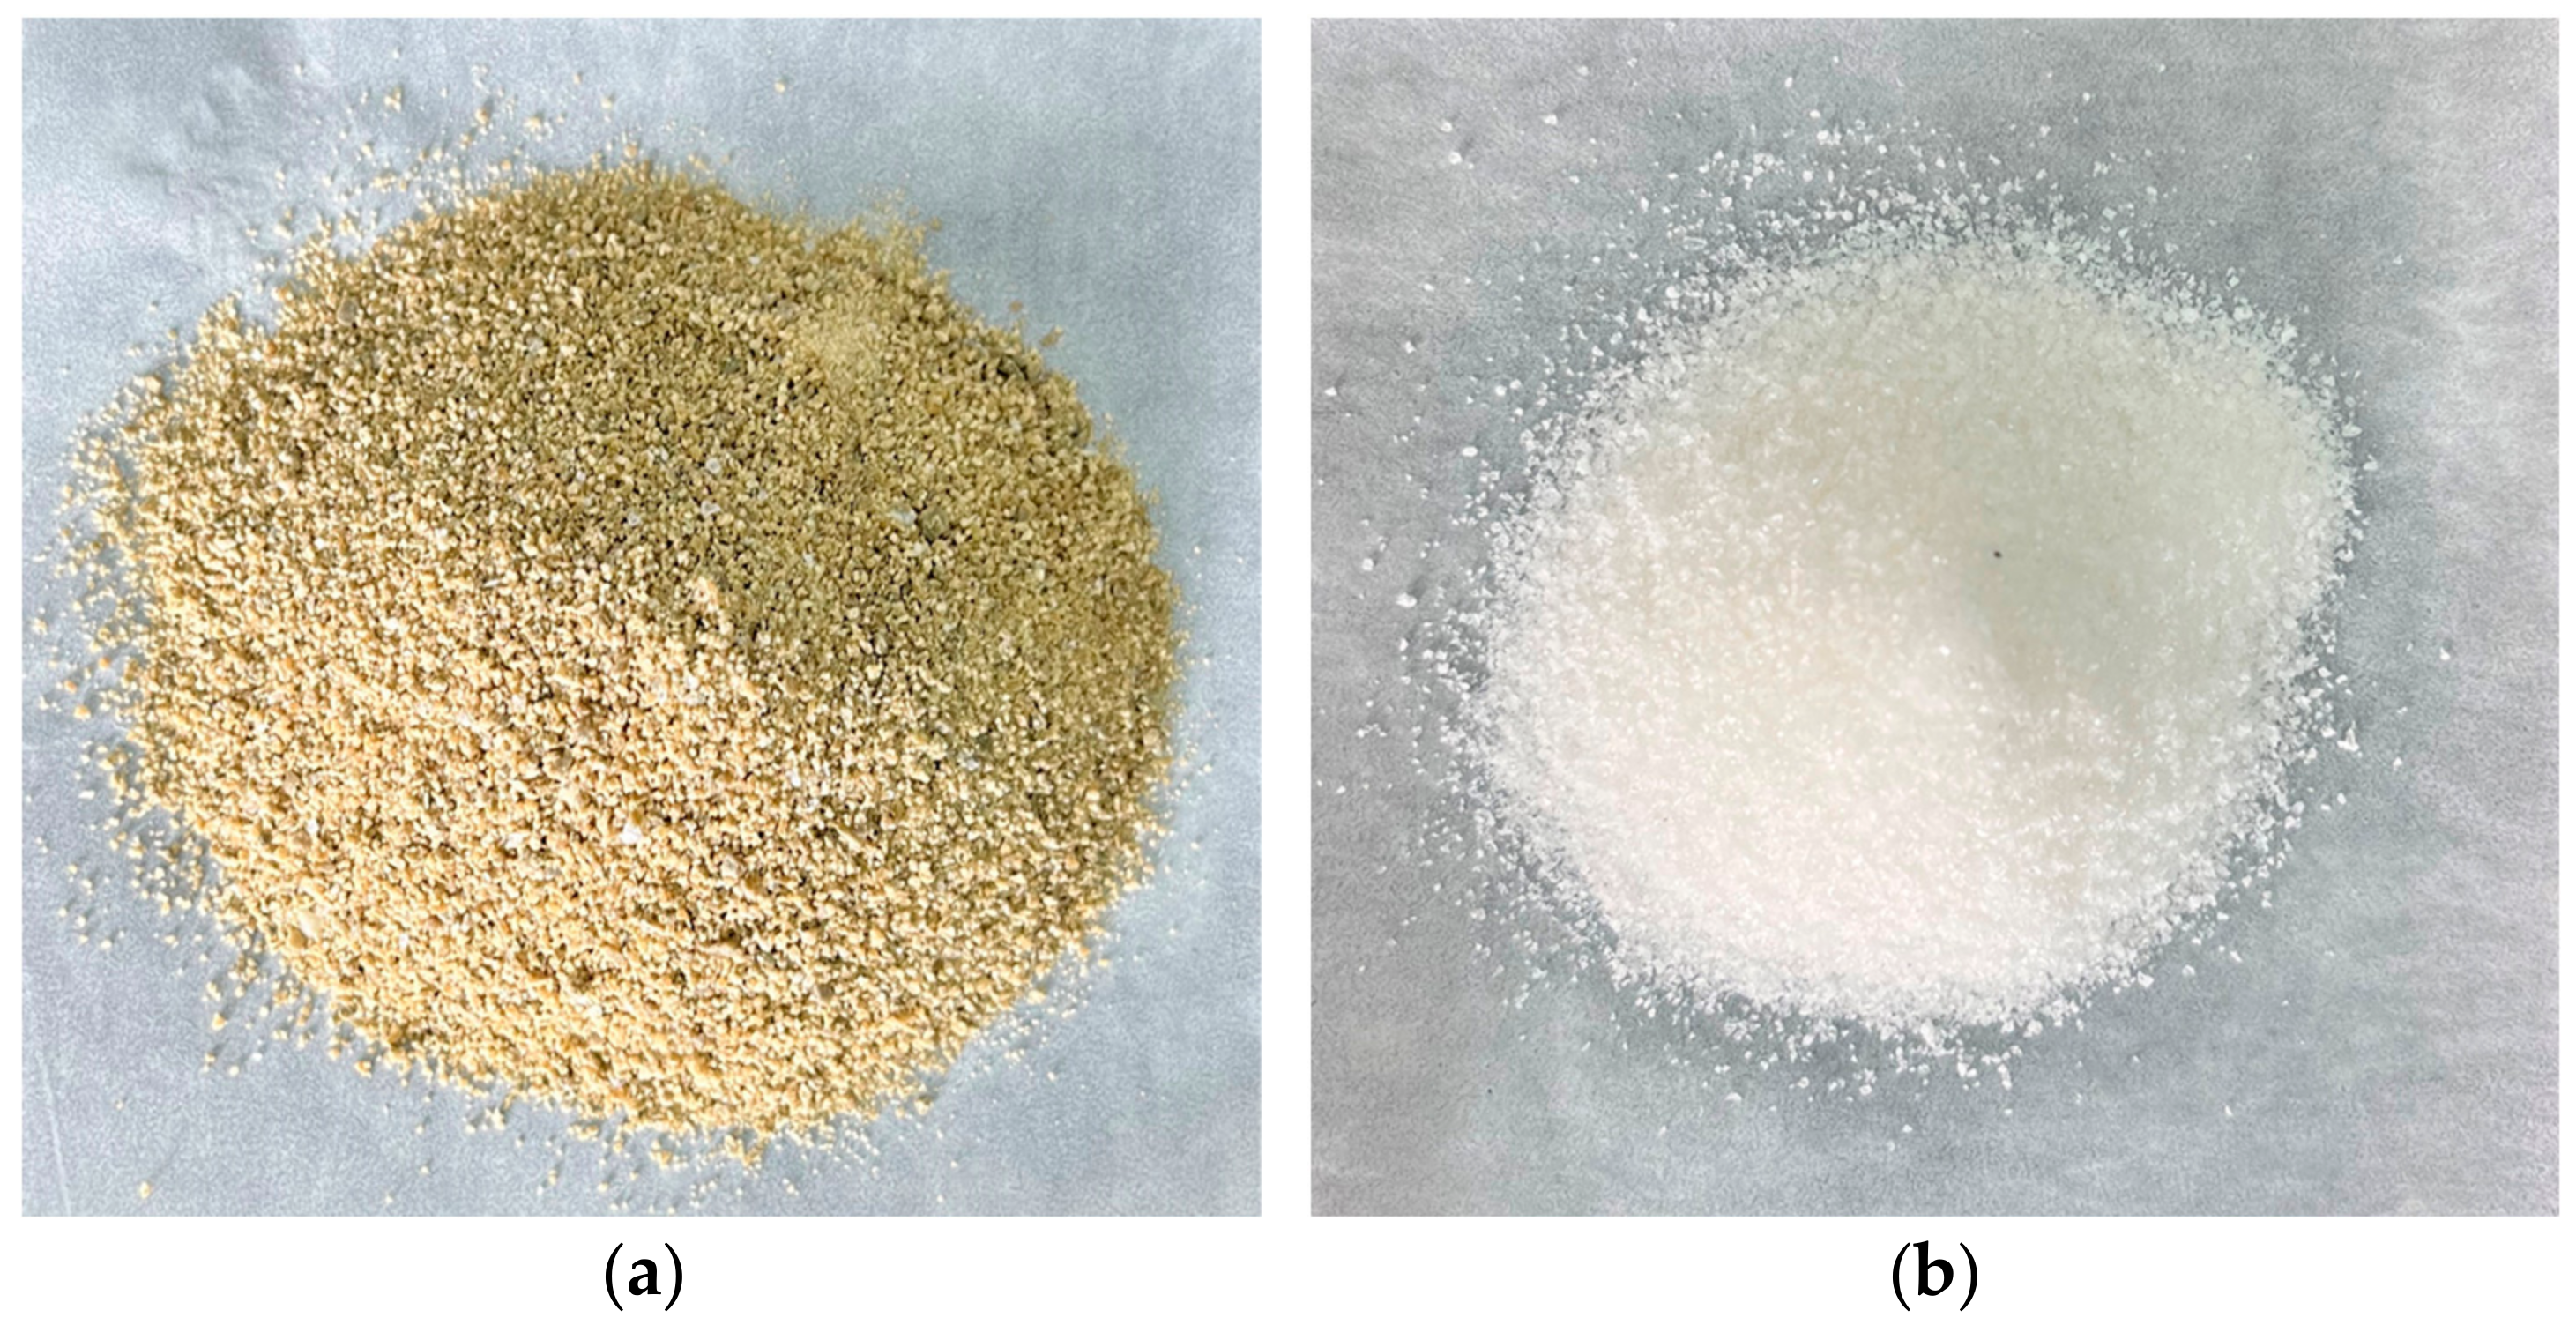
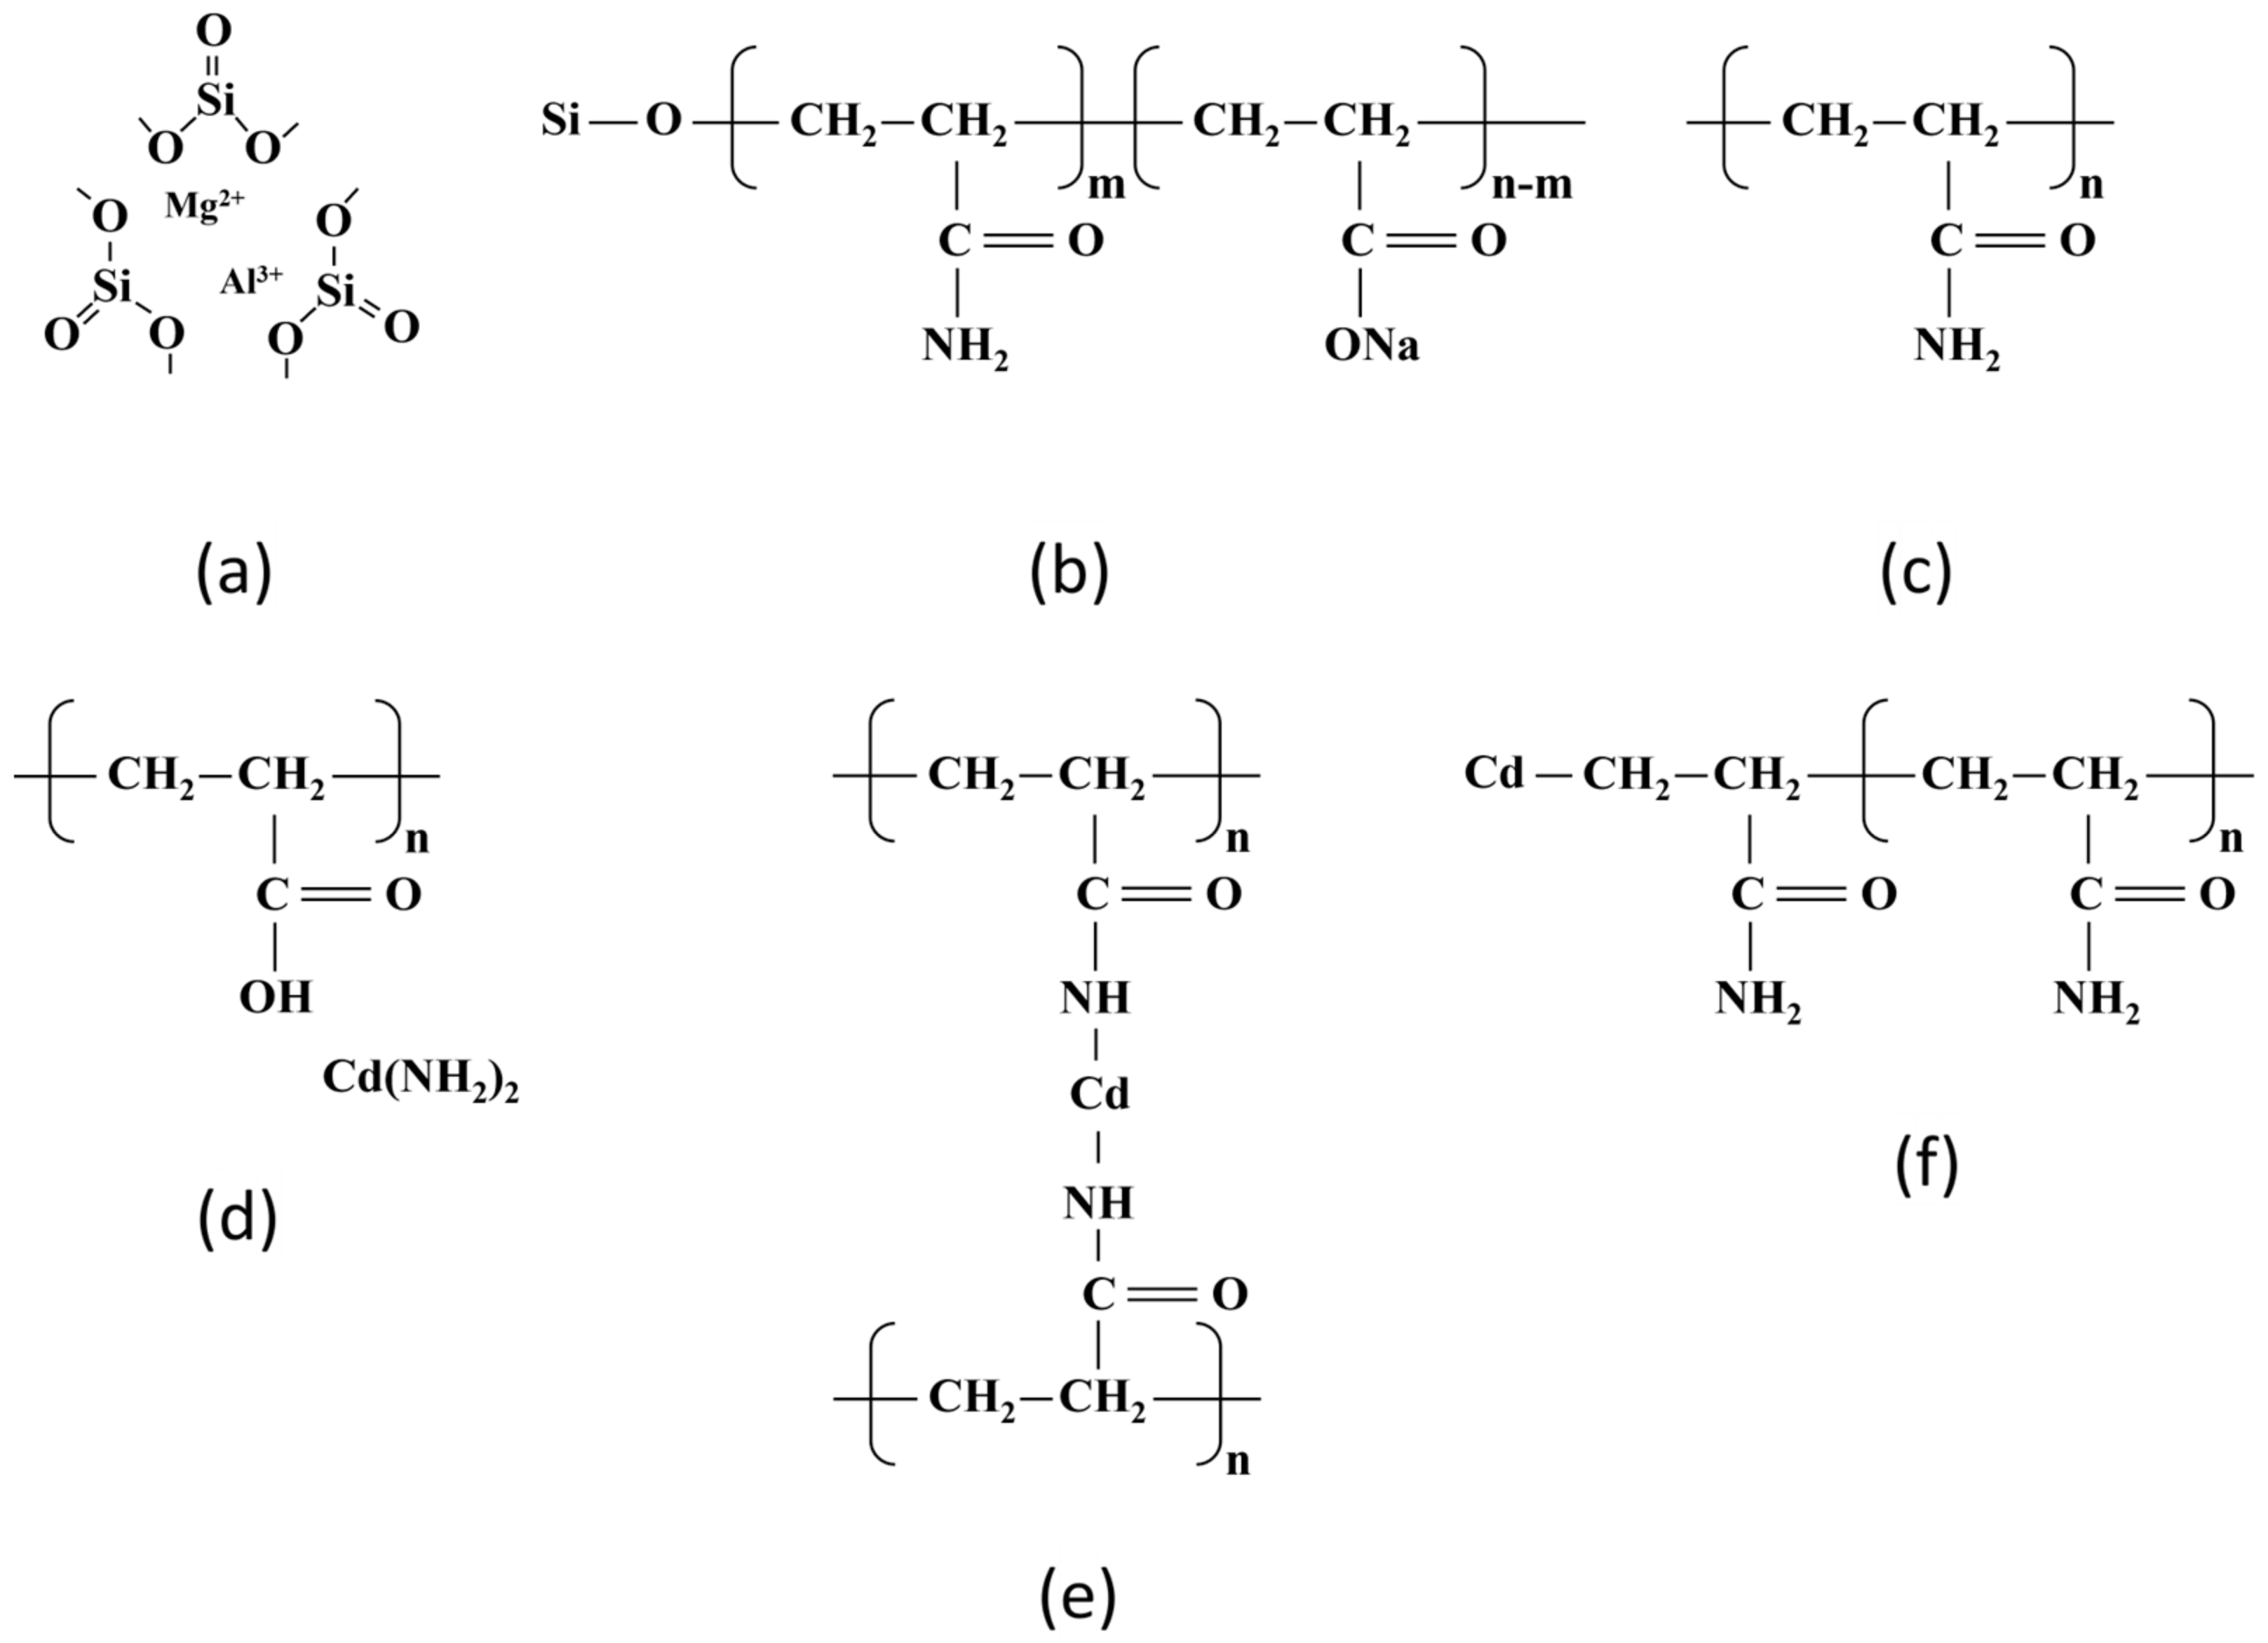
2.1. Preparation of Superabsorbent Polymers
2.2. Batch Experiments
2.2.1. Dosage Experiment
2.2.2. Cd(II) Concentration Experiment
2.2.3. Adsorption pH Experiment
2.2.4. Temperature Experiment
2.2.5. Desorption Experiment
2.2.6. Adsorption Isotherms Experiment
2.2.7. Kinetic Adsorption Experiment
2.2.8. Solid Surface Characterization Technique
2.2.9. Water Adsorption Experiment
3. Results and Discussion
3.1. Effect of Different Factors on Cd(II) Adsorption Characteristic of OSAP and JSAP
3.1.1. Effect of Different Dosages on Cd(II) Adsorption
3.1.2. Effect of Cd(II) Concentration on Adsorption
3.1.3. Effect of pH on Cd(II) Adsorption
3.1.4. Effect of Temperature on Cd(II) Adsorption
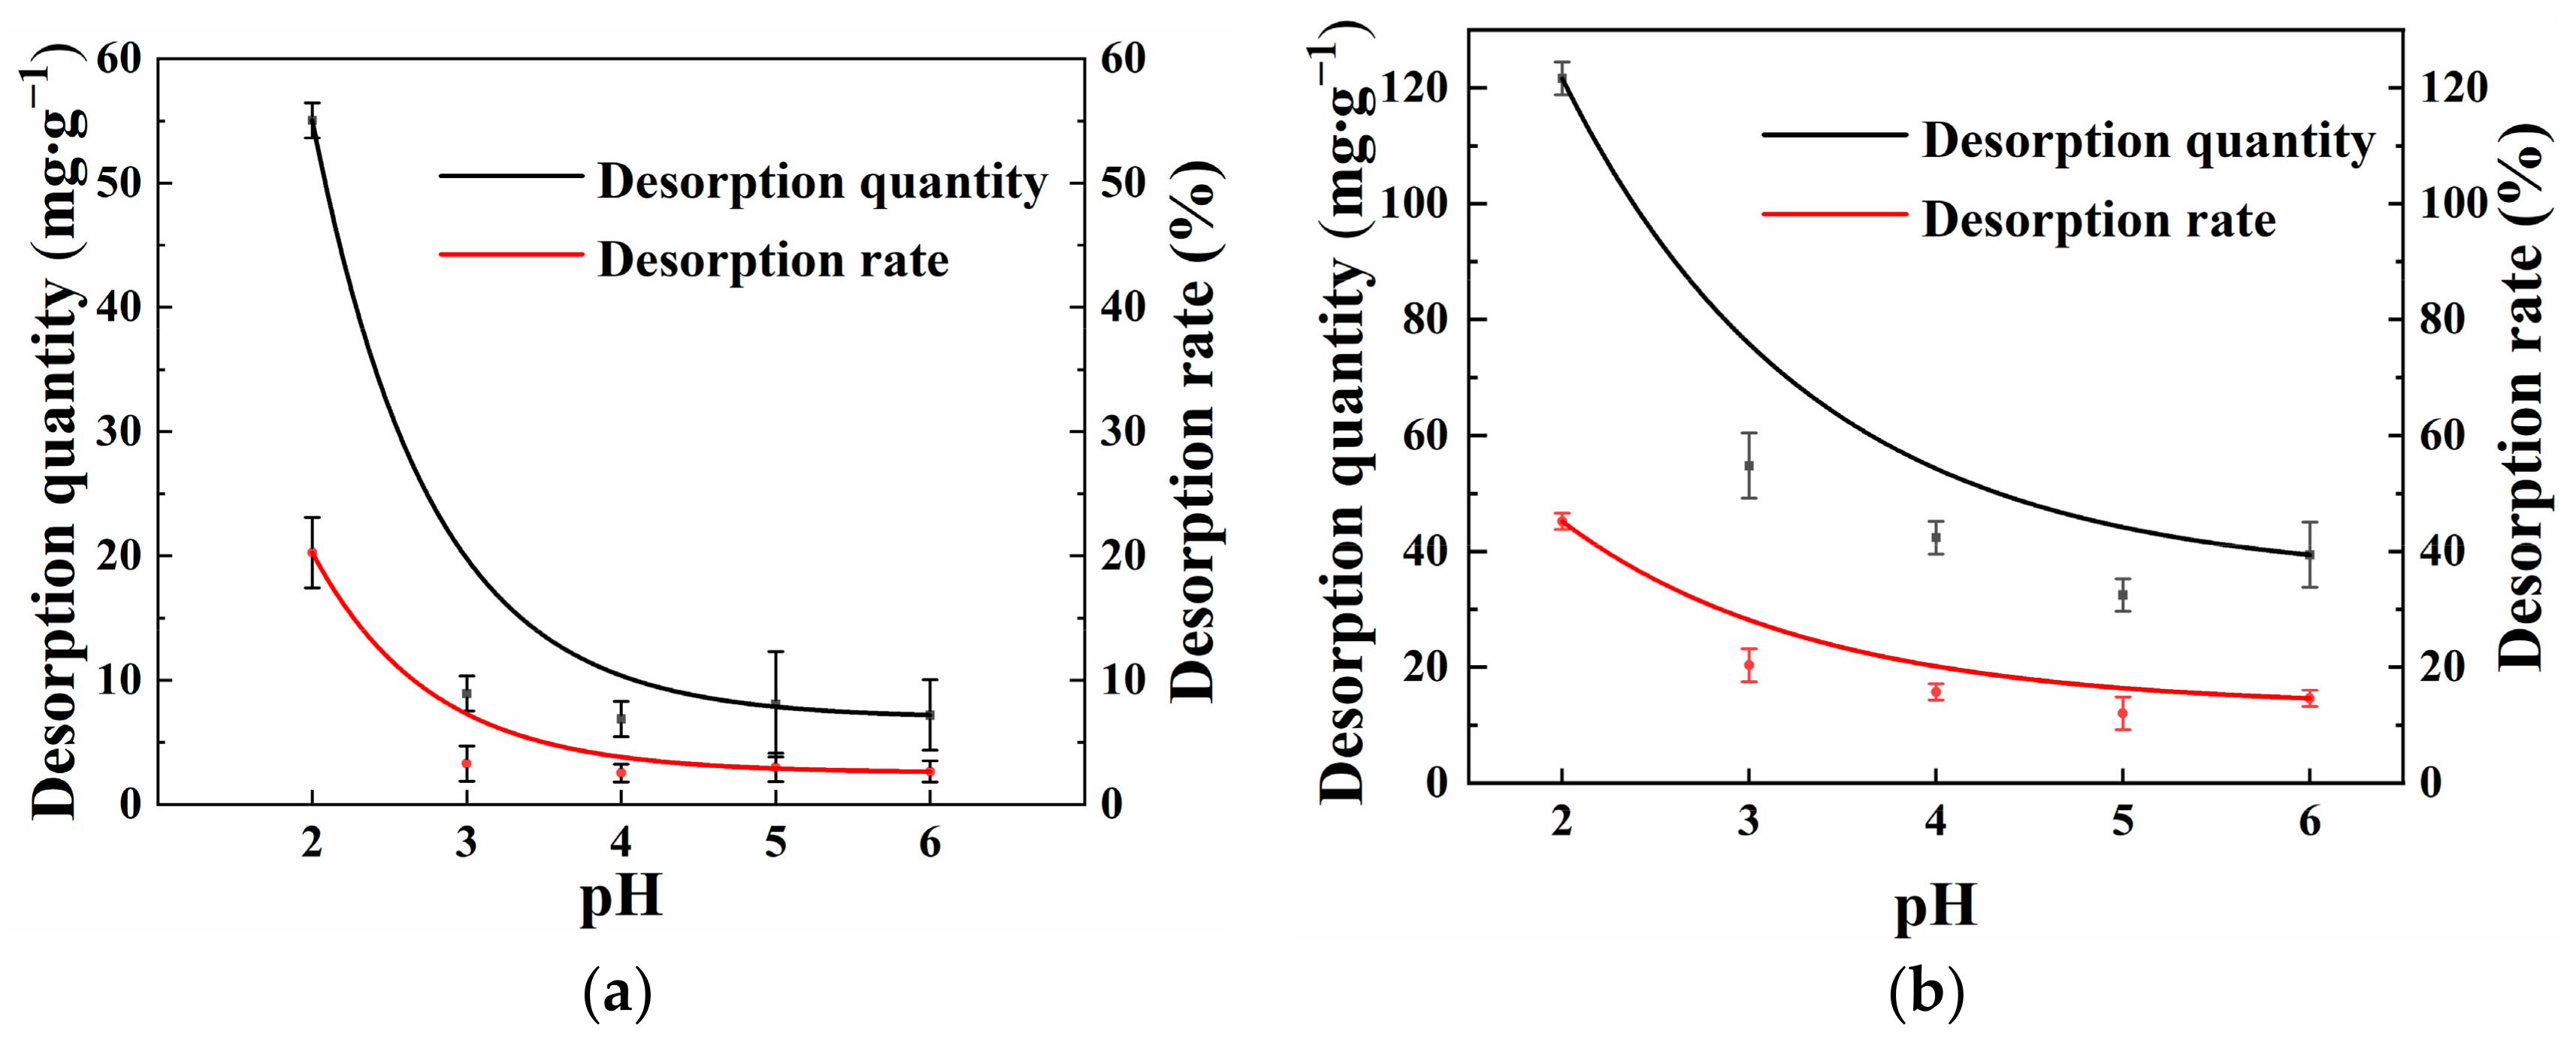
3.2. Stability Analysis of Cd(II) Adsorbed by SAP
3.3. Adsorption Modeling
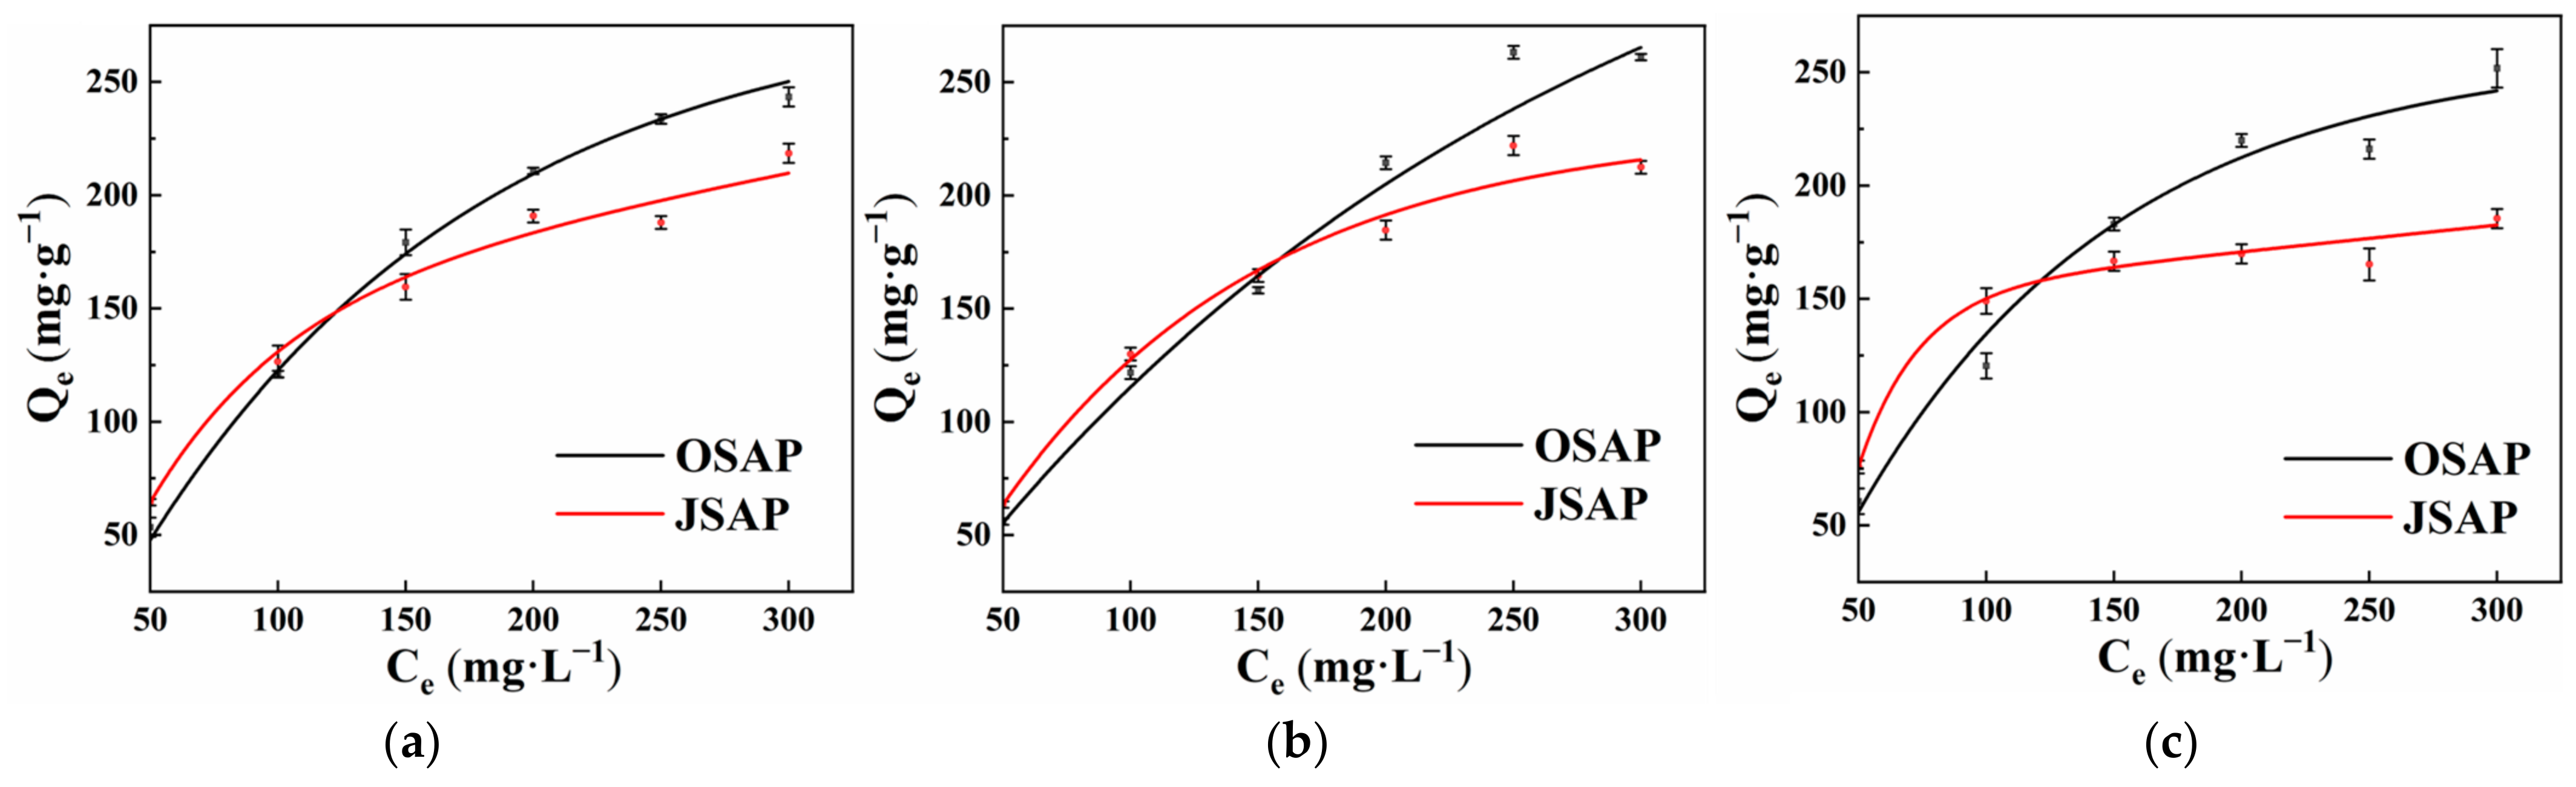
3.3.1. Adsorption Isotherm
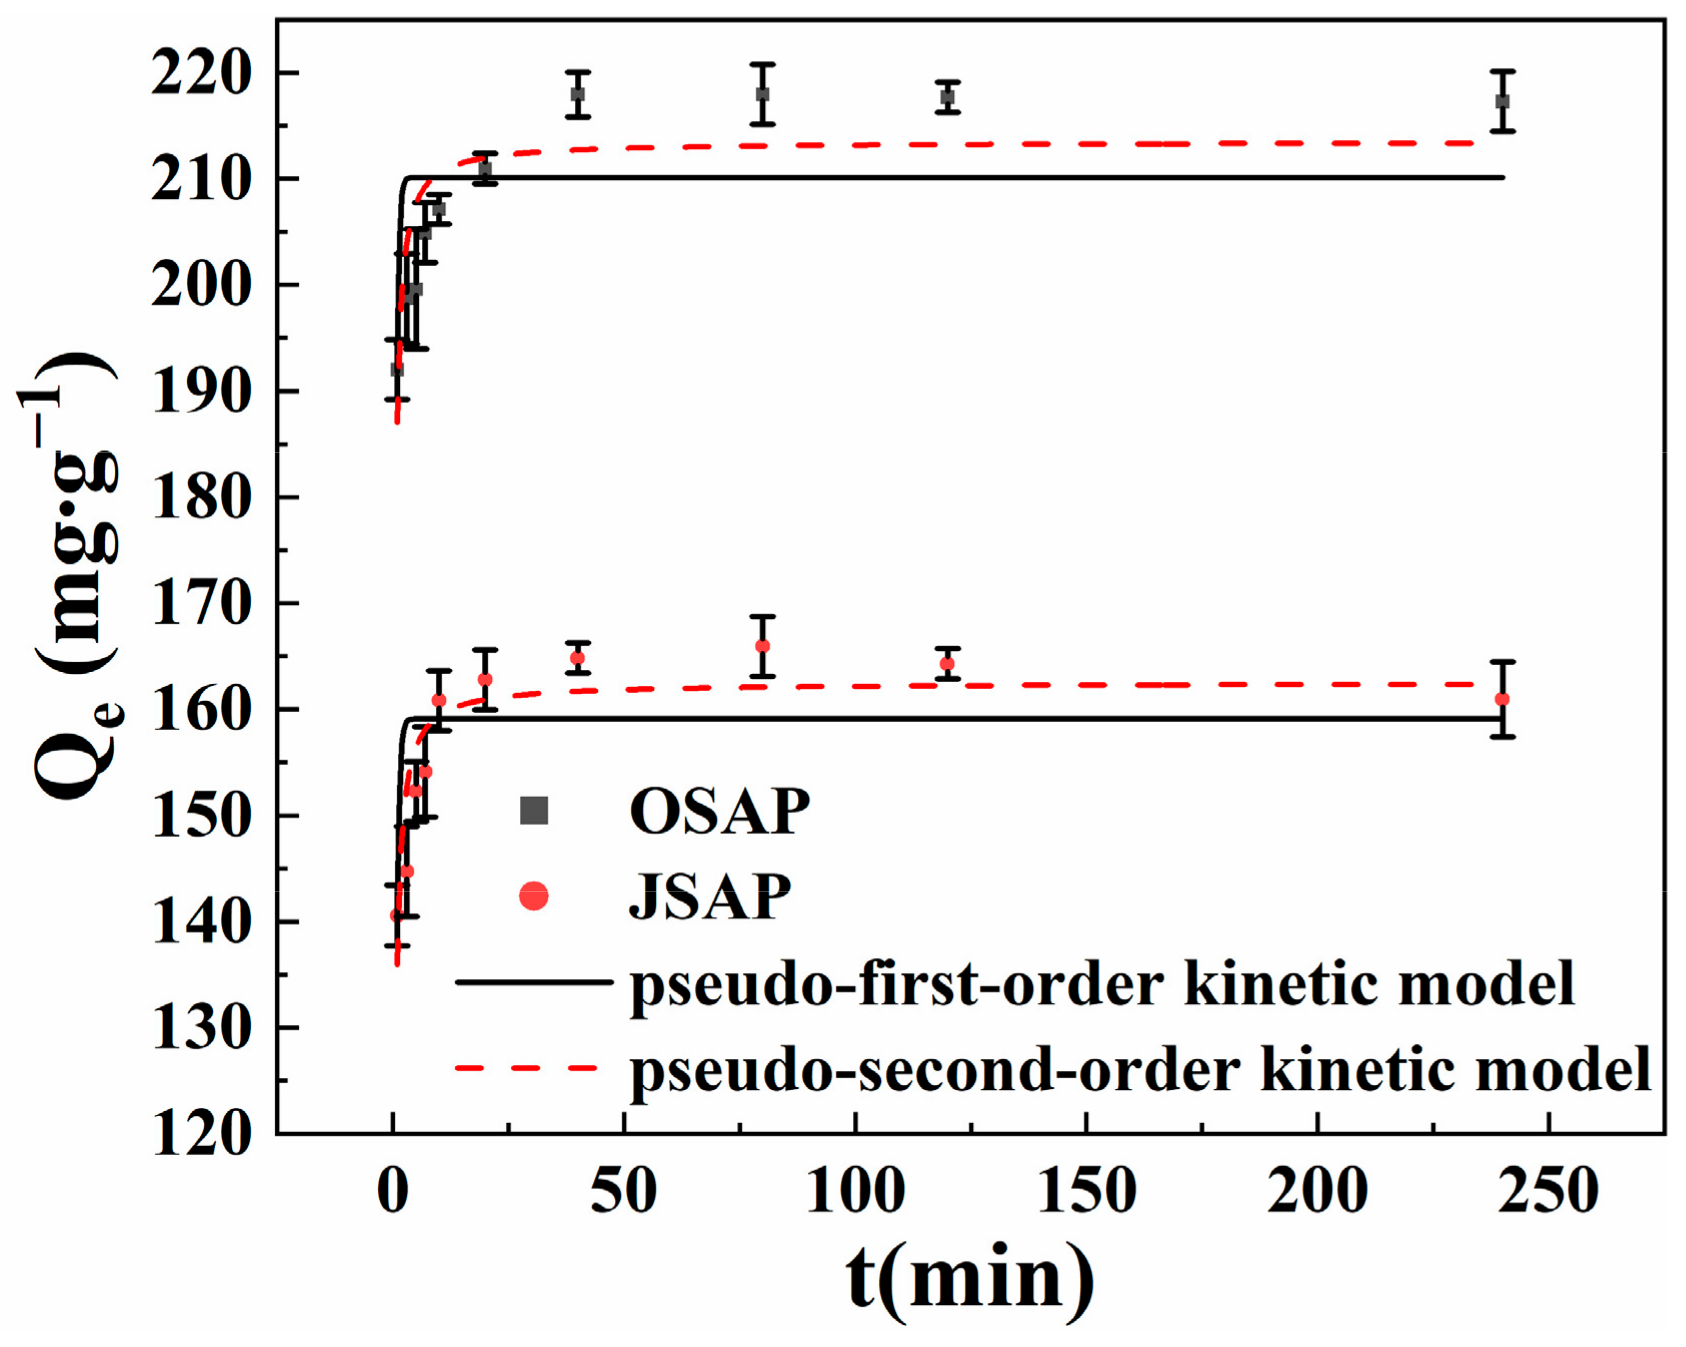
3.3.2. Adsorption Kinetics
3.4. Adsorption Mechanism by Material Surface Features
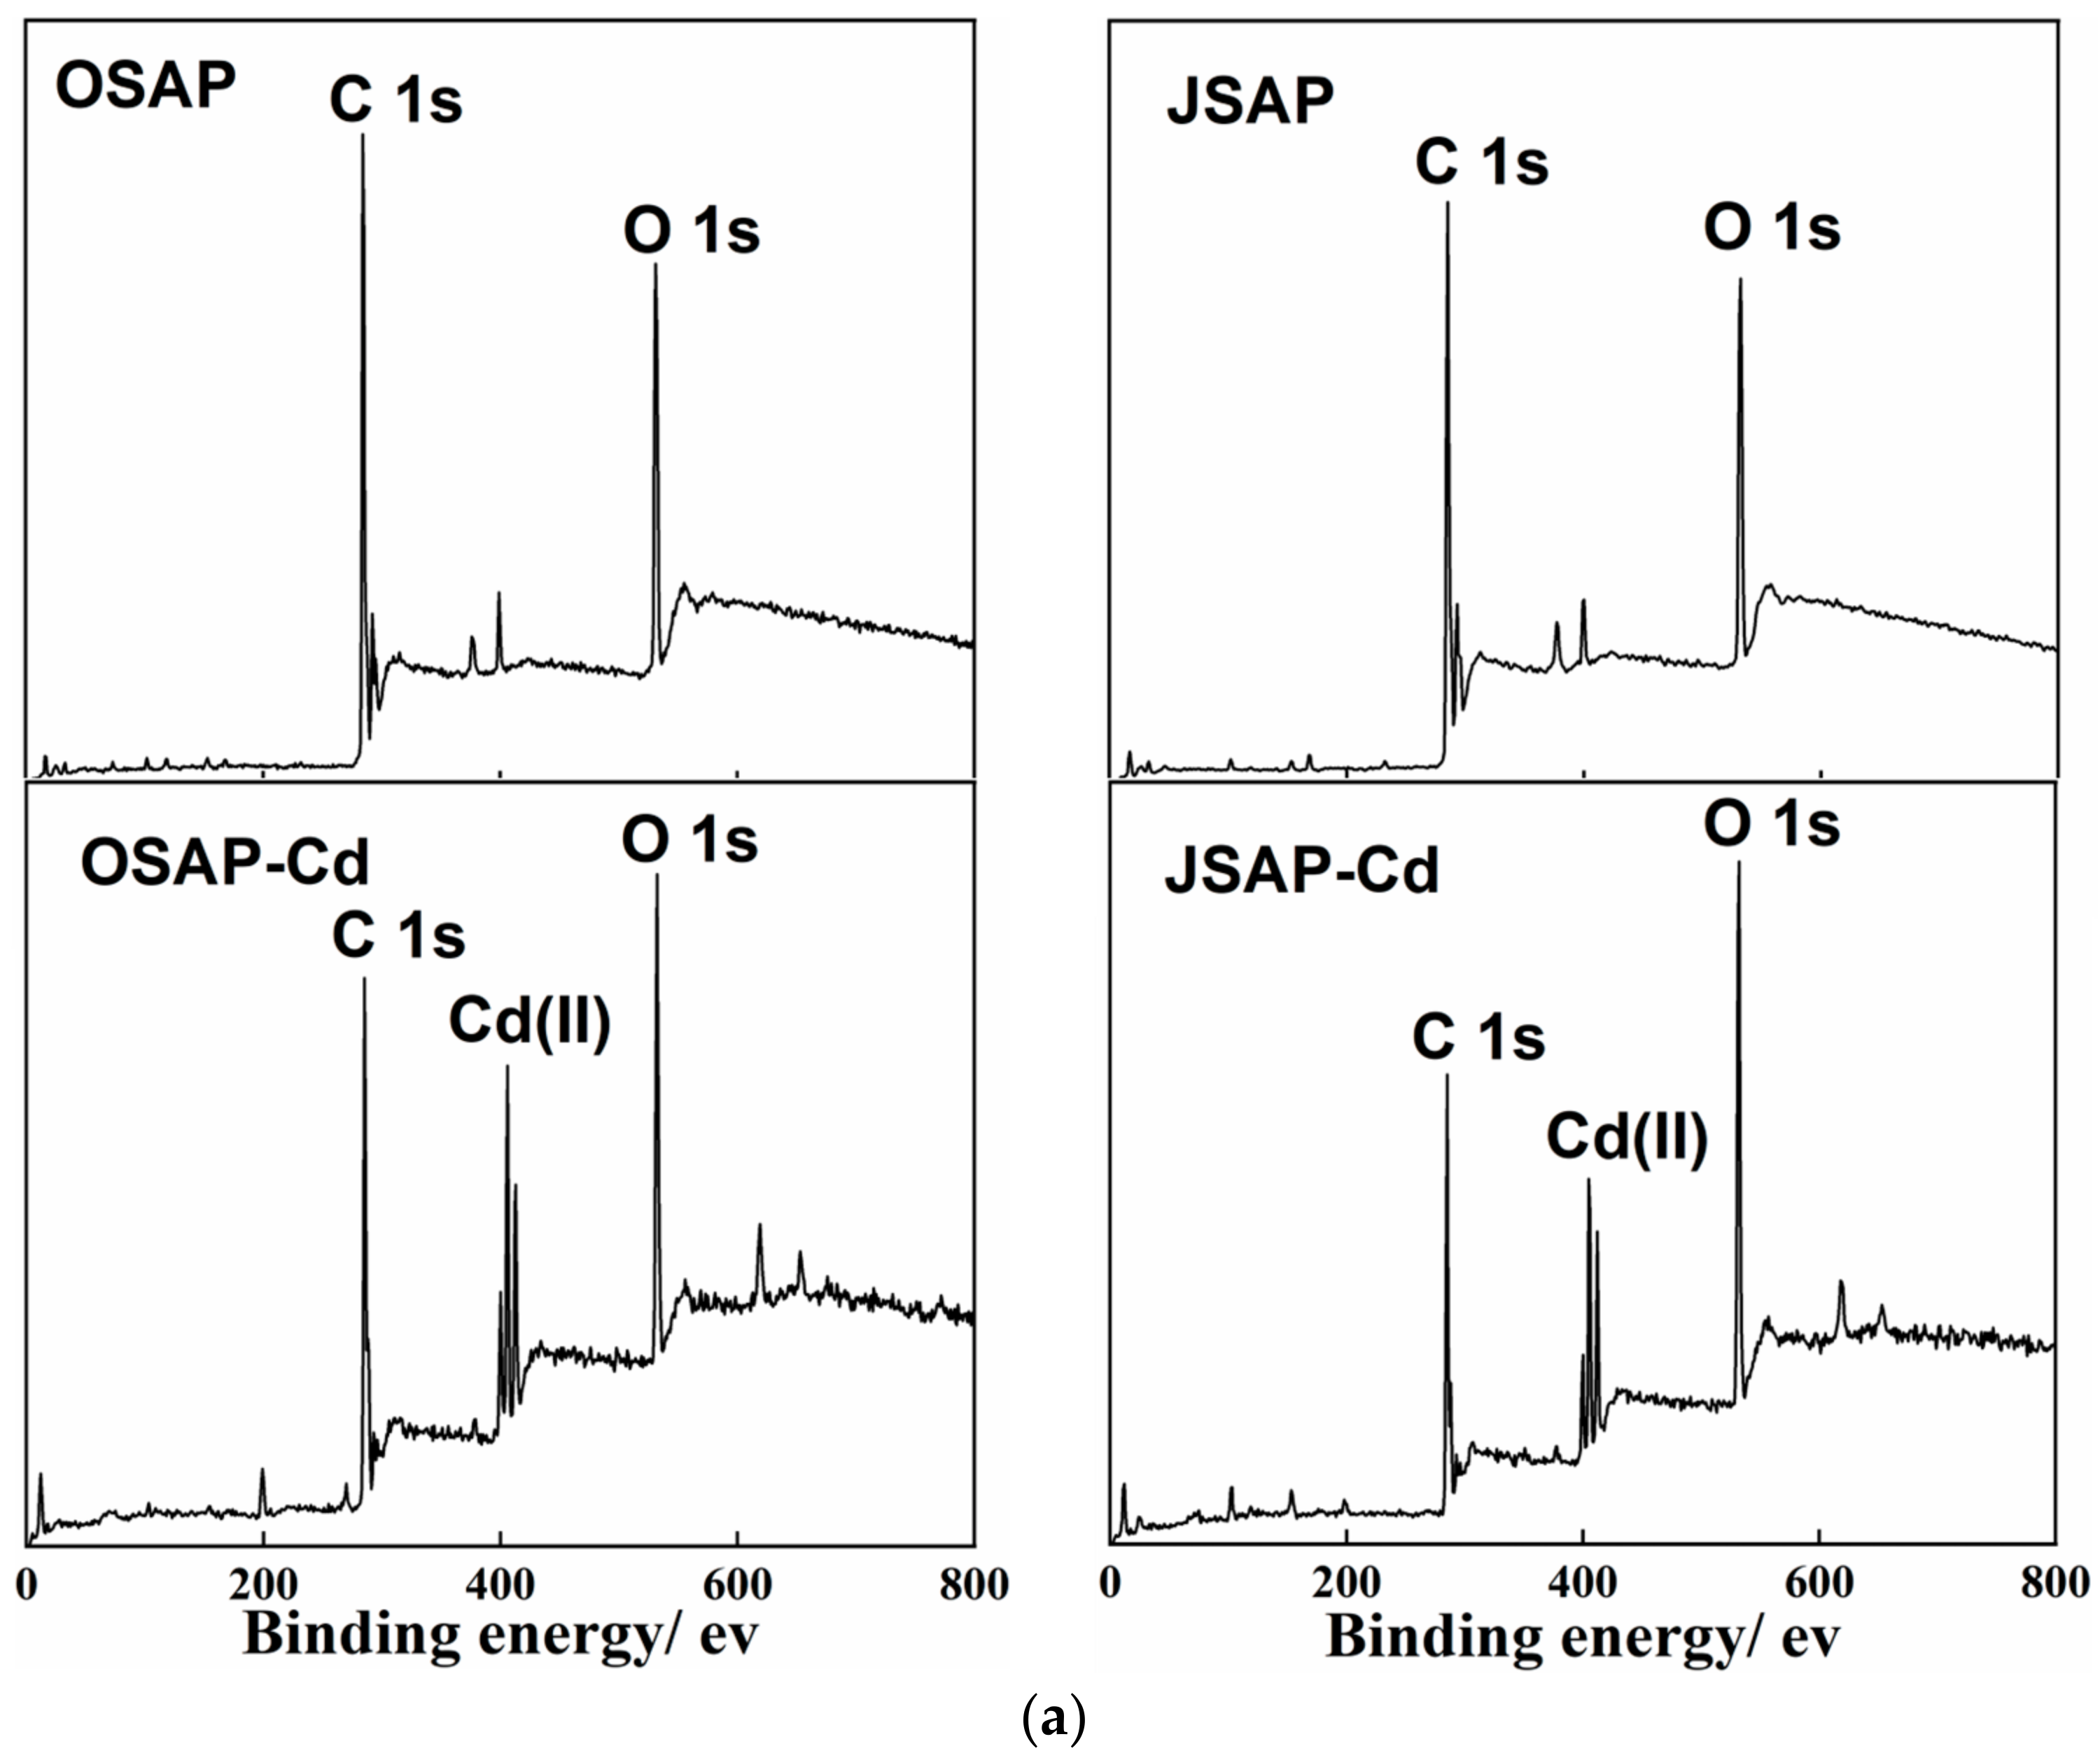
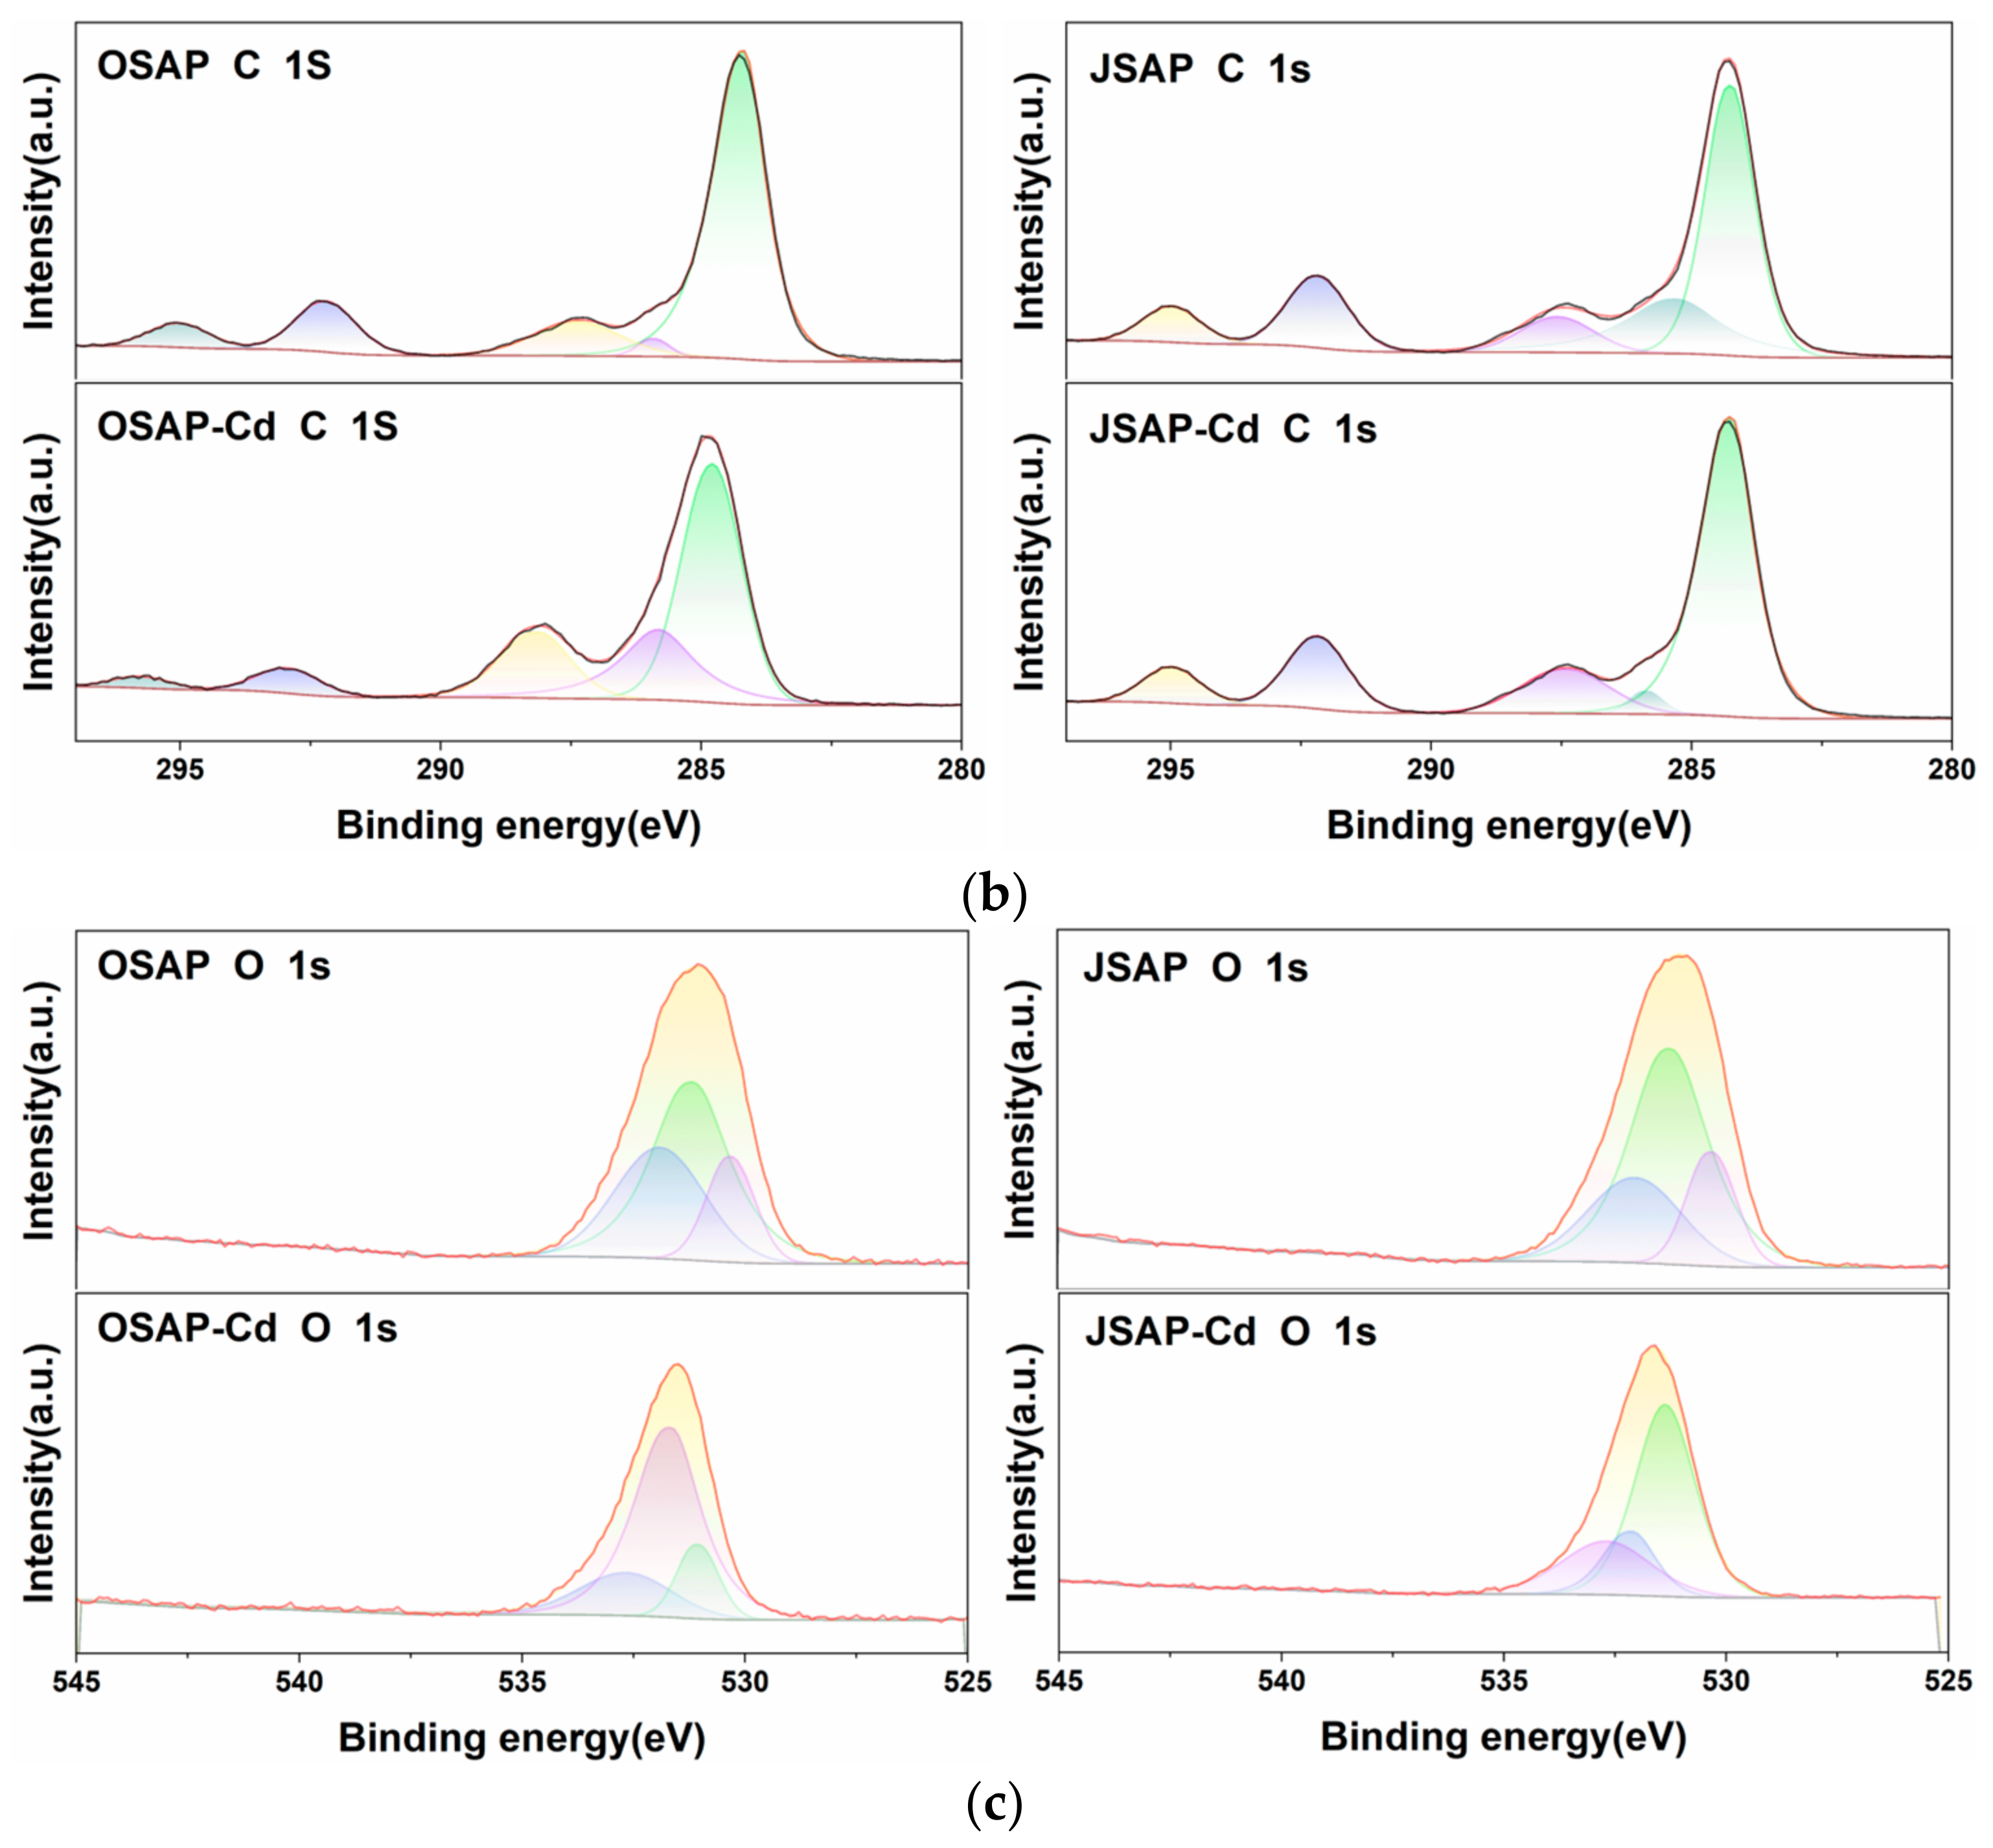
3.4.1. XPS Analysis
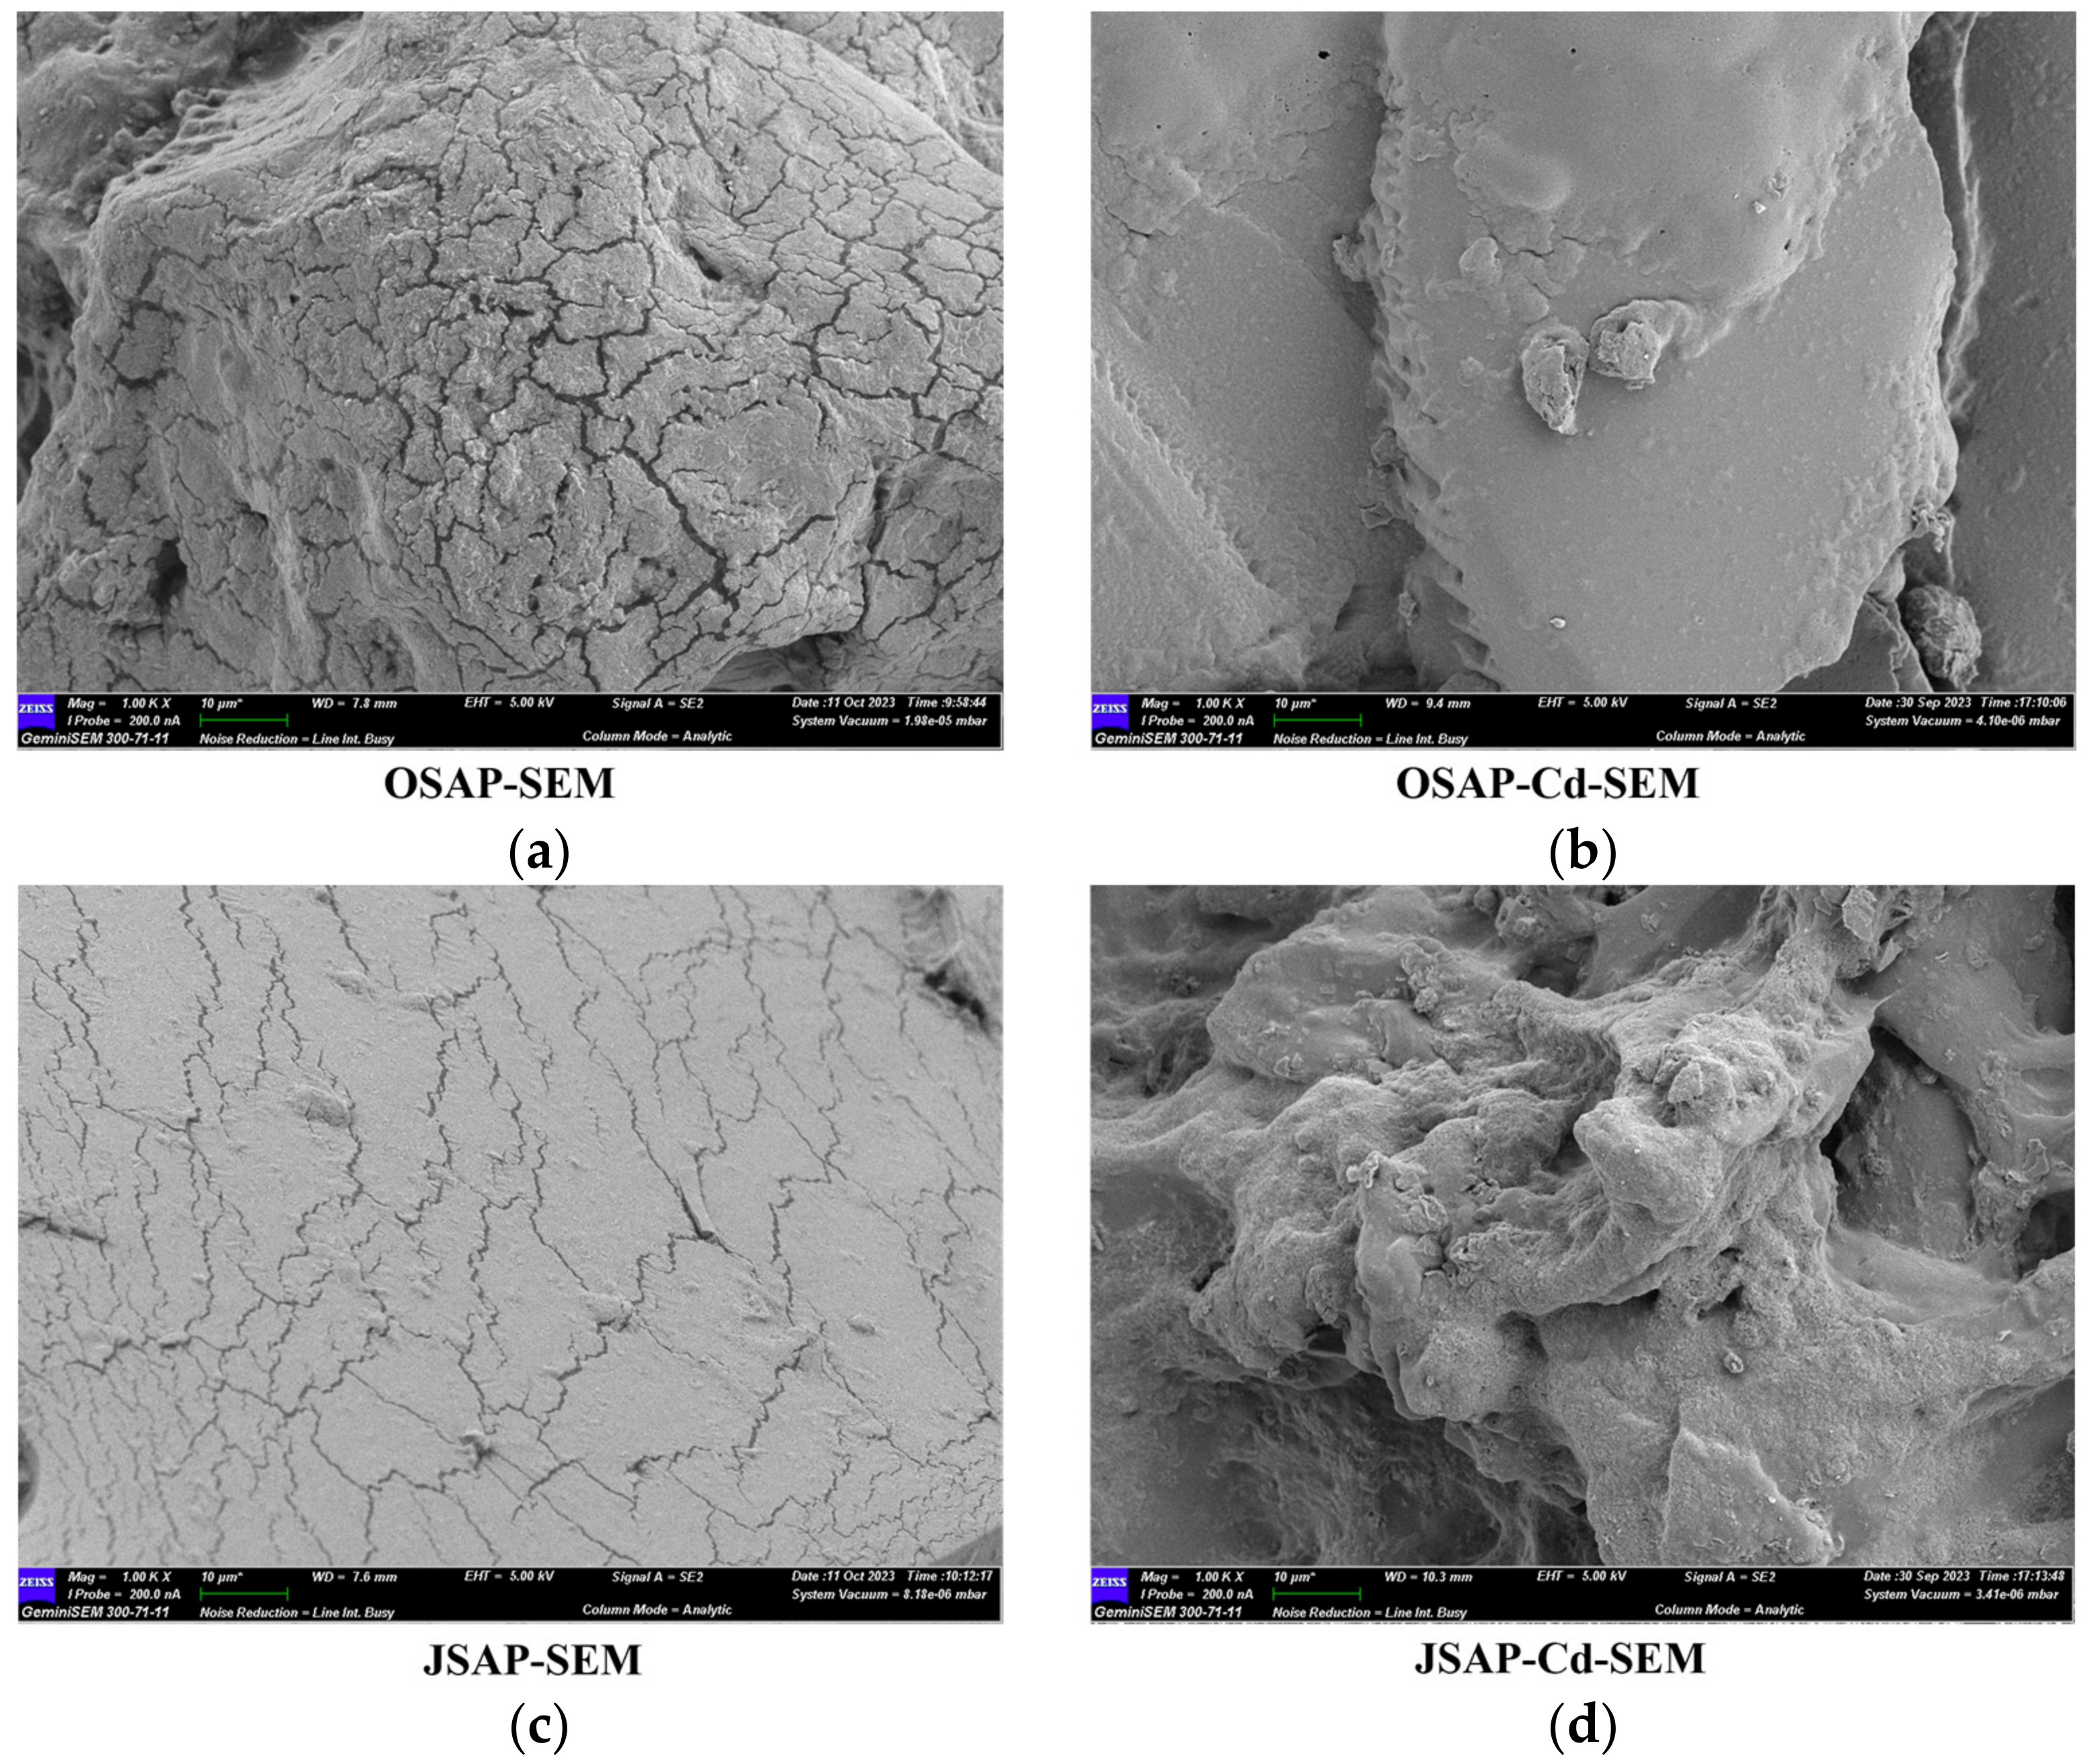
3.4.2. SEM Analysis
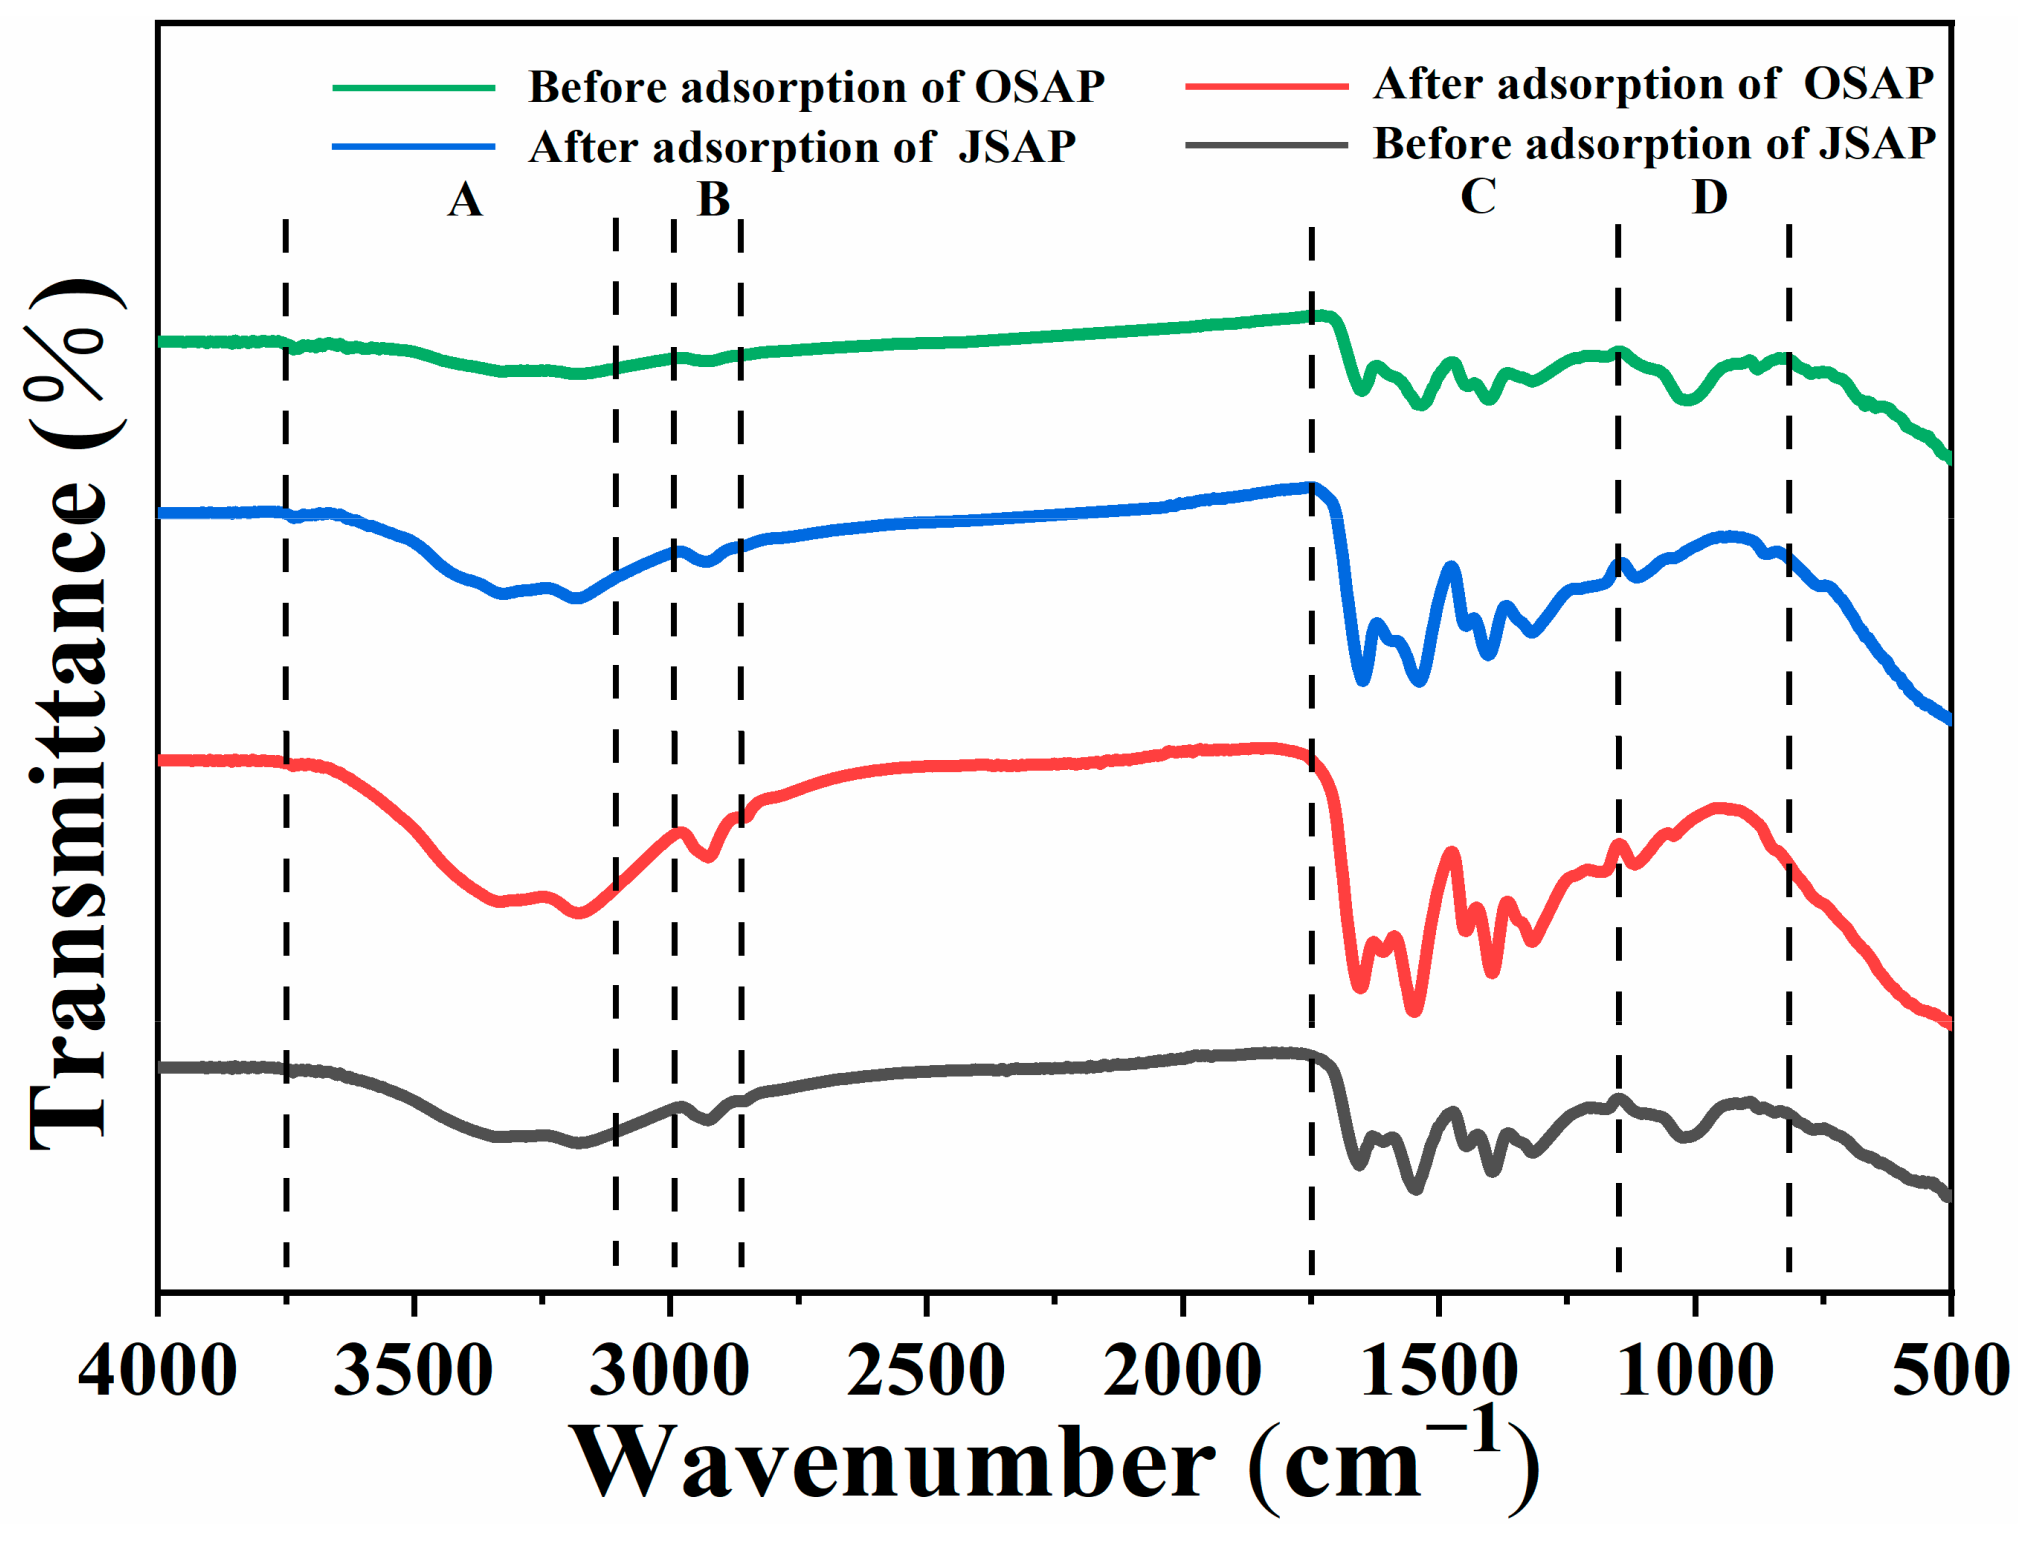
3.4.3. FTIR Analysis
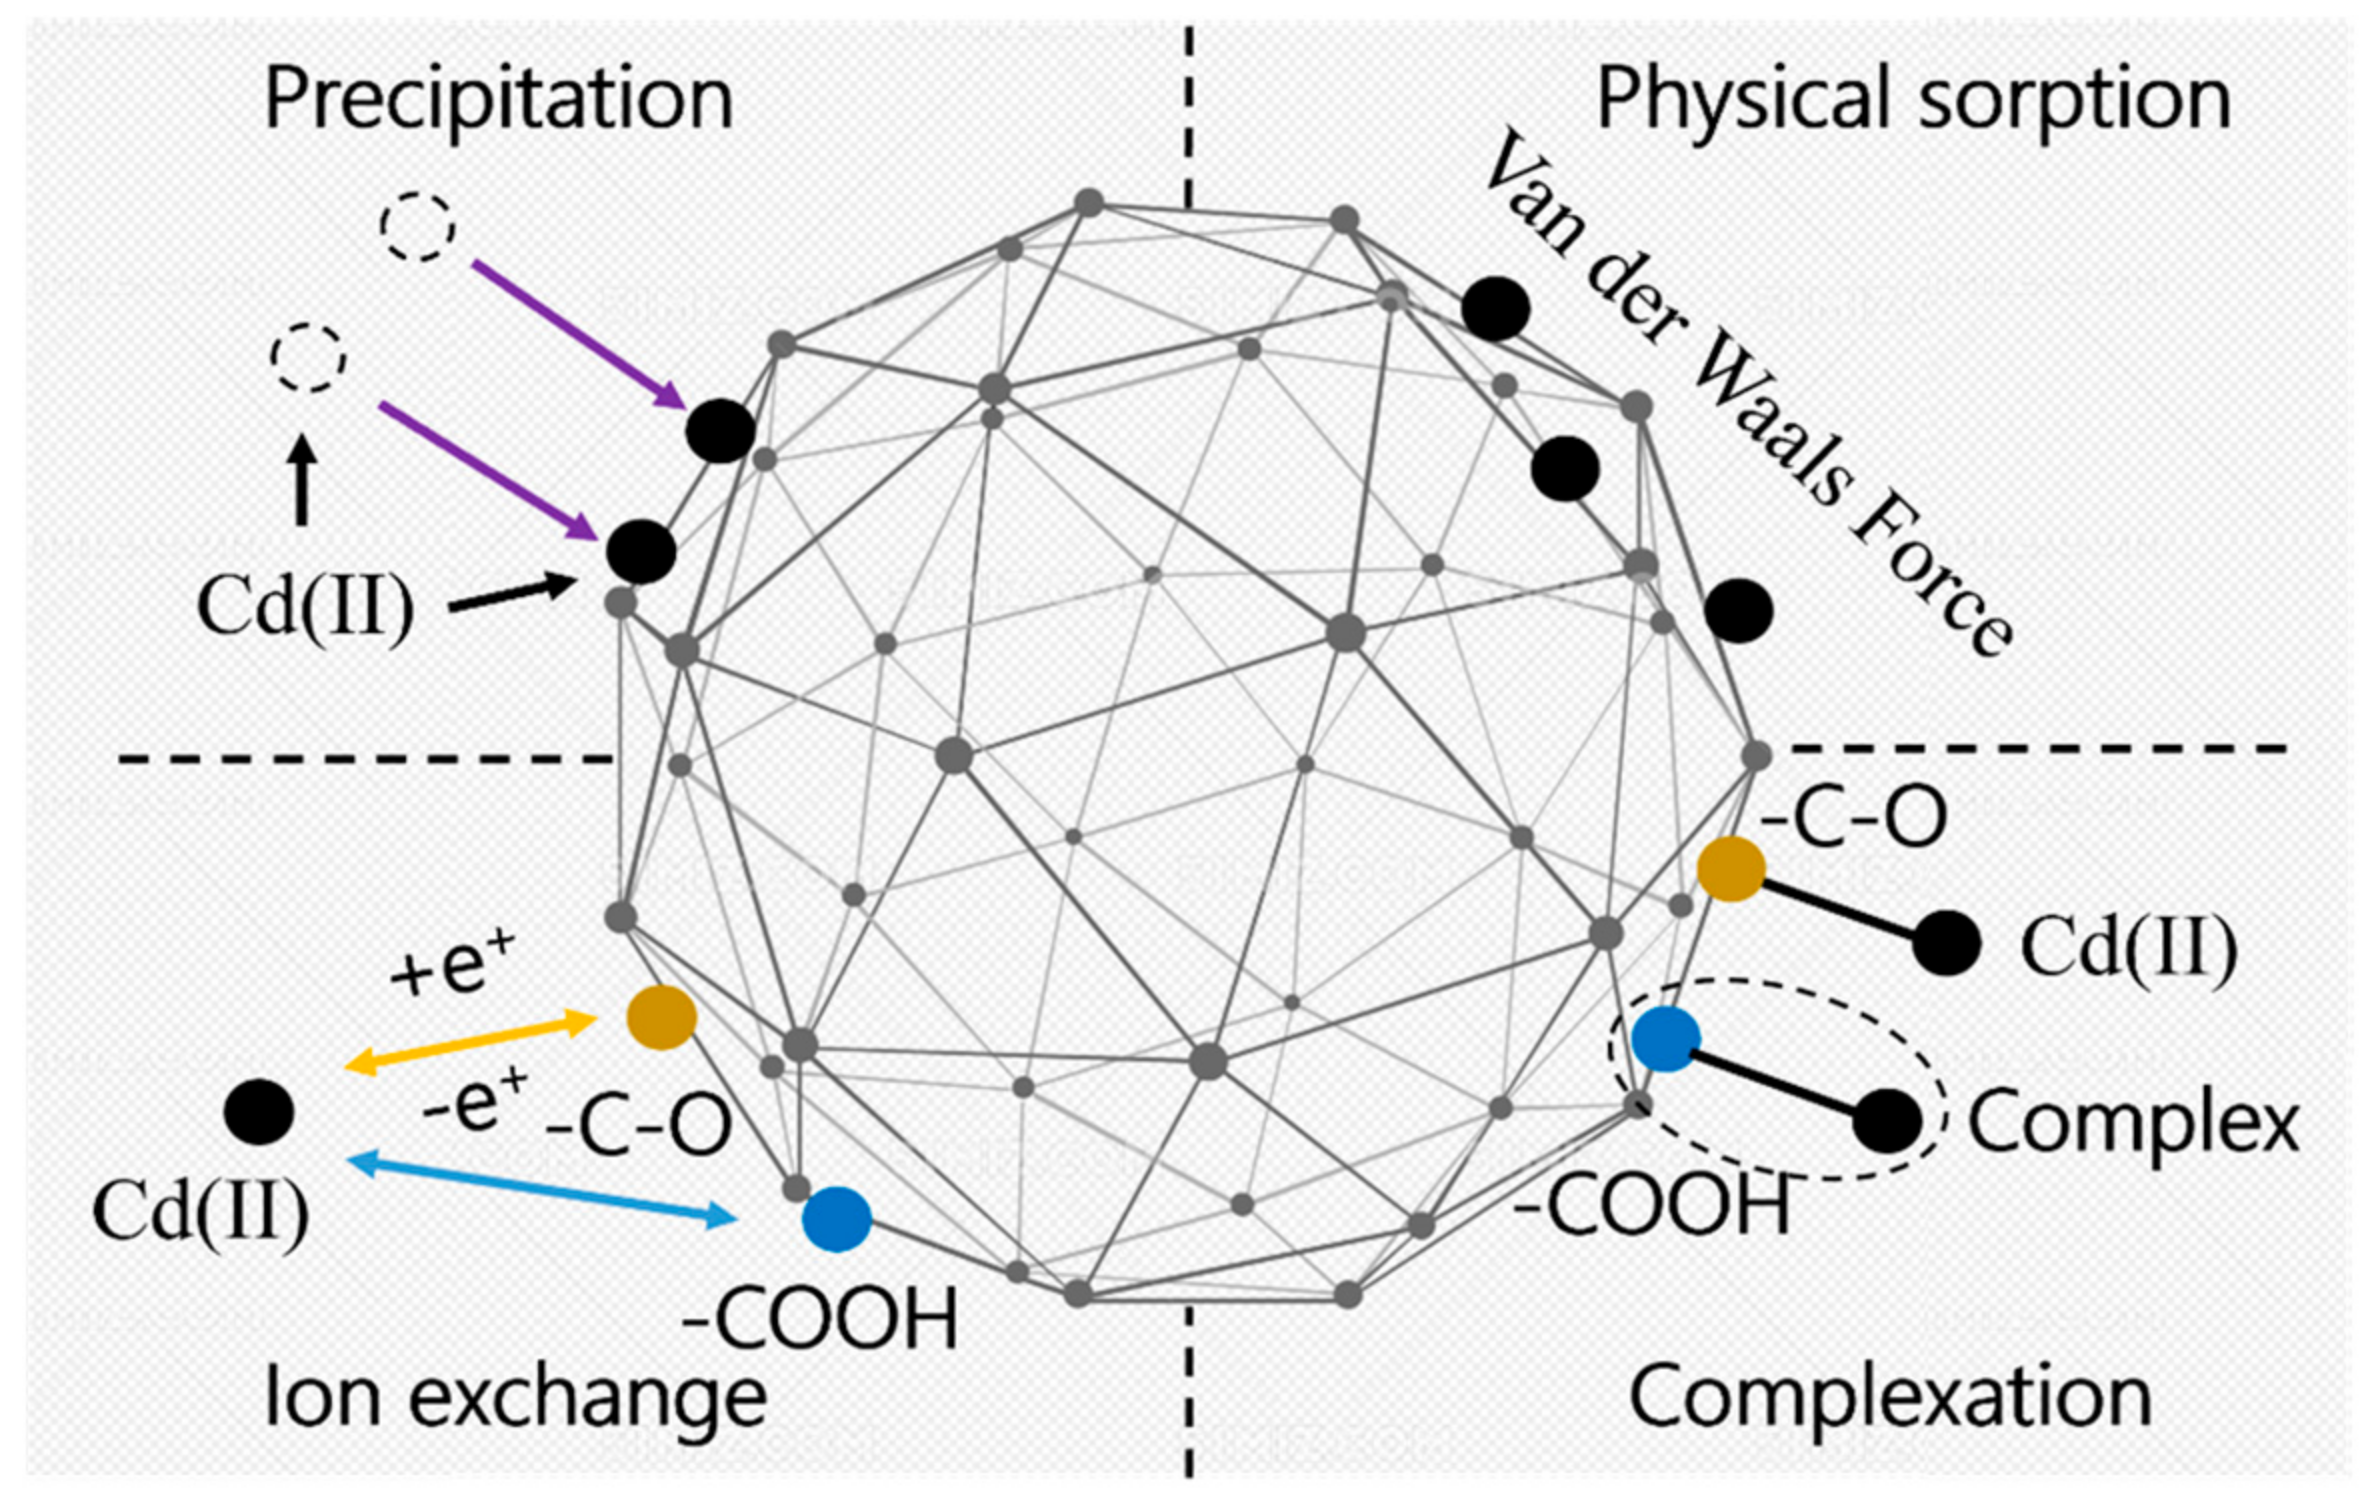
3.4.4. Adsorption Mechanism
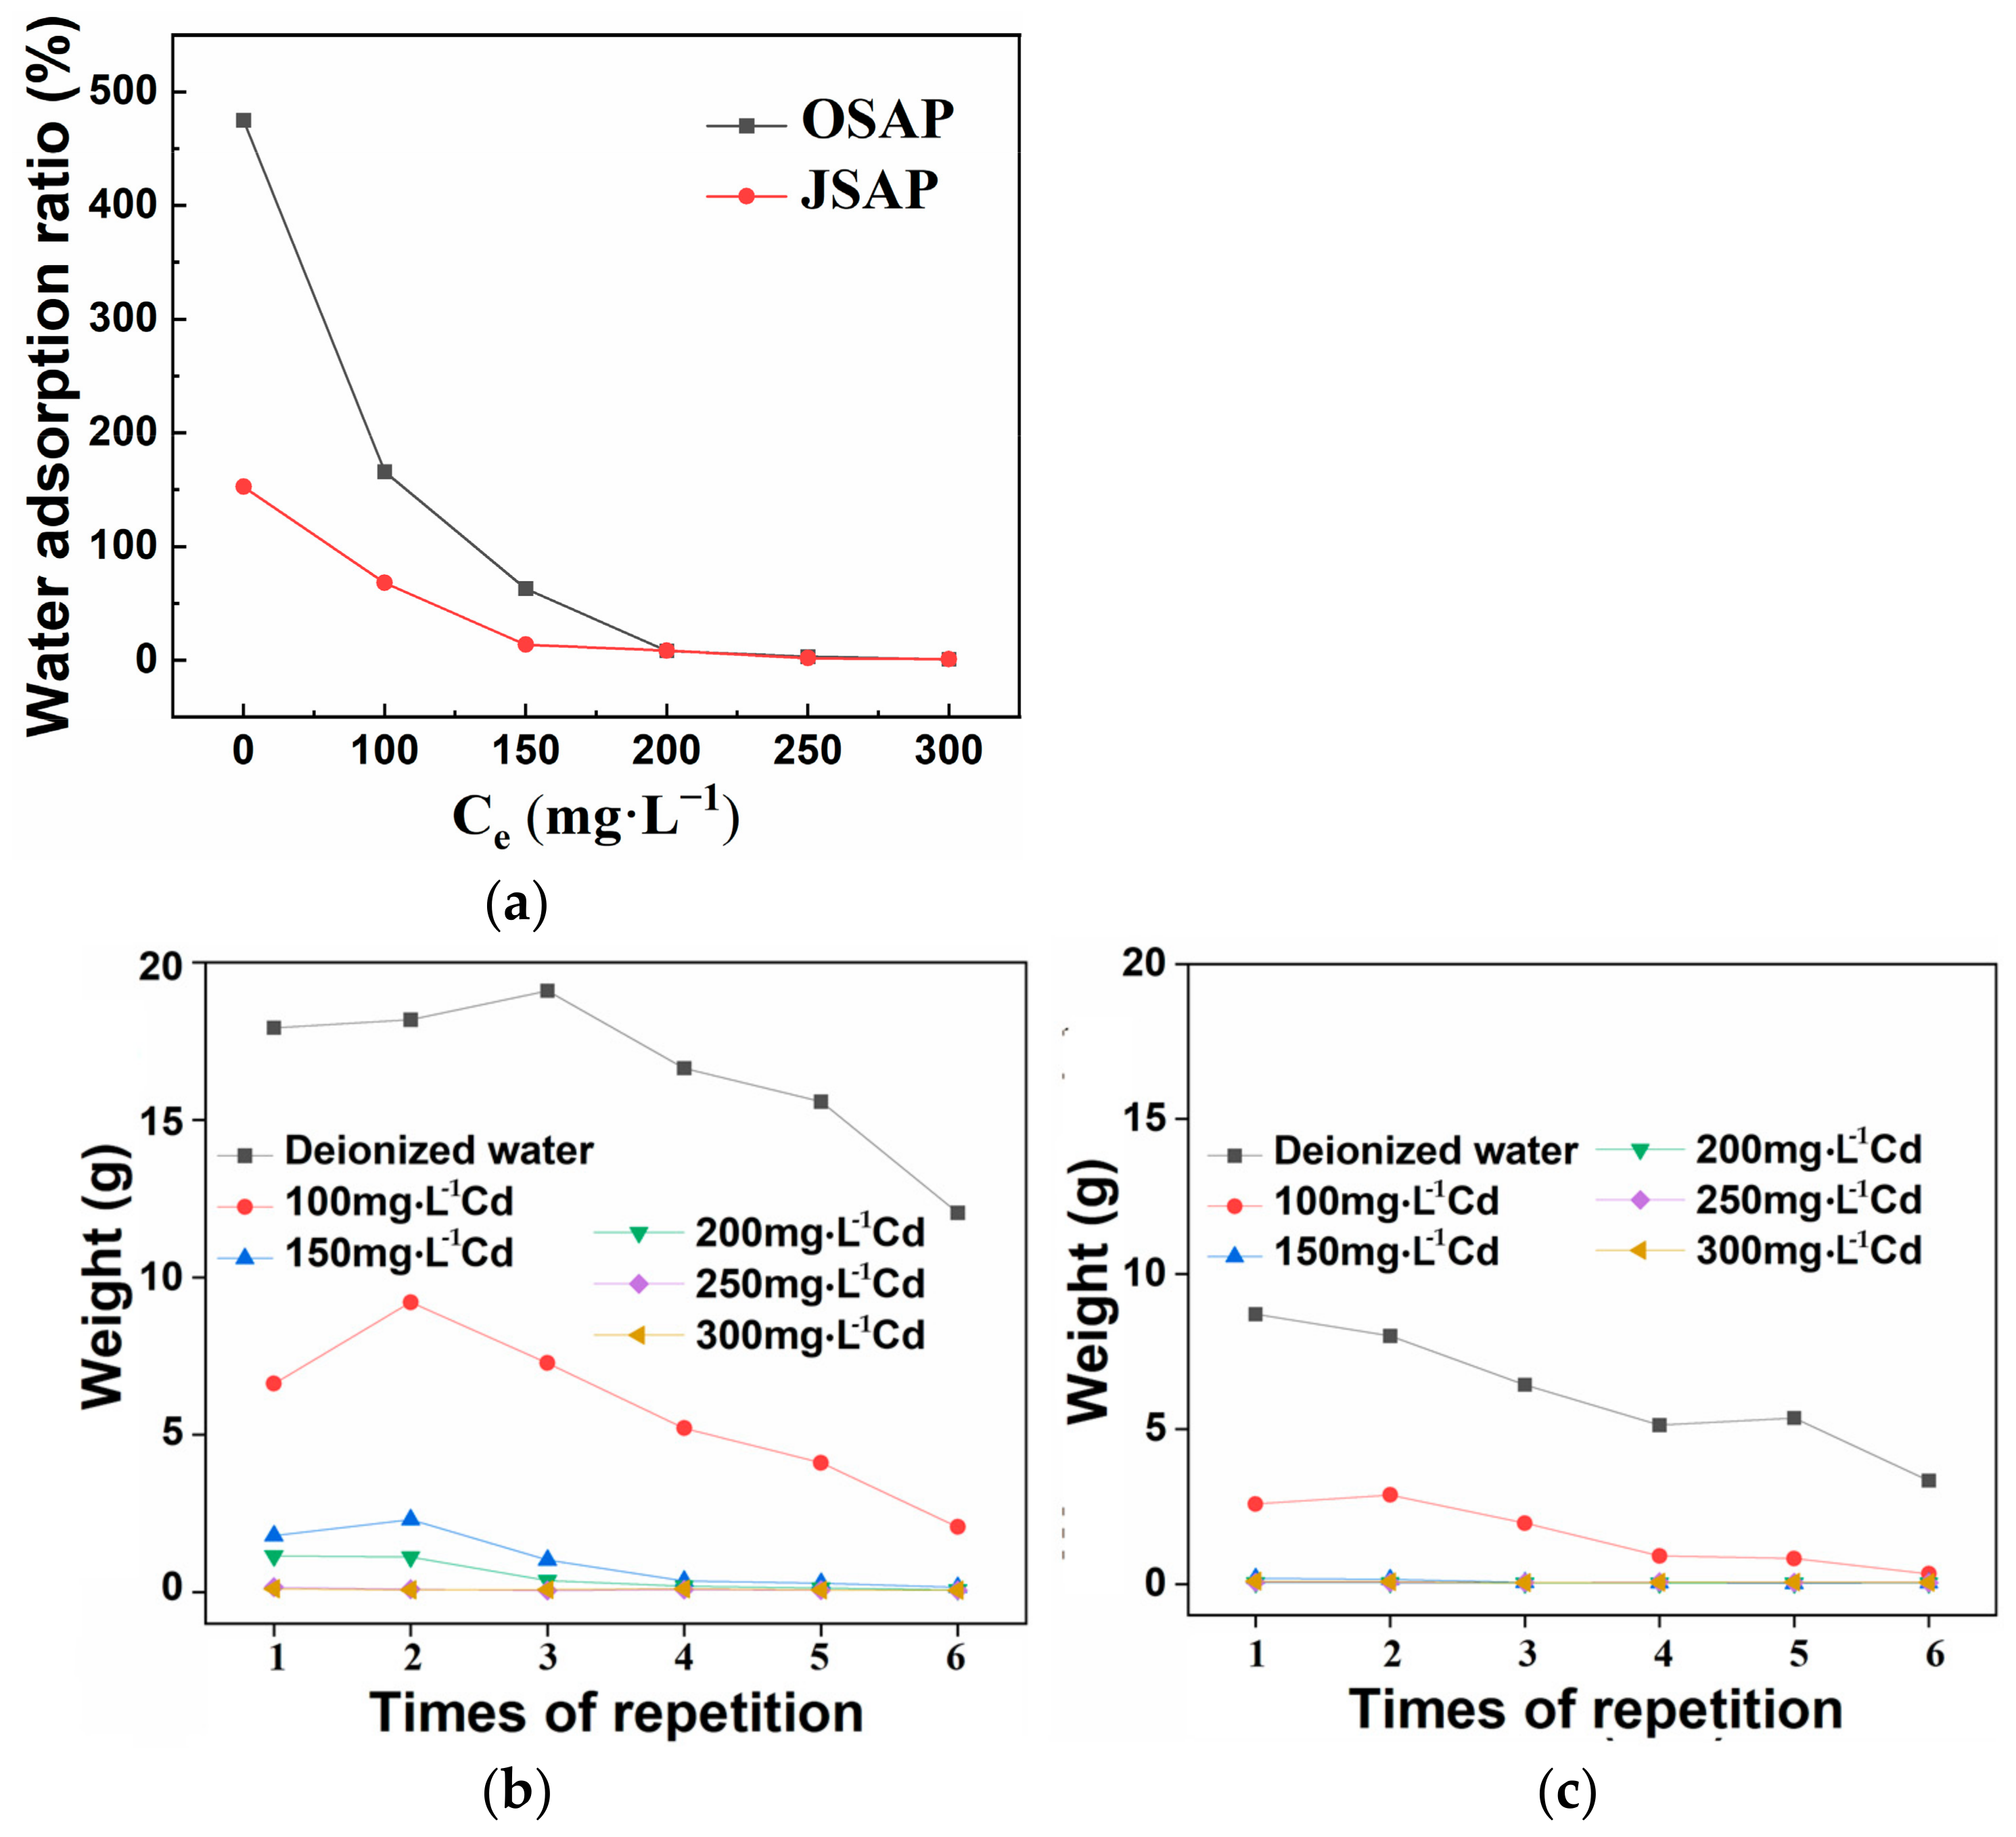
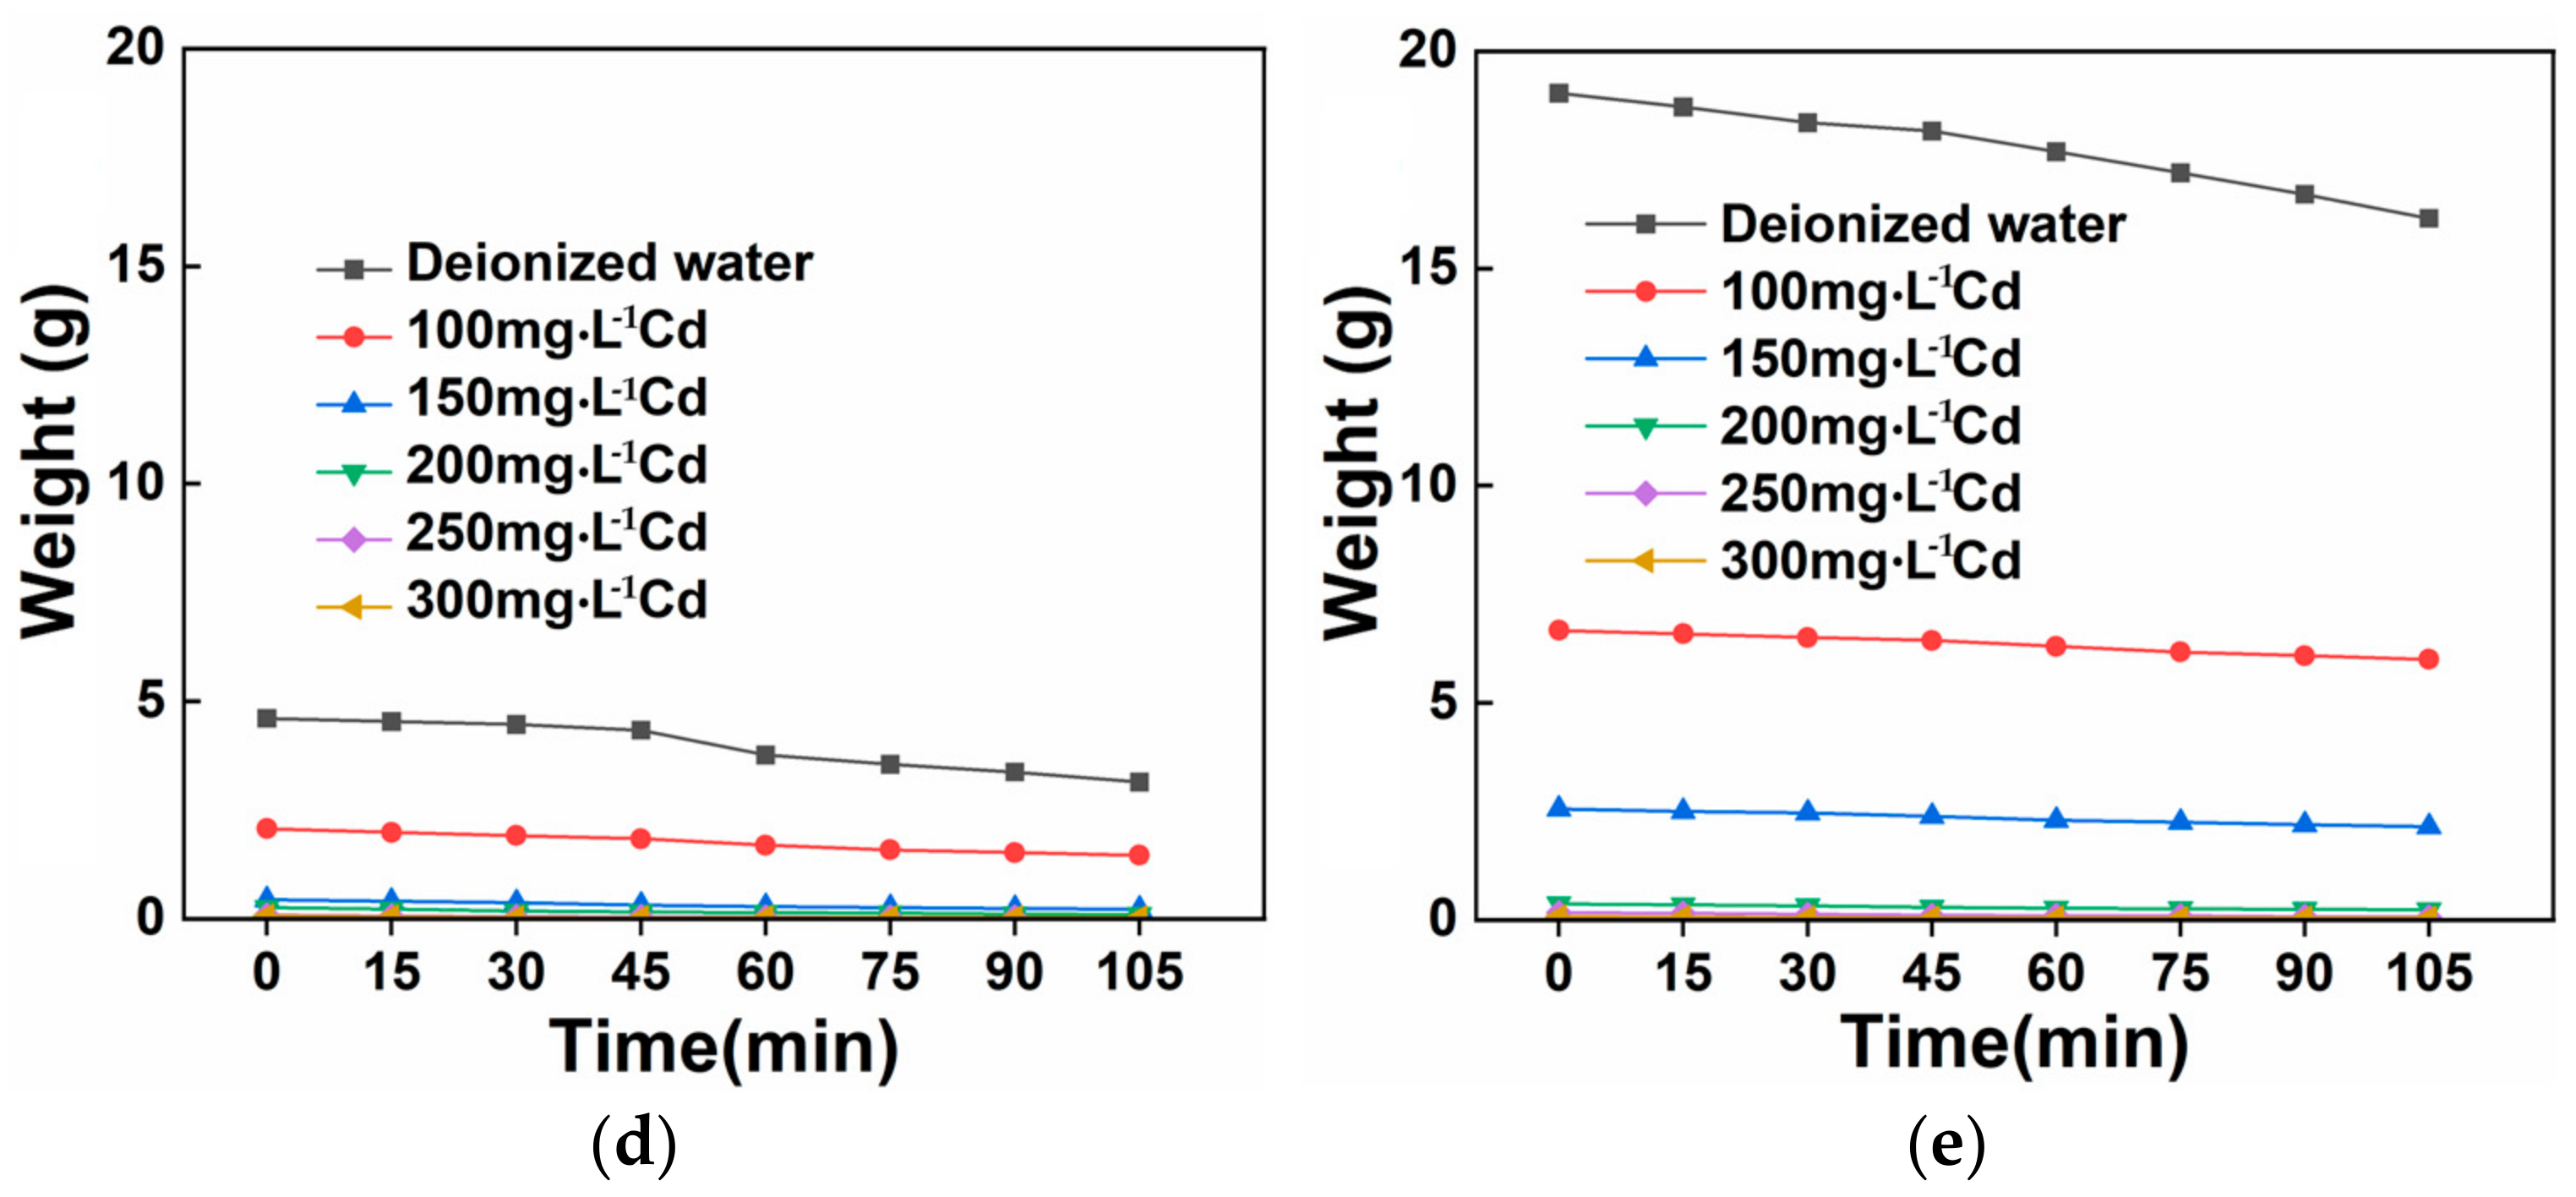
3.5. Effect of Cadmium Ion on Water Adsorption Characteristics of Superabsorbent Polymer
3.6. Evaluation and Analysis the Economy of SAP
4. Conclusions
Supplementary Materials
Author Contributions
Funding
Institutional Review Board Statement
Informed Consent Statement
Data Availability Statement
Conflicts of Interest
References
- Fu, F.L.; Wang, Q. Removal of heavy metal ions from wastewaters: A review. J. Environ. Manag. 2011, 92, 407–418. [Google Scholar] [CrossRef] [PubMed]
- Bertin, G.; Averbeck, D. Cadmium: Cellular effects, modifications of biomolecules, modulation of DNA repair and genotoxic consequences (a review). Biochimie 2006, 88, 1549–1559. [Google Scholar] [CrossRef] [PubMed]
- Kubier, A.; Wilkin, R.T.; Pichler, T. Cadmium in soils and groundwater: A review. Appl. Geochem. 2019, 108, 104388. [Google Scholar] [CrossRef] [PubMed]
- Song, P.P.; Xu, D.; Yue, J.Y.; Ma, Y.C.; Dong, S.J.; Feng, J. Recent advances in soil remediation technology for heavy metal contaminated sites: A critical review. Sci. Total Environ. 2022, 838, 156417. [Google Scholar] [CrossRef] [PubMed]
- Wang, P.; Ding, F.J.; Huang, Z.B.; Fu, Z.Y.; Zhao, P.; Men, S.H. Adsorption behavior and mechanism of Cd (II) by modified coal-based humin. Environ. Technol. Innov. 2021, 23, 101699. [Google Scholar] [CrossRef]
- Hou, C.; Yan, W.; Ma, H.; Bai, Y.; Yuan, Z. Preparation polymer-grafted magnetic starch adsorption material St/Fe3O4-gp (GMA-r-HEMA) used for removal of heavy metals. Colloids Surf. A Physicochem. Eng. Asp. 2024, 685, 133255. [Google Scholar] [CrossRef]
- Shah, L.A.; Khan, M.; Javed, R.; Sayed, M.; Khan, M.S.; Khan, A.; Ullah, M. Superabsorbent polymer hydrogels with good thermal and mechanical properties for removal of selected heavy metal ions. J. Clean. Prod. 2018, 201, 78–87. [Google Scholar] [CrossRef]
- Huang, W.; Lai, H.Q.; Du, J.X.; Zhou, C.Y.; Liu, Z.; Ni, Q. Effect of polymer water retaining agent on physical properties of silty clay. Chem. Biol. Technol. Agric. 2022, 9, 47. [Google Scholar] [CrossRef]
- Ma, X.T.; Qu, K.Y.; Zhao, X.H.; Wang, Y.Y.; Zhang, X.; Zhang, X.R.; Zhou, X.; Ding, J.J.; Wang, X.Z.; Ma, L.; et al. Oxidized sodium alginate/polyacrylamide hydrogels adhesive for promoting wheat growth. Int. J. Biol. Macromol. 2023, 253, 127450. [Google Scholar] [CrossRef] [PubMed]
- Wang, W.L.; He, R.; Yang, T.L.; Hu, Y.C.; Zhang, N.; Yang, C. Three-dimensional mesoporous calcium carbonate-silica frameworks thermally activated from porous fossil bryophyte: Adsorption studies for heavy metal uptake. RSC Adv. 2018, 8, 25754–25766. [Google Scholar] [CrossRef] [PubMed]
- Jawad, A.H.; Hameed, B.H.; Abdulhameed, A.S. Synthesis of biohybrid magnetic chitosan-polyvinyl alcohol/MgO nanocomposite blend for remazol brilliant blue R dye adsorption: Solo and collective parametric optimization. Polym. Bull. 2023, 80, 4927–4947. [Google Scholar] [CrossRef]
- Zhang, J.J.; Wang, S.; Wang, Q.H.; Wang, N.; Li, C.L.; Wang, L.C. First determination of Cu adsorption on soil humin. Environ. Chem. Lett. 2013, 11, 41–46. [Google Scholar] [CrossRef]
- He, K.; Chen, Y.C.; Tang, Z.H.; Hu, Y.Y. Removal of heavy metal ions from aqueous solution by zeolite synthesized from fly ash. Environ. Sci. Pollut. Res. 2016, 23, 2778–2788. [Google Scholar] [CrossRef] [PubMed]
- Chen, G.N.; Shah, K.J.; Shi, L.; Chiang, P.C. Removal of Cd(II) and Pb(II) ions from aqueous solutions by synthetic mineral adsorbent: Performance and mechanisms. Appl. Surf. Sci. 2017, 409, 296–305. [Google Scholar] [CrossRef]
- Sun, C.W.; Xie, Y.; Ren, X.M.; Song, G.; Alsaedi, A.; Hayat, T.; Chen, C.L. Efficient removal of Cd(II) by core-shell Fe3O4@polydopamine microspheres from aqueous solution. J. Mol. Liq. 2019, 295, 111724. [Google Scholar] [CrossRef]
- Huang, X.R.; Zhao, H.H.; Zhang, G.B.; Li, J.T.; Yang, Y.; Ji, P.H. Potential of removing Cd(II) and Pb(II) from contaminated water using a newly modified fly ash. Chemosphere 2020, 242, 125148. [Google Scholar] [CrossRef] [PubMed]
- Alqadami, A.A.; Naushad, M.; Alothman, Z.A.; Ghfar, A.A. Novel Metal-Organic Framework (MOF) Based Composite Material for the Sequestration of U(VI) and Th(IV) Metal Ions from Aqueous Environment. ACS Appl. Mater. Interfaces 2017, 9, 36026–36037. [Google Scholar] [CrossRef] [PubMed]
- Macías-García, A.; Corzo, M.G.; Domínguez, M.A.; Franco, M.A.; Naharro, J.M. Study of the adsorption and electroadsorption process of Cu (II) ions within thermally and chemically modified activated carbon. J. Hazard. Mater. 2017, 328, 46–55. [Google Scholar] [CrossRef] [PubMed]
- Kosak, A.; Bauman, M.; Padeznik-Gomilsek, J.; Lobnik, A. Lead (II) complexation with 3-mercaptopropyl-groups in the surface layer of silica nanoparticles: Sorption, kinetics and EXAFS/XANES study. J. Mol. Liq. 2017, 229, 371–379. [Google Scholar] [CrossRef]
- Zhou, F.; Feng, X.; Yu, J.; Jiang, X. High performance of 3D porous graphene/lignin/sodium alginate composite for adsorption of Cd(II) and Pb(II). Environ. Sci. Pollut. Res. 2018, 25, 15651–15661. [Google Scholar] [CrossRef] [PubMed]
- Wang, Y.N.; Huang, Z.B.; Sheng, L.L.; Ma, Y. Effect of modified humic acid residue on the adsorption and passivation of Hg2+/Pb2+ in solution and soil. J. Mol. Liq. 2023, 377, 121581. [Google Scholar] [CrossRef]
- Wang, H.; Huang, F.; Zhao, Z.L.; Wu, R.R.; Xu, W.X.; Wang, P.; Xiao, R.B. High-efficiency removal capacities and quantitative adsorption mechanisms of Cd2+ by thermally modified biochars derived from different feedstocks. Chemosphere 2021, 272, 129594. [Google Scholar] [CrossRef] [PubMed]
- Ma, Y.; Cheng, L.; Zhang, D.D.; Zhang, F.; Zhou, S.K.; Ma, Y.; Guo, J.D.; Zhang, Y.R.; Xing, B.S. Stabilization of Pb, Cd, and Zn in soil by modified-zeolite: Mechanisms and evaluation of effectiveness. Sci. Total Environ. 2022, 814, 152746. [Google Scholar] [CrossRef] [PubMed]
- Meng, Z.W.; Xu, T.; Huang, S.; Ge, H.M.; Mu, W.T.; Lin, Z.B. Effects of competitive adsorption with Ni(II) and Cu(II) on the adsorption of Cd(II) by modified biochar co-aged with acidic soil. Chemosphere 2022, 293, 133621. [Google Scholar] [CrossRef] [PubMed]
- Liu, H.; Wang, X.Z.; Zhai, G.Y.; Zhang, J.; Zhang, C.L.; Bao, N.; Cheng, C. Preparation of activated carbon from lotus stalks with the mixture of phosphoric acid and pentaerythritol impregnation and its application for Ni(II) sorption. Chem. Eng. J. 2012, 209, 155–162. [Google Scholar] [CrossRef]
- Guo, Z.Z.; Zhang, J.; Kang, Y.; Liu, H. Rapid and efficient removal of Pb(II) from aqueous solutions using biomass-derived activated carbon with humic acid in-situ modification. Ecotoxicol. Environ. Saf. 2017, 145, 442–448. [Google Scholar] [CrossRef]
- Shi, W.J.; Lü, C.W.; He, J.; En, H.; Gao, M.S.; Zhao, B.Y.; Zhou, B.; Zhou, H.J.; Liu, H.L.; Zhang, Y. Nature differences of humic acids fractions induced by extracted sequence as explanatory factors for binding characteristics of heavy metals. Ecotoxicol. Environ. Saf. 2018, 154, 59–68. [Google Scholar] [CrossRef] [PubMed]
- Andreas, R.; Zhang, J. Characteristics of Adsorption Interactions of Cadmium(II) onto Humin from Peat Soil in Freshwater and Seawater Media. Bull. Environ. Contam. Toxicol. 2014, 92, 352–357. [Google Scholar] [CrossRef] [PubMed]
- Uchimiya, M.; Bannon, D.I.; Wartelle, L.H. Retention of Heavy Metals by Carboxyl Functional Groups of Biochars in Small Arms Range Soil. J. Agric. Food Chem. 2012, 60, 1798–1809. [Google Scholar] [CrossRef] [PubMed]
- Aravindhan, R.; Madhan, B.; Rao, J.R.; Nair, B.U.; Ramasami, T. Bioaccumulation of chromium from tannery wastewater: An approach for chrome recovery and reuse. Environ. Sci. Technol. 2004, 38, 300–306. [Google Scholar] [CrossRef]
- Brannon, W. The Infra-red Spectra of Complex Molecules. J. AOAC Int. 1977, 60, 1232. [Google Scholar] [CrossRef]
- Wenograd, J.; Spurr, R.A. Characteristic Integrated Intensities of Bands in the Infrared Spectra of Carboxylic Acids. J. Am. Chem. Soc. 1957, 79, 5844–5848. [Google Scholar] [CrossRef]
- Heacock, R.A.; Marion, L. The infrared spectra of secondary amines and their salts. Can. J. Chem.-Rev. Can. Chim. 1956, 34, 1782–1795. [Google Scholar] [CrossRef]
- Yang, T.; Hodson, M.E. Investigating the potential of synthetic humic-like acid to remove metal ions from contaminated water. Sci. Total Environ. 2018, 635, 1036–1046. [Google Scholar] [CrossRef]
- Zhang, J.; Li, A.; Wang, A. Superabsorbent composite. X. Effects of saponification on properties of polyacrylamide/attapulgite. Polym. Eng. Sci. 2006, 46, 1762–1767. [Google Scholar] [CrossRef]
- Singh, V.; Sharma, A.K.; Maurya, S. Efficient Cadmium(II) Removal from Aqueous Solution Using Microwave Synthesized Guar Gum-Graft-Poly(ethylacrylate). Ind. Eng. Chem. Res. 2009, 48, 4688–4696. [Google Scholar] [CrossRef]
- Peng, L.; Xu, Y.; Zhou, F.; Sun, B.R.; Tie, B.Q.; Lei, M.; Shao, J.H.; Gu, J.D. Enhanced removal of Cd(II) by poly(acrylamide-co-sodium acrylate) water-retaining agent incorporated nano hydrous manganese oxide. Mater. Des. 2016, 96, 195–202. [Google Scholar] [CrossRef]
- Amoyaw, P.A.; Williams, M.; Bu, X.R. The fast removal of low concentration of cadmium(II) from aqueous media by chelating polymers with salicylaldehyde units. J. Hazard. Mater. 2009, 170, 22–26. [Google Scholar] [CrossRef]
- Manju, G.N.; Krishnan, K.A.; Vinod, V.P.; Anirudhan, T.S. An investigation into the sorption of heavy metals from wastewaters by polyacrylamide-grafted iron(III) oxide. J. Hazard. Mater. 2002, 91, 221–238. [Google Scholar] [CrossRef]
- Johnson, R.D.; Arnold, F.H. The temkin isotherm describes heterogeneous protein adsorption. Biochim. Biophys. Acta-Protein Struct. Molec. Enzym. 1995, 1247, 293–297. [Google Scholar] [CrossRef]
- Wang, F.T.; Pan, Y.F.; Cai, P.X.; Guo, T.X.; Xiao, H.N. Single and binary adsorption of heavy metal ions from aqueous solutions using sugarcane cellulose-based adsorbent. Bioresour. Technol. 2017, 241, 482–490. [Google Scholar] [CrossRef] [PubMed]
- Allen, S.J.; McKay, G.; Porter, J.F. Adsorption isotherm models for basic dye adsorption by peat in single and binary component systems. J. Colloid Interface Sci. 2004, 280, 322–333. [Google Scholar] [CrossRef] [PubMed]


| Isotherm | Parameters | Sample | |
|---|---|---|---|
| OSAP | JSAP | ||
| Langmuir | |||
| Qm/(mg·g−1) | 770.037 ± 74.317 | 345.369 ± 43.306 | |
| KL/(L·mg−1) | 0.002 | 0.006 | |
| R2 | 0.977–0.997 | 0.966–0.996 | |
| Freundlich | |||
| KF/((mg·g−1)(L·mg−1)·n−1) | 3.426 ± 0.592 | 10.560 ± 1.754 | |
| n | 1.295 | 1.862 | |
| R2 | 0.970–0.970 | 0.935–0.935 | |
| Temkin | |||
| b/(KJ·mol−1) | 59.38 | 31.89 | |
| KT/(L·mg−1) | 5.75 | 3.53 | |
| R2 | 0.774–0.774 | 0.949–0.949 | |
| 3.226 ± 0.035 | −0.042 ± 0.001 | 288.15 | −7.728 | 0.349 | 26.821 | 0.998–0.999 | |
| 298.15 | −7.996 | ||||||
| 308.15 | −8.264 | ||||||
| 2.525 ± 0.004 | −0.020 ± 5.275 | 288.15 | −6.048 | 0.166 | 20.993 | 0.999–0.999 | |
| 298.15 | −6.258 | ||||||
| 308.15 | −6.468 |
| Kinetic Models | Parameters | Samples | |
|---|---|---|---|
| OSAP | JSAP | ||
| Pseudo-first-order parameters | Qe/(mg·g−1) | 210.114 ± 2.599 | 159.109 ± 2.368 |
| K1/(min−1) | 2.436 | 2.117 | |
| R12 | 0.302–0.380 | 0.369–0.439 | |
| Pseudo-second-order parameters | Qe/(mg·g−1) | 213.480 ± 2.034 | 162.486 ± 1.708 |
| K2/(g·mg−1·min−1) | 0.033 | 0.031 | |
| R22 | 0.684–0.719 | 0.761–0.787 | |
| Element | Functional Groups | OSAP | JSAP | OSAP-Cd | JSAP-Cd | ||||
|---|---|---|---|---|---|---|---|---|---|
| BE/eV | RI/% | BE/eV | RI/% | BE/eV | RI/% | BE/eV | RI/% | ||
| C 1s | C-C | 284.18 | 55.63 | 284.25 | 37.53 | 284.79 | 39.09 | 284.24 | 48.76 |
| C-O | 285.91 | 1.72 | 285.29 | 17.38 | 285.83 | 17.14 | 285.87 | 2.16 | |
| C=O | 287.39 | 9.22 | 287.59 | 7.01 | 288.13 | 12.95 | 287.43 | 10.54 | |
| O-C=O | 292.19 | 9.47 | 292.19 | 11.9 | 292.94 | 4.34 | 292.18 | 12.14 | |
| π-π* | 295.03 | 4.39 | 294.99 | 5.64 | 295.76 | 1.86 | 294.99 | 5.72 | |
| O 1s | C-O | 531.18 | 9.82 | 531.26 | 11.68 | 531.06 | 3.5 | 531.26 | 11.76 |
| C-OH | 530.34 | 3.32 | 530.33 | 3.59 | 531.67 | 15.9 | 530.33 | 3.62 | |
| C-O | 531.93 | 6.43 | 532.06 | 5.27 | 532.67 | 5.22 | 532.06 | 5.31 |
| Name of the Adsorbent | pH | Initial Cd(II) Concentration L−1) | Max Adsorption Capacity g−1) | Reaction Conditions | Reference |
|---|---|---|---|---|---|
| Microwave synthesized guar gum-graft-poly (ethylacrylate) | 9.0 | 100 | 714.28 | Temperature = 30 ± 2 °C Contact time = 16 h Dose = 50 g | https://doi.org/10.1021/ie801416z (accessed on 10 June 2024) [36] |
| The hydrous manganese oxide poly (acrylamide-co-sodiumacrylate) (PPM) | 6.0 | 100 | 698 | Temperature = 25 °C Contact time = 2 h Dose = 20 mg | https://doi.org/10.1016/j.matdes.2016.02.025 (accessed on 10 June 2024) [37] |
| Poly(acrylamide-co-sodium acrylate) (PP) | 6.0 | 100 | 281 | Temperature = 25 °C Contact time = 2 h Dose = 20 mg | https://doi.org/10.1016/j.matdes.2016.02.025 (accessed on 10 June 2024) [37] |
| Conventionally synthesized guar gum-graft-poly (ethylacrylate) | 9.0 | 100 | 270.27 | Temperature = 30 ± 2 °C Contact time = 16 h Dose = 50 g | https://doi.org/10.1021/ie801416z (accessed on 10 June 2024) [36] |
| Poly[4-(4-vinylbenzyloxy)-2-hydrobenzaldehyde] (PVBH) | 5.5 | 0.1–2.0 | 250 | – | https://doi.org/10.1016/j.jhazmat.2009.05.028 (accessed on 10 June 2024) [38] |
| Polyacrylamide-grafted iron(III) oxide | 6.0 | 50–200 | 147.2 | Temperature = 30 ± 8 °C Dose = 0.2 gL−1 | https://doi.org/10.1016/S0304-3894(01)00392-2 (accessed on 10 June 2024) [39] |
| OSAP/JSAP | 5.5 | 100 | 770/345 | This research | This research |
| Name | Price per Ton | Reference Links |
|---|---|---|
| Attapulgite | USD 41.40–69.00 | https://doi.org/10.1016/j.cej.2023.141404 https://www.made-in-china.com/products-search/hot-china-products/Attapulgite_Clay.html URL (1 June 2024) |
| Acrylamide | USD 1104.00–1379.00 | https://www.made-in-china.com/products-search/hot-china-products/Acrylamide.html URL (1 June 2024) |
| SAP | USD 2484.00–8280.00 | https://www.made-in-china.com/products-search/hot-china-products/Superabsorbentpolmer.html URL (1 June 2024) |
| OSAP | USD 1794.00–2070.00 | http://show.guidechem.com/lhk1981/ URL (1 June 2024) |
| JSAP | USD 3450.00–4140.00 | http://watersap.com/ URL (1 June 2024) |
Disclaimer/Publisher’s Note: The statements, opinions and data contained in all publications are solely those of the individual author(s) and contributor(s) and not of MDPI and/or the editor(s). MDPI and/or the editor(s) disclaim responsibility for any injury to people or property resulting from any ideas, methods, instructions or products referred to in the content. |
© 2024 by the authors. Licensee MDPI, Basel, Switzerland. This article is an open access article distributed under the terms and conditions of the Creative Commons Attribution (CC BY) license (https://creativecommons.org/licenses/by/4.0/).
Share and Cite
Cai, Z.; Zhan, F.; Wang, Y.; Wu, M.; Kong, L.; Wang, A.; Huang, Z. Study on Adsorption Characteristics and Water Retention Properties of Attapulgite–Sodium Polyacrylate and Polyacrylamide to Trace Metal Cadmium Ion. Polymers 2024, 16, 1756. https://doi.org/10.3390/polym16121756
Cai Z, Zhan F, Wang Y, Wu M, Kong L, Wang A, Huang Z. Study on Adsorption Characteristics and Water Retention Properties of Attapulgite–Sodium Polyacrylate and Polyacrylamide to Trace Metal Cadmium Ion. Polymers. 2024; 16(12):1756. https://doi.org/10.3390/polym16121756
Chicago/Turabian StyleCai, Ziming, Feng Zhan, Yingnan Wang, Meiling Wu, Lingjian Kong, An Wang, and Zhanbin Huang. 2024. "Study on Adsorption Characteristics and Water Retention Properties of Attapulgite–Sodium Polyacrylate and Polyacrylamide to Trace Metal Cadmium Ion" Polymers 16, no. 12: 1756. https://doi.org/10.3390/polym16121756
APA StyleCai, Z., Zhan, F., Wang, Y., Wu, M., Kong, L., Wang, A., & Huang, Z. (2024). Study on Adsorption Characteristics and Water Retention Properties of Attapulgite–Sodium Polyacrylate and Polyacrylamide to Trace Metal Cadmium Ion. Polymers, 16(12), 1756. https://doi.org/10.3390/polym16121756