
Thermomechanical Material Characterization of Polyethylene Terephthalate Glycol with 30% Carbon Fiber for Large-Format Additive Manufacturing of Polymer Structures

 , ,
, ,
Abstract
1. Introduction
2. Materials and Methods
2.1. The High Output Research Printer (THOR)
2.2. Print Material
2.2.1. TGA
2.3. Sample Printing and Preparation
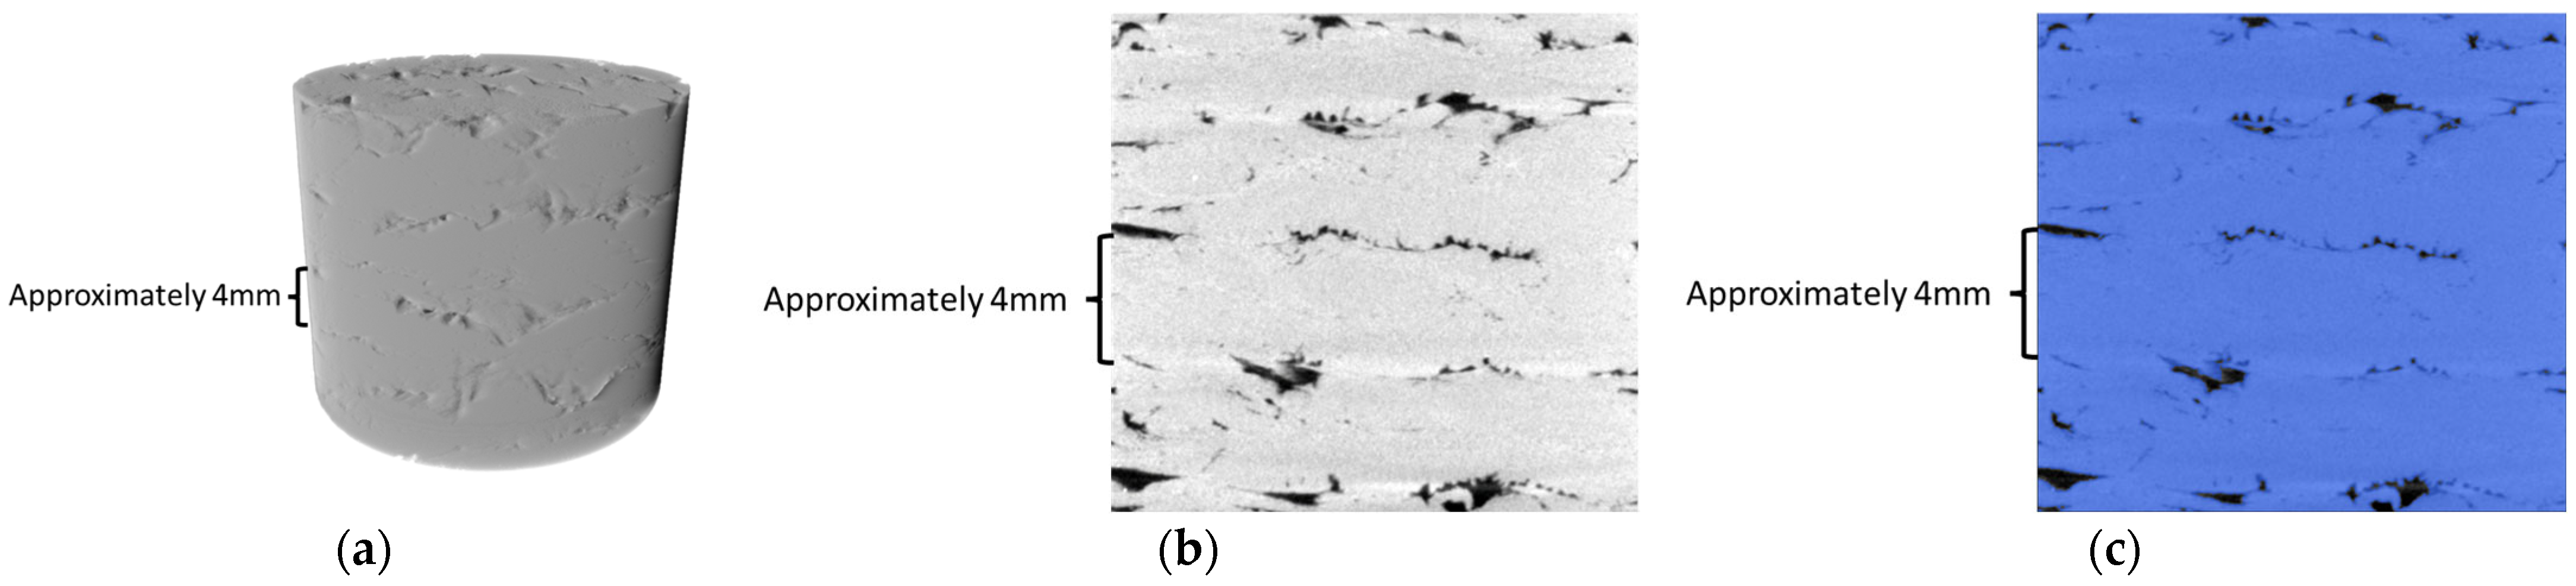
2.4. Porosity and XRM
2.5. DSC
2.6. DMA
2.7. Rheology
2.8. Flexural Testing
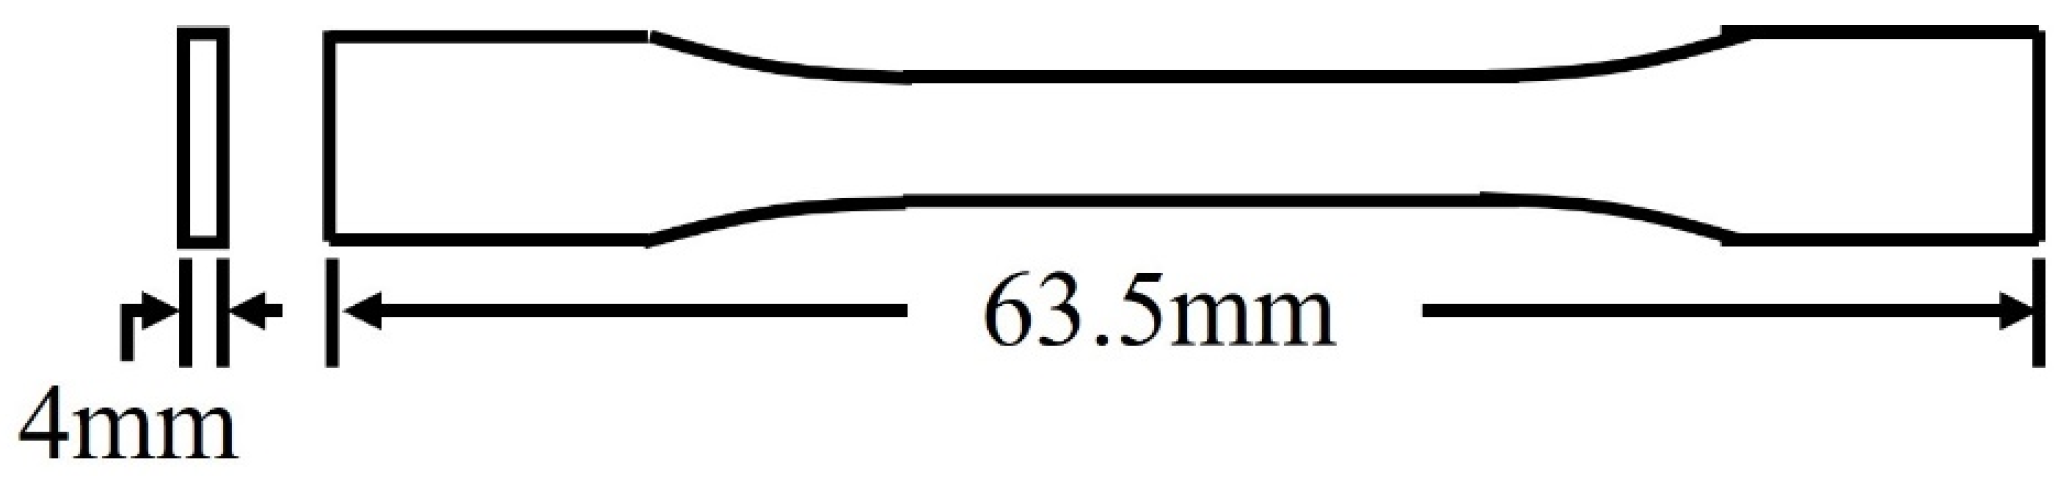
2.9. Tensile Testing
3. Results and Discussion
3.1. TGA to Determine CF Content of PETG
3.2. Porosity and XRM
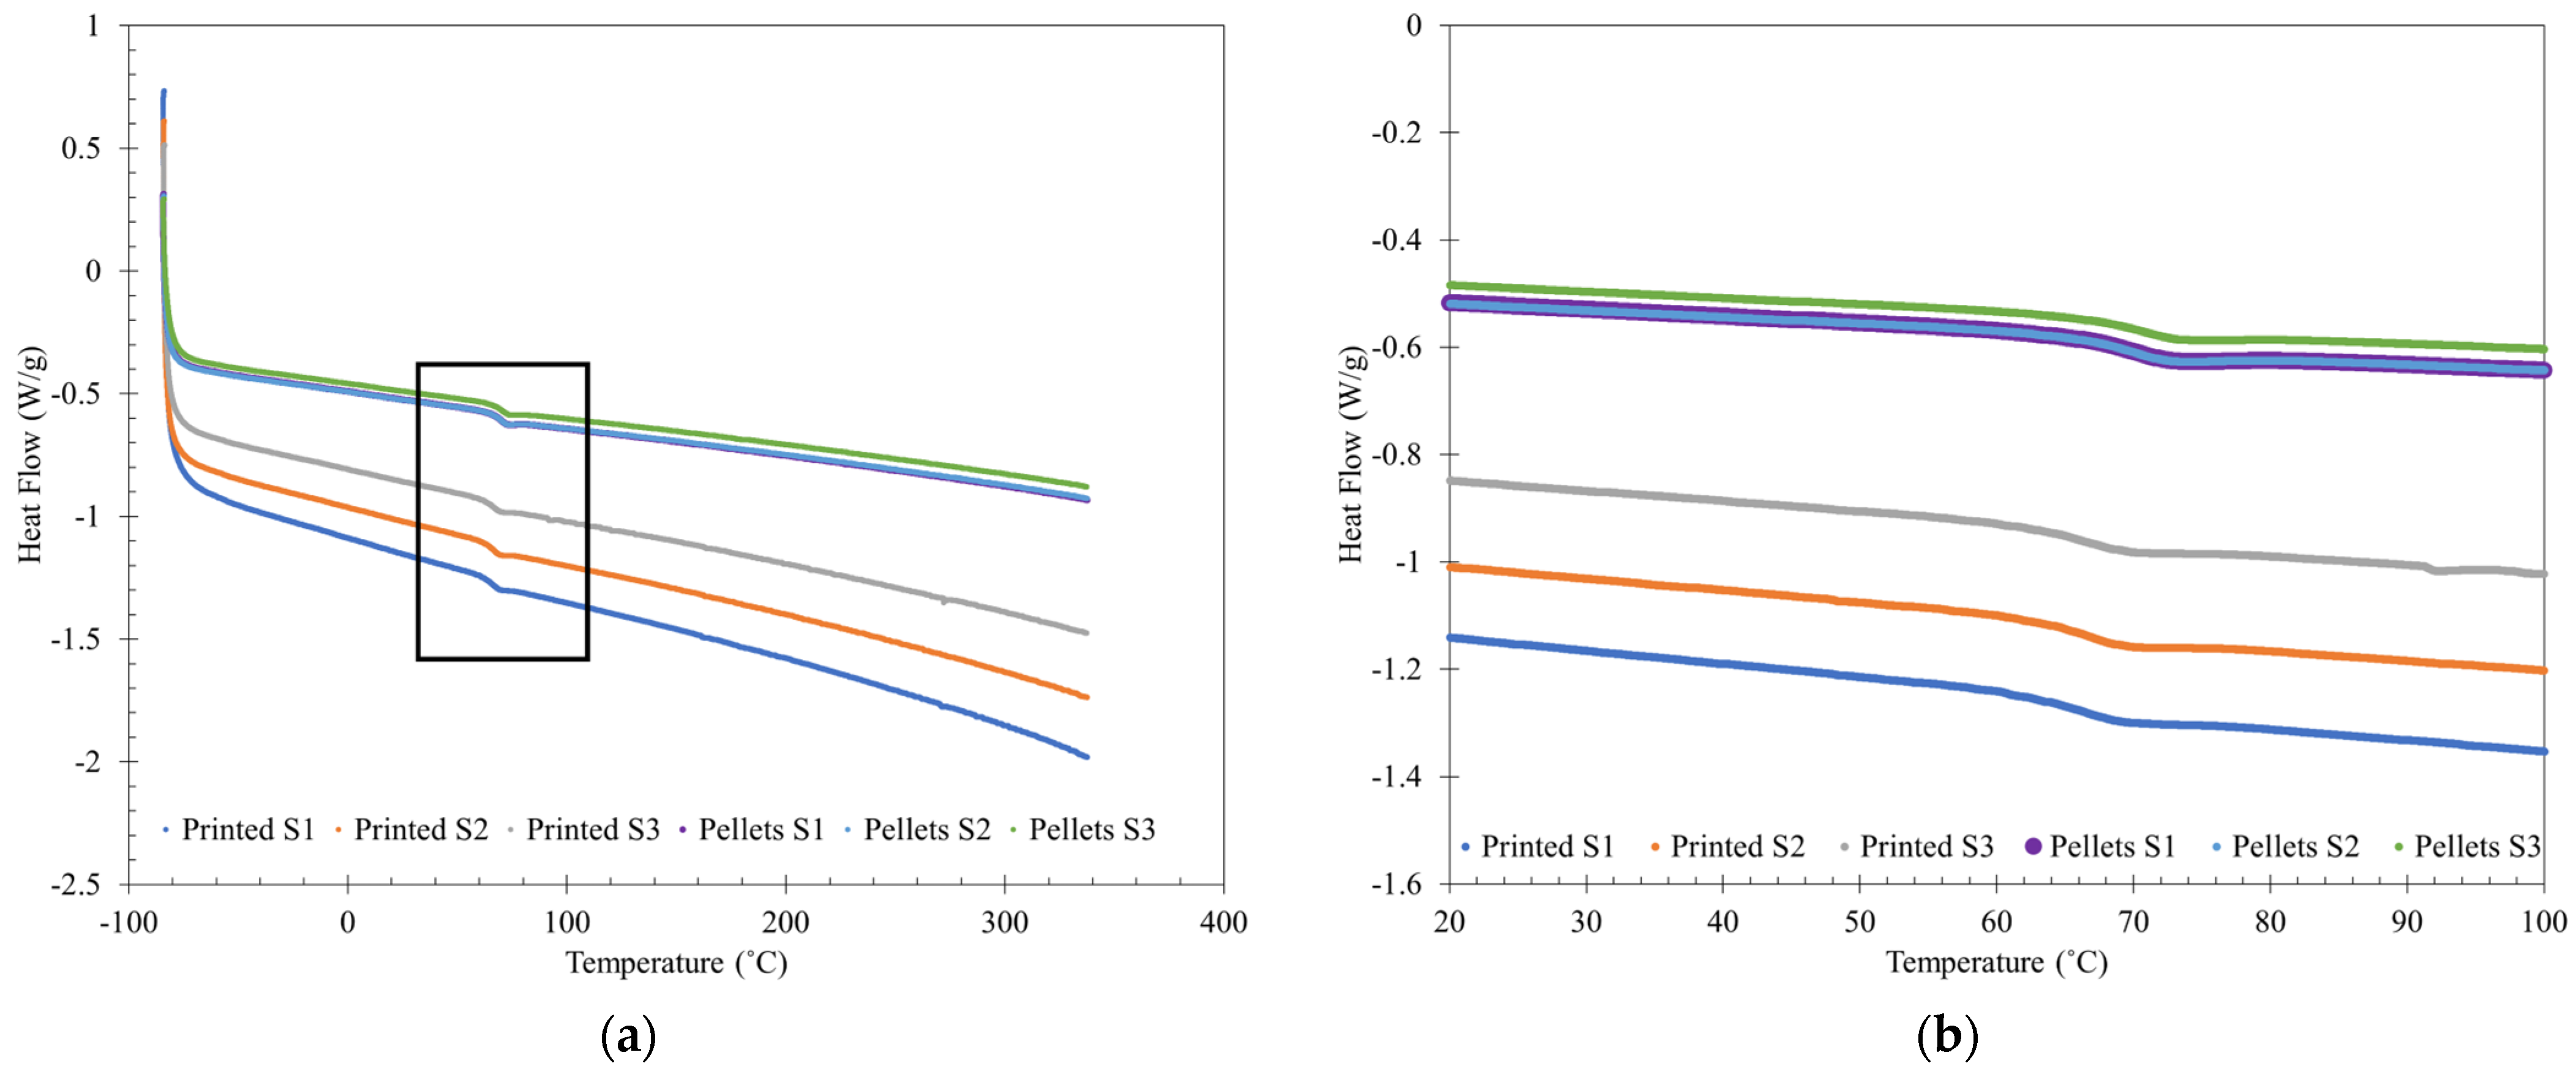
3.3. DSC Results
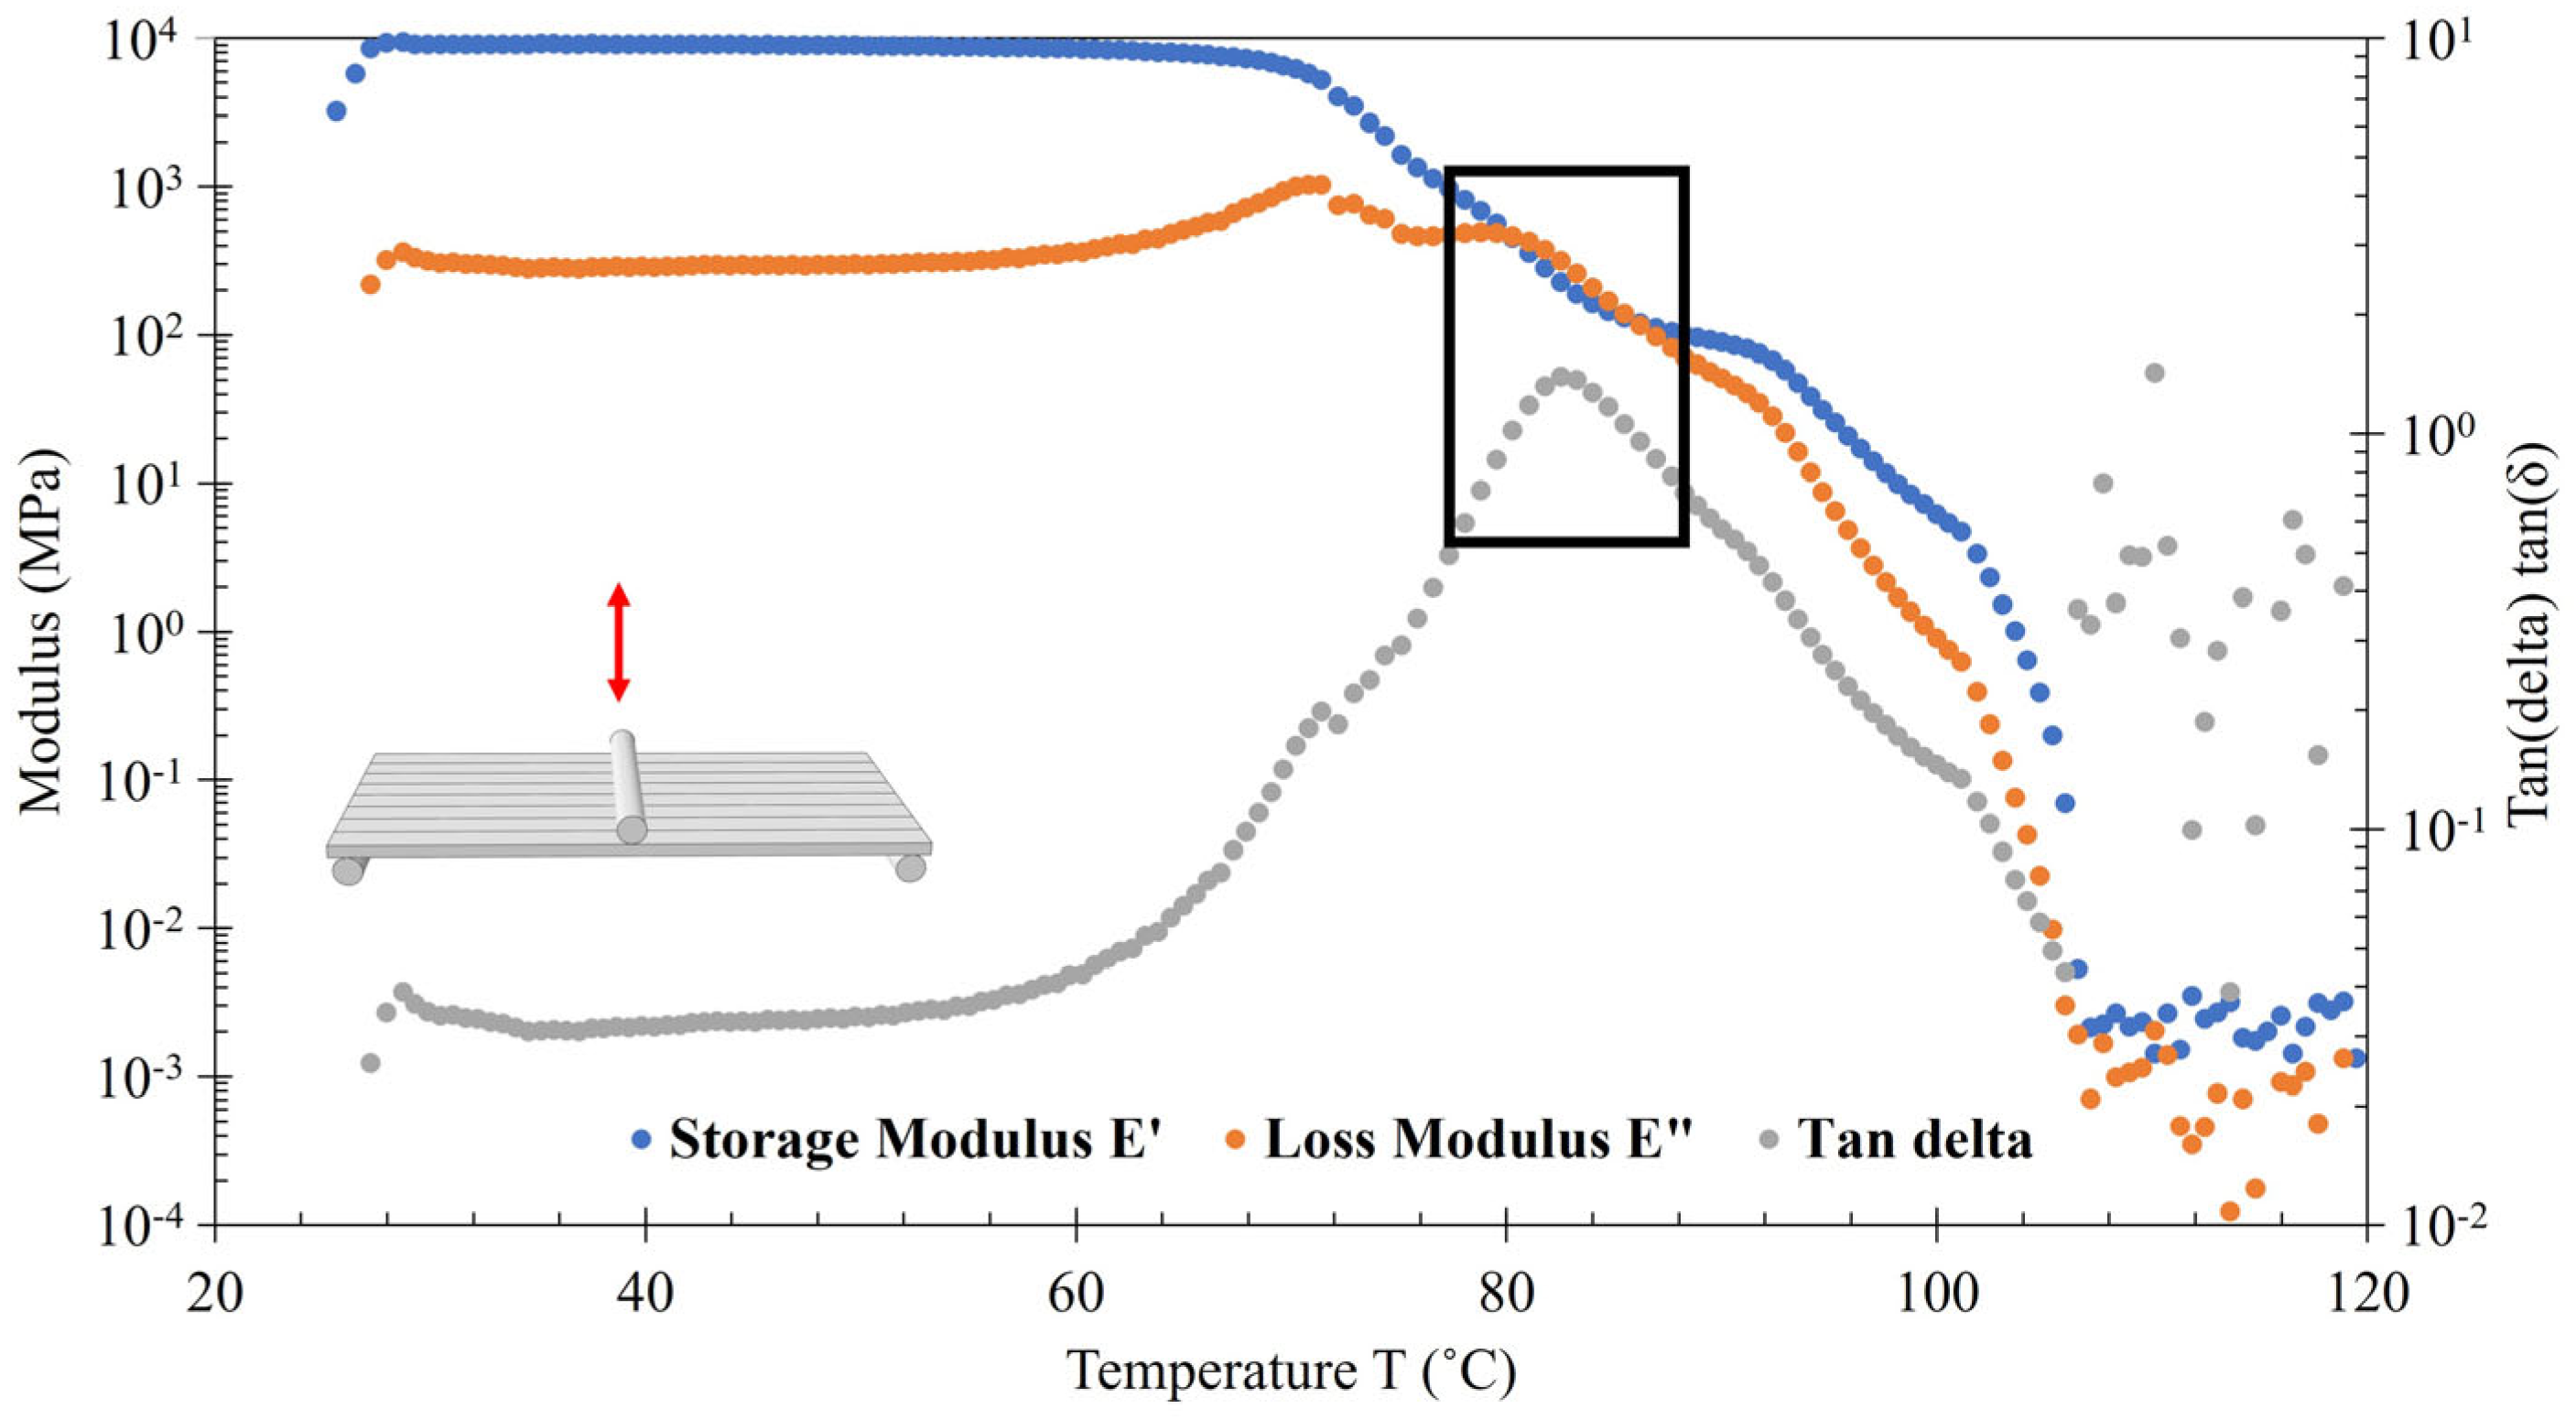
3.4. DMA Results
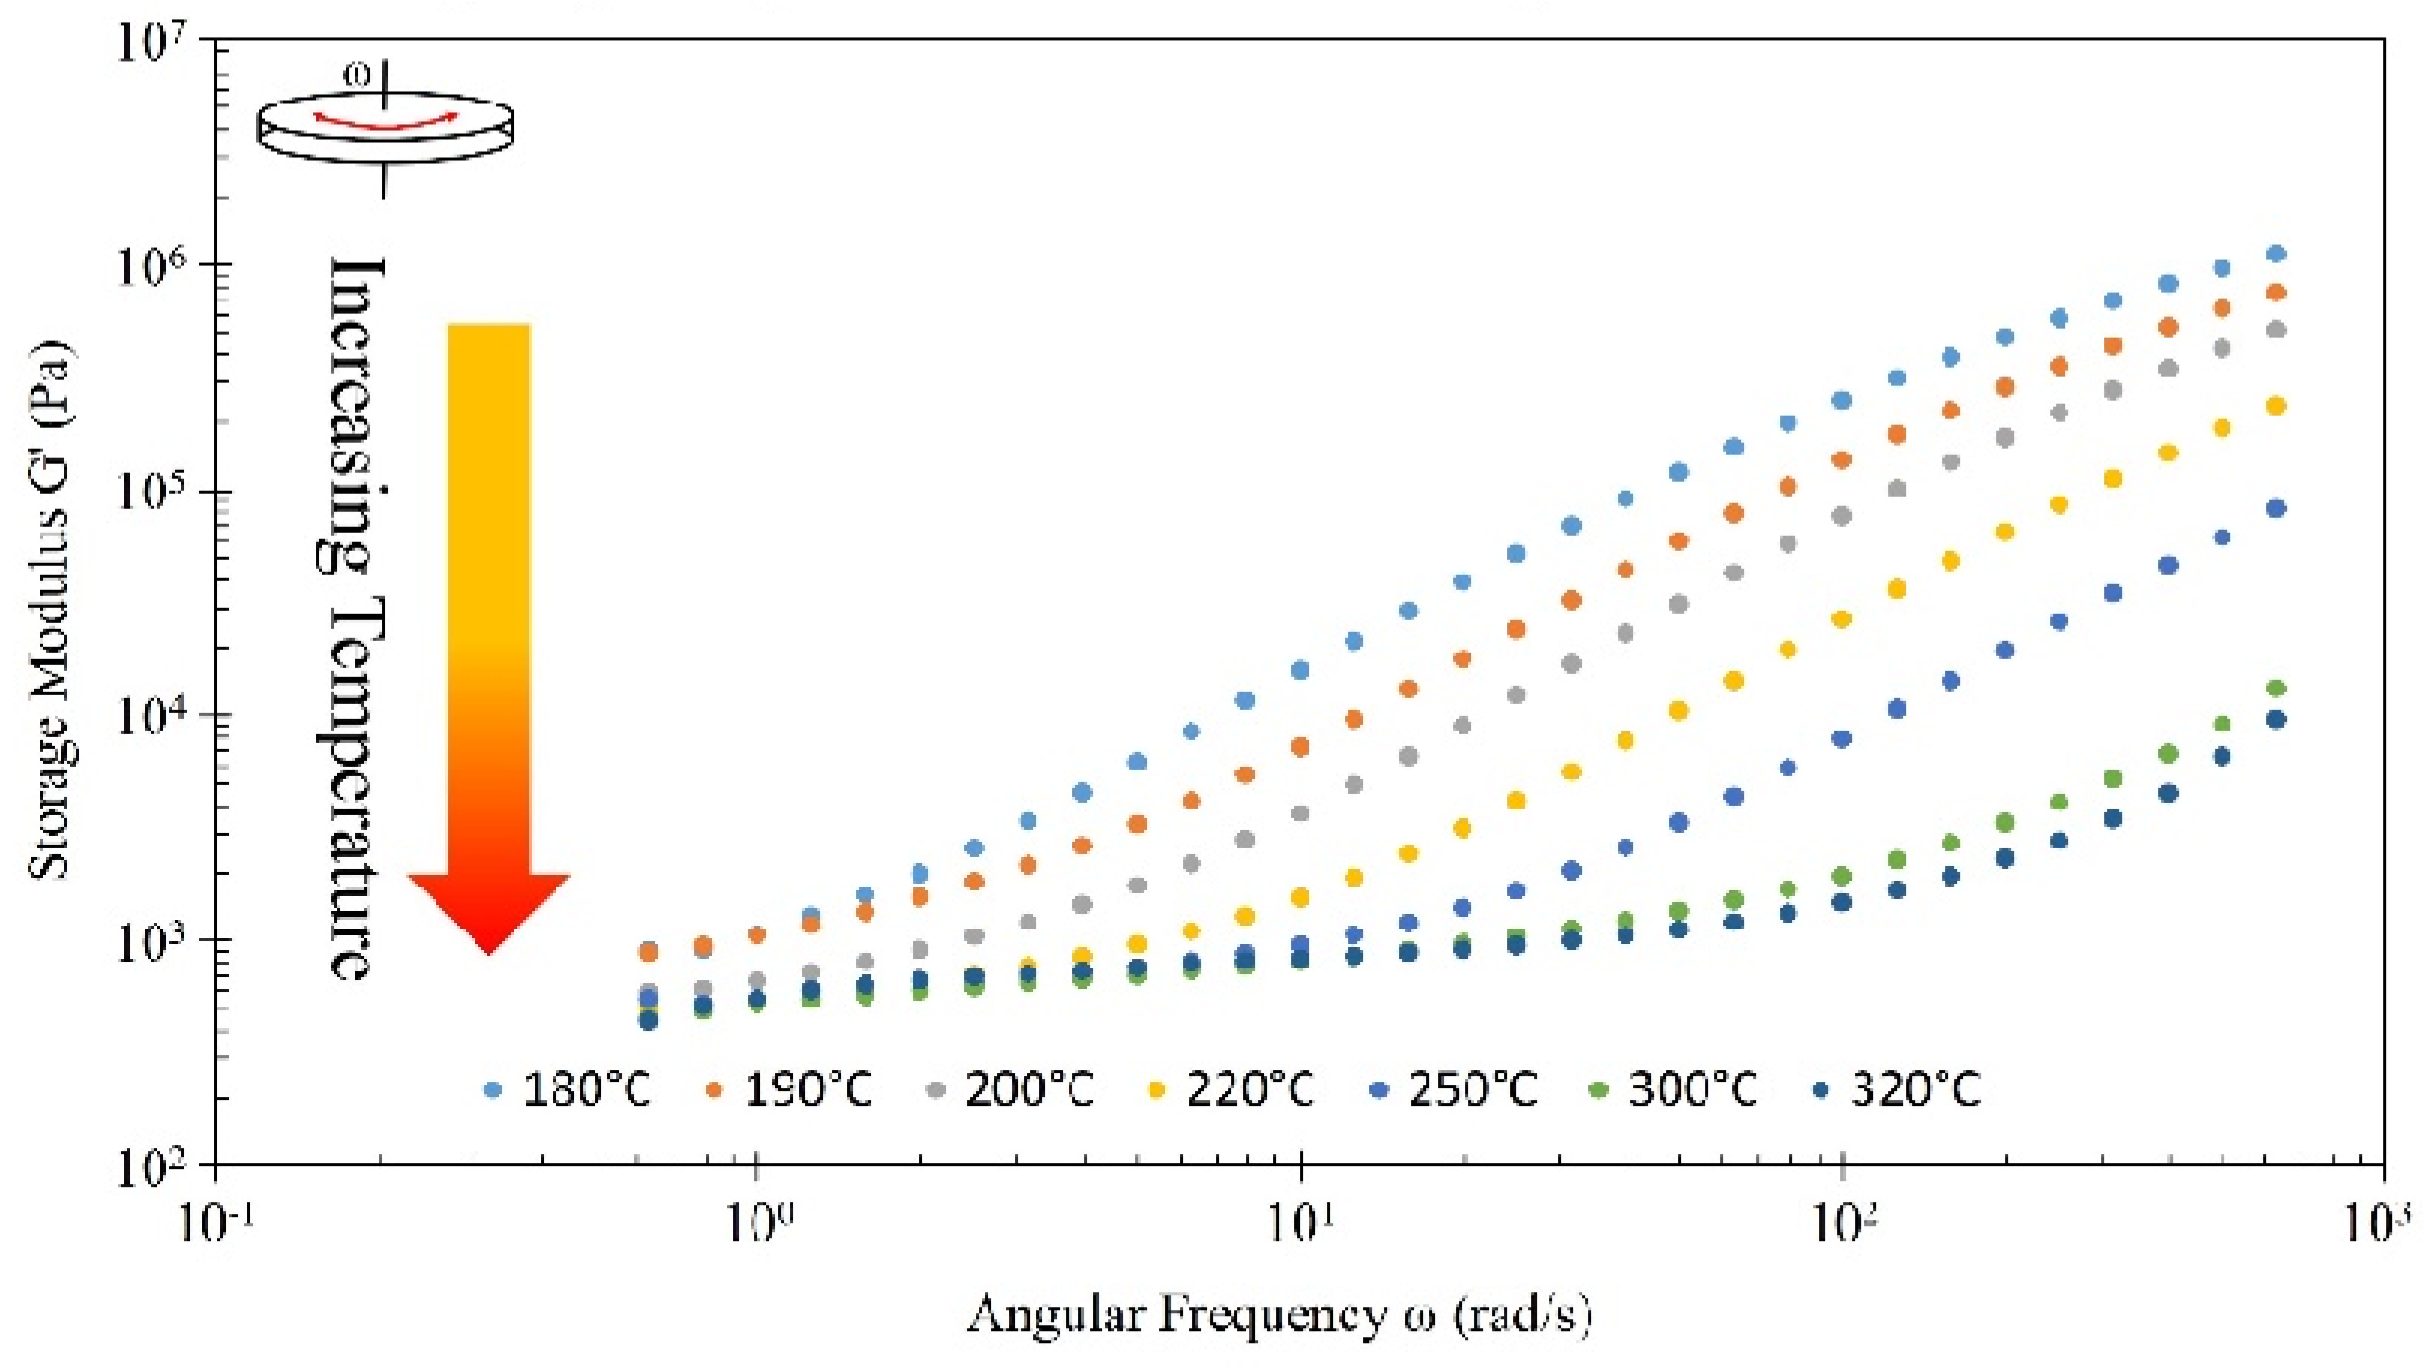
3.5. Rheology Results
3.6. Flexural Results
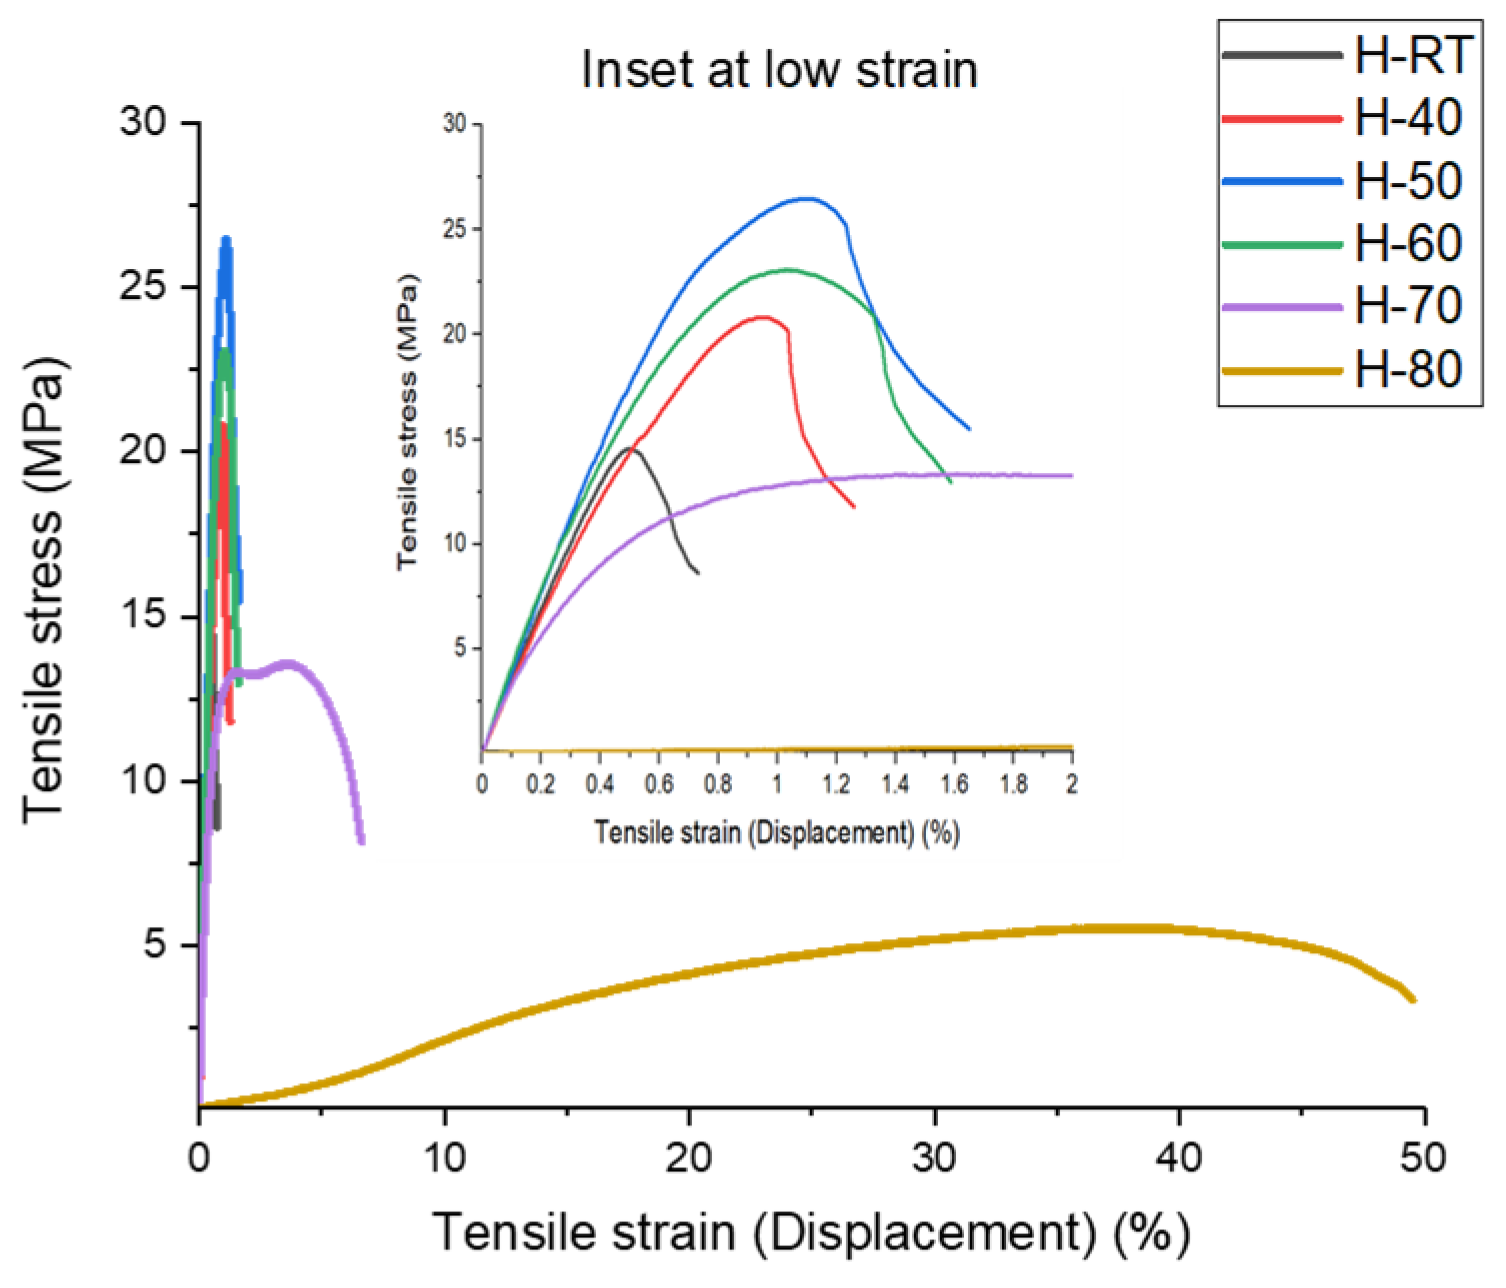
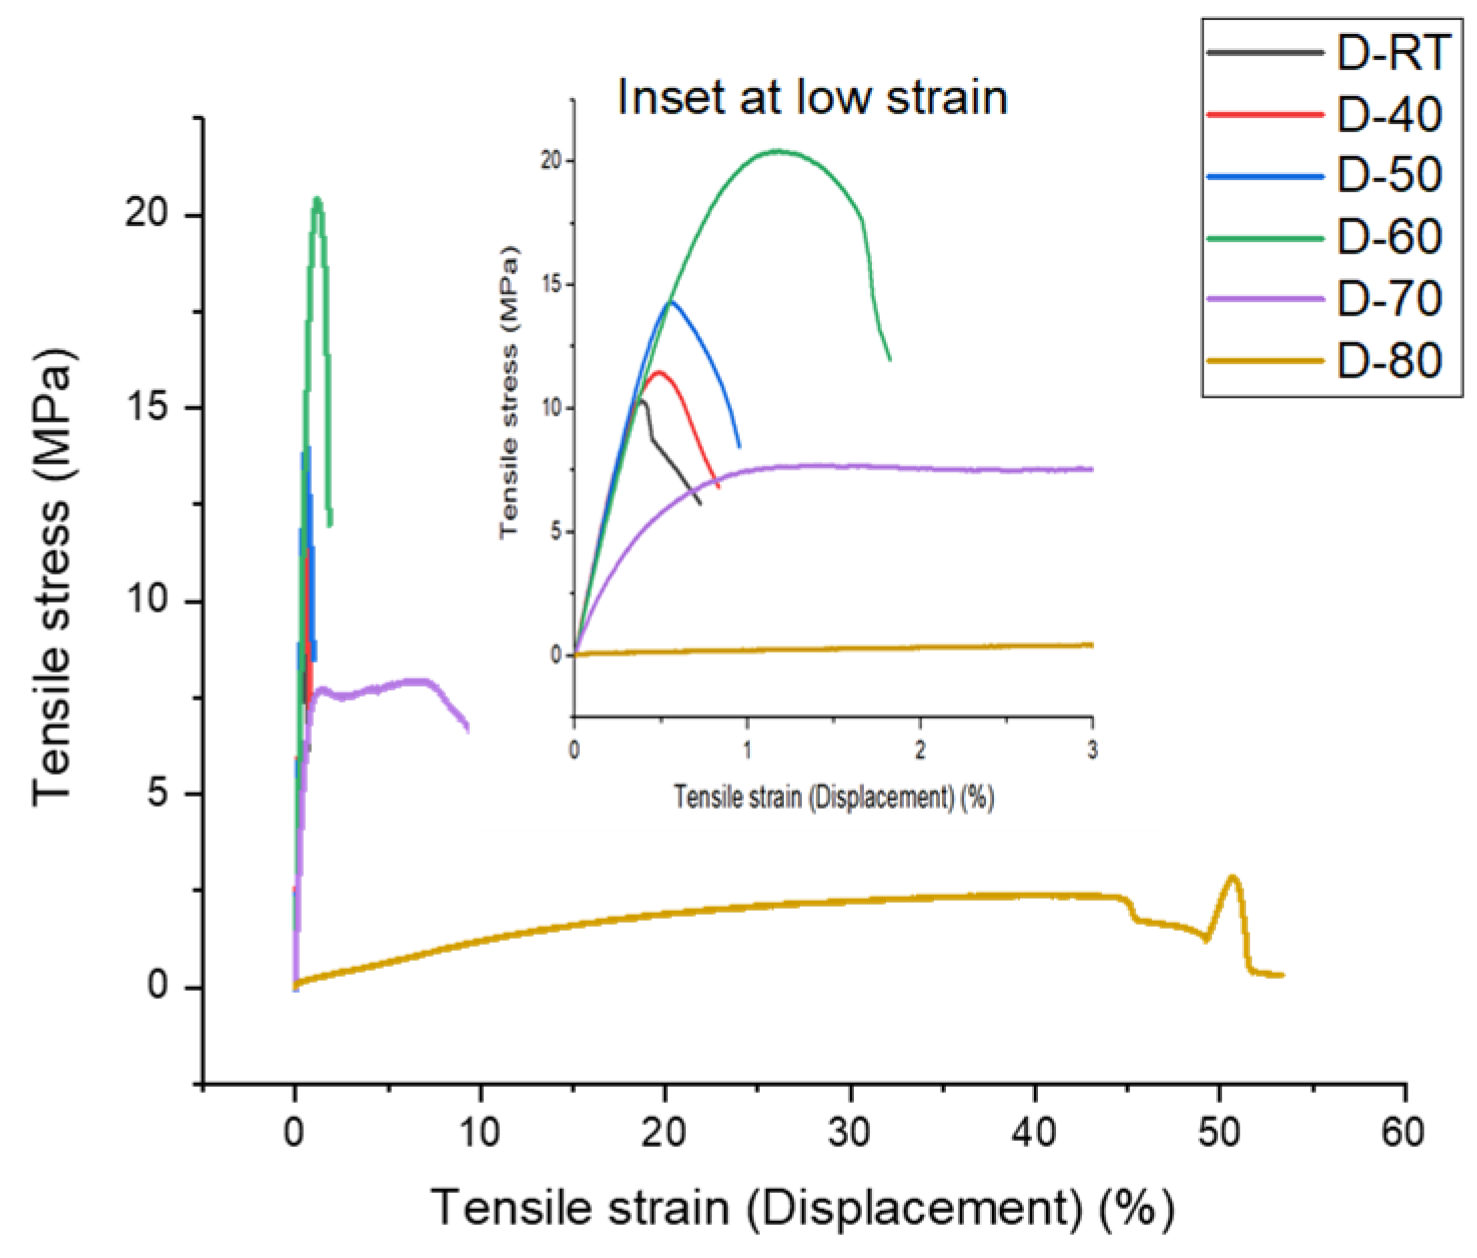
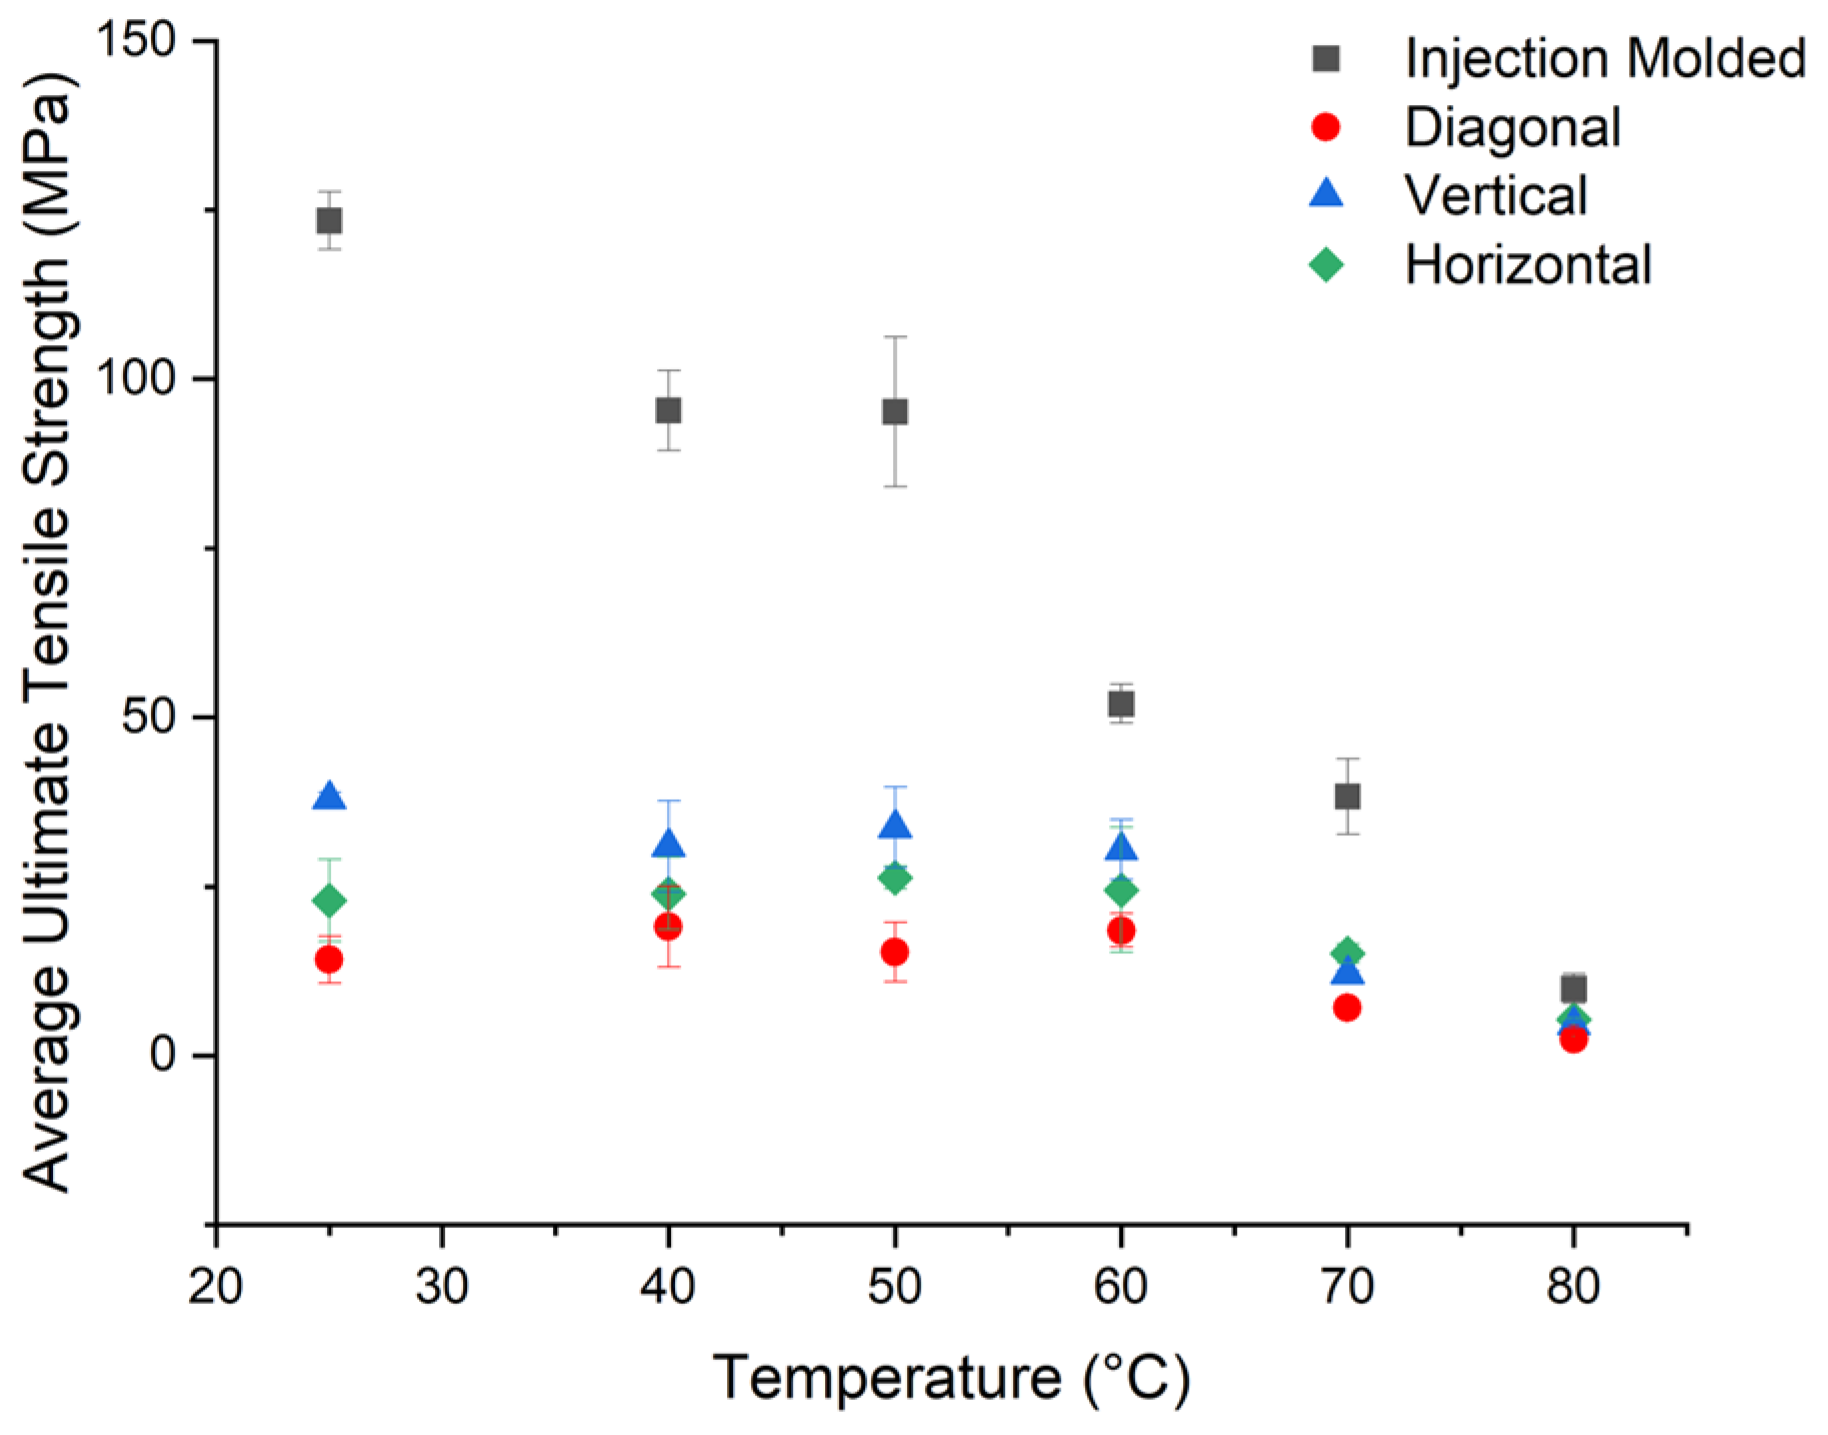
3.7. Tensile Results
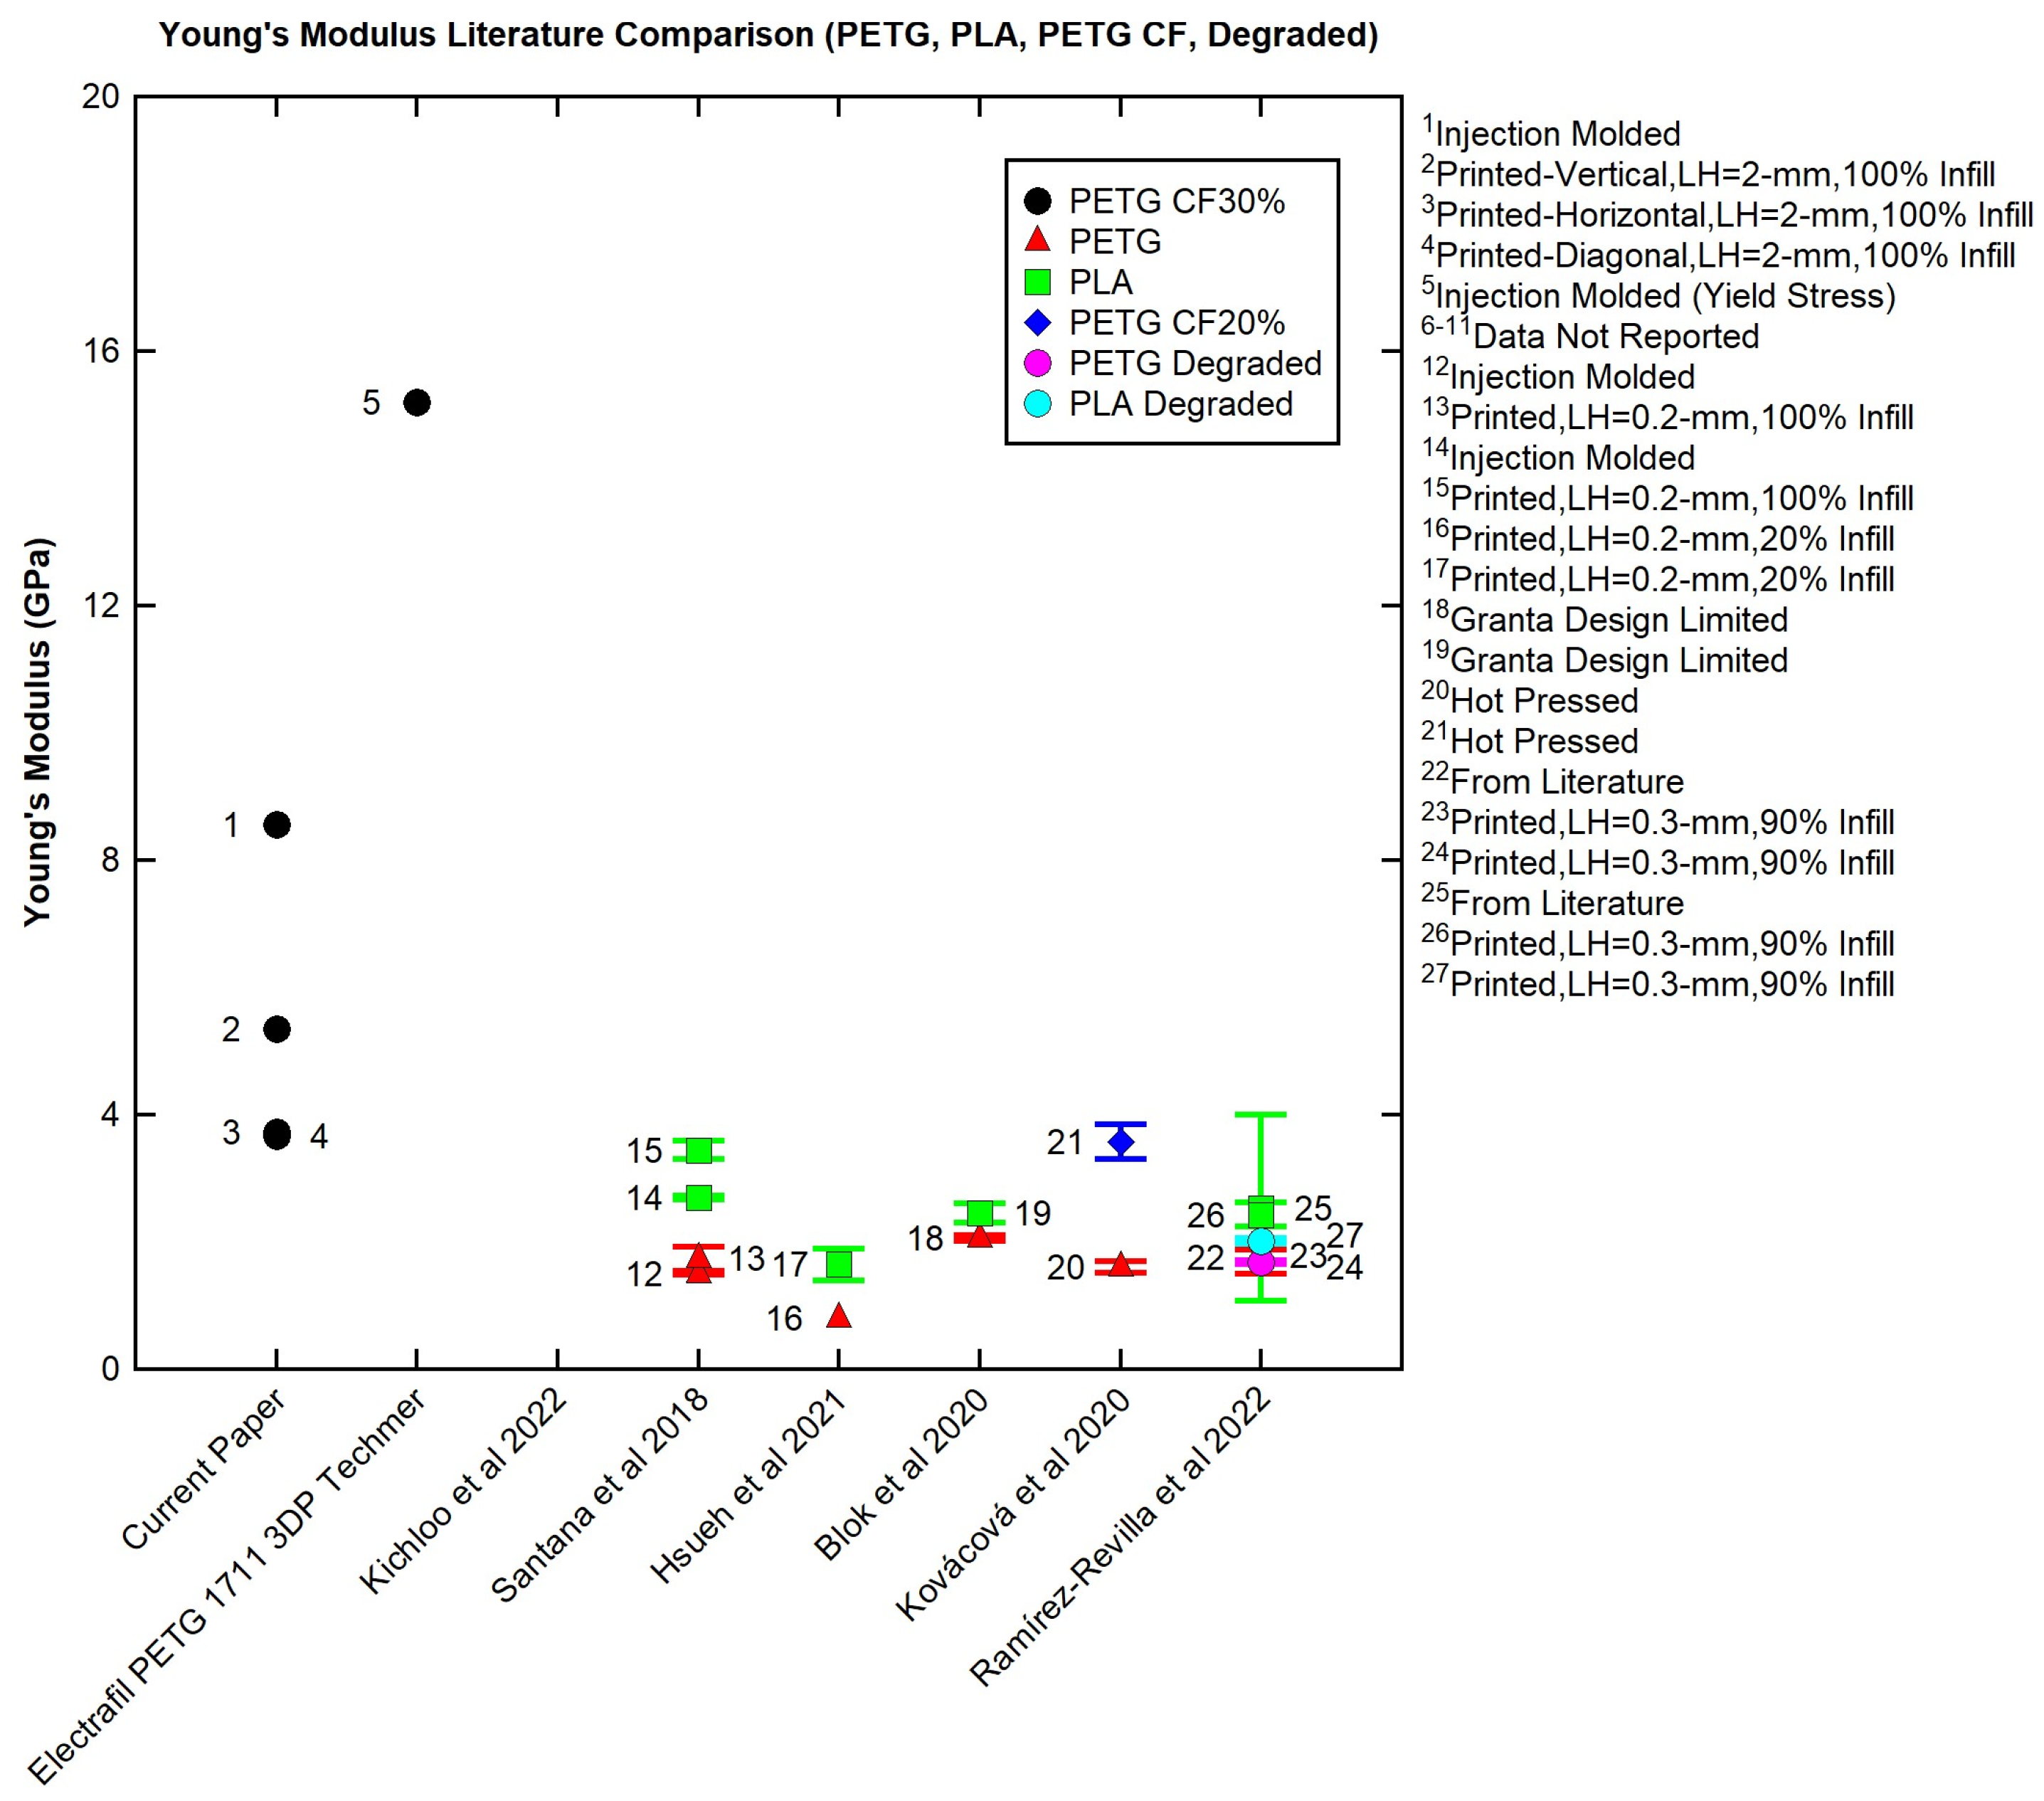
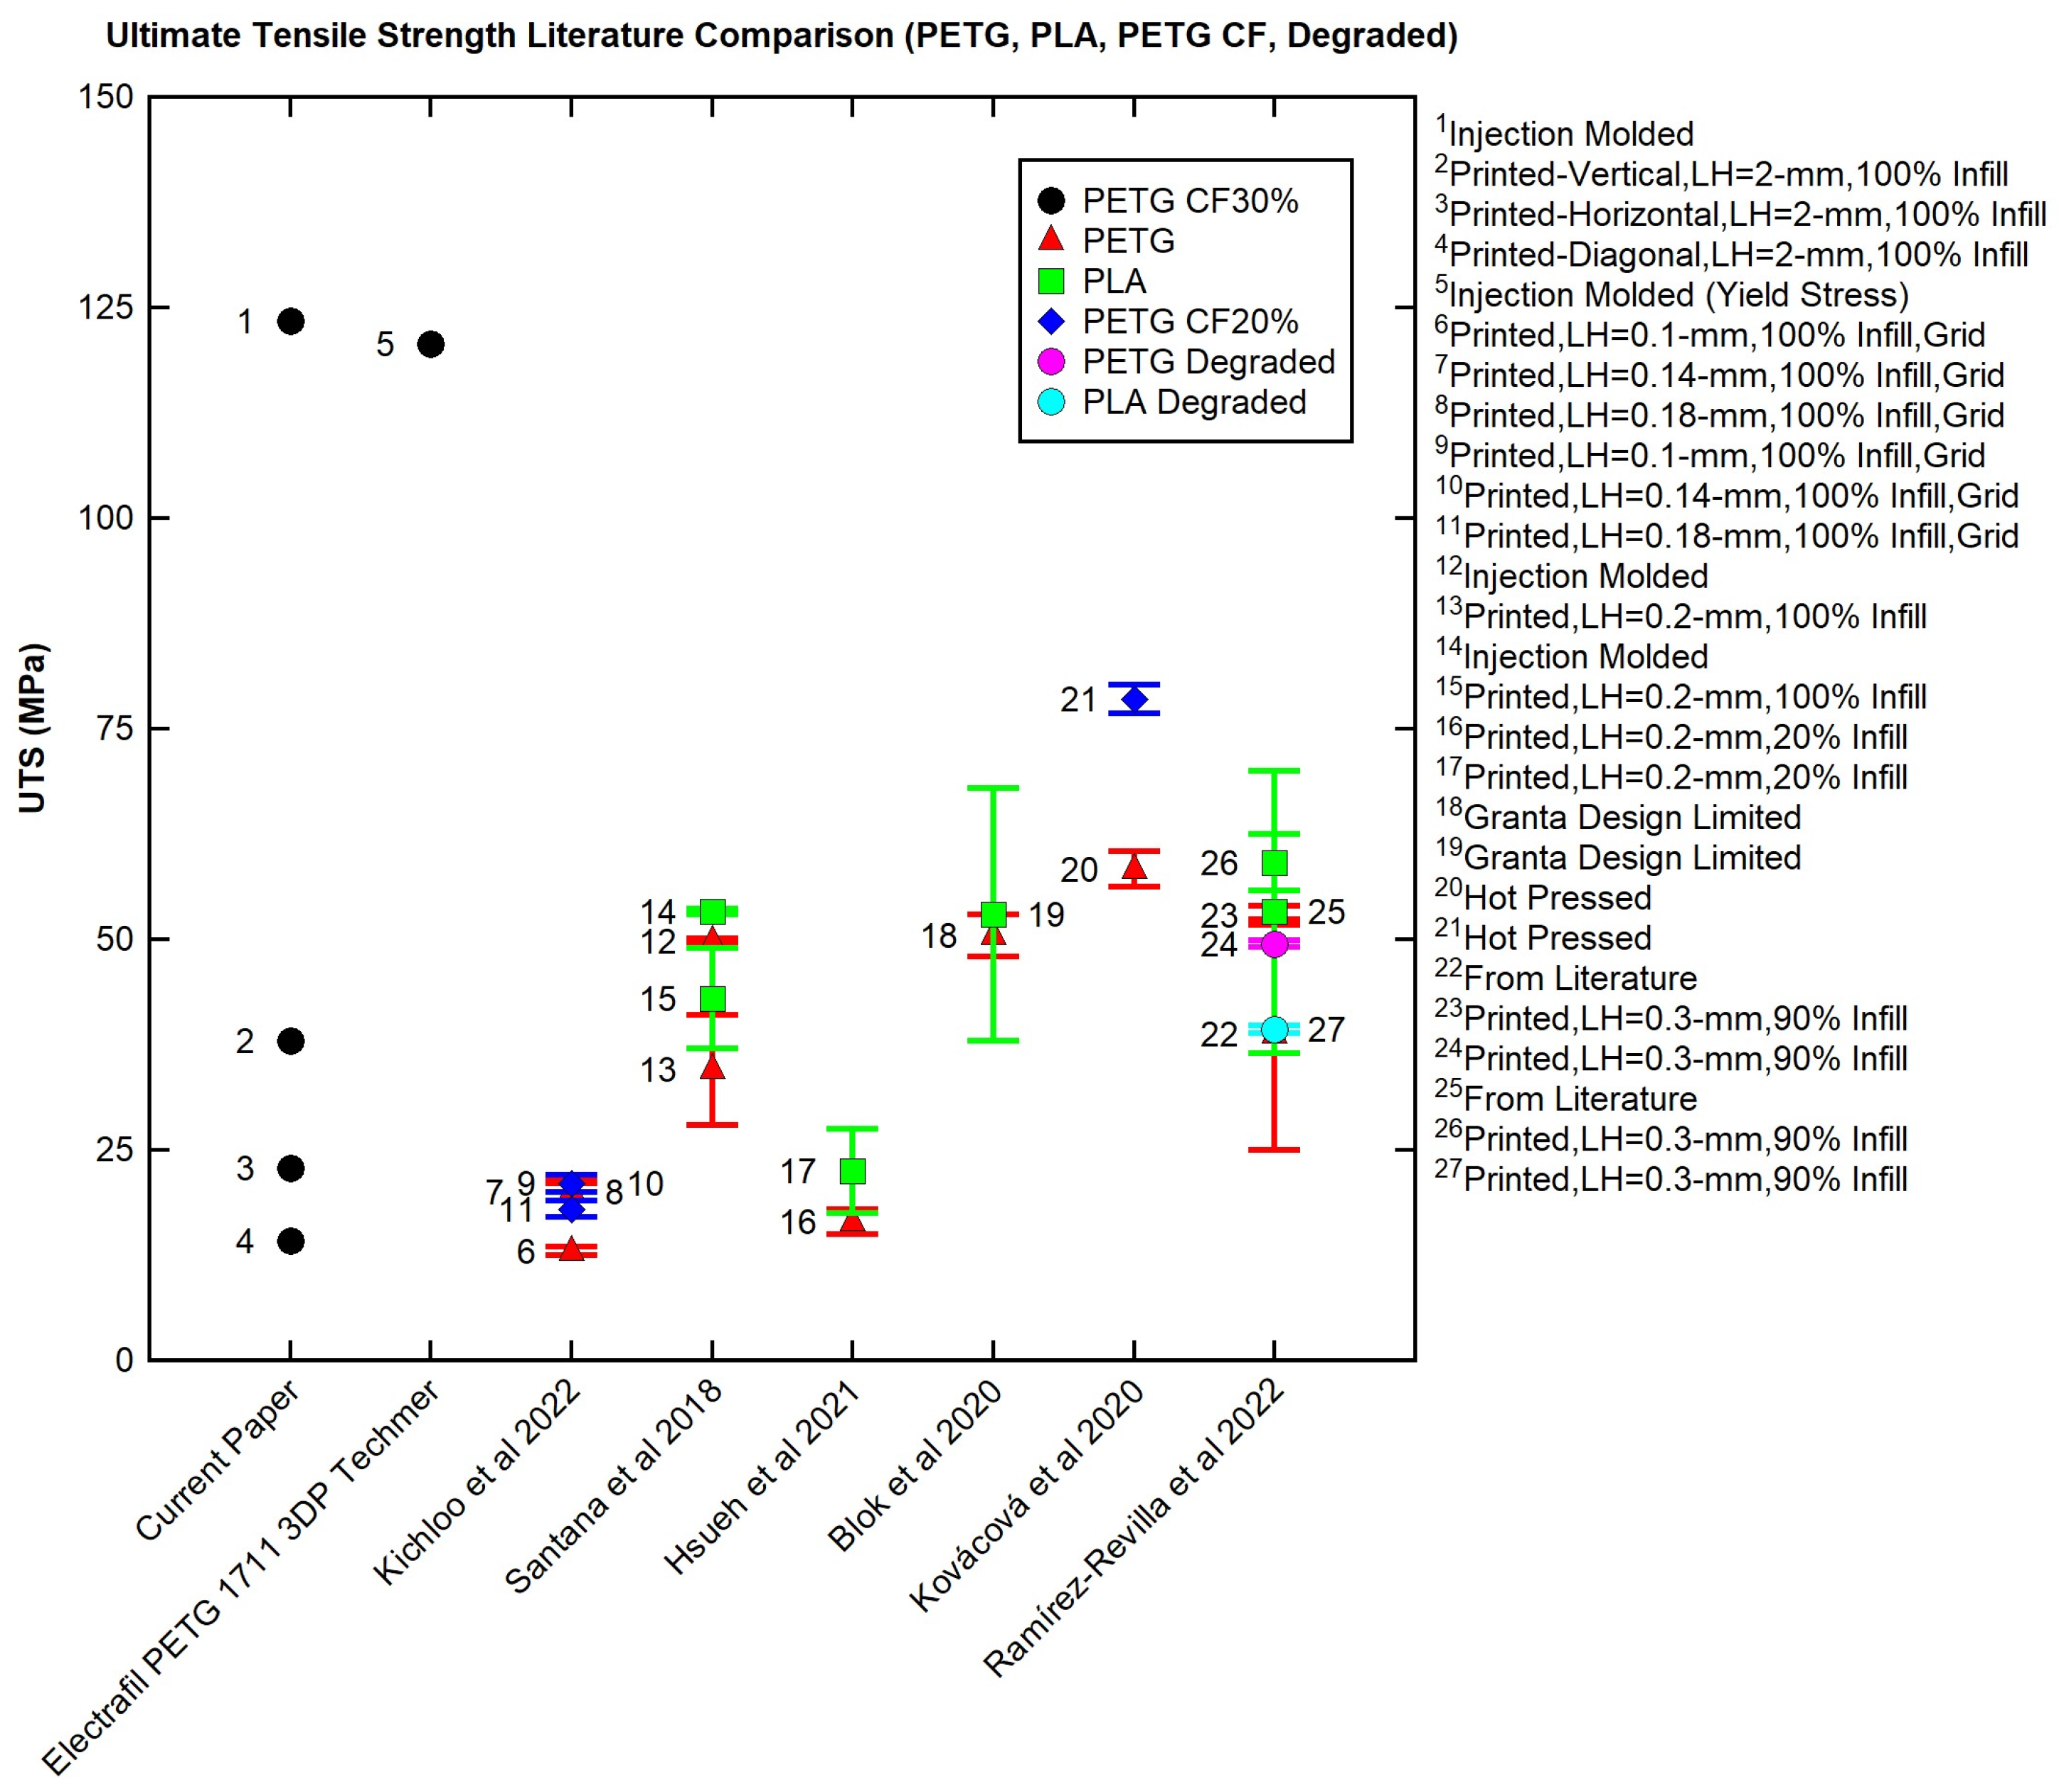
3.8. PETG and PETG CF Ultimate Tensile Strength Comparison
4. Conclusions
- TGA determined that the degradation temperature was ~405 °C. The carbon fiber content was 30%.
- Over-extrusion of dried PETG CF30% in Panel II had an average void space of 1.63%.
- DSC determined that undried PETG CF30% pellets (~69 °C) and printed undried PETG CF30% (~65 °C) had similar Tg values.
- The DMA results showed that Tg was not greatly affected by material drying, panel type (I vs. II), or the direction that the panel was taken from (horizontal, vertical, or diagonal).
- The results shown in Table 5 demonstrate that the direction from which a printed sample is taken has little effect on Tg, indicating that the thermal properties across the sample are very similar. There is little effect based on directionality.
- PETG CF30% exhibits shear thinning around printing temperature (220–250 °C), a good quality for a printing feedstock.
- All flexural samples, regardless of direction, showed a decreased flexural strength and flexural modulus when compared to the data in the Techmer data sheet. The data variability is likely due to void space variation and location on the print (infill vs. perimeter).
- There was a decrease in Young’s modulus and strength for 3D-printed and injection-molded samples when Tg was reached. Injection-molded samples have greater tensile strength across all temperatures when compared to 3D-printed samples. Injection-molded samples have greater tensile modulus until 80 °C.
- For the literature comparison, injection-molded PETG CF30% has the greatest tensile strength. PETG CF30% 3D-printed in all directions has similar or less tensile strength when compared to PETG printed on desktop printers. The difference is likely due to cutting the samples out of the panel, which opened stress concentrations on the edge of the sample, the lack of printed perimeter, and differences in scaling between desktop and mid-sized LFAM printing.
- For LFAM, material and print parameters must be considered. Additionally, bead–layer–print structure should be used to compare LFAM data. Finally, testing method affects reported results.
Author Contributions
Funding
Institutional Review Board Statement
Data Availability Statement
Acknowledgments
Conflicts of Interest
Appendix A. PETG CF30% Tensile Graphs

References
- ISO/ASTM 52927:2024; Additive Manufacturing: General Principles Part 3: Main Characteristics and Corresponding Test Methods. ISO: Geneva, Switzerland, 2014.
- Kichloo, A.F.; Raina, A.; Haq, M.I.U.; Wani, M.S. Impact of Carbon Fiber Reinforcement on Mechanical and Tribological Behavior of 3D-Printed Polyethylene Terephthalate Glycol Polymer Composites—An Experimental Investigation. J. Mater. Eng. Perform. 2022, 31, 1021–1038. [Google Scholar] [CrossRef]
- Tao, Y.; Kong, F.; Li, Z.; Zhang, J.; Zhao, X.; Yin, Q.; Xing, D.; Li, P. A Review on Voids of 3D Printed Parts by Fused Filament Fabrication. J. Mater. Res. Technol. 2021, 15, 4860–4879. [Google Scholar] [CrossRef]
- Blok, L.G.; Longana, M.L.; Woods, B.K.S. Fabrication and Characterisation of Aligned Discontinuous Carbon Fibre Reinforced Thermoplastics as Feedstock Material for Fused Filament Fabrication. Materials 2020, 13, 4671. [Google Scholar] [CrossRef]
- Ramírez-Revilla, S.; Camacho-Valencia, D.; Gonzales-Condori, E.G.; Márquez, G. Evaluation and Comparison of the Degradability and Compressive and Tensile Properties of 3D Printing Polymeric Materials: PLA, PETG, PC, and ASA. MRS Commun. 2023, 13, 55–62. [Google Scholar] [CrossRef]
- Quintana, J.L.C.; Slattery, L.; Pinkham, J.; Keaton, J.; Lopez-Anido, R.A.; Sharp, K. Effects of Fiber Orientation on the Coefficient of Thermal Expansion of Fiber-Filled Polymer Systems in Large Format Polymer Extrusion-Based Additive Manufacturing. Materials 2022, 15, 2764. [Google Scholar] [CrossRef]
- Shah, J.; Snider, B.; Clarke, T.; Kozutsky, S.; Lacki, M.; Hosseini, A. Large-Scale 3D Printers for Additive Manufacturing Design Considerations and Challenges. Int. J. Adv. Technol. 2019, 104, 3679–3693. [Google Scholar] [CrossRef]
- Vicente, C.M.S.; Sardinha, M.; Reis, L.; Ribeiro, A.; Leite, M. Large-Format Additive Manufacturing of Polymer Extrusion-Based Deposition Systems: Review and Applications. Prog. Addit. Manuf. 2023, 8, 1257–1280. [Google Scholar] [CrossRef]
- Kováčová, M.; Kozakovičová, J.; Procházka, M.; Janigová, I.; Vysopal, M.; Černičková, I.; Krajčovič, J.; Špitalský, Z. Novel Hybrid PETG Composites for 3D Printing. Appl. Sci. 2020, 10, 3062. [Google Scholar] [CrossRef]
- Oberg, E.; Jones, F.D.; Horton, H.L.; Ryffel, H.H.; McCauley, C.J. Machinery’s Handbook, 31st ed.; Brengelman, L., Ed.; Industrial Press, Inc.: South Norwalk, CT, USA, 2020. [Google Scholar]
- Benié, K.; Barrière, T.; Placet, V.; Cherouat, A. Introducing a New Optimization Parameter Based on Diffusion, Coalescence and Crystallization to Maximize the Tensile Properties of Additive Manufacturing Parts. Addit. Manuf. 2023, 69, 103538. [Google Scholar] [CrossRef]
- Blok, L.G.; Longana, M.L.; Yu, H.; Woods, B.K.S. An Investigation into 3D Printing of Fibre Reinforced Thermoplastic Composites. Addit. Manuf. 2018, 22, 176–186. [Google Scholar] [CrossRef]
- Tronvoll, S.A.; Welo, T.; Elverum, C.W. The Effects of Voids on Structural Properties of Fused Deposition Modelled Parts: A Probabilistic Approach. Int. J. Adv. Manuf. Technol. 2018, 97, 3607–3618. [Google Scholar] [CrossRef]
- McIlroy, C.; Olmsted, P.D. Disentanglement Effects on Welding Behaviour of Polymer Melts during the Fused-Filament-Fabrication Method for Additive Manufacturing. Polymer 2017, 123, 376–391. [Google Scholar] [CrossRef]
- Lee, T.H.; Yu, H.; Forrester, M.; Wang, T.P.; Shen, L.; Liu, H.; Li, J.; Li, W.; Kraus, G.; Cochran, E. Next-Generation High-Performance Bio-Based Naphthalate Polymers Derived from Malic Acid for Sustainable Food Packaging. ACS Sustain. Chem. Eng. 2022, 10, 2624–2633. [Google Scholar] [CrossRef]
- Callister, W.D.J.; Rethwisch, D.G. Material Science and Engineering: An Introduction, 9th ed.; John Wiley & Sons, Inc.: Hoboken, NJ, USA, 2014. [Google Scholar]
- Yan, C.; Kleiner, C.; Tabigue, A.; Shah, V.; Sacks, G.; Shah, D.; DeStefano, V. PETG: Applications in Modern Medicine. Eng. Regen. 2024, 5, 45–55. [Google Scholar] [CrossRef]
- Beckman, I.P.; Lozano, C.; Freeman, E.; Riveros, G. Fiber Selection for Reinforced Additive Manufacturing. Polymers 2021, 13, 2231. [Google Scholar] [CrossRef]
- Humberto, J.; Almeida, S.; Jayaprakash, S.; Kolari, K.; Kuva, J.; Kukko, K.; Partanen, J. The Role of Printing Parameters on the Short Beam Strength of 3D-Printed Continuous Carbon Fibre Reinforced Epoxy-PETG Composites. Compos. Struct. 2024, 337, 118034. [Google Scholar] [CrossRef]
- Bedi, S.S.; Mallesha, V.; Mahesh, V.; Mahesh, V.; Ponnusami, S.A. Investigation of Low-Percentage Graphene Reinforcement on the Mechanical Behaviour of Additively Manufactured Polyethylene Terephthalate Glycol Composites. J. Thermoplast. Compos. Mater. 2024, 37, 910–930. [Google Scholar] [CrossRef]
- Compton, B.G.; Lewis, J.A. 3D-Printing of Lightweight Cellular Composites. Adv. Mater. 2014, 26, 5930–5935. [Google Scholar] [CrossRef]
- ASTM D7028-07 (reapproved 2015); Standard Test Method for Glass Transition Temperature (DMA Tg) of Polymer Matrix Composites by Dynamic Mechanical Analysis. ASTM: West Conshohocken, PA, USA, 2015.
- ASTM D790-17; Standard Test Methods for Flexural Properties Unreinforced and Reinforced Plastics and Electrical Insulating Materials. ASTM: West Conshohocken, PA, USA, 2017.
- ASTM D638-14; Standard Test Method for Tensile Properties of Plastics. ASTM: West Conshohocken, PA, USA, 2014.
- Huseynov, O.; Hasanov, S.; Fidan, I. Influence of the Matrix Material on the Thermal Properties of the Short Carbon Fiber Reinforced Polymer Composites Manufactured by Material Extrusion. J. Manuf. Process. 2023, 92, 521–533. [Google Scholar] [CrossRef]
- Ghorbani, J.; Koirala, P.; Shen, Y.L.; Tehrani, M. Eliminating Voids and Reducing Mechanical Anisotropy in Fused Filament Fabrication Parts by Adjusting the Filament Extrusion Rate. J. Manuf. Process. 2022, 80, 651–658. [Google Scholar] [CrossRef]
- Anovitz, L.M.; Cole, D.R. Characterization and Analysis of Porosity and Pore Structures. In Pore Scale Geochemical Processes; De Gruyter: Berlin, Germany, 2015; pp. 61–164. ISBN 9781501502071. [Google Scholar]
- Landry, T. Beat Moisture Before It Kills Your 3D Printing Filament. Available online: https://www.matterhackers.com/news/filament-and-water (accessed on 30 August 2022).
- Bhandari, S.; Lopez-Anido, R.A.; Gardner, D.J. Enhancing the Interlayer Tensile Strength of 3D Printed Short Carbon Fiber Reinforced PETG and PLA Composites via Annealing. Addit. Manuf. 2019, 30, 100922. [Google Scholar] [CrossRef]
- Subbarao, C.V.; Reddy, Y.S.; Inturi, V.; Reddy, M.I. Dynamic Mechanical Analysis of 3D Printed PETG Material. IOP Conf. Ser. Mater. Sci. Eng. 2021, 1057, 012031. [Google Scholar] [CrossRef]
- Holcomb, G.; Caldona, E.B.; Cheng, X.; Advincula, R.C. On the Optimized 3D Printing and Post-Processing of PETG Materials. MRS Commun. 2022, 12, 381–387. [Google Scholar] [CrossRef]
- Arrigo, R.; Frache, A. FDM Printability of PLA Based-Materials: The Key Role of the Rheological Behavior. Polymers 2022, 14, 1754. [Google Scholar] [CrossRef]
- Techmer PM. Electrafil ® PROPERTY DATA Electrafil ® PETG 1711 3DP; Techmer PM: Clinton, TN, USA, 2020. [Google Scholar]
- Dizon, J.R.C.; Espera, A.H.; Chen, Q.; Advincula, R.C. Mechanical characterization of 3D-printed polymers. Addit. Manuf. 2018, 20, 44–67. [Google Scholar] [CrossRef]
- Gurrala, P.K.; Regalla, S.P. Part Strength Evolution with Bonding between Filaments in Fused Deposition Modelling: This Paper Studies How Coalescence of Filaments Contributes to the Strength of Final FDM Part. Virtual Phys. Prototyp. 2014, 9, 141–149. [Google Scholar] [CrossRef]
- Instron Bluehill Calculation Reference: Reference Manual, Software Help V 4.24-EN Revision A; Instron: Norwood, MA, USA, 2017.
- Santana, L.; Alves, J.L.; Netto, A.d.C.S.; Merlini, C. A Comparative Study between PETG and PLA for 3D Printing through Thermal, Chemical and Mechanical Characterization. Rev. Mater. 2018, 23, e12267. [Google Scholar] [CrossRef]
- Hsueh, M.H.; Lai, C.J.; Wang, S.H.; Zeng, Y.S.; Hsieh, C.H.; Pan, C.Y.; Huang, W.C. Effect of Printing Parameters on the Thermal and Mechanical Properties of 3d-Printed Pla and Petg, Using Fused Deposition Modeling. Polymers 2021, 13, 1758. [Google Scholar] [CrossRef]
- Kung, C.; Kuan, H.-C.; Kuan, C.-F. Evaluation of Tensile Strength of 3D Printed Objects with FDM Process on RepRap Platform. In Proceedings of the 1st IEEE International Conference on Knowledge Innovation and Invention, Jeju Island, South Korea, 23–27 July 2018. [Google Scholar]


| Print Parameter | Panel I | Panel II |
|---|---|---|
| Material | PETG CF30% | PETG CF30% |
| Drying State | Undried, Dried | Dried |
| Nozzle Diameter (mm) | 3 | 3 |
| Nozzle Temperature (°C) (PID) | 250 | 250 |
| Print Bed Temperature (°C) (PID) | 80 | 80 |
| M3 Motor (Mach4) (counts/unit) | 276 | 276 |
| Nozzle (on printer) | 3 mm | 3 mm |
| Layer Height (mm) | 2 | 2 |
| Initial Layer Height (mm) | 2 | 2 |
| Maximum Volumetric Extrusion (mm3/s) | 500 | 500 |
| Maximum Print Speed (mm/s) | 500 | 500 |
| Infill Print Speed (mm/s) | 600 | 600 |
| (In)Fill Pattern | Rectilinear | Rectilinear |
| (In)Fill Angle | 0/90 | 0/90 |
| Infill Percentage (%) | 100 | 100 |
| Infill–Perimeter Overlap (%) | 20 | 20 |
| Filament Diameter (mm) | 5.5 | 5 |
| Nozzle Diameter (mm) | 3 | 3 |
| Extrusion Multiplier | 1 | 1.2 |
| Perimeter (beads) | 3 | 3 |
| Agitator | Undried: hand tapped Dried: 3 off 1 on | 3 off 1 on |
| Material (Tested in Nitrogen) | Weight Percentage Remaining at 600 °C (%) | Degradation Onset Temperature (°C) |
|---|---|---|
| PETG CF Undried Sample 1 | 35 | 405.91 |
| PETG CF Undried Sample 2 | 36 | 407.35 |
| MatterHackers PETG Blue Filament | 6 | 400.19 |
| Sample | Volume of Material (Vm) (mm3) | Porosity (φ) (%) |
|---|---|---|
| 1 | 4262.38 | 1.47 |
| 2 | 4263.68 | 1.44 |
| 3 | 4244.64 | 1.88 |
| 4 | 4268.01 | 1.34 |
| 5 | 4259.35 | 1.54 |
| 6 | 4251.57 | 1.72 |
| 7 | 4256.76 | 1.60 |
| 8 | 4265.41 | 1.40 |
| 9 | 4226.91 | 2.29 |
| Average | 4255.41 | 1.63 |
| Sample | Tg in °C, Pellets | Tg in °C, Printed |
|---|---|---|
| 1 | 68.17 | 65.21 |
| 2 | 68.89 | 65.07 |
| 3 | 69.84 | 65.07 |
| Average | 68.97 | 65.12 |
| Orientation | Undried Panel I (°C) | Dried Panel I (°C) | Dried Panel II (°C) |
|---|---|---|---|
| Vertical | 82.10 | 81.85 | 82.15 |
| Horizontal | 82.79 | 82.33 | 82.31 |
| Diagonal | 82.44 | 82.65 | 81.47 |
| Panel | Direction/Sample Type (Ratio) | Average Flexural Modulus (GPa) | Std. Dev. | Average Maximum Flexural Strength (MPa) | Std. Dev. | Number of Samples Tested |
|---|---|---|---|---|---|---|
| IIA | Horizontal (16:1) | 3.66 | 0.42 | 44.78 | 17.97 | 4 |
| Vertical (16:1) | 3.23 | 0.57 | 53.18 | 7.78 | 4 | |
| IIB | Horizontal (10:1) | 2.43 | 0.53 | 48.92 | 16.29 | 5 |
| Vertical (10:1) | n/a | n/a | 68.68 | 19.46 | 5 | |
| Diagonal (9:1) | 1.95 | 0.35 | 47.69 | 9.35 | 6 |
| Panel | Direction/Sample Type (Ratio) | Maximum Flexural Strength (MPa) | ||
|---|---|---|---|---|
| Minimum | Average | Maximum | ||
| IIA | Horizontal (16:1) | 25.56 | 44.78 | 66.17 |
| Vertical (16:1) | 45.11 | 53.18 | 63.63 | |
| IIB | Horizontal (10:1) | 30.87 | 53.44 | 65.78 |
| Vertical (10:1) | 46.96 | 68.68 | 93.25 | |
| Diagonal (9:1) | 35.86 | 47.69 | 59.38 | |
Disclaimer/Publisher’s Note: The statements, opinions and data contained in all publications are solely those of the individual author(s) and contributor(s) and not of MDPI and/or the editor(s). MDPI and/or the editor(s) disclaim responsibility for any injury to people or property resulting from any ideas, methods, instructions or products referred to in the content. |
© 2024 by the authors. Licensee MDPI, Basel, Switzerland. This article is an open access article distributed under the terms and conditions of the Creative Commons Attribution (CC BY) license (https://creativecommons.org/licenses/by/4.0/).
Share and Cite
Martin, K.A.; Riveros, G.A.; Thornell, T.L.; McClelland, Z.B.; Freeman, E.L.; Stinson, J.T. Thermomechanical Material Characterization of Polyethylene Terephthalate Glycol with 30% Carbon Fiber for Large-Format Additive Manufacturing of Polymer Structures. Polymers 2024, 16, 1913. https://doi.org/10.3390/polym16131913
Martin KA, Riveros GA, Thornell TL, McClelland ZB, Freeman EL, Stinson JT. Thermomechanical Material Characterization of Polyethylene Terephthalate Glycol with 30% Carbon Fiber for Large-Format Additive Manufacturing of Polymer Structures. Polymers. 2024; 16(13):1913. https://doi.org/10.3390/polym16131913
Chicago/Turabian StyleMartin, Katie A., Guillermo A. Riveros, Travis L. Thornell, Zackery B. McClelland, Elton L. Freeman, and James T. Stinson. 2024. "Thermomechanical Material Characterization of Polyethylene Terephthalate Glycol with 30% Carbon Fiber for Large-Format Additive Manufacturing of Polymer Structures" Polymers 16, no. 13: 1913. https://doi.org/10.3390/polym16131913
APA StyleMartin, K. A., Riveros, G. A., Thornell, T. L., McClelland, Z. B., Freeman, E. L., & Stinson, J. T. (2024). Thermomechanical Material Characterization of Polyethylene Terephthalate Glycol with 30% Carbon Fiber for Large-Format Additive Manufacturing of Polymer Structures. Polymers, 16(13), 1913. https://doi.org/10.3390/polym16131913