
Impact of Different Mineral Reinforcements on HDPE Composites: Effects of Melt Flow Index and Particle Size on Physical and Mechanical Properties

 , , , , and
Abstract
:1. Introduction
2. Materials and Methods
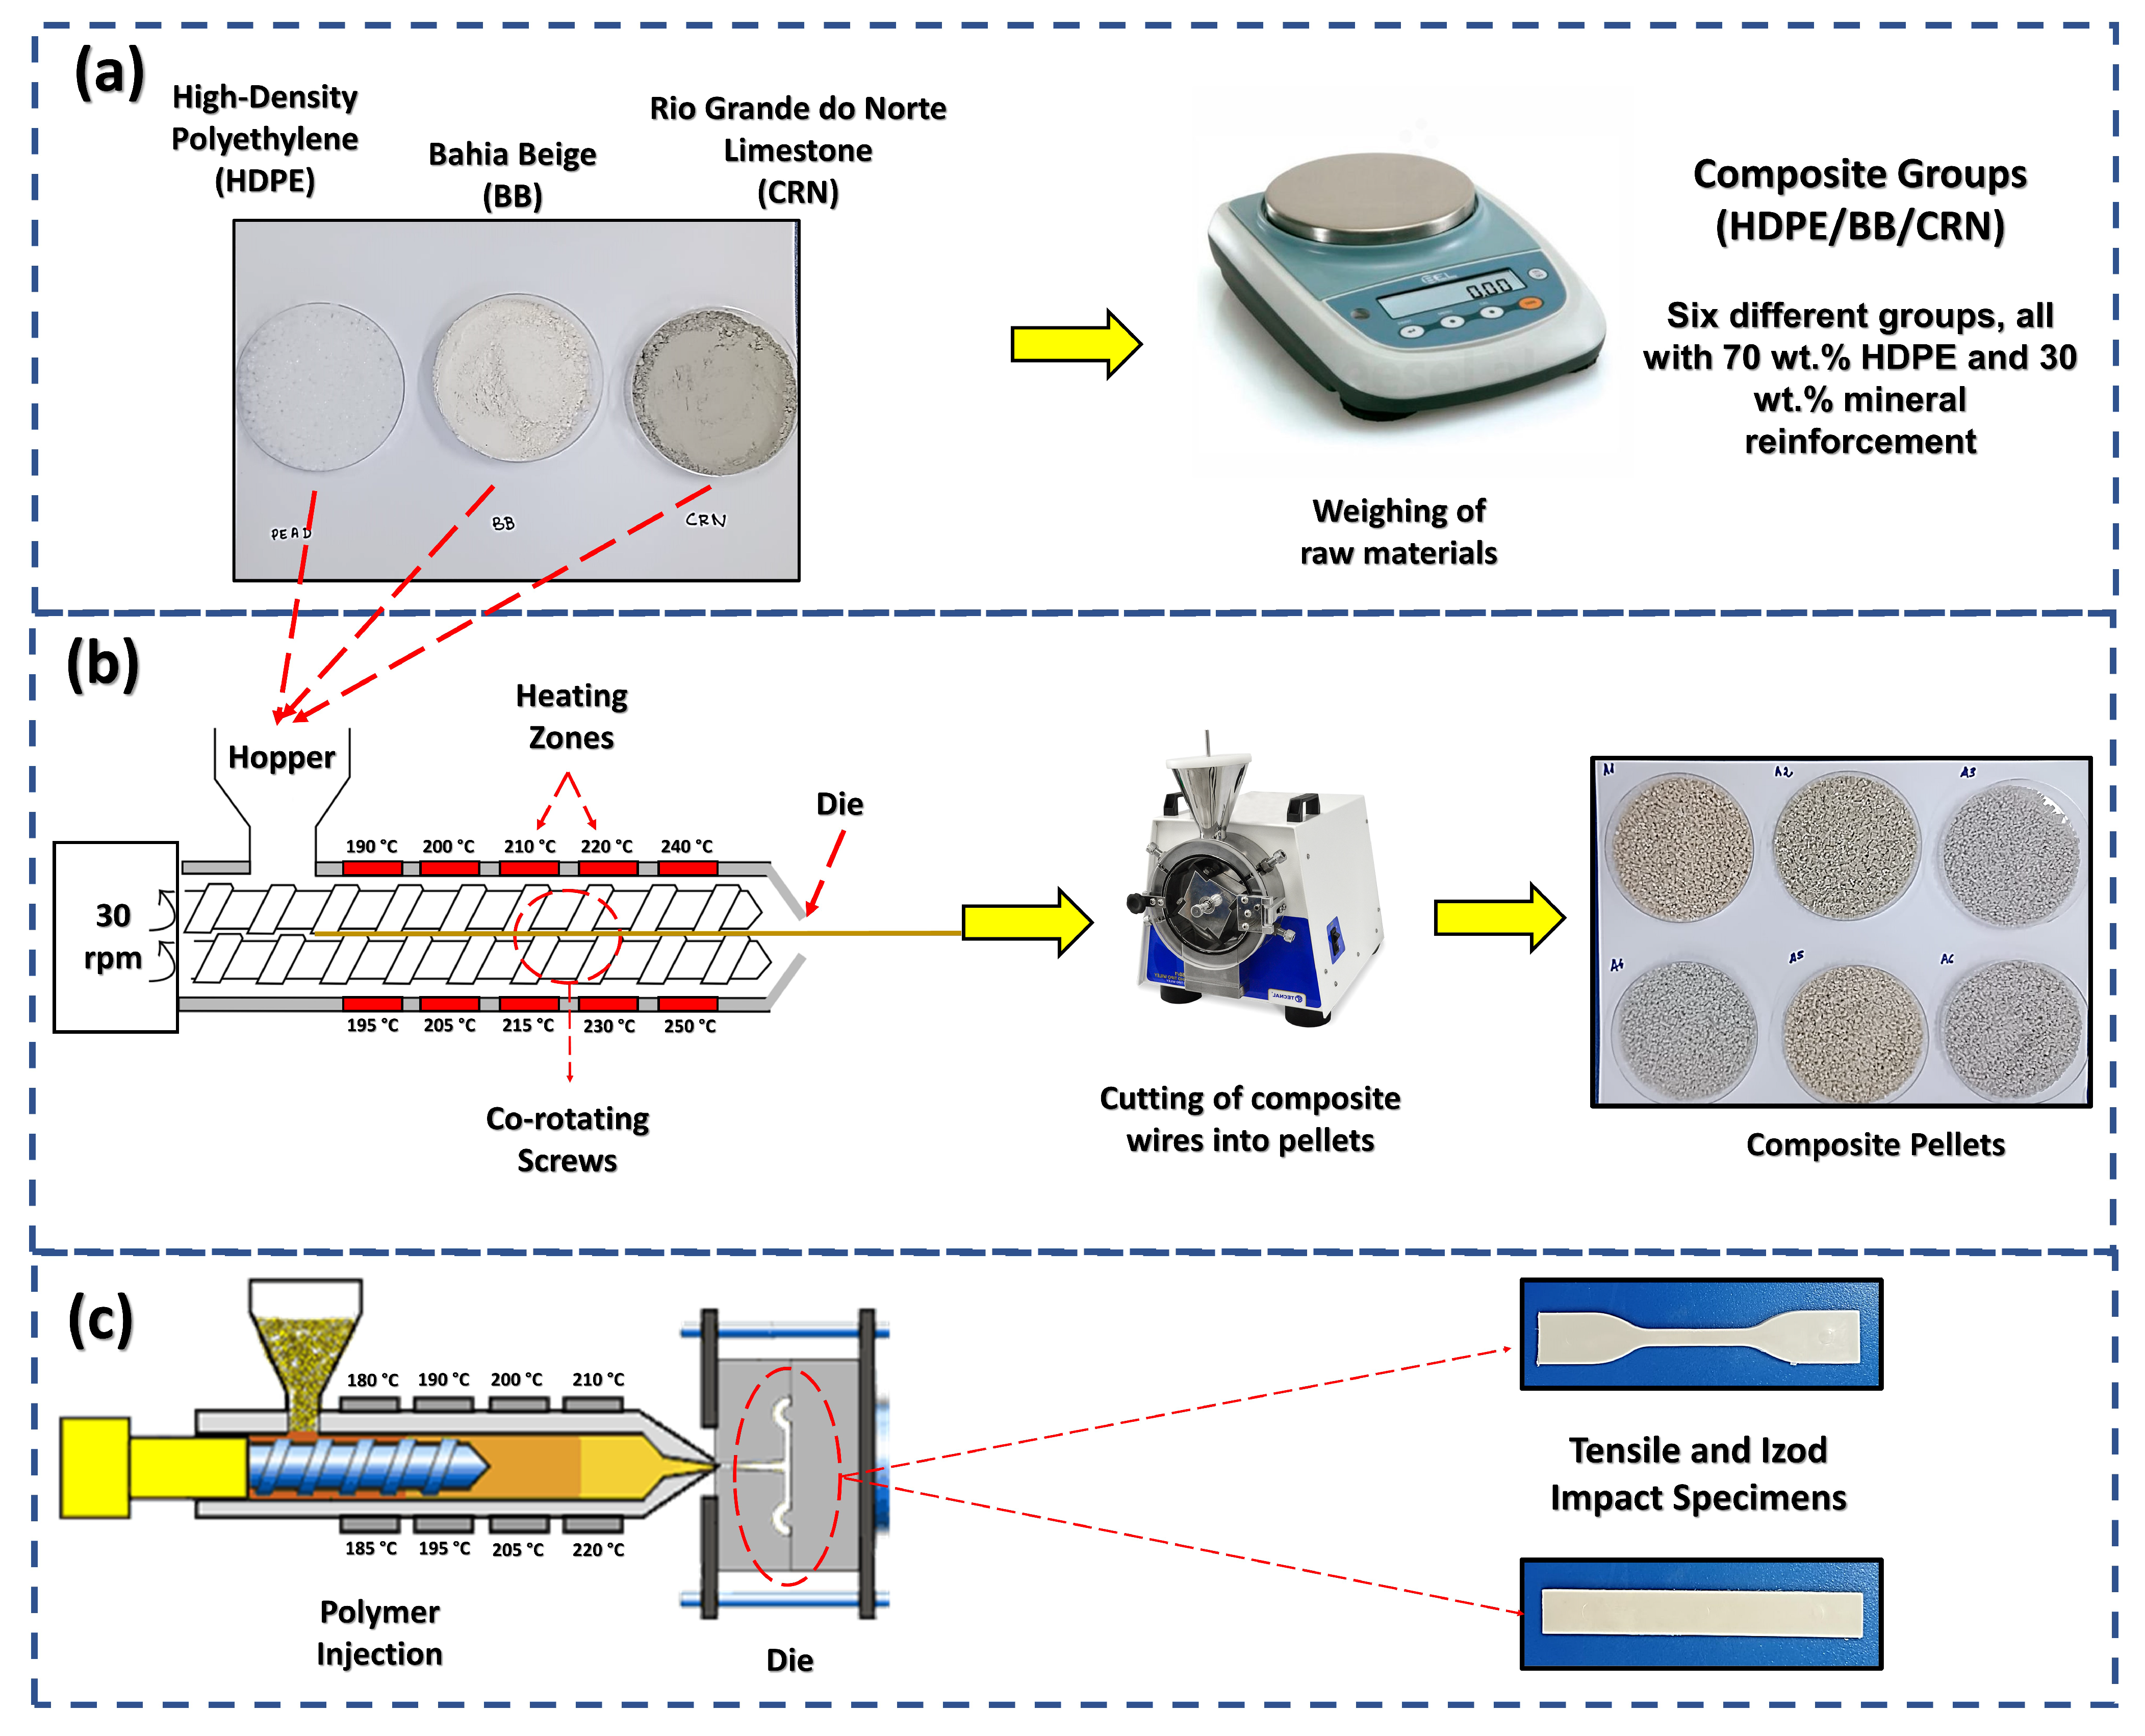
2.1. Raw Materials
2.2. Composite Processing
2.3. Characterization
2.3.1. Density Measurement
2.3.2. Shore D Hardness
2.3.3. Izod Impact Test
2.3.4. Tensile Tests
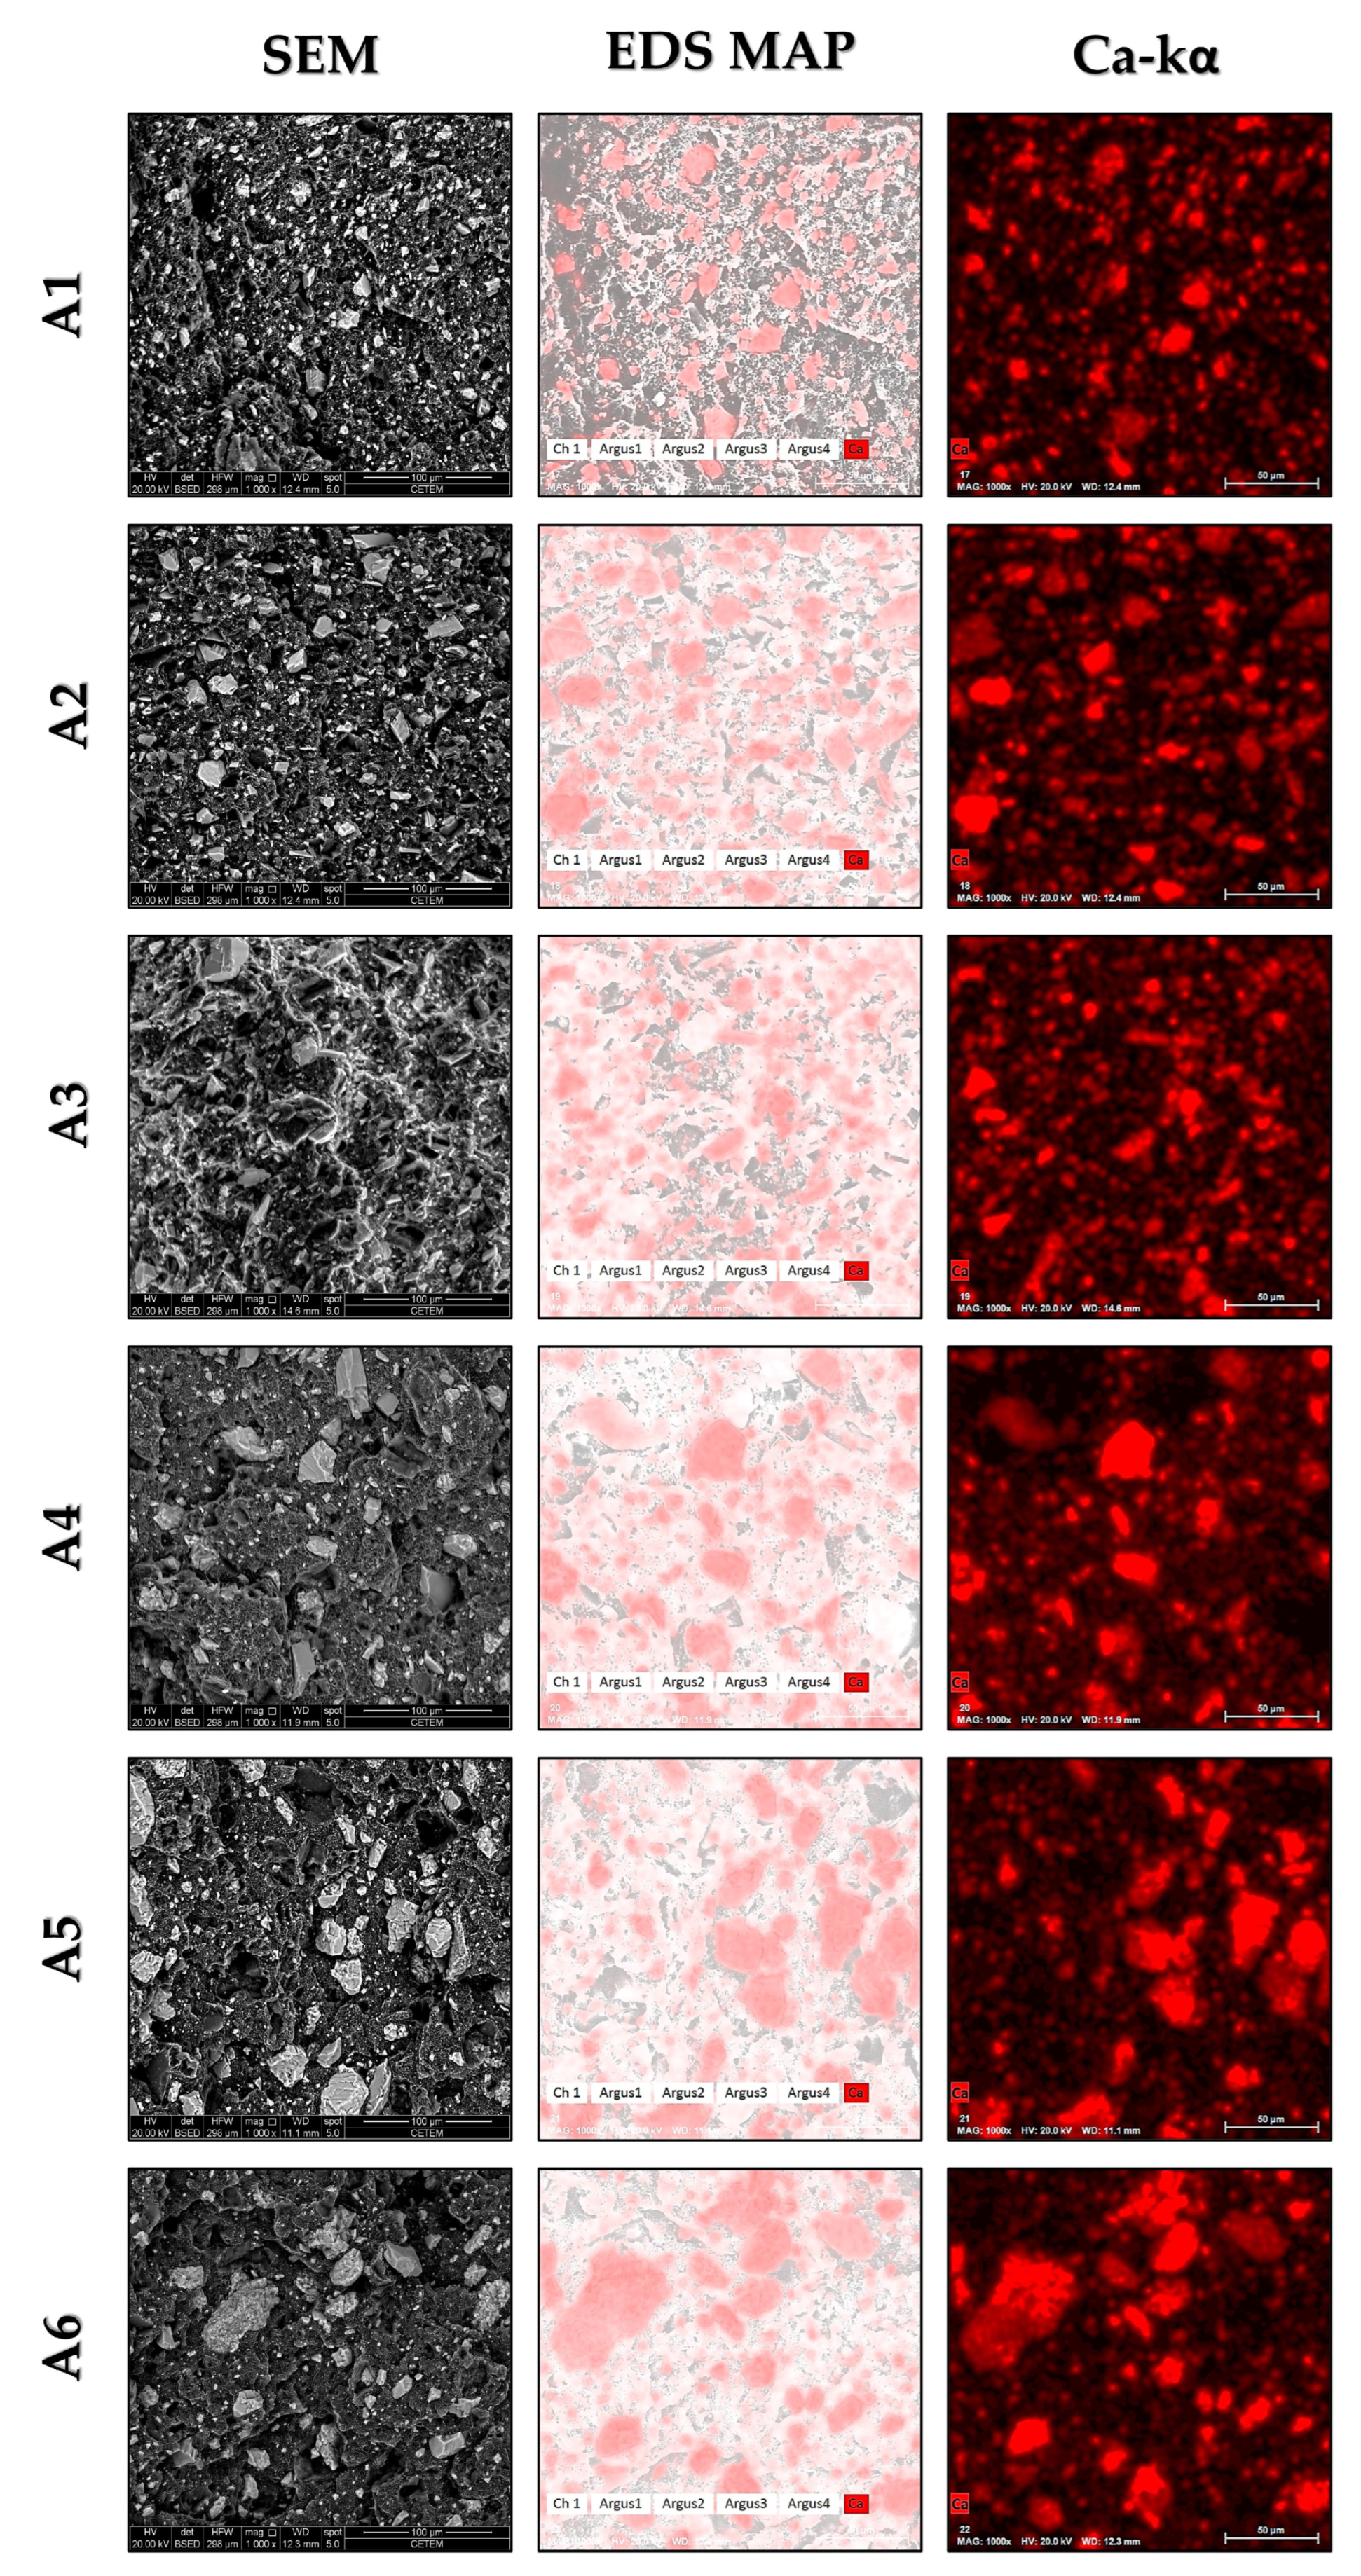
2.3.5. Scanning Electron Microscopy (SEM)
2.3.6. X-ray Diffraction (XRD)
2.3.7. X-ray Fluorescence (XRF)
2.4. Statistical Analysis
3. Results and Discussion
3.1. XRF Results
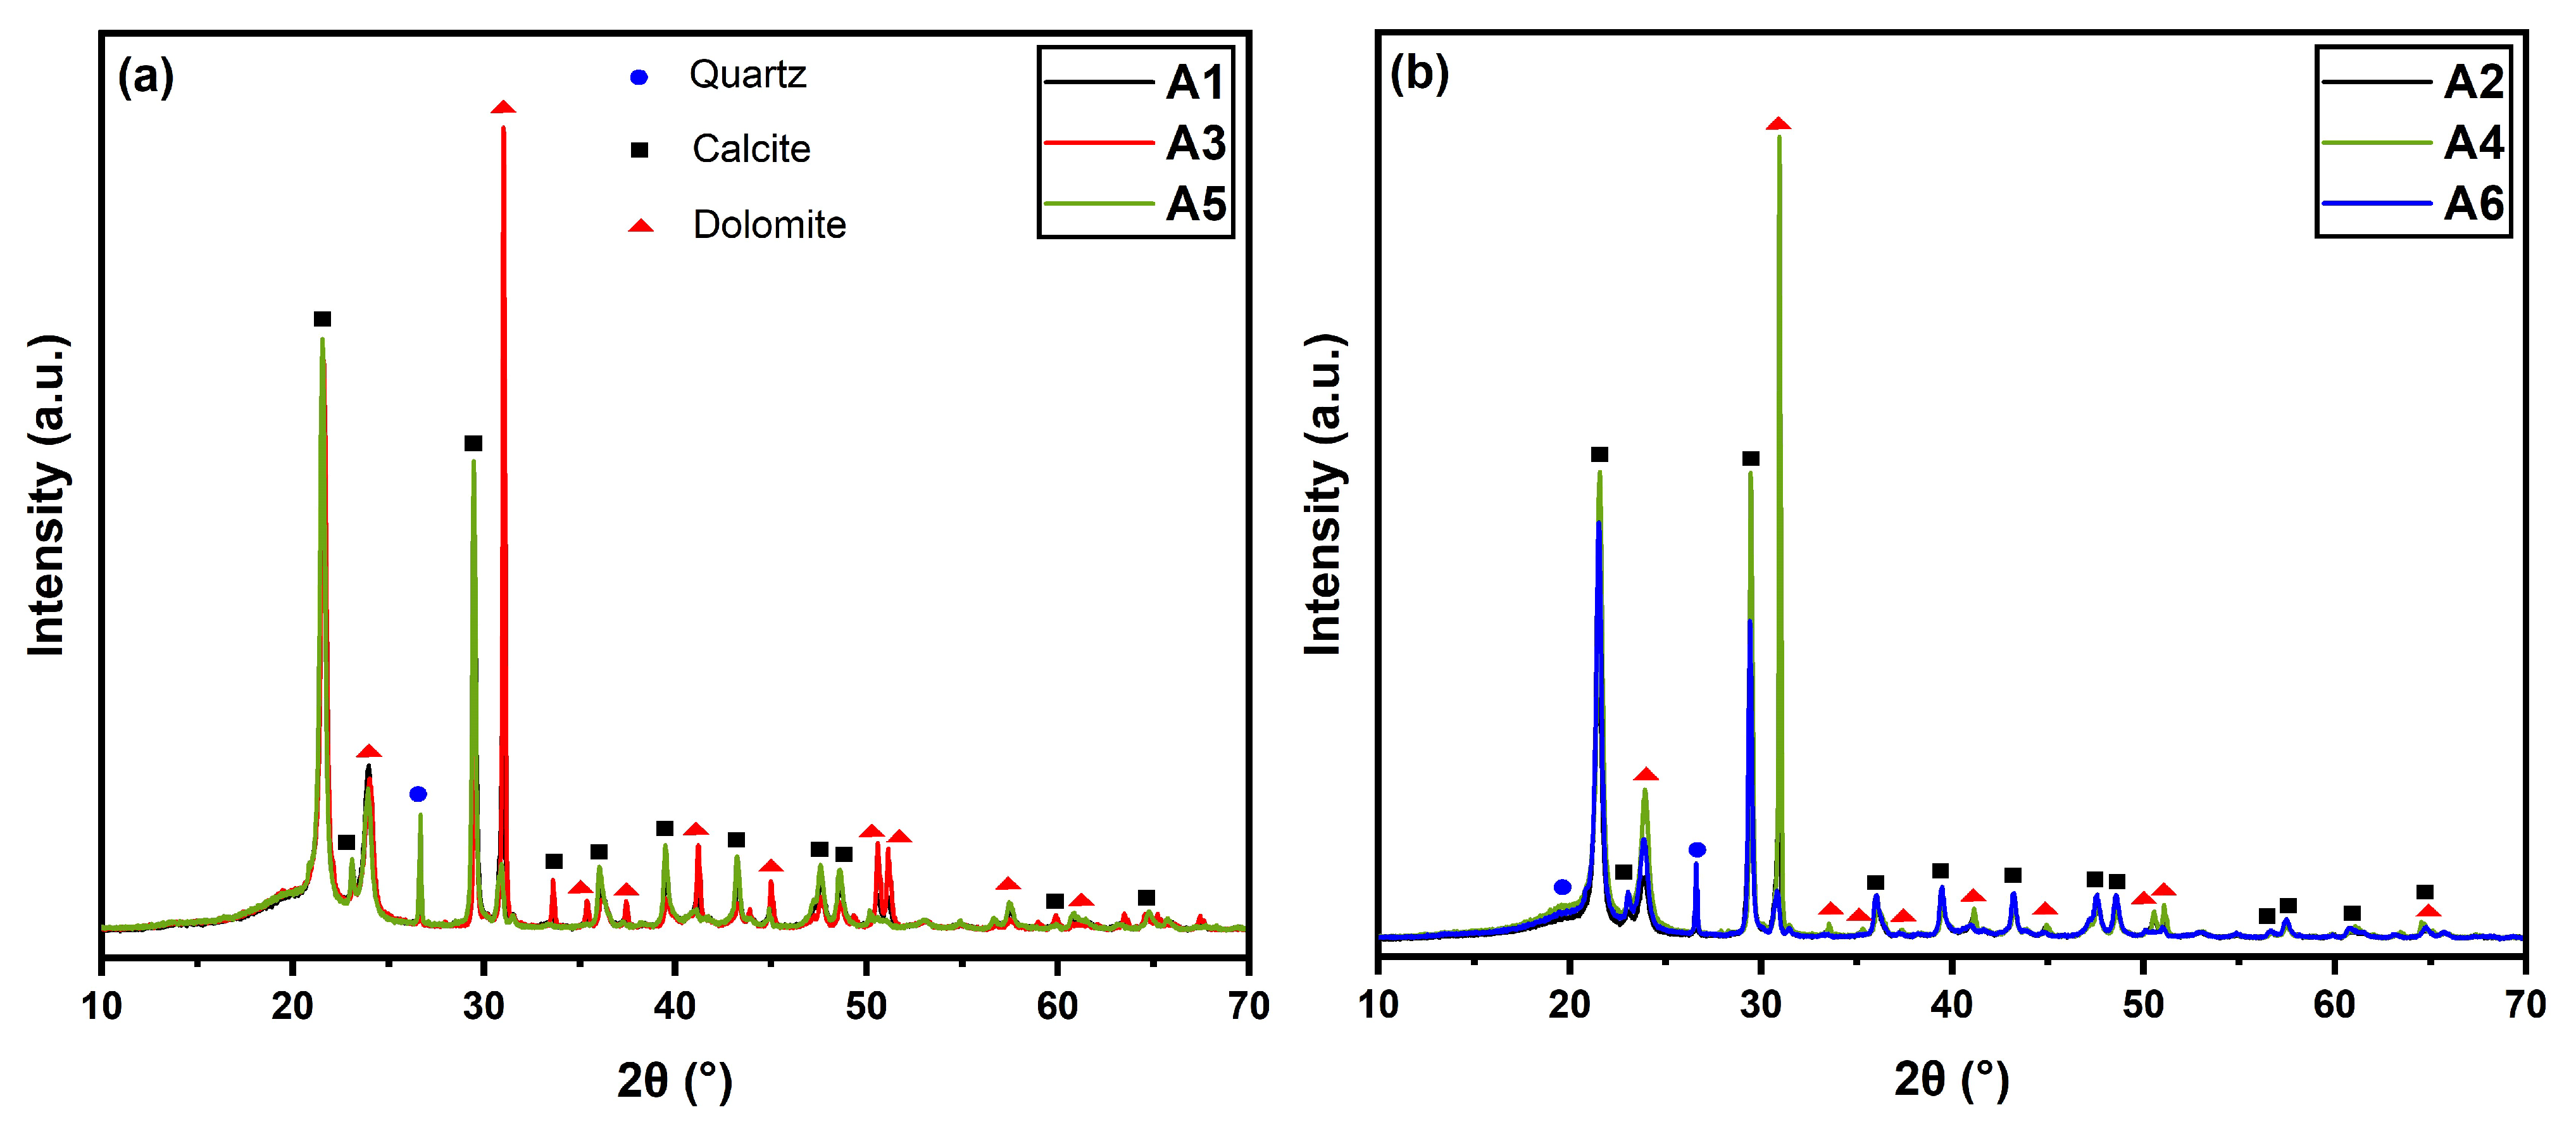
3.2. XRD Results
3.3. Physical and Mechanical Properties
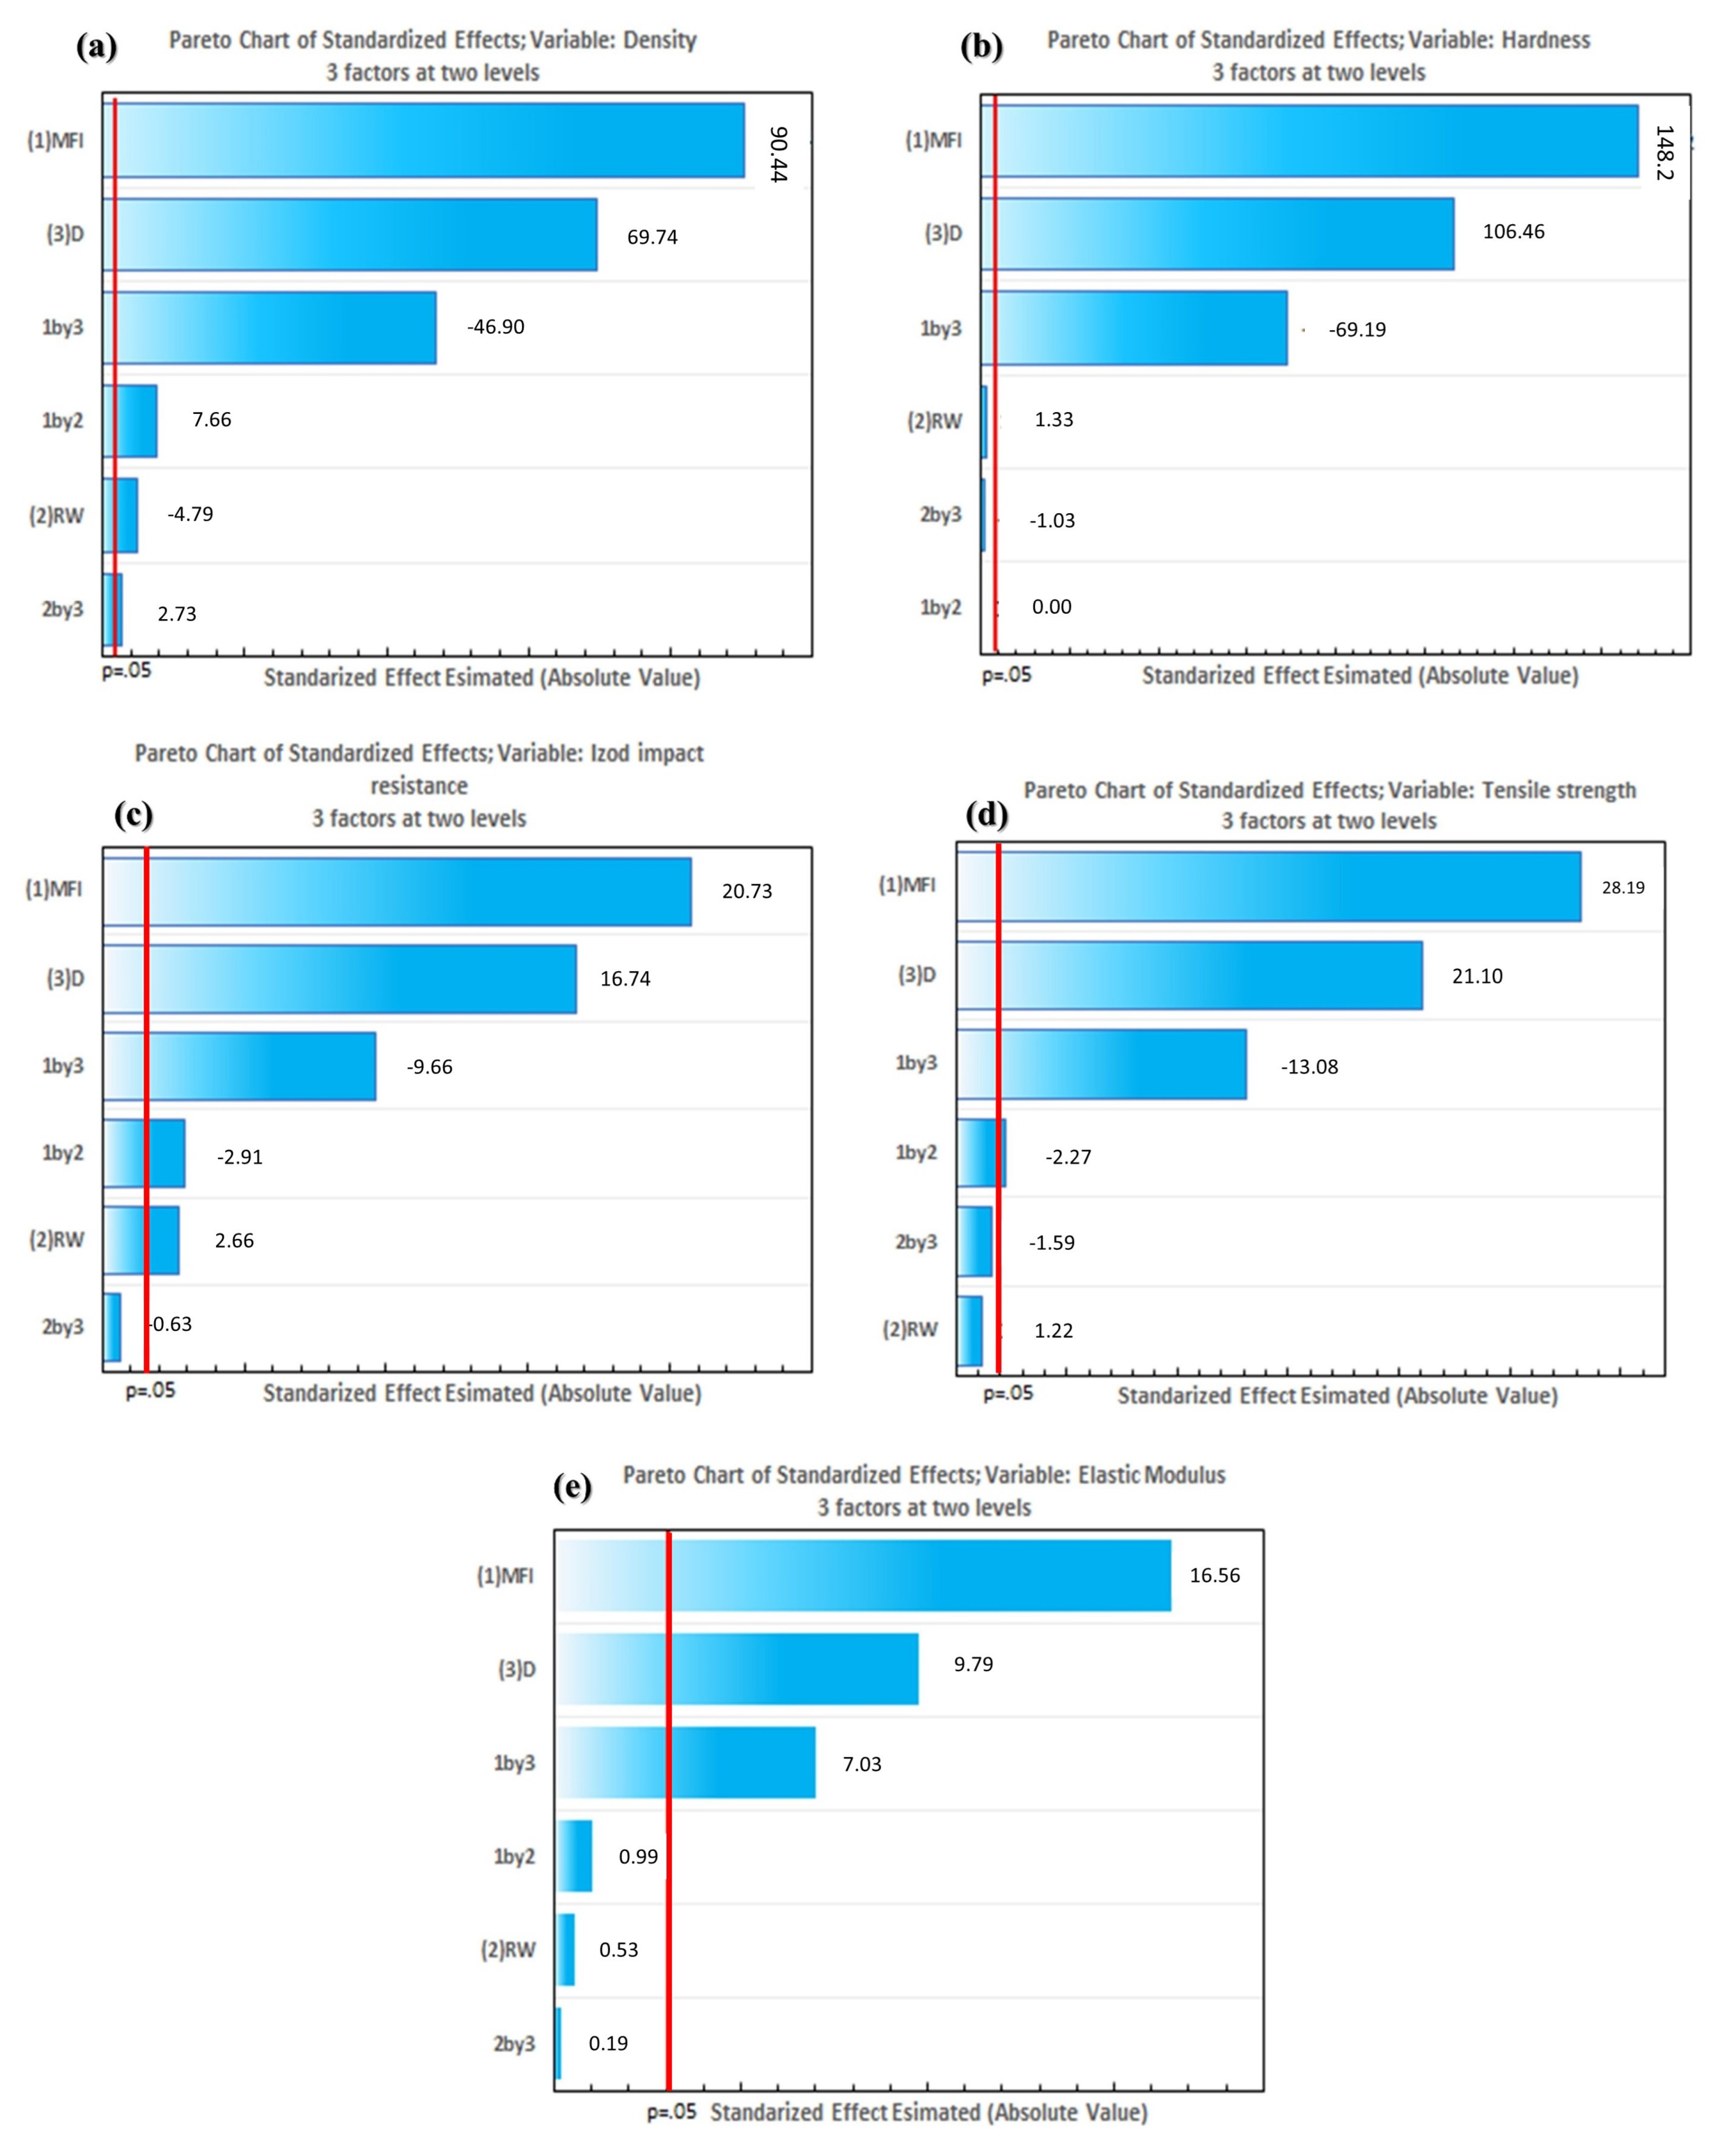
3.4. Statistical Analysis of Physical and Mechanical Properties of Composites
4. Conclusions
- Filler type: Both Bahia Beige and Rio Grande do Norte Limestone are recommended as effective mineral reinforcements due to their similar chemical compositions and phase structures.
- Filler particle size: A larger particle size is recommended, as it was found to contribute to superior tensile performance and higher density values.
- MFI of polyethylene: A lower MFI of HDPE is proposed, as it demonstrated higher impact resistance and better tensile performance.
Author Contributions
Funding
Institutional Review Board Statement
Informed Consent Statement
Data Availability Statement
Acknowledgments
Conflicts of Interest
References
- Voukkali, I.; Papamichael, I.; Economou, F.; Loizia, P.; Klontza, E.; Lekkas, D.F.; Naddeo, V.; Zorpas, A.A. Factors affecting social attitude and behavior for the transition towards a circular economy. Sustain. Chem. Pharm. 2023, 36, 101276. [Google Scholar]
- Assembly, G. Sustainable Development Goals. SDGs Transform Our World. 2015. Available online: http://www.igbp.net/download/18.62dc35801456272b46d51/1399290813740/NL82-SDGs.pdf (accessed on 11 July 2024).
- Maximo, Y.I.; Hassegawa, M.; Verkerk, P.J.; Missio, A.L. Forest bioeconomy in Brazil: Potential innovative products from the forest sector. Land 2022, 11, 1297. [Google Scholar] [CrossRef]
- Wang, H.; Schandl, H.; Wang, X.; Ma, F.; Yue, Q.; Wang, G.; Wang, Y.; Wei, Y.; Zhang, Z.; Zheng, R. Measuring progress of China’s circular economy. Resour. Conserv. Recycl. 2020, 163, 105070. [Google Scholar] [CrossRef]
- Chatziparaskeva, G.; Papamichael, I.; Zorpas, A.A. Microplastics in the coastal environment of Mediterranean and the impact on sustainability level. Sustain. Chem. Pharm. 2022, 29, 100768. [Google Scholar] [CrossRef]
- Chagas, G.N.; Barros, M.M.; Leão, A.G.d.; Tapanes, N.d.L.C.O.; Ribeiro, R.C.d.C.; Bastos, D.C. A hybrid green composite for automotive industry. Polímeros 2022, 32, e2022017. [Google Scholar] [CrossRef]
- European Commission. Annex to the Communication from the Commission to the European Parliament, the Council, the European Economic and Social Committee and the Committee of the Regions. The European Green Deal. 2019. Available online: https://op.europa.eu/en/publication-detail/-/publication/b828d165-1c22-11ea-8c1f-01aa75ed71a1/language-en (accessed on 11 July 2024).
- Biancardi, A.; Colasante, A.; D’Adamo, I. Sustainable education and youth confidence as pillars of future civil society. Sci. Rep. 2023, 13, 955. [Google Scholar] [CrossRef] [PubMed]
- Mensah, J. Sustainable development: Meaning, history, principles, pillars, and implications for human action: Literature review. Cogent Soc. Sci. 2019, 5, 1653531. [Google Scholar] [CrossRef]
- Holden, E.; Linnerud, K.; Banister, D.; Schwanitz, V.; Wierling, A. The Imperatives of Sustainable Development: Needs, Justice, Limits; Routledge: Abington, UK, 2017. [Google Scholar]
- Derkics, D. Report to Congress: Wastes from the Extraction and Beneficiation of Metallic Ores, Phosphate Rock, Asbestos, Overburden from Uranium Mining, and Oil Shale. Final Report; Technical Report, Environmental Protection Agency; Office of Solid Waste: Washington, DC, USA, 1985.
- European Commission. Report from the Commission to the European Parliament, the Council the European Economic and Social Committee and the Committee of the Regions on the Application of the Council Recommendation of 24 September 1998 Concerning the Protection of Minors and Human Dignity and of the Recommendation of the European Parliament and of the Council of 20 December 2006 on the Protection of Minors and Human Dignity and on the Right of Reply in Relation to the Competitiveness of the European Audiovisual and Online Information Services Industry: Protecting Children in the Digital World; Publications Office of the European Union: Luxembourg, 2011. [Google Scholar]
- Almeida, J.; Ribeiro, A.; Silva, A.S.; Faria, P. Overview of mining residues incorporation in construction materials and barriers for full-scale application. J. Build. Eng. 2020, 29, 101215. [Google Scholar] [CrossRef]
- Silveira, V.L.; Guimarães, A.C.R.; Coelho, L.M.; dos Santos, W.W.; da Silveira, P.H.P.M.; Monteiro, S.N. Recycling Iron Ore Waste through Low-Cost Paving Techniques. Sustainability 2024, 16, 5570. [Google Scholar] [CrossRef]
- Christmann, P. Mineral resource governance in the 21st century and a sustainable European Union. Miner. Econ. 2021, 34, 187–208. [Google Scholar] [CrossRef]
- do Carmo, F.F.; Kamino, L.H.Y.; Junior, R.T.; de Campos, I.C.; do Carmo, F.F.; Silvino, G.; Mauro, M.L.; Rodrigues, N.U.A.; de Souza Miranda, M.P.; Pinto, C.E.F.; et al. Fundão tailings dam failures: The environment tragedy of the largest technological disaster of Brazilian mining in global context. Perspect. Ecol. Conserv. 2017, 15, 145–151. [Google Scholar] [CrossRef]
- de la Campa, A.M.S.; de La Rosa, J.D.; Fernández-Caliani, J.C.; González-Castanedo, Y. Impact of abandoned mine waste on atmospheric respirable particulate matter in the historic mining district of Rio Tinto (Iberian Pyrite Belt). Environ. Res. 2011, 111, 1018–1023. [Google Scholar] [CrossRef] [PubMed]
- Sonter, L.J.; Ali, S.H.; Watson, J.E. Mining and biodiversity: Key issues and research needs in conservation science. Proc. R. Soc. B 2018, 285, 20181926. [Google Scholar] [CrossRef] [PubMed]
- Tayebi-Khorami, M.; Edraki, M.; Corder, G.; Golev, A. Re-thinking mining waste through an integrative approach led by circular economy aspirations. Minerals 2019, 9, 286. [Google Scholar] [CrossRef]
- Carmo, F.F.; Lanchotti, A.O.; Kamino, L.H. Mining waste challenges: Environmental risks of gigatons of mud, dust and sediment in megadiverse regions in Brazil. Sustainability 2020, 12, 8466. [Google Scholar] [CrossRef]
- Borlini, M.C.; Mariane, G.; Ana, C.d.A.; Giori, J.N.; Pazeto, A.d.A.; Fernandes, M.C.S. Rochas Aglomeradas: Uma Alternativa Tecnológica e Ambiental para a Utilização dos Resíduos de Rochas Ornamentais. 2021. Available online: https://1library.org/document/q7w91x5o-rochas-aglomeradas-alternativa-tecnol%C3%B3gica-ambiental-utiliza%C3%A7%C3%A3o-res%C3%ADduos-ornamentais.html (accessed on 11 July 2024).
- Gadioli, M.C.B.; de Aguiar, M.C.; Vidal, F.W.H.; Sant’Ana, M.A.K.; de Almeida, K.M.; Giori, A.J.N. Incorporation of Ornamental Stone waste in the manufacturing of red ceramics. Materials 2022, 15, 5635. [Google Scholar] [CrossRef] [PubMed]
- Yu, L.; Zhang, Y.; Mao, H.; Cui, K.; Liu, H. Structure evolution, properties and synthesis mechanism of ultra-lightweight eco-friendly ceramics prepared from kaolin clay and sewage sludge. J. Environ. Chem. Eng. 2023, 11, 109061. [Google Scholar] [CrossRef]
- Rat, E.; Martínez-Martínez, S.; Sánchez-Garrido, J.A.; Pérez-Villarejo, L.; Garzón, E.; Sánchez-Soto, P.J. Characterization, thermal and ceramic properties of clays from Alhabia (Almería, Spain). Ceram. Int. 2023, 49, 14814–14825. [Google Scholar] [CrossRef]
- Marras, G.; Carcangiu, G.; Meloni, P.; Careddu, N. Circular economy in marble industry: From stone scraps to sustainable water-based paints. Constr. Build. Mater. 2022, 325, 126768. [Google Scholar] [CrossRef]
- Motoki, A.; Neves, J.L.P.; Vargas, T. Quantitative colour analyses using digital specification technique for Mármore Bege Bahia, a representative Brazilian ornamental limestone of breccia-like texture. Rem. Rev. Esc. Minas 2005, 58, 113–120. [Google Scholar] [CrossRef]
- Silva dos Santos, R.; Poubel Mendonça da Silveira, P.H.; Cruz Bastos, B.; do Nascimento da Conceição, M.; da Conceição Ribeiro, R.C.; Cruz Bastos, D. Development of Environmentally Ecofriendly Composites Based on Polypropylene/Bahia Beige Waste: Effect of Reinforcement Content on Physical, Mechanical, Chemical, and Microstructural Properties. Recent Prog. Mater. 2023, 5, 1–14. [Google Scholar] [CrossRef]
- Cavalcante, L.F.; Santos, C.J.O.; de Holanda, J.S.; de Lima Neto, A.J.; de Luna Souto, A.G.; Dantas, T.A.G. Produção de maracujazeiro amarelo no solo com calcário e potássio sob irrigação com água salina. Irriga 2018, 23, 727–740. [Google Scholar] [CrossRef]
- Primavesi, A.C.; Primavesi, O. Características de Corretivos Agrícolas; Embrapa Pecuária Sudeste: São Carlos, Brazil, 2004. [Google Scholar]
- Vinayagamoorthy, R. Effect of particle sizes on the mechanical behaviour of limestone-reinforced hybrid plastics. Polym. Polym. Compos. 2020, 28, 410–420. [Google Scholar] [CrossRef]
- Wei, Z.; Cheng, Z.; Shen, Y. Recent development in production of pellet fuels from biomass and polyethylene (PE) wastes. Fuel 2024, 358, 130222. [Google Scholar] [CrossRef]
- Wani, T.; Pasha, S.A.Q.; Poddar, S.; Balaji, H. A Review on the use of High Density Polyethylene (HDPE) in Concrete Mixture. Int. J. Eng. Res. Technol. 2020, 9, 861–864. [Google Scholar]
- Ronca, S. Polyethylene. In Brydson’s Plastics Materials; Elsevier: New York, NY, USA, 2017; pp. 247–278. [Google Scholar]
- Knight, G.W. Polyethylene. In Polymer Toughening; CRC Press: Boca Raton, FL, USA, 2020; pp. 189–236. [Google Scholar]
- Gayretli, B.; Shanthar, R.; Öpöz, T.T.; Abeykoon, C. Mechanical properties of LDPE and PS polymer matrix composites reinforced with GNP and CF—A critical review. Int. J. Lightweight Mater. Manuf. 2024, 7, 572–596. [Google Scholar] [CrossRef]
- Koffi, A.; Koffi, D.; Toubal, L. Mechanical properties and drop-weight impact performance of injection-molded HDPE/birch fiber composites. Polym. Test. 2021, 93, 106956. [Google Scholar] [CrossRef]
- Khanam, P.N.; AlMaadeed, M.A.A. Processing and characterization of polyethylene-based composites. Adv. Manuf. Polym. Compos. Sci. 2015, 1, 63–79. [Google Scholar] [CrossRef]
- Kang, G.H.; Kim, M.; Park, Y.B. Enhanced thermal properties of tensile-aligned chopped carbon Fiber/HDPE composites for one-directional thermal ventilation. Polym. Test. 2024, 135, 108445. [Google Scholar] [CrossRef]
- Cardoso, B.F.d.A.F.; Ramos, F.J.H.T.V.; da Silveira, P.H.P.M.; da Silva Figueired, A.B.H.; Gomes, A.V.; da Veiga-Junior, V.F. Mechanical and ballistic characterization of high-density polyethylene composites reinforced with alumina and silicon carbide particles. J. Met. Mater. Miner. 2022, 32, 42–49. [Google Scholar] [CrossRef]
- Sehanobish, K. Automotive Applications for Polyethylene. Handbook of Industrial Polyethylene and Technology: Definitive Guide to Manufacturing, Properties, Processing, Applications and Markets; John Wiley & Sons: Hoboken, NJ, USA, 2017; pp. 1169–1178. [Google Scholar]
- Bassiouny, R.; Ali, M.R.; Hassan, M.K. An idea to enhance the thermal performance of HDPE pipes used for ground-source applications. Appl. Therm. Eng. 2016, 109, 15–21. [Google Scholar] [CrossRef]
- Anjana, P.; Deepu, V.; Uma, S.; Mohanan, P.; Philip, J.; Sebastian, M. Dielectric, thermal, and mechanical properties of CeO2-filled HDPE composites for microwave substrate applications. J. Polym. Sci. Part B Polym. Phys. 2010, 48, 998–1008. [Google Scholar] [CrossRef]
- Bremner, T.; Rudin, A.; Cook, D. Melt flow index values and molecular weight distributions of commercial thermoplastics. J. Appl. Polym. Sci. 1990, 41, 1617–1627. [Google Scholar] [CrossRef]
- Li, R.; Sun, B.; Dang, L.; Pan, T.; Xu, J.; Xu, S. Effect of the melt flow index of compatibilizer on the melt processing and properties of highly filled magnesium hydroxide/linear low density polyethylene composites. J. Appl. Polym. Sci. 2023, 140, e54371. [Google Scholar] [CrossRef]
- de Carvalho, M.S.; Azevedo, J.B.; Barbosa, J.D.V. Effect of the melt flow index of an HDPE matrix on the properties of composites with wood particles. Polym. Test. 2020, 90, 106678. [Google Scholar] [CrossRef]
- Escocio, V.A.; Visconte, L.L.; da Silva Nazareth, A.L.; de Sousa, A.M.; Pacheco, E.B. Permeability, melt flow index, mechanical, and morphological properties of green HDPE composites: Effect of mineral fillers. Macromol. Symp. 2018, 381, 1800127. [Google Scholar] [CrossRef]
- ASTM D1238; Standard Test Method for Melt Flow Rates of Thermoplastics by Extrusion Plastometer. American Society For Testing Materials: West Conshohocken, PA, USA, 2023.
- ASTM D792; Standard Test Methods for Density and Specific Gravity (Relative Density) of Plastics by Displacement. American Society For Testing Materials: West Conshohocken, PA, USA, 2020.
- ASTM D2240; Standard Test Method for Rubber Property-Durometer Hardness. American Society For Testing Materials: West Conshohocken, PA, USA, 2021.
- ASTM D256; Standard Test Methods for Determining the Izod Pendulum Impact Resistance of Plastics. American Society For Testing Materials: West Conshohocken, PA, USA, 2018.
- ASTM D638; Standard Test Method for Tensile Properties of Plastic. American Society For Testing Materials: West Conshohocken, PA, USA, 2022.
- Lei, Y.; Wu, Q.; Clemons, C.M.; Yao, F.; Xu, Y. Influence of nanoclay on properties of HDPE/wood composites. J. Appl. Polym. Sci. 2007, 106, 3958–3966. [Google Scholar] [CrossRef]
- Ezzahrae, M.F.; Nacer, A.; Latifa, E.; Abdellah, Z.; Mohamed, I.; Mustapha, J. Thermal and mechanical properties of a high-density polyethylene (HDPE) composite reinforced with wood flour. Mater. Today: Proc. 2023, 72, 3602–3608. [Google Scholar]
- Shi, S.C.; Zeng, X.X. Effect of the strengthening mechanism of SiO2 reinforced poly (methyl methacrylate) on ductility performance. J. Polym. Res. 2022, 29, 408. [Google Scholar] [CrossRef]
- Honek, T.; Hausnerova, B.; Saha, P. Relative viscosity models and their application to capillary flow data of highly filled hard-metal carbide powder compounds. Polym. Compos. 2005, 26, 29–36. [Google Scholar] [CrossRef]
- Carrot, C.; Olalla, B.; Fulchiron, R. Relaxation of loose agglomerates of magnesium hydroxide in a polymer melt. Polymer 2012, 53, 5560–5567. [Google Scholar] [CrossRef]


| Sample | Composite Configuration | Matrix/Mineral (wt.%) | MFI HDPE (g/10 min) | Particle Size Mineral Filler |
|---|---|---|---|---|
| A1 | HDPE/BB | 70/30 | 25 | D < 20 m |
| A2 | HDPE/CRN | 70/30 | 25 | D < 20 m |
| A3 | HDPE/BB | 70/30 | 7 | 20 < D < 44 m |
| A4 | HDPE/CRN | 70/30 | 7 | 20 < D < 44 m |
| A5 | HDPE/BB | 70/30 | 25 | 20 < D < 44 m |
| A6 | HDPE/CRN | 70/30 | 25 | 20 < D < 44 m |
| Factors | Level Values | |
|---|---|---|
| Minimum | Maximum | |
| MFI, g/10 min | 7 | 25 |
| RW | 0 (Bahia Beige marble waste) | 1 (limestone waste from Rio Grande do Norte) |
| D | 0 (D1 < 20 mm) | 1 (20 mm < D2 < 44 mm) |
| Experiment | MFI | RW | D |
|---|---|---|---|
| 1 | 7 | 0 | 1 |
| 2 | 7 | 1 | 1 |
| 3 | 25 | 0 | 0 |
| 4 | 25 | 0 | 1 |
| 5 | 25 | 1 | 0 |
| 6 | 25 | 1 | 1 |
| Sample | CaO | MgO | SiO2 | Al2O3 | SO3 | K2O | Fe2O3 | SrO | Cl | P2O5 | Na2O | LOI 1 |
|---|---|---|---|---|---|---|---|---|---|---|---|---|
| CRN | 32.7 | 18.8 | 1.1 | 0.37 | 0.04 | 0.06 | 0.16 | 0.03 | 0.06 | 0.09 | 0.39 | 46.2 |
| BB | 32.1 | 20.7 | 1.0 | 0.37 | ND | ND | 0.16 | ND | ND | 0.1 | 0.09 | 45.5 |
| Sample | Density (g/cm3) | Hardness (Shore D) | Impact Resistance (kJ/m2) | Tensile Strength (MPa) | Elastic Modulus (MPa) |
|---|---|---|---|---|---|
| HDPE [39] | 0.96 | 46.00 ± 2.50 | 2.41 ± 0.42 | 26.65 ± 1.64 | - |
| A1 | 1.07 ± 0.05 | 57.40 ± 1.14 | 2.61 ± 0.33 | 19.75 ± 0.50 | 335.50 ± 26.85 |
| A2 | 1.14 ± 0.02 | 59.00 ± 1.00 | 2.64 ± 0.14 | 18.00 ± 1.41 | 313.25 ± 15.88 |
| A3 | 1.14 ± 0.02 | 59.10 ± 1.01 | 3.02 ± 0.26 | 21.19 ± 0.49 | 292.00 ± 8.72 |
| A4 | 1.10 ± 0.02 | 59.80 ± 0.45 | 3.62 ± 0.09 | 20.40 ± 1.12 | 302.25 ± 77.99 |
| A5 | 1.03 ± 0.03 | 57.80 ± 0.84 | 2.97 ± 0.14 | 20.87 ± 2.59 | 307.50 ± 11.82 |
| A6 | 1.17 ± 0.01 | 58.60 ± 0.55 | 2.84 ± 0.40 | 16.90 ± 1.13 | 277.50 ± 50.81 |
| Model of | R-sq, % | R-sq (adj), % | Significance F |
|---|---|---|---|
| Density (DEN) | 99.95% | 95.78% | 1.70 × 10−37 |
| Hardness (H) | 99.98% | 95.81% | 3.15 × 10−42 |
| Izod impact resistance J/m2 (IR) | 99.46% | 93.76% | 1.55 × 10⁻¹⁸ |
| Tensile strength (Ts) | 99.62% | 93.96% | 8.65 × 10⁻²⁰ |
| Elastic modulus (Em) | 98.69% | 92.78% | 2.90 × 10⁻¹⁵ |
| Term | Coefficients | St. Error | Stat t | p-Value |
|---|---|---|---|---|
| MFI | 0.0427 | 0.0005 | 90.4450 | 6.34 × 10⁻³² |
| RW | −0.1764 | 0.0368 | −4.7905 | 7.08 × 10⁻⁵ |
| D | 1.1882 | 0.0170 | 69.7388 | 3.18 × 10⁻²⁹ |
| MFI-RW | 0.0101 | 0.0013 | 7.6612 | 6.73 × 10⁻⁸ |
| MFI-D | −0.0488 | 0.0010 | −46.9029 | 4.04 × 10⁻²⁵ |
| RW-D | 0.0646 | 0.0236 | 2.7343 | 0.0116 |
| Term | Coefficients | St. Error | Stat t | p-Value |
|---|---|---|---|---|
| MFI | 2.2960 | 0.0155 | 148.2062 | 4.61 × 10−37 |
| RW | 1.6000 | 1.2072 | 1.3253 | 0.1975 |
| D | 59.4667 | 0.5586 | 106.4561 | 1.28 × 10⁻³³ |
| MFI-RW | 0.0000 | 0.0430 | 0.0000 | 1.0000 |
| MFI-D | −2.3627 | 0.0341 | −69.1938 | 3.89 × 10⁻²⁹ |
| RW-D | −0.8000 | 0.7746 | −1.0328 | 0.3120 |
| Term | Coefficients | St. Error | Stat t | p-Value |
|---|---|---|---|---|
| MFI | 0.1046 | 0.0050 | 20.7329 | 5.17 × 10⁻¹⁴ |
| RW | 1.0458 | 0.3931 | 2.6601 | 0.0159 |
| D | 3.0444 | 0.1819 | 16.7355 | 2.04 × 10⁻¹² |
| MFI-RW | −0.0408 | 0.0140 | −2.9137 | 0.0093 |
| MFI-D | −0.1074 | 0.0111 | −9.6563 | 1.53 × 10⁻⁸ |
| RW-D | −0.1600 | 0.2523 | −0.6343 | 0.5339 |
| Term | Coefficients | St. Error | Stat t | p-Value |
|---|---|---|---|---|
| MFI | 0.7900 | 0.0280 | 28.1902 | 2.40 × 10⁻¹⁶ |
| RW | 2.6674 | 2.1838 | 1.2215 | 0.2377 |
| D | 21.3187 | 1.0105 | 21.0976 | 3.82 × 10⁻¹⁴ |
| MFI-RW | −0.1767 | 0.0778 | −2.2699 | 0.0357 |
| MFI-D | −0.8077 | 0.0618 | −13.0773 | 1.25 × 10⁻¹⁰ |
| RW-D | −2.2222 | 1.4012 | −1.5859 | 0.1302 |
| Term | Coeficients | St. Error | Stat t | p-Value |
|---|---|---|---|---|
| MFI | 13.4200 | 0.8105 | 16.5578 | 2.44 × 10⁻¹² |
| RW | 33.6528 | 63.1589 | 0.5328 | 0.6007 |
| D | 285.9722 | 29.2245 | 9.7854 | 1.25 × 10⁻⁸ |
| MFI-RW | −2.2361 | 2.2514 | −0.9932 | 0.3338 |
| MFI-D | −12.5589 | 1.7864 | −7.0303 | 1.47 × 10⁻⁶ |
| RW-D | −7.7500 | 40.5247 | −0.1912 | 0.8505 |
Disclaimer/Publisher’s Note: The statements, opinions and data contained in all publications are solely those of the individual author(s) and contributor(s) and not of MDPI and/or the editor(s). MDPI and/or the editor(s) disclaim responsibility for any injury to people or property resulting from any ideas, methods, instructions or products referred to in the content. |
© 2024 by the authors. Licensee MDPI, Basel, Switzerland. This article is an open access article distributed under the terms and conditions of the Creative Commons Attribution (CC BY) license (https://creativecommons.org/licenses/by/4.0/).
Share and Cite
da Silveira, P.H.P.M.; da Conceição, M.d.N.; de Pina, D.N.; de Moraes Paes, P.A.; Monteiro, S.N.; Tapanes, N.d.L.C.O.; da Conceição Ribeiro, R.C.; Bastos, D.C. Impact of Different Mineral Reinforcements on HDPE Composites: Effects of Melt Flow Index and Particle Size on Physical and Mechanical Properties. Polymers 2024, 16, 2063. https://doi.org/10.3390/polym16142063
da Silveira PHPM, da Conceição MdN, de Pina DN, de Moraes Paes PA, Monteiro SN, Tapanes NdLCO, da Conceição Ribeiro RC, Bastos DC. Impact of Different Mineral Reinforcements on HDPE Composites: Effects of Melt Flow Index and Particle Size on Physical and Mechanical Properties. Polymers. 2024; 16(14):2063. https://doi.org/10.3390/polym16142063
Chicago/Turabian Styleda Silveira, Pedro Henrique Poubel Mendonça, Marceli do Nascimento da Conceição, Davi Nascimento de Pina, Pedro Afonso de Moraes Paes, Sergio Neves Monteiro, Neyda de La Caridad Om Tapanes, Roberto Carlos da Conceição Ribeiro, and Daniele Cruz Bastos. 2024. "Impact of Different Mineral Reinforcements on HDPE Composites: Effects of Melt Flow Index and Particle Size on Physical and Mechanical Properties" Polymers 16, no. 14: 2063. https://doi.org/10.3390/polym16142063