
Thermally Stabilised Poly(vinyl alcohol) Nanofibrous Materials Produced by Scalable Electrospinning: Applications in Tissue Engineering
 , , , , , and
Abstract
:1. Introduction
2. Materials and Methods
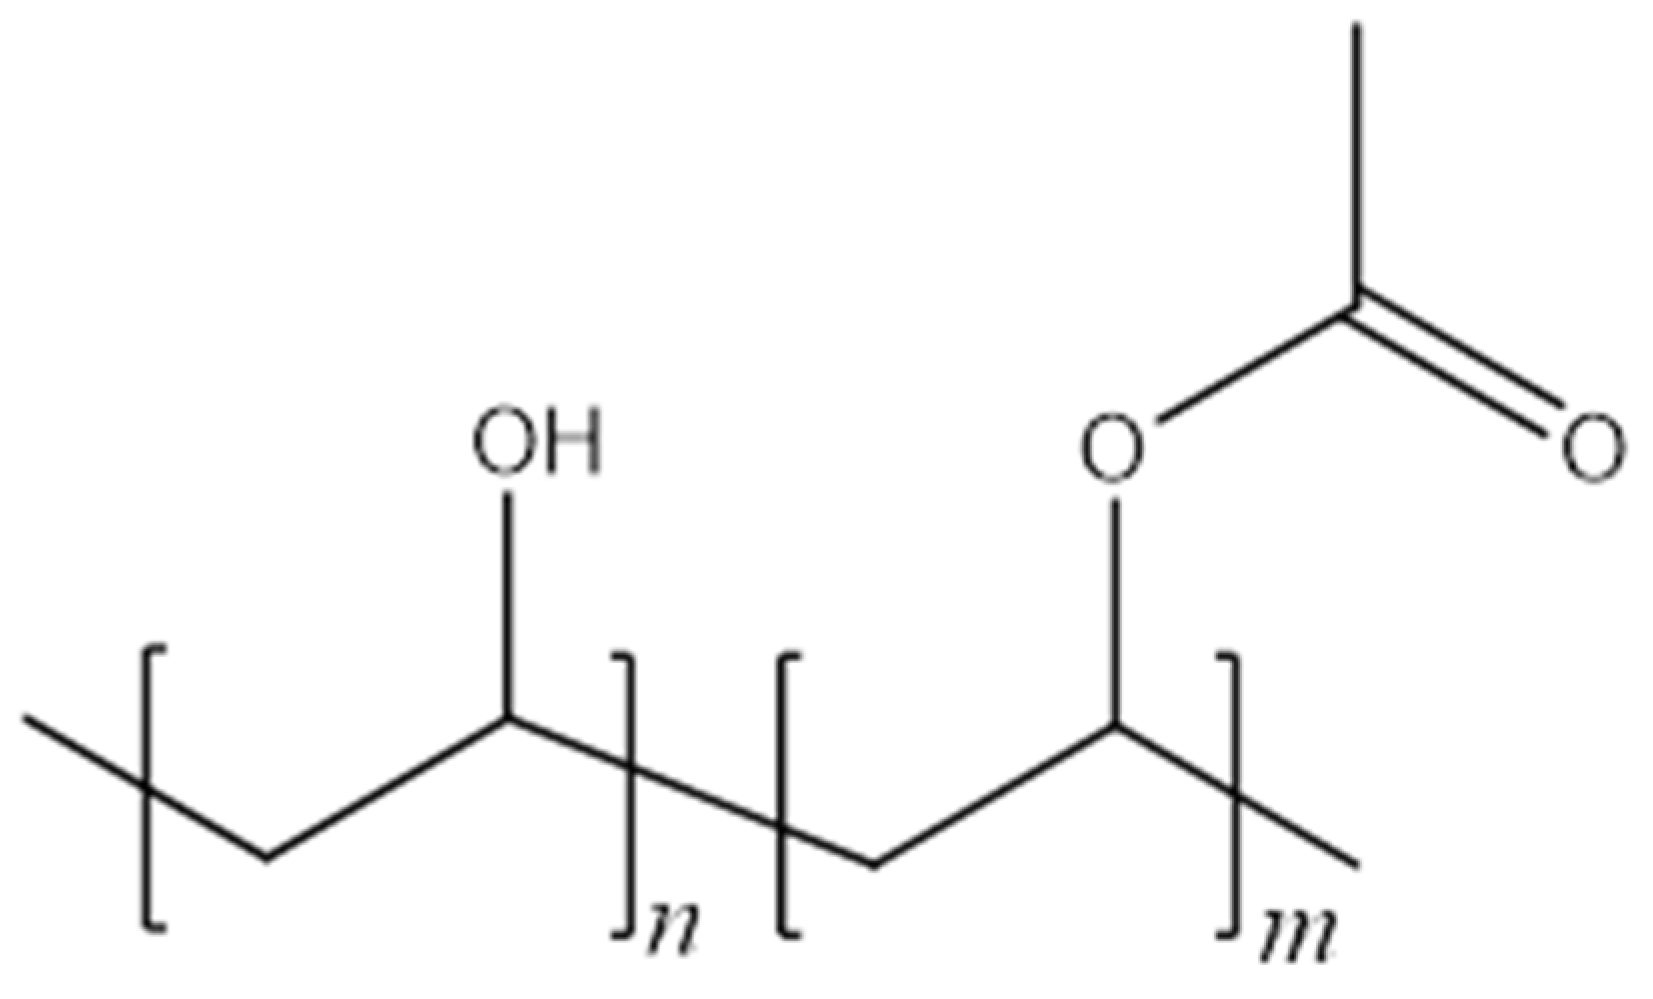
2.1. Materials
2.2. Production and Stabilisation of Electrospun Materials
2.3. Analytical Methods
2.3.1. Scanning Electron Microscopy
2.3.2. Fourier Transform-Infrared Spectroscopy
2.3.3. X-ray Diffraction
2.3.4. Tensile Testing
2.3.5. Contact Angle
2.3.6. Biocompatibility Testing
2.3.7. Hemocompatibility—Collection and Preparation of Blood Product Solutions
Thrombogenicity
Coagulation
Haemolysis
3. Results and Discussion
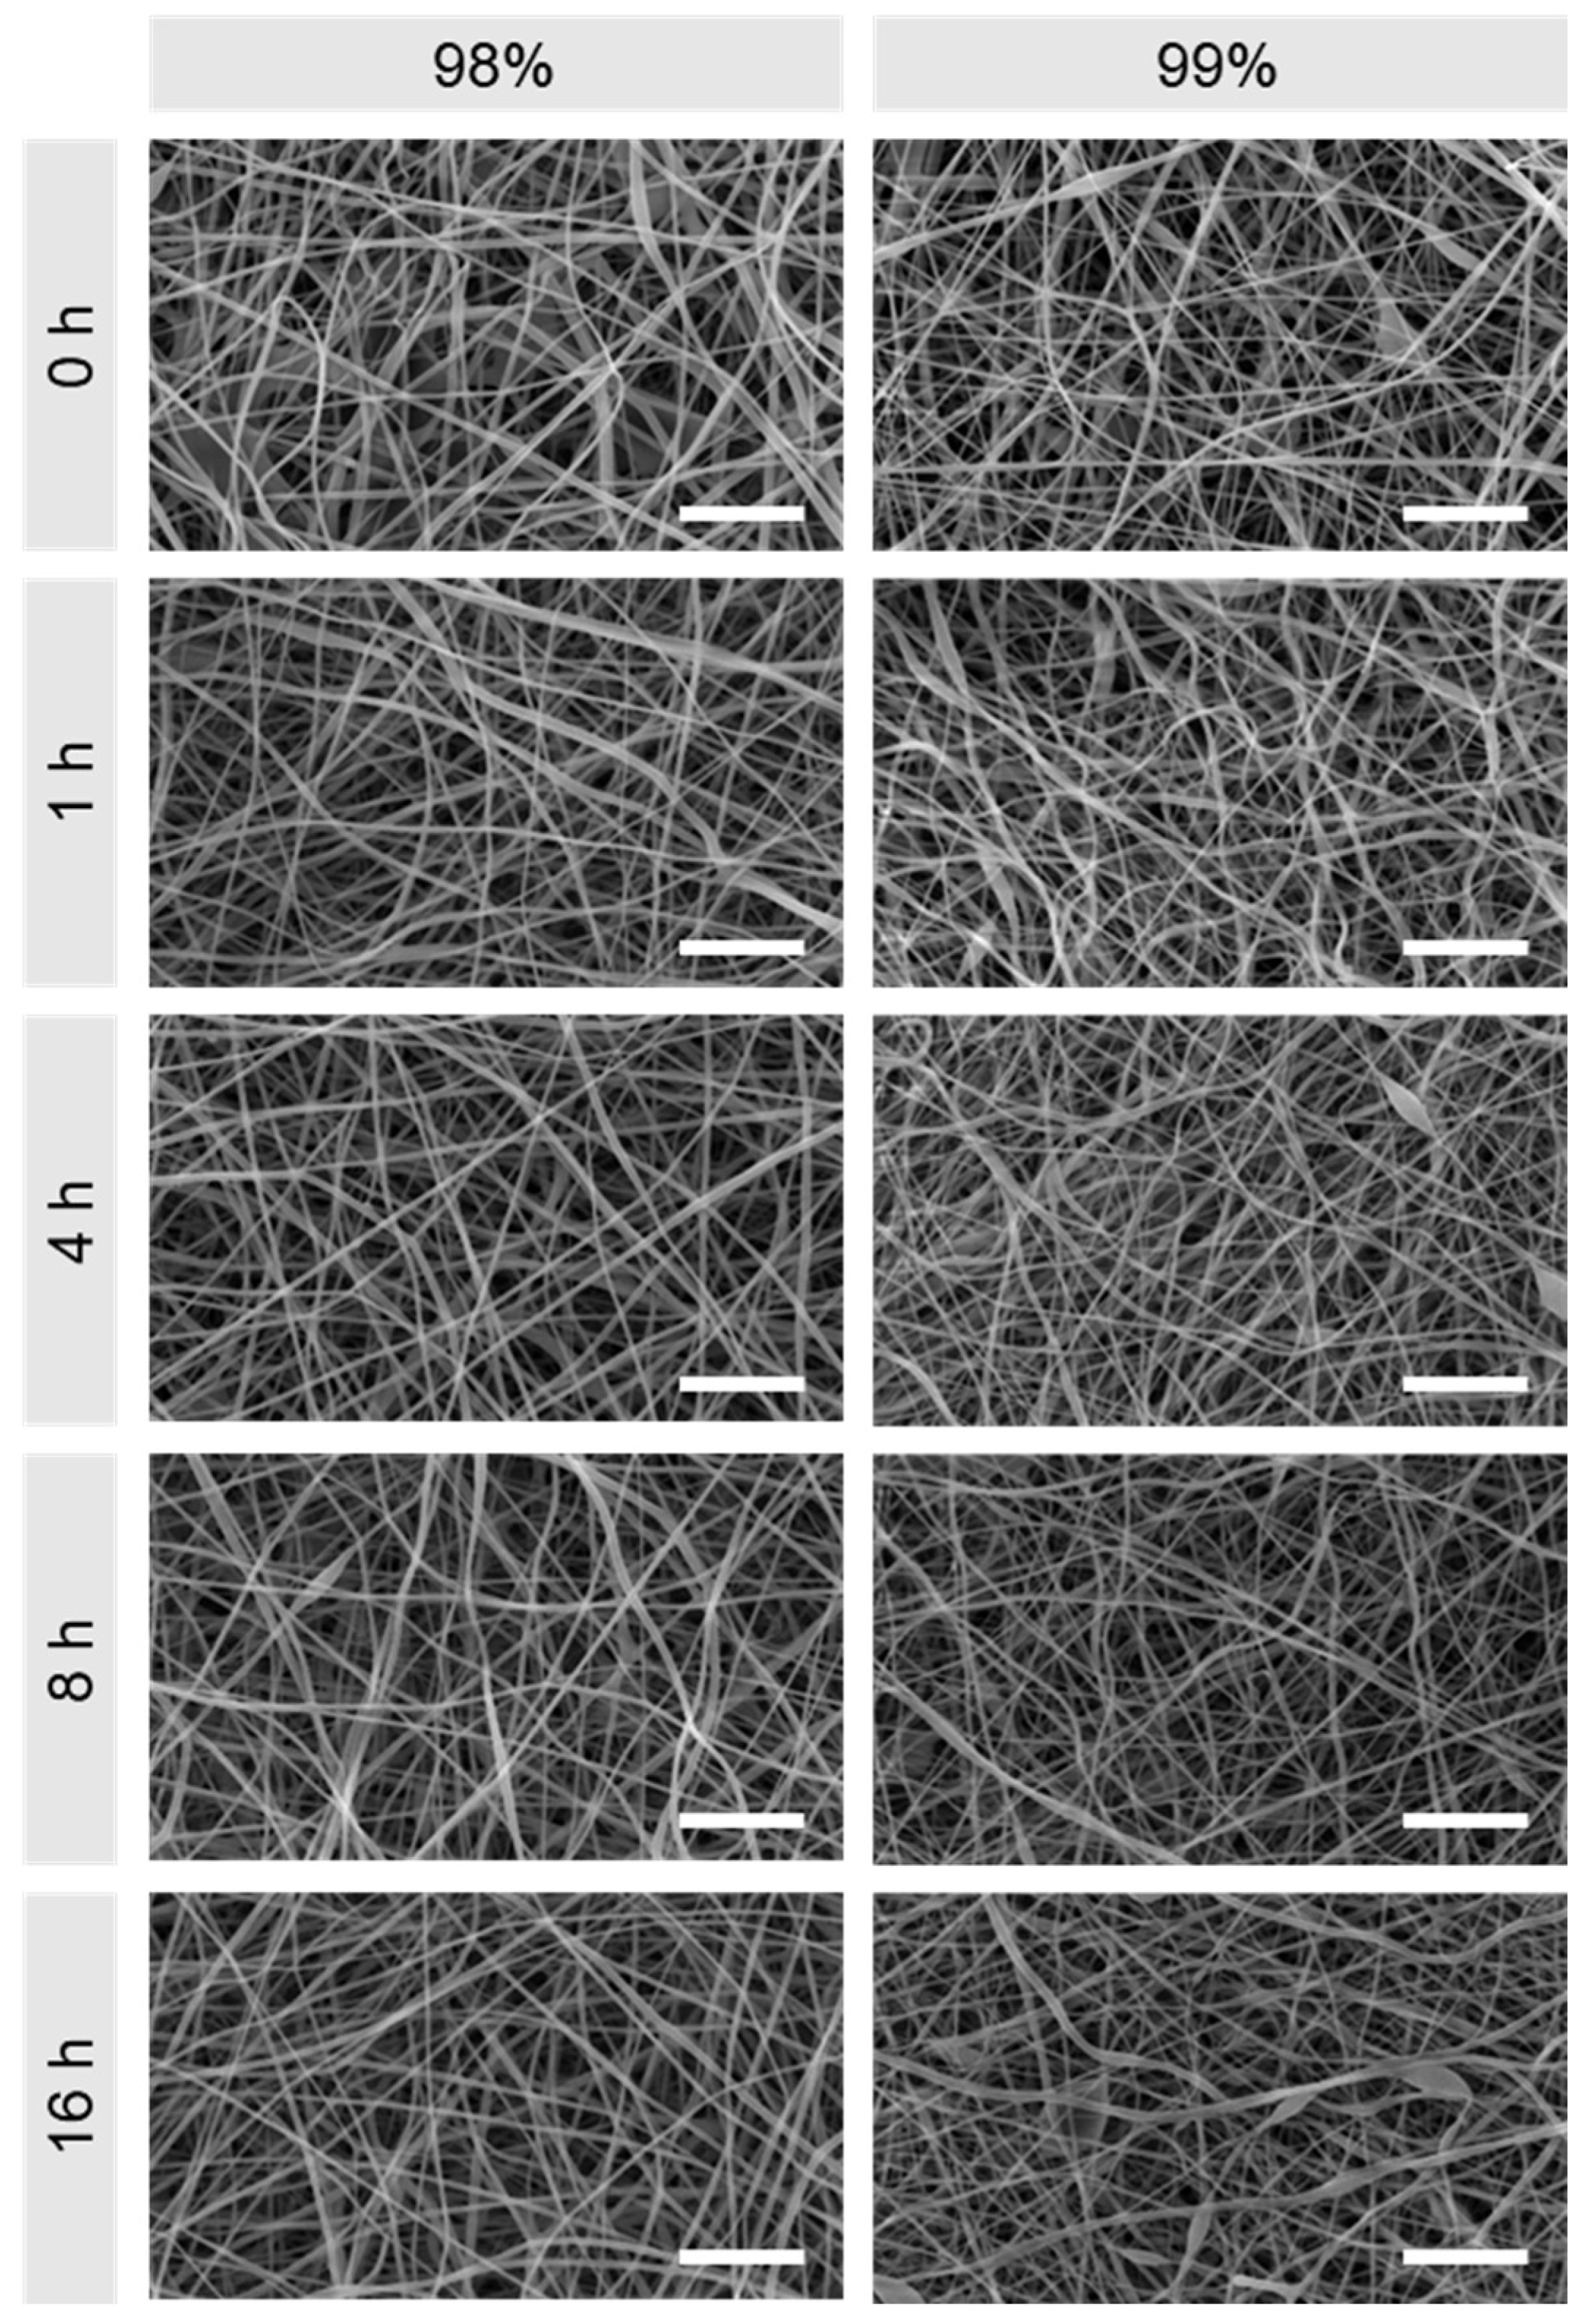
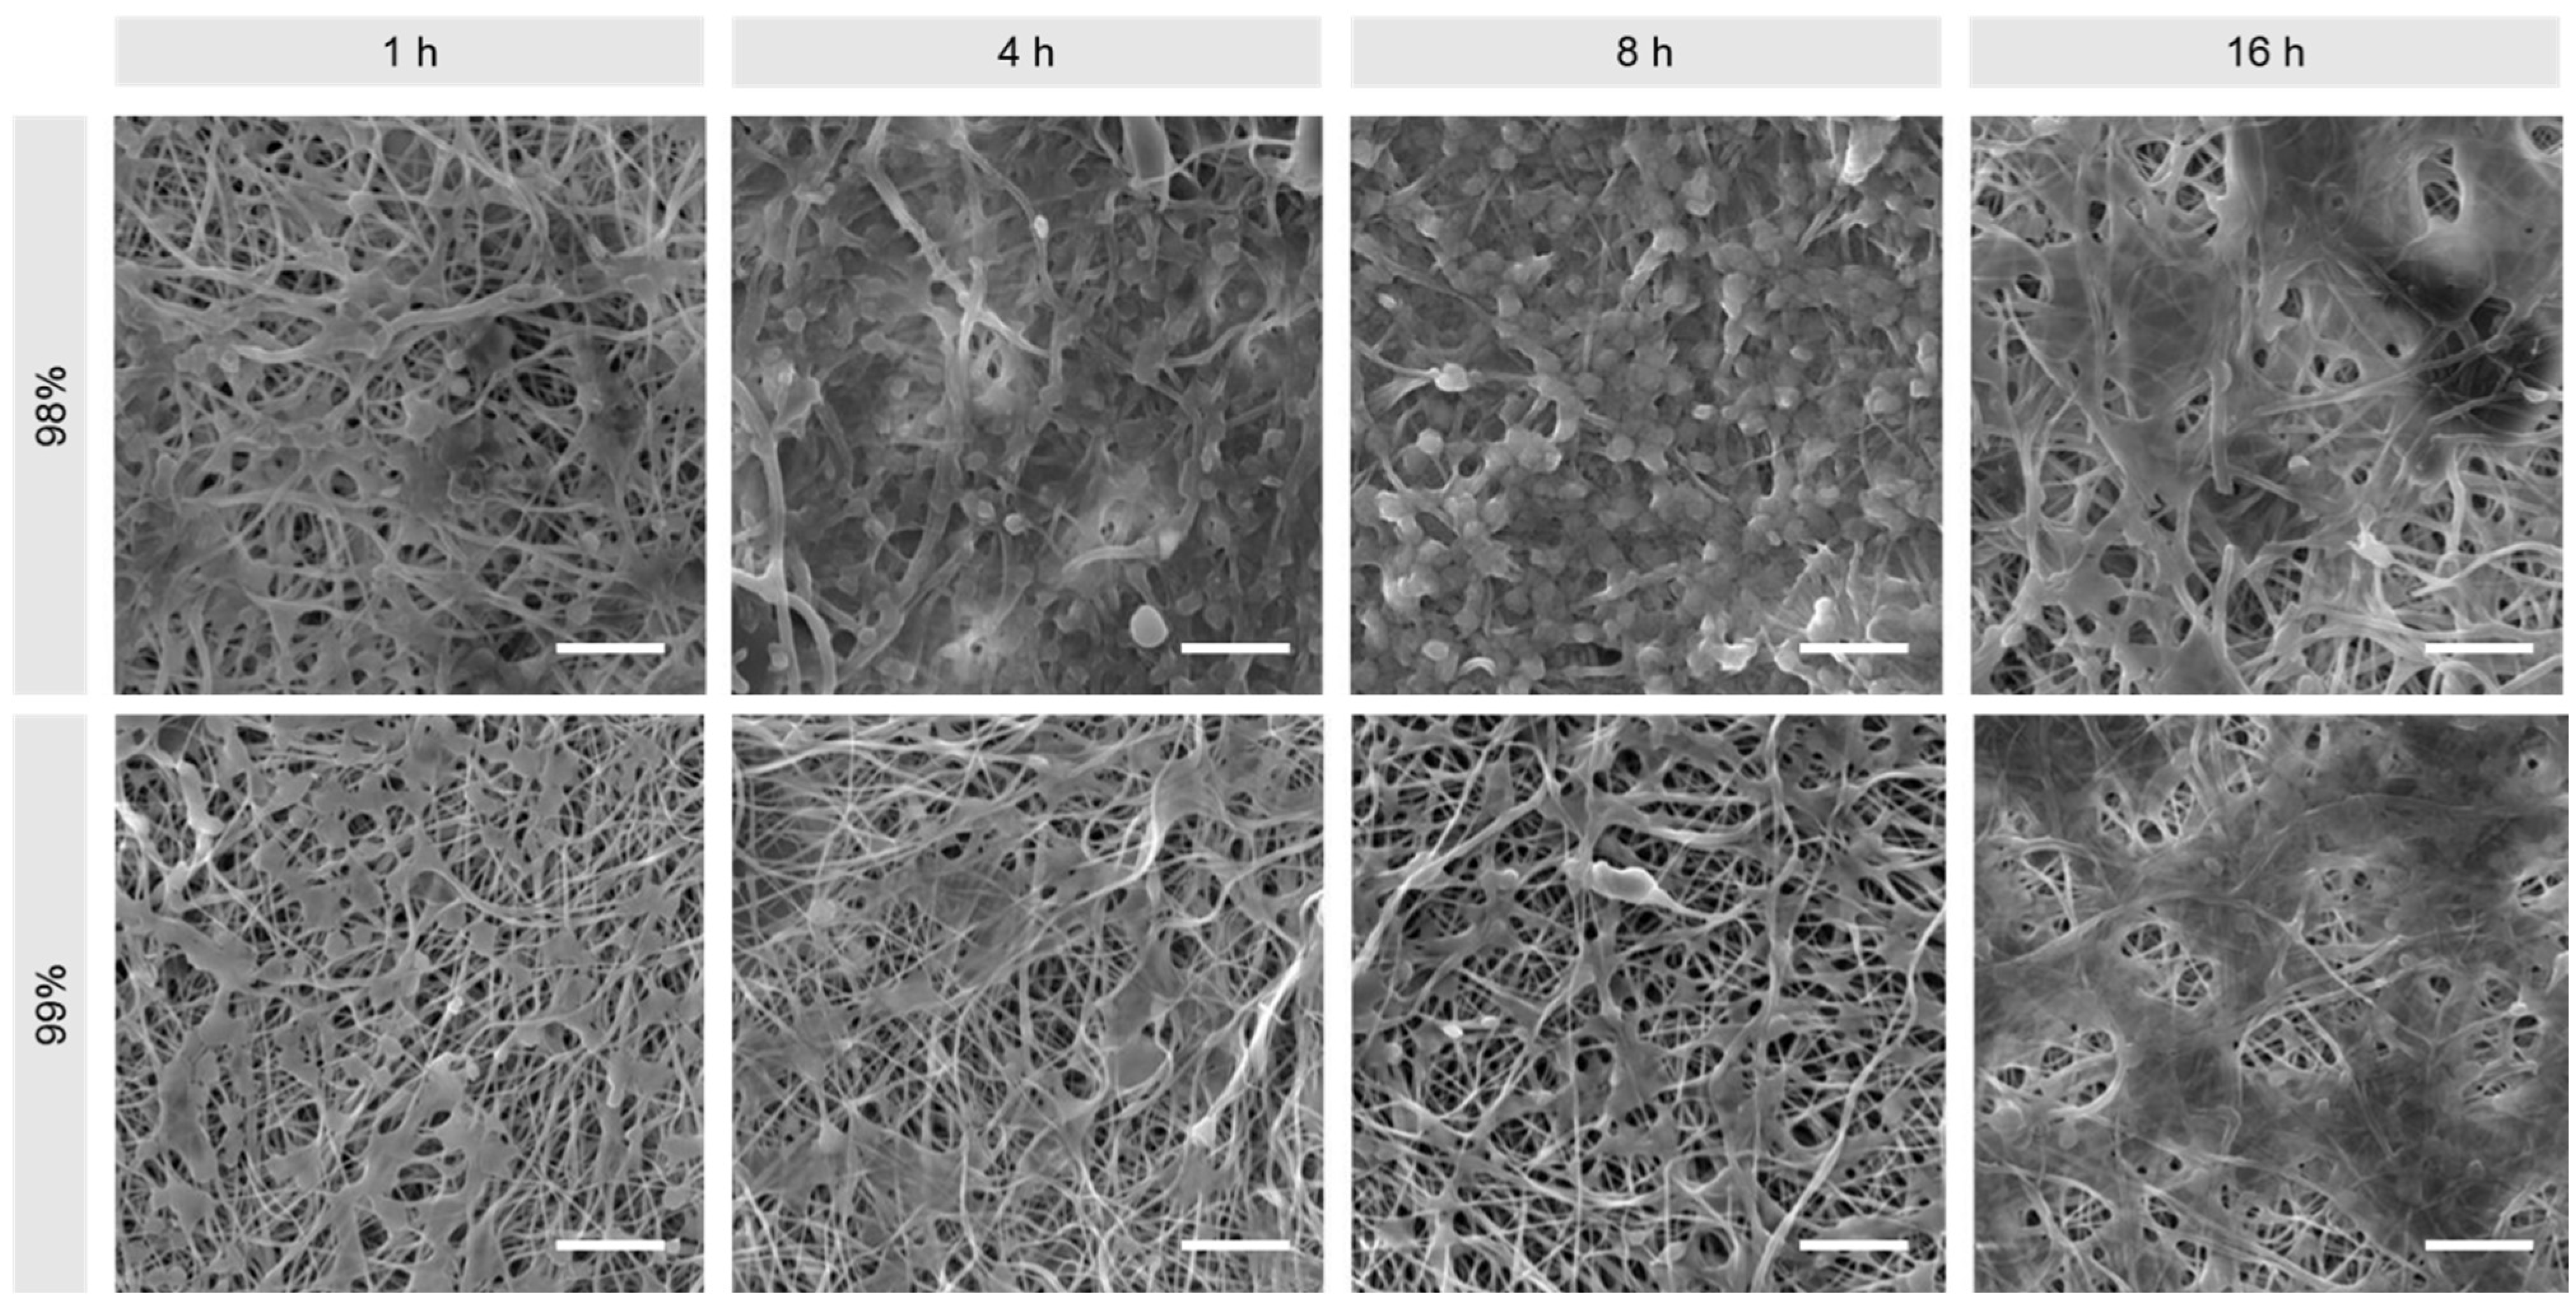
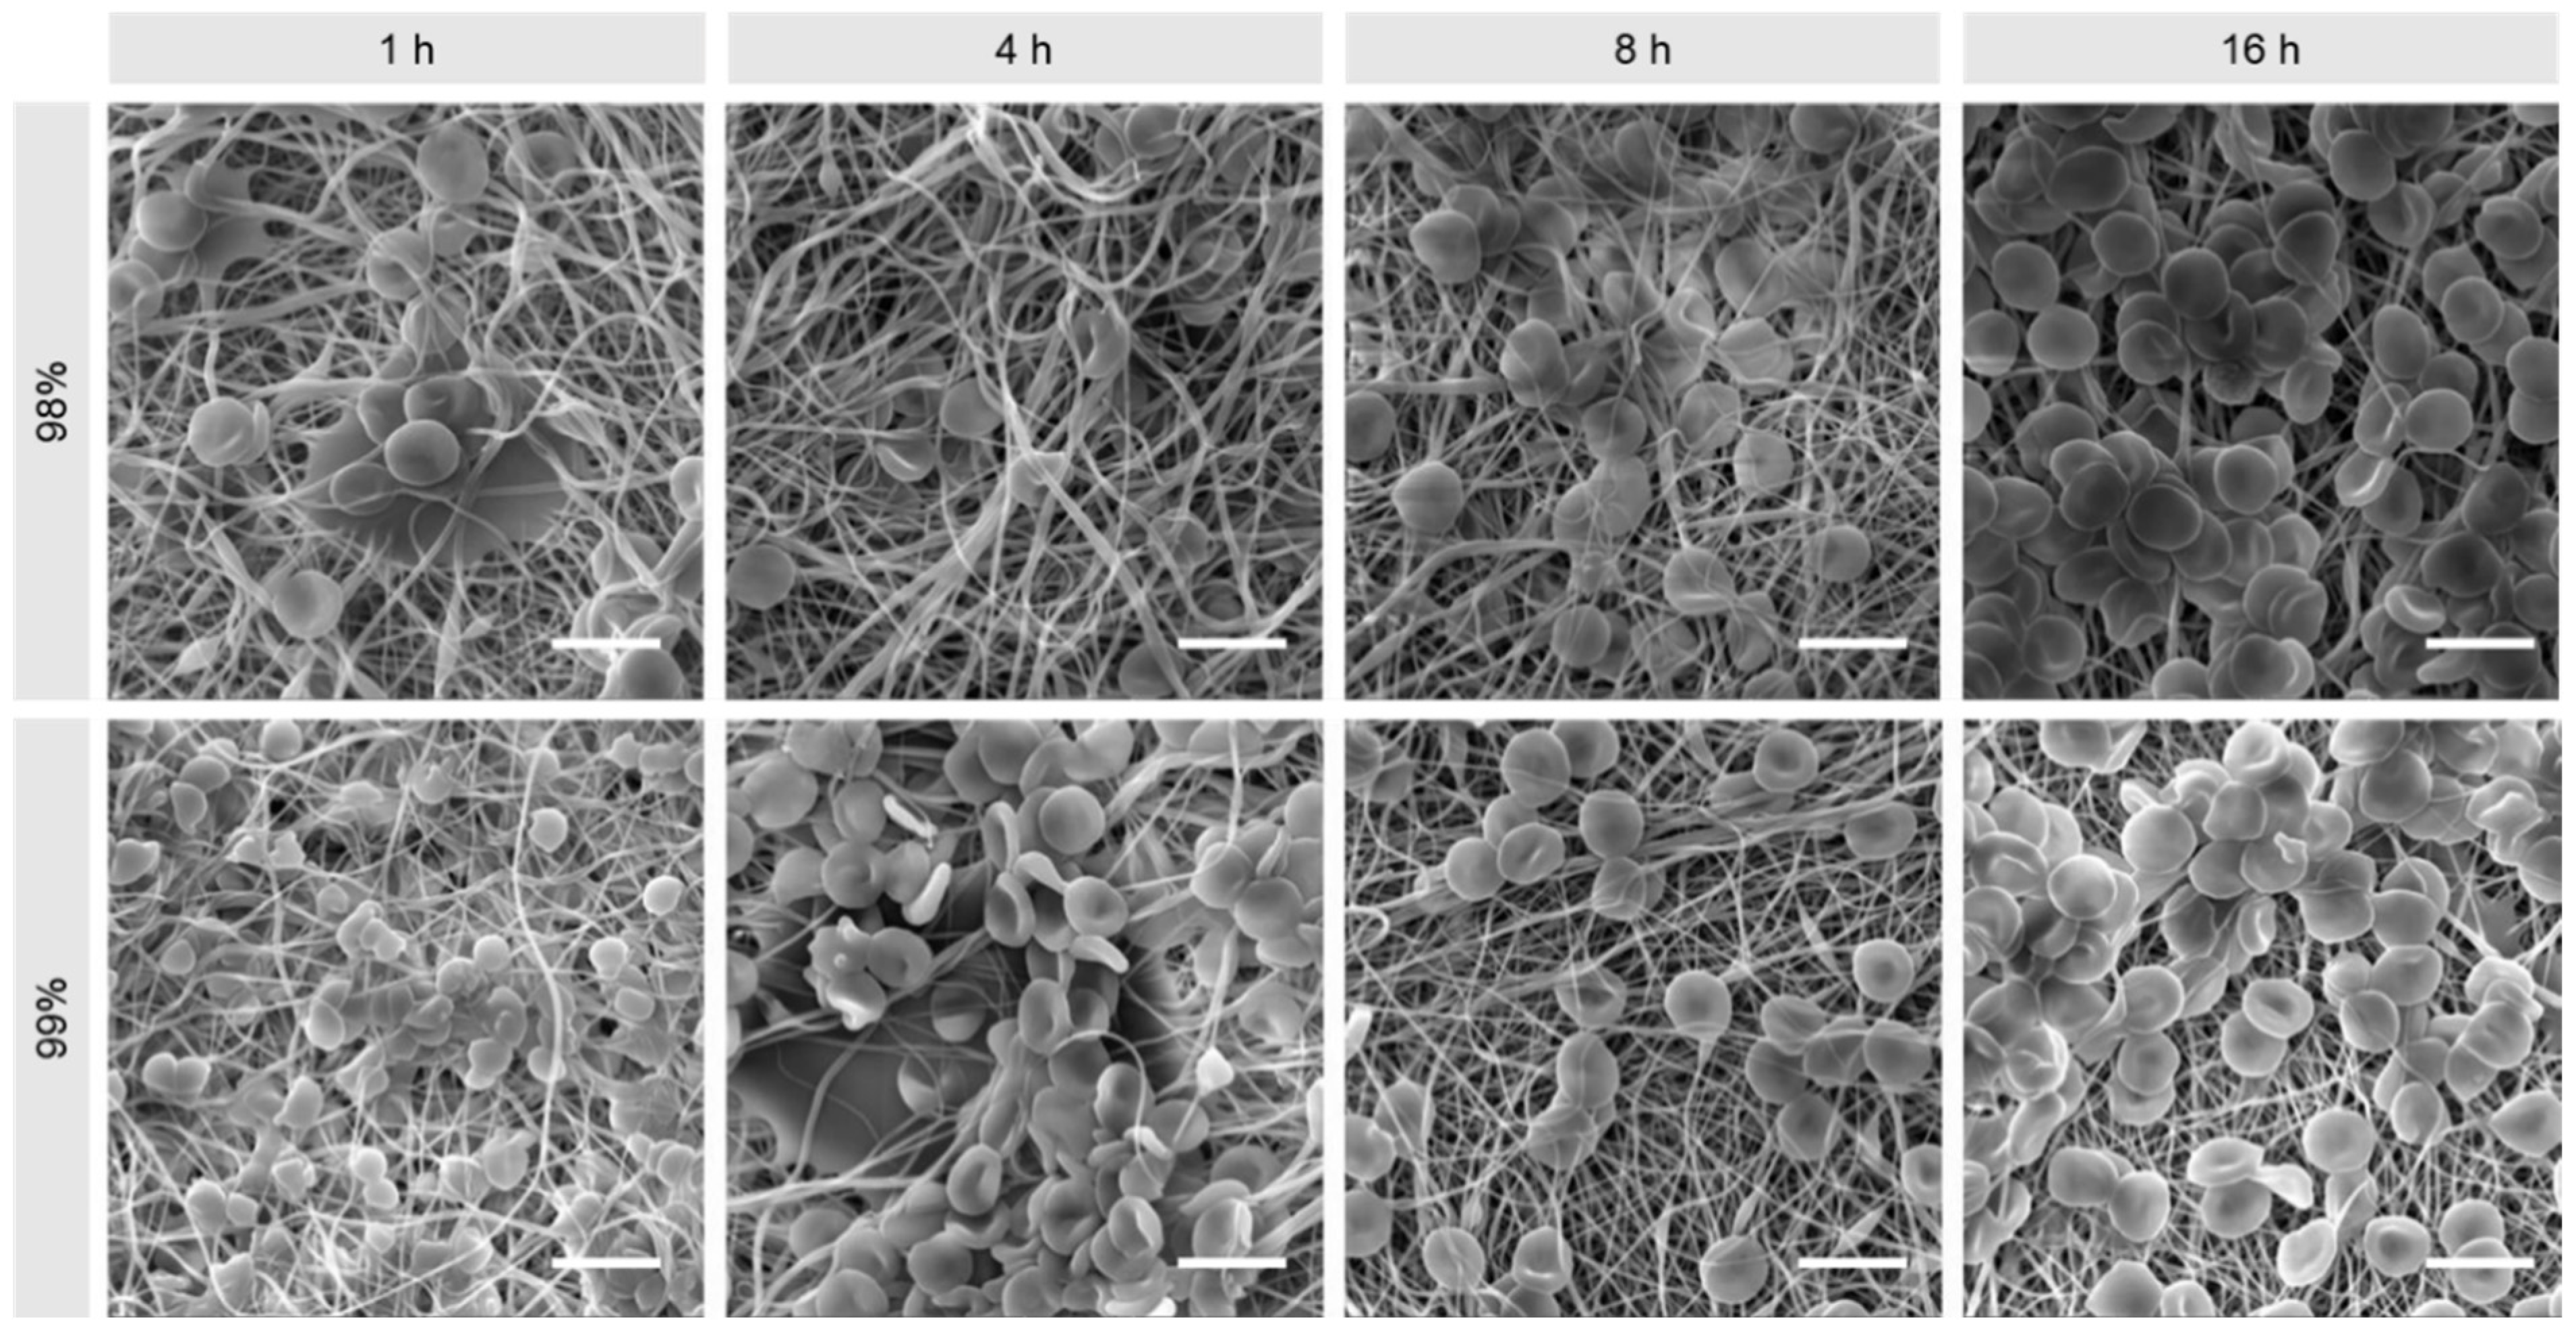
3.1. Morphological Comparison of Nanofibers Produced from 98% and 99% Hydrolysed PVA
3.2. Physicochemical Comparison of Nanofibers Produced from 98% and 99% Hydrolysed PVA
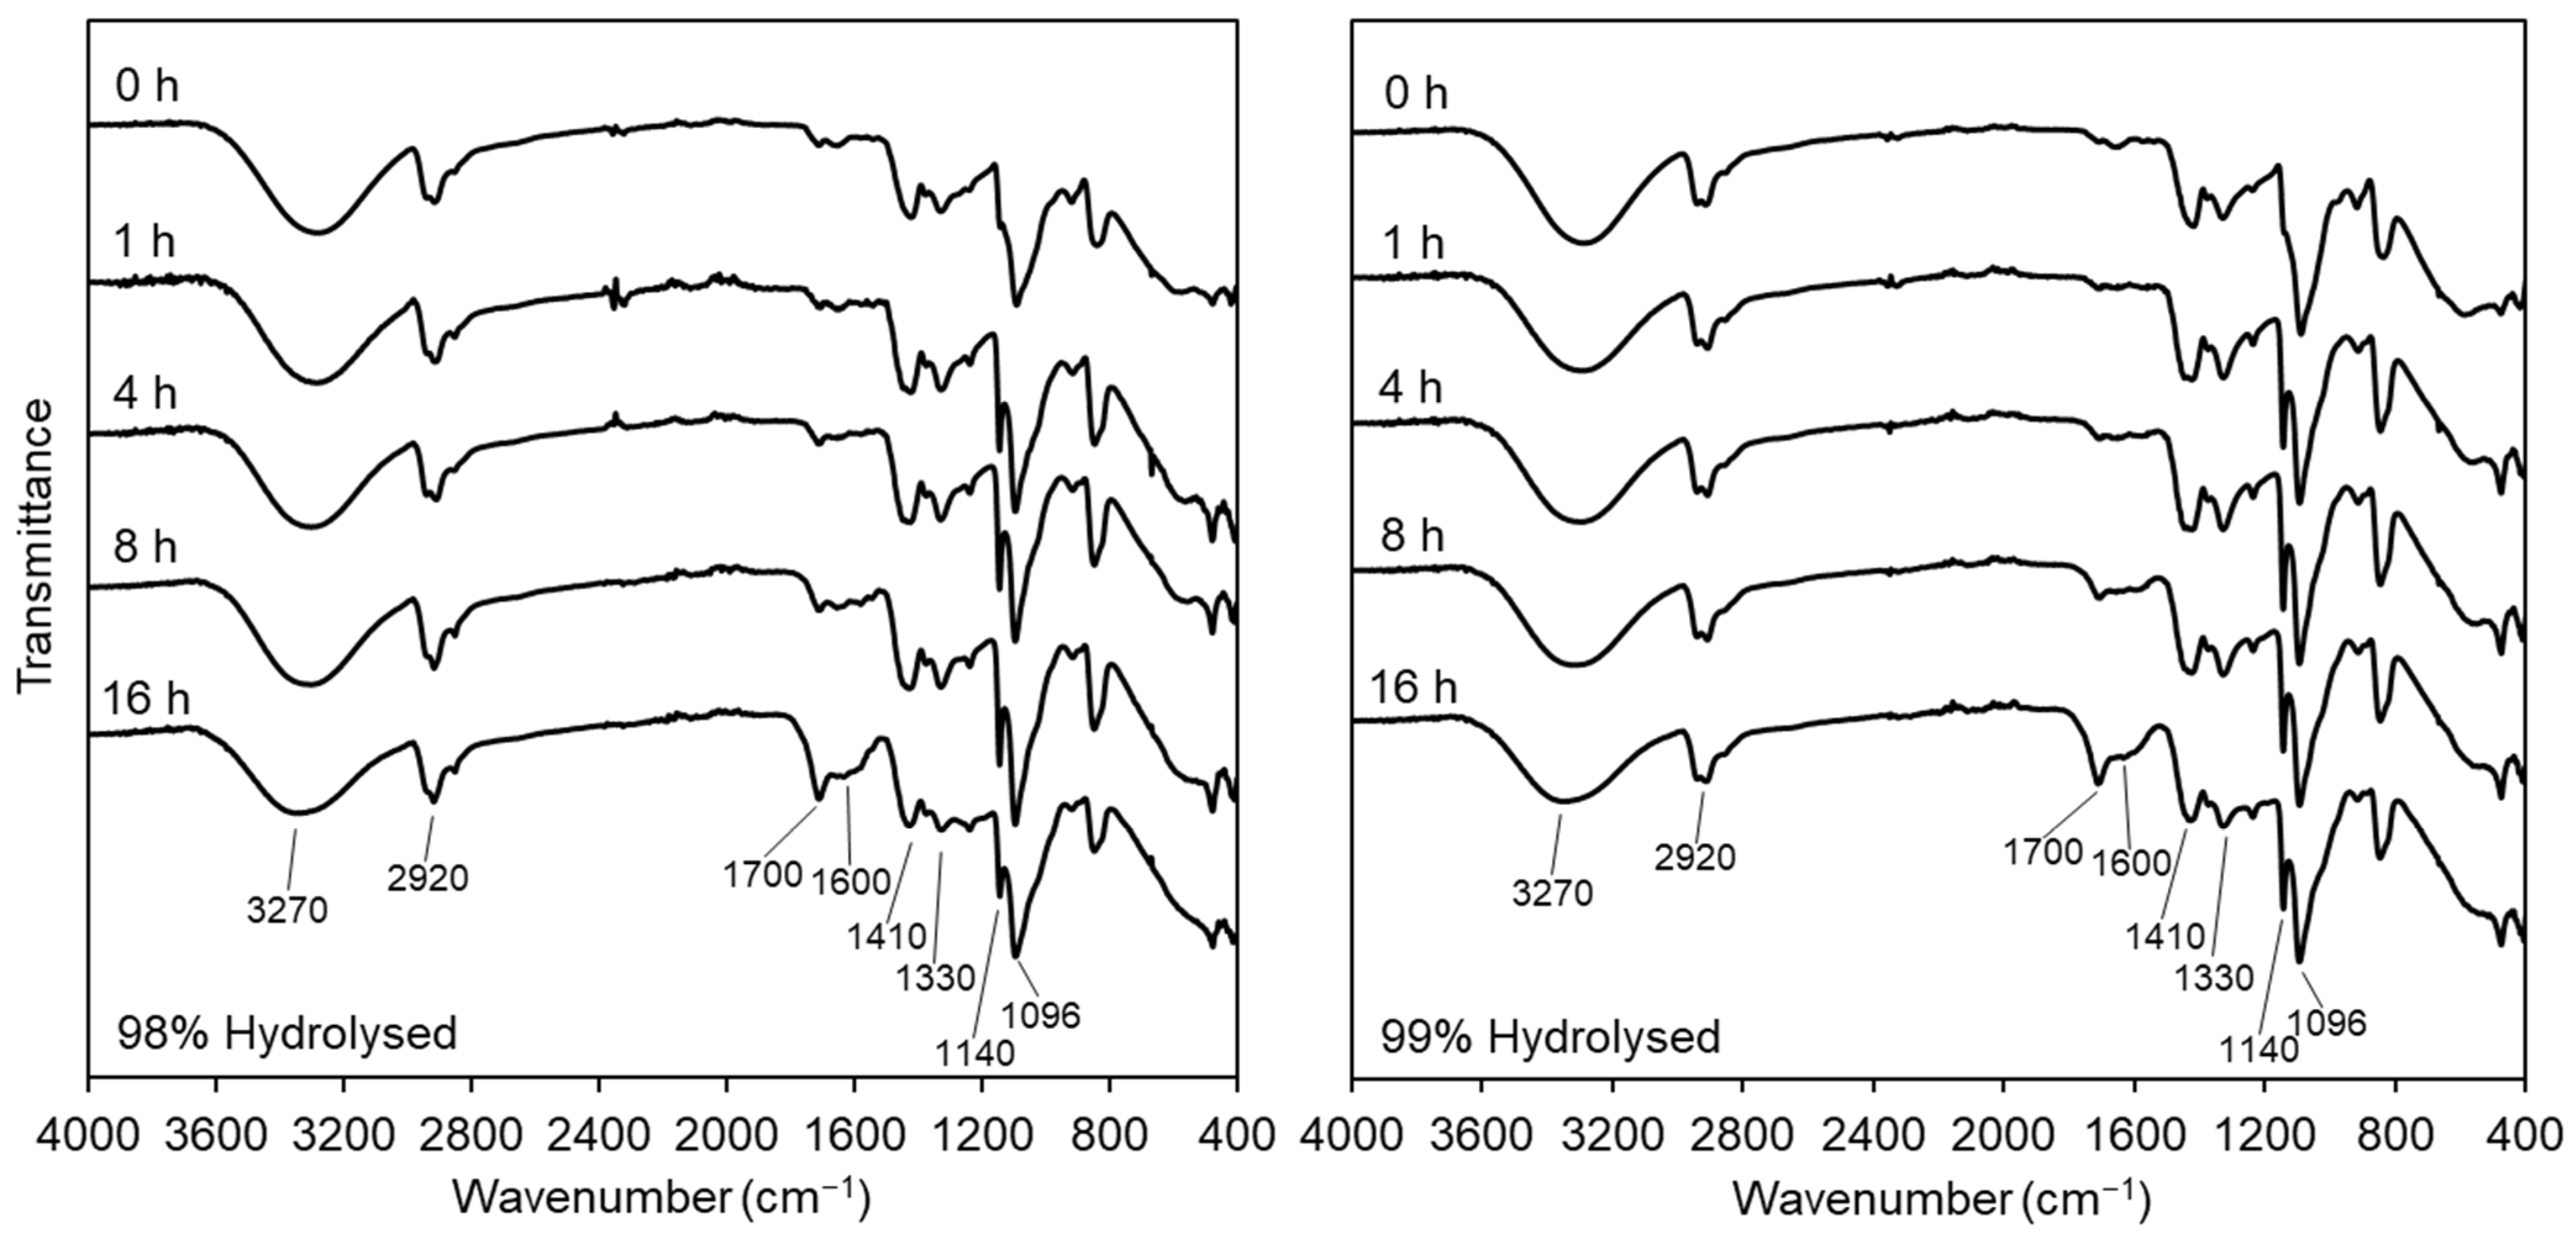
3.2.1. Fourier-Transform Infrared Spectroscopy
3.2.2. X-ray Diffraction
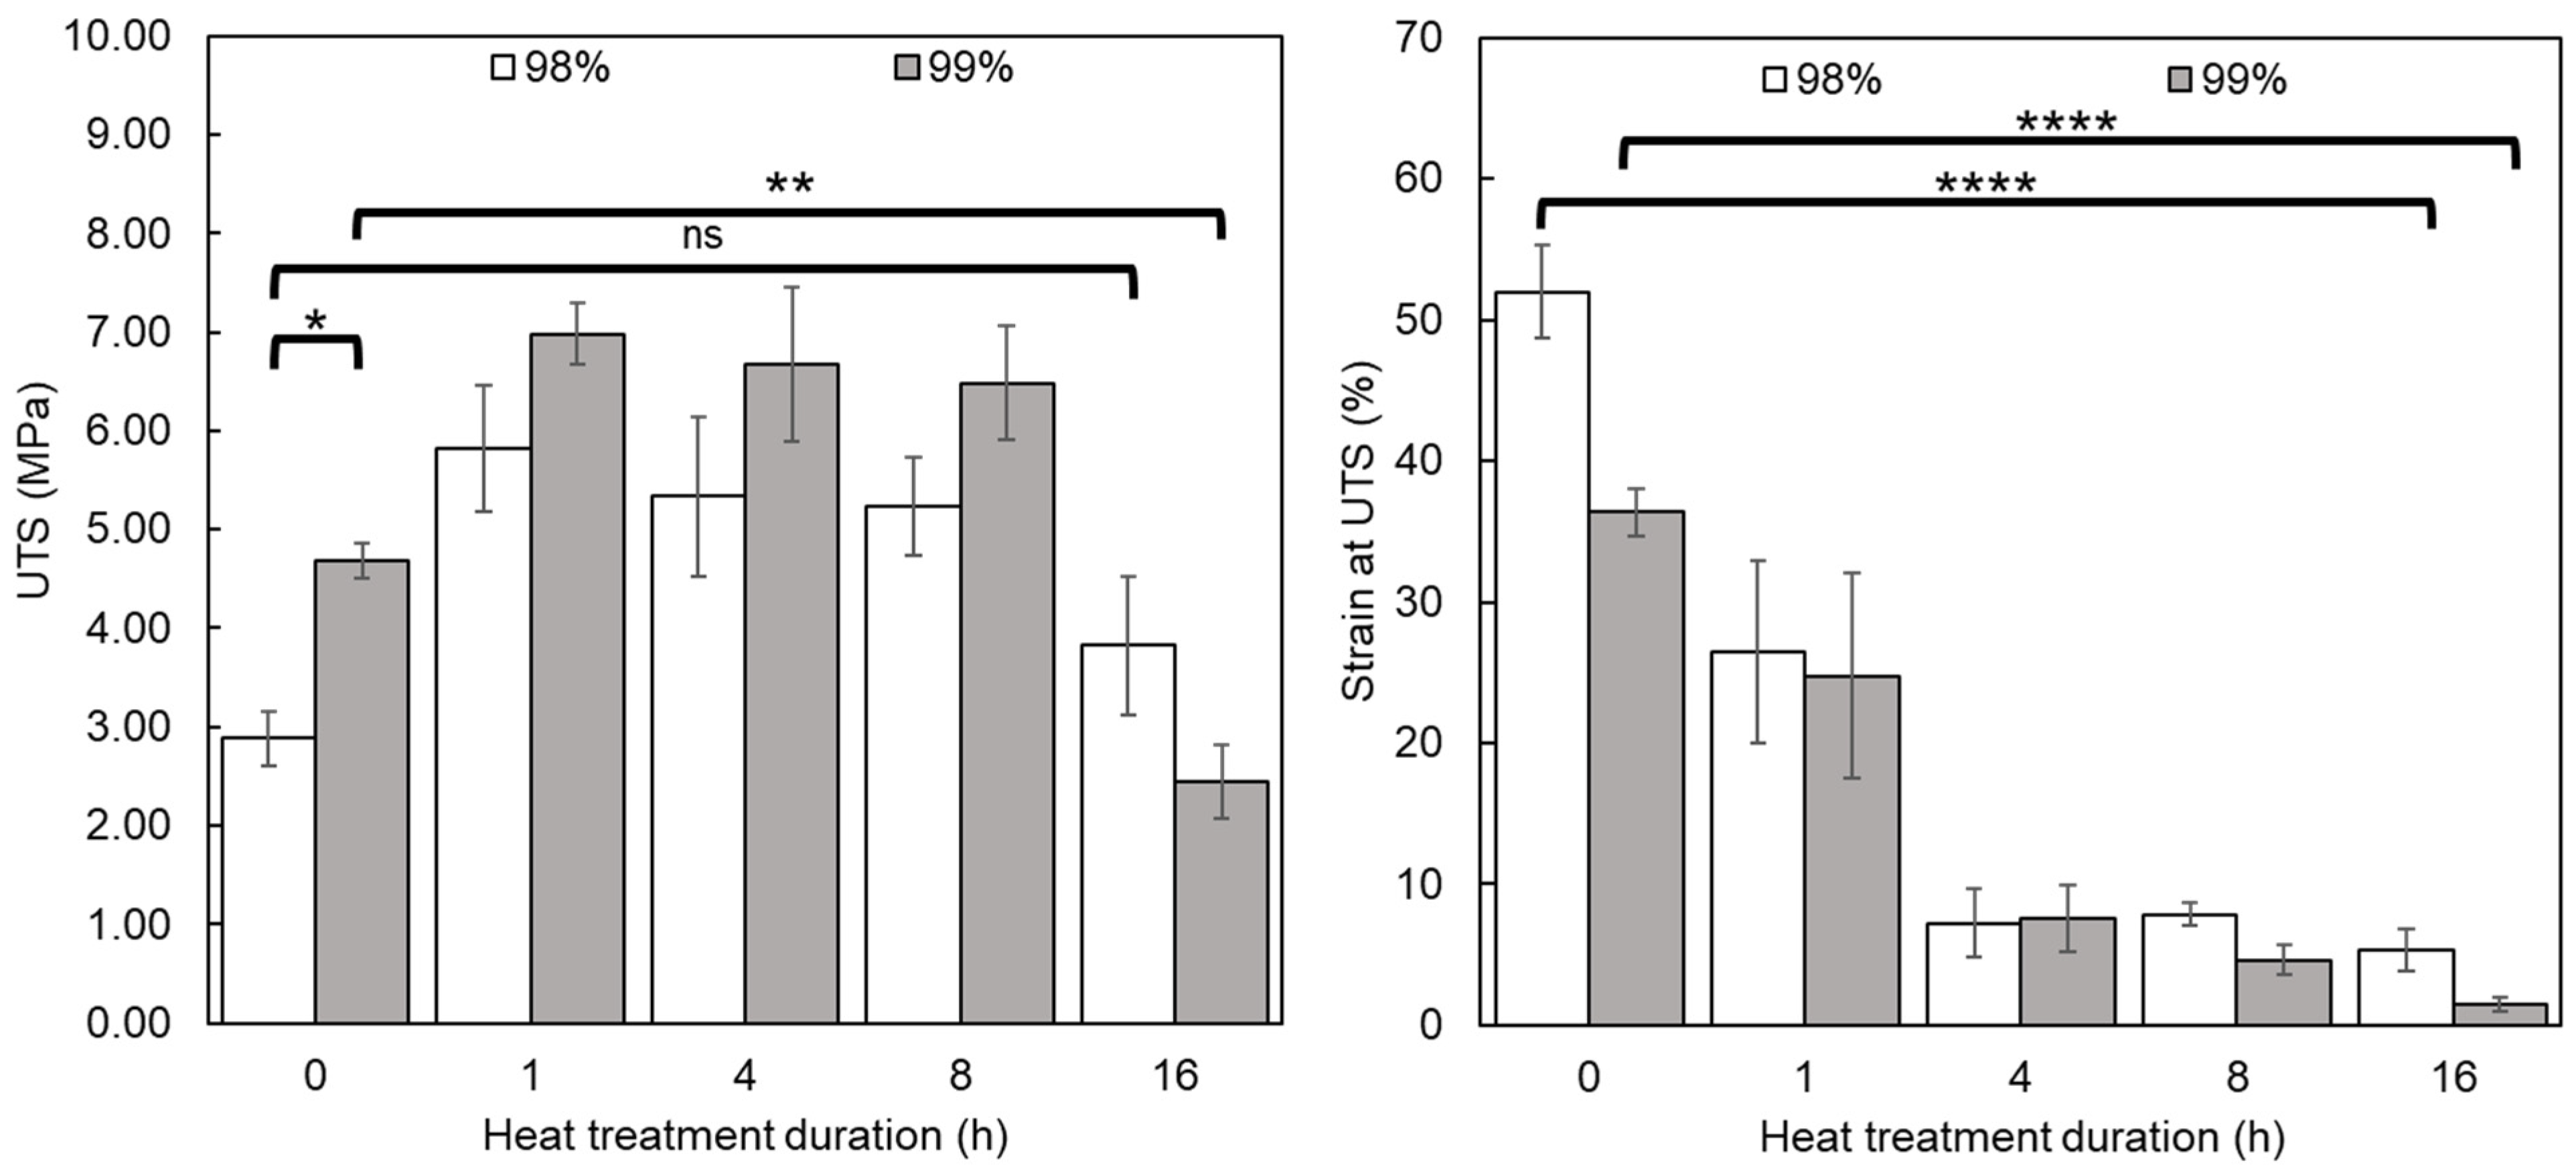
3.2.3. Tensile Testing
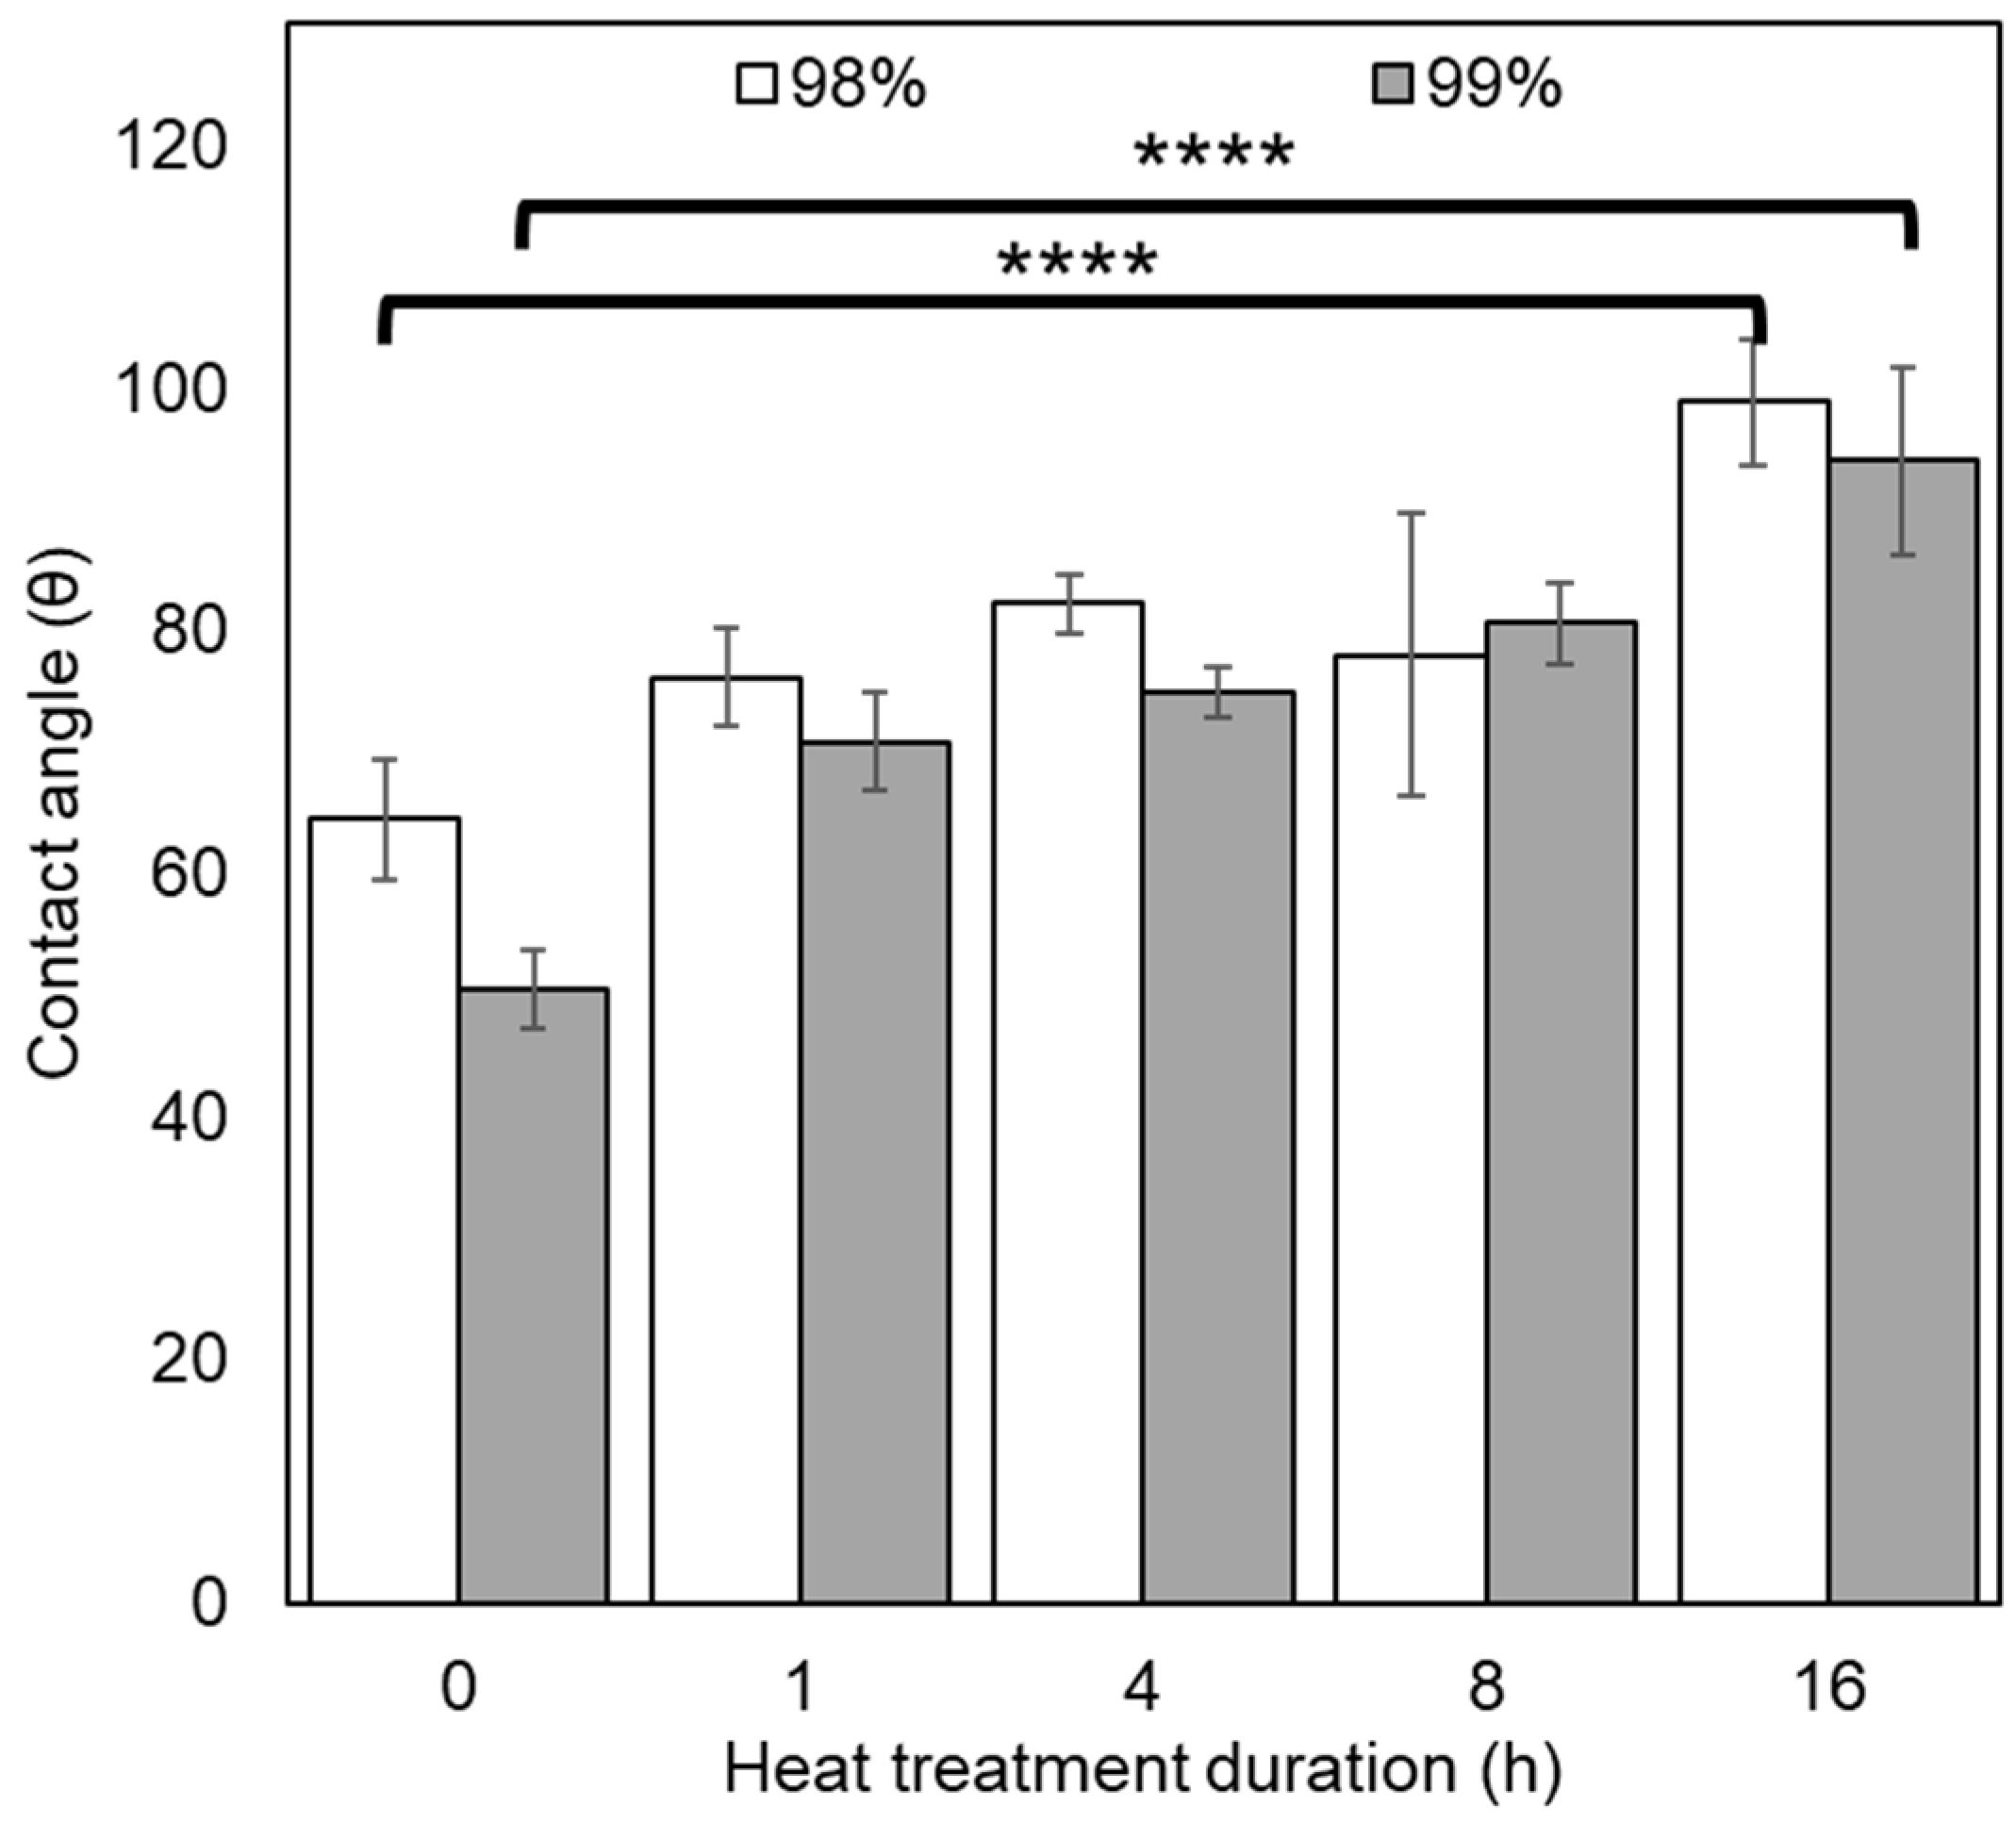
3.2.4. Contact Angle
3.3. Biological Assessment and Comparison of Nanofibers Produced from 98% and 99% Hydrolysed PVA
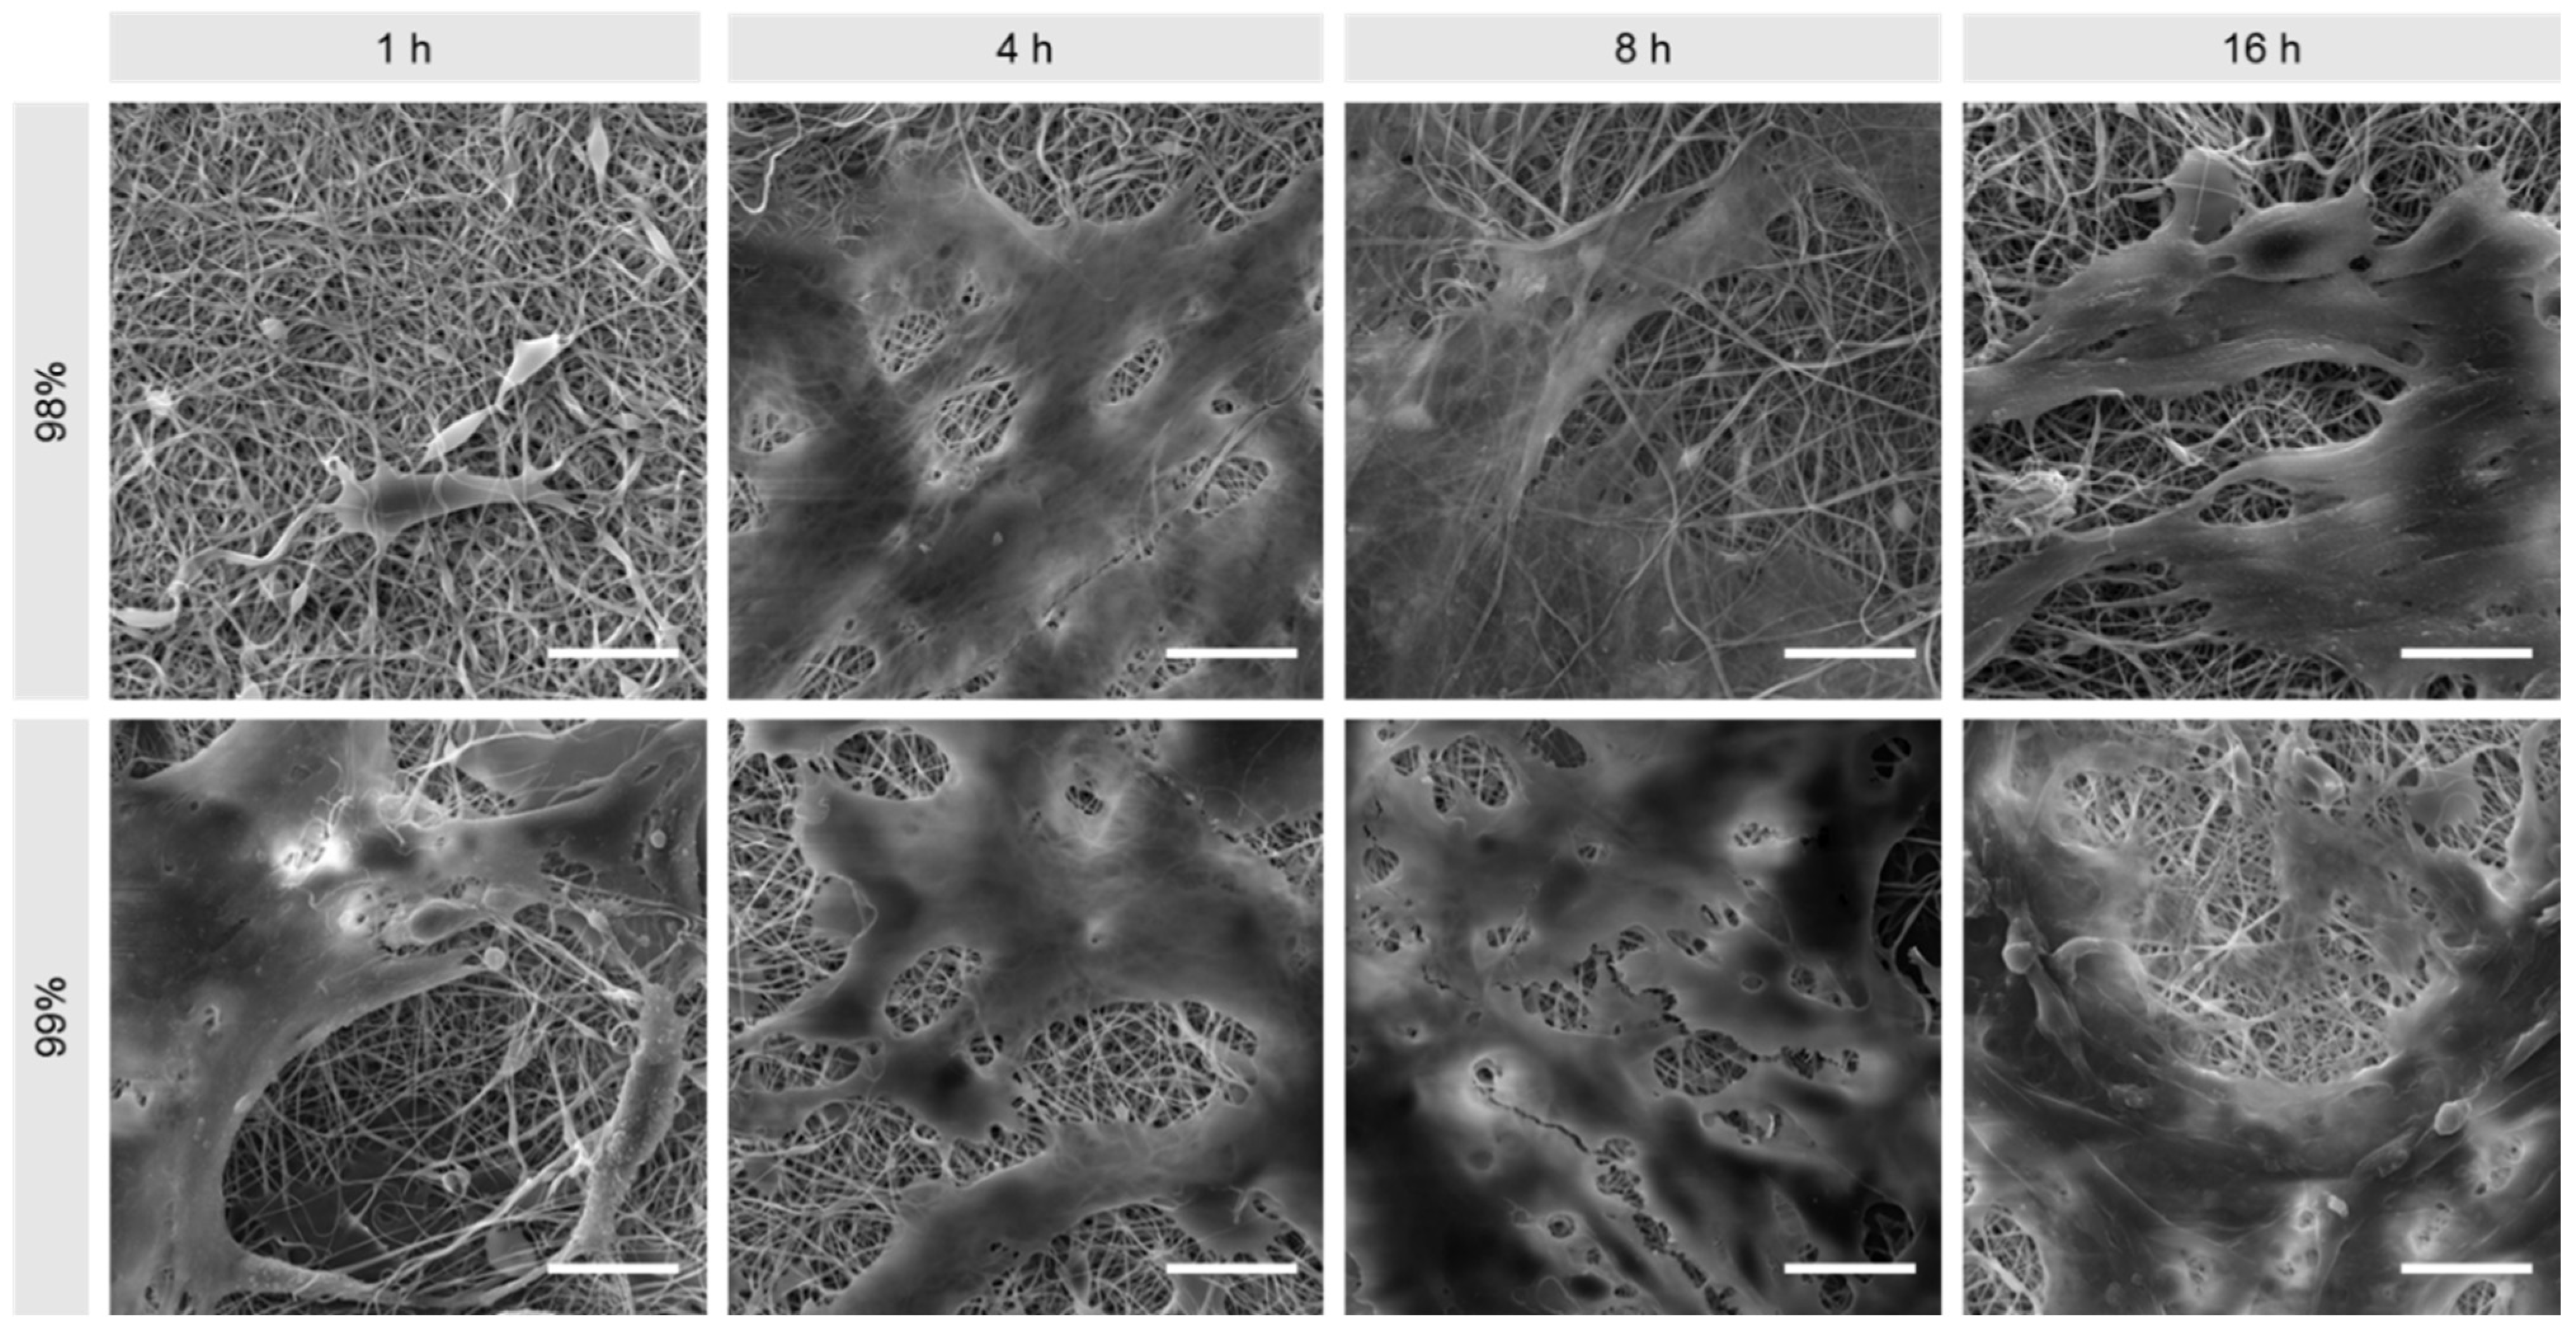
3.3.1. Biocompatibility
3.3.2. Thrombogenicity
3.3.3. Coagulation
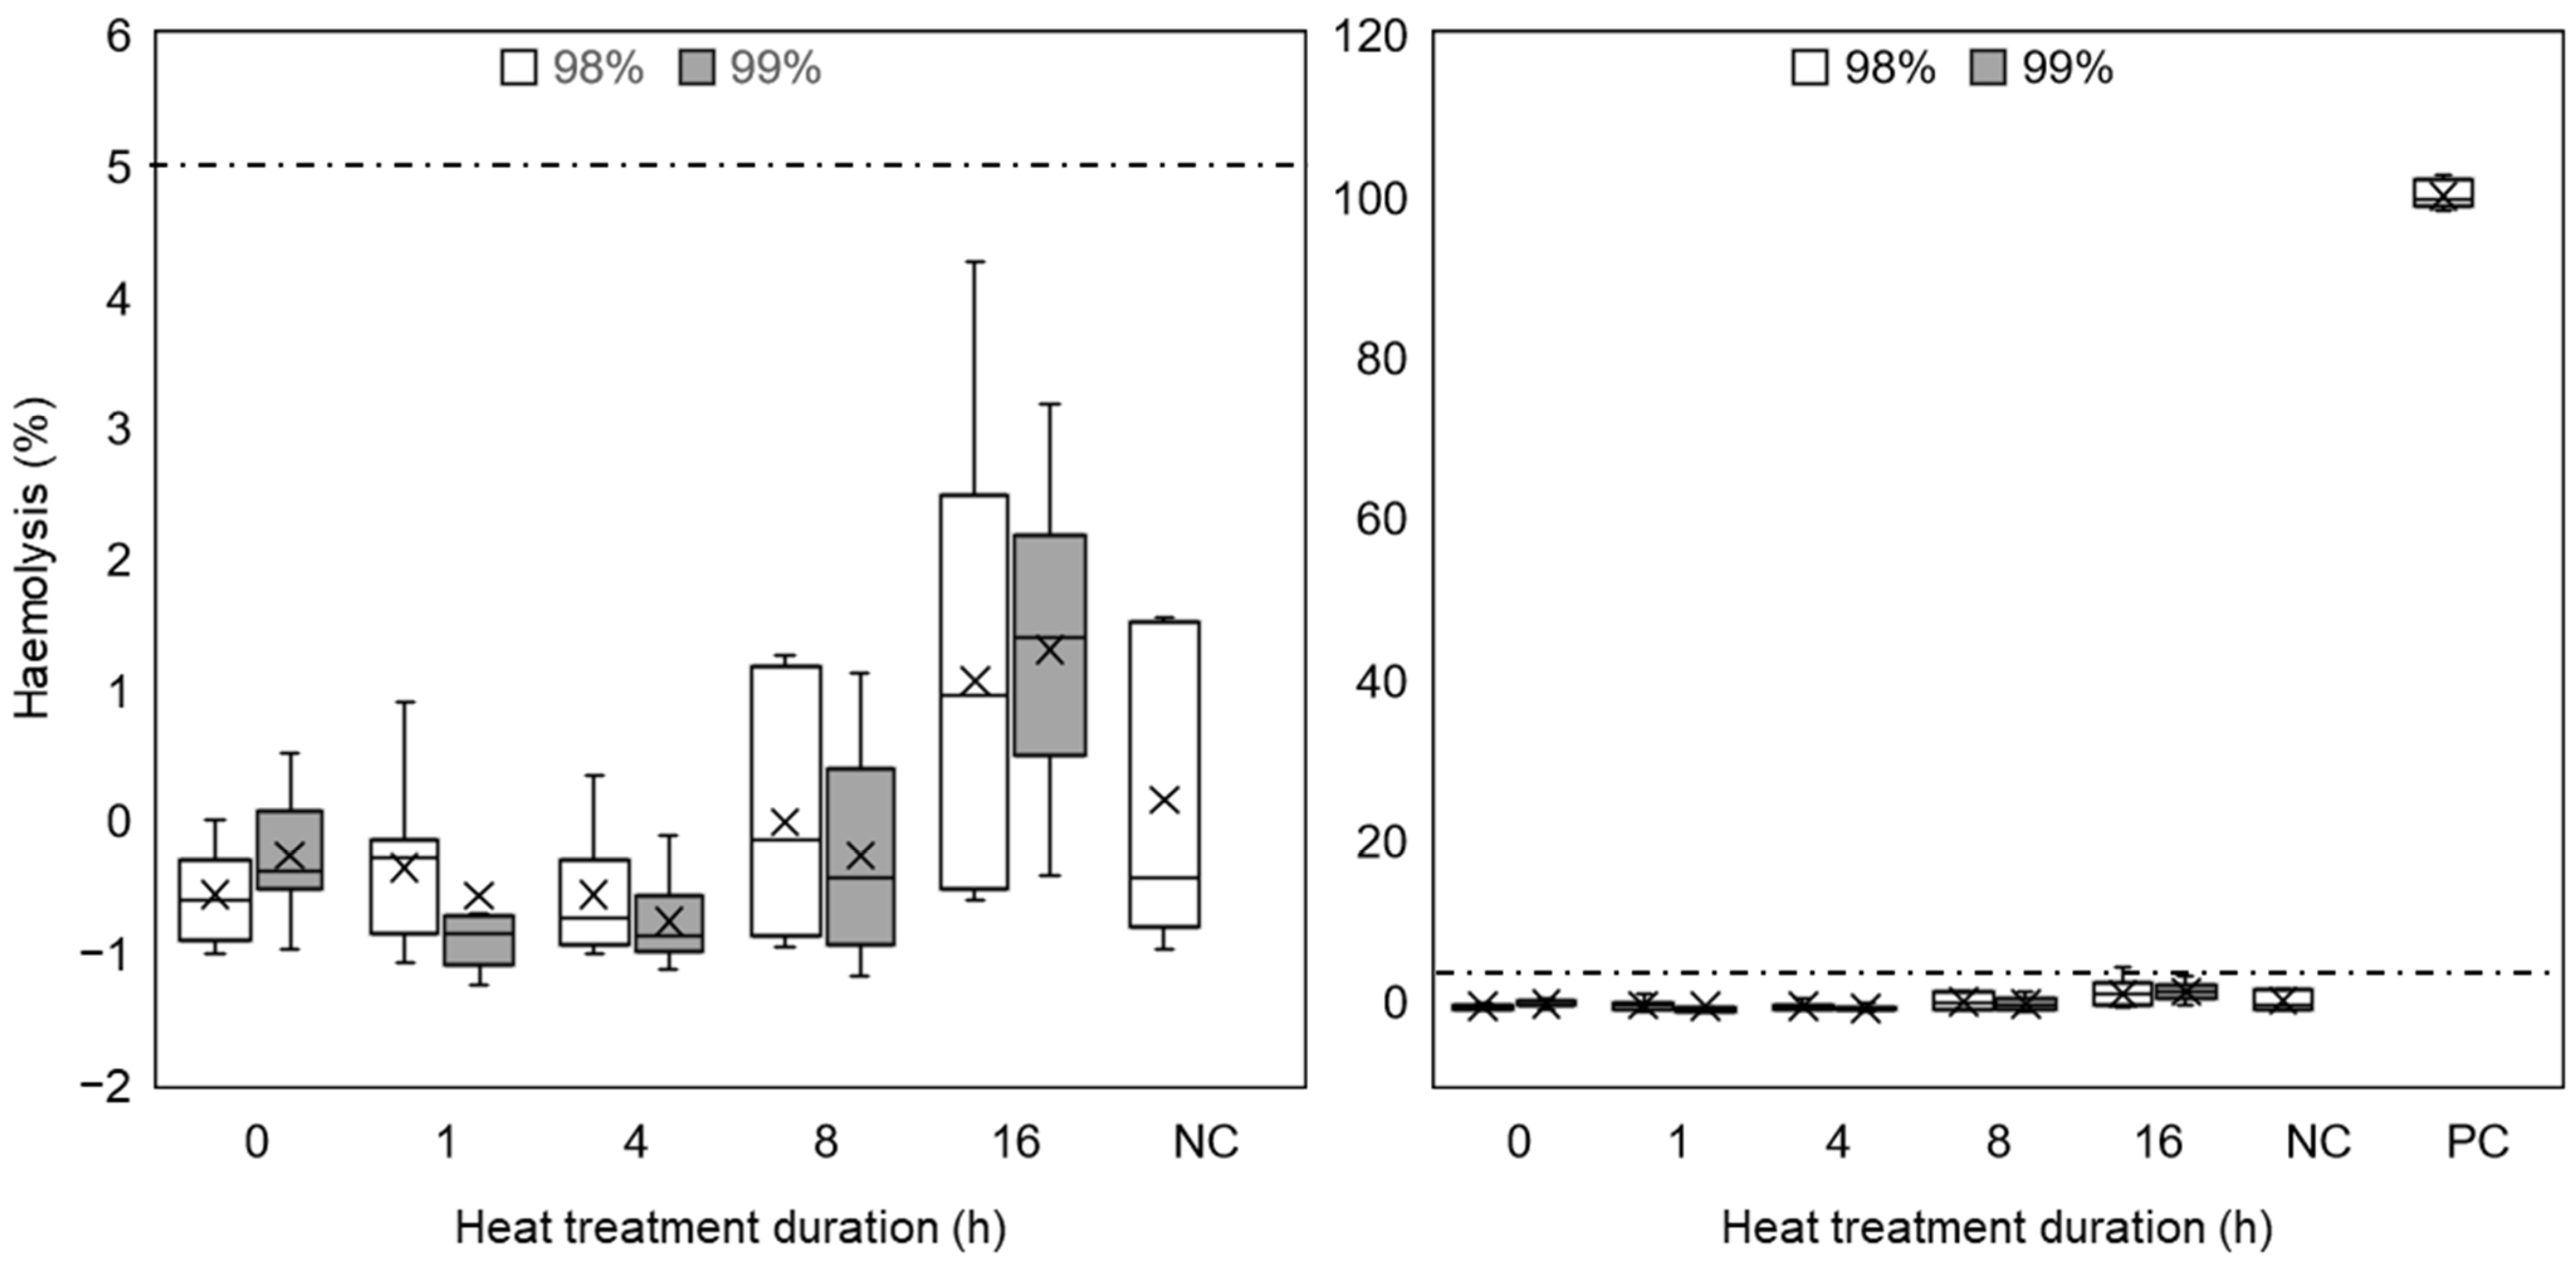
3.3.4. Haemolysis
4. Conclusions
Supplementary Materials
Author Contributions
Funding
Institutional Review Board Statement
Data Availability Statement
Conflicts of Interest
References
- Bakhshandeh, B.; Zarrintaj, P.; Oftadeh, M.O.; Keramati, F.; Fouladiha, H.; Sohrabi-jahromi, S.; Ziraksaz, Z. Tissue engineering; strategies, tissues, and biomaterials. Biotechnol. Genet. Eng. Rev. 2017, 33, 144–172. [Google Scholar] [CrossRef] [PubMed]
- Rahmati, M.; Mills, D.K.; Urbanska, A.M.; Saeb, M.R.; Venugopal, J.R.; Ramakrishna, S.; Mozafari, M. Electrospinning for tissue engineering applications. Prog. Mater. Sci. 2021, 117, 100721. [Google Scholar] [CrossRef]
- Pina, S.; Ribeiro, V.P.; Marques, C.F.; Maia, F.R.; Silva, T.H.; Reis, R.L.; Oliveira, J.M. Scaffolding Strategies for Tissue Engineering and Regenerative Medicine Applications. Materials 2019, 12, 1824. [Google Scholar] [CrossRef] [PubMed]
- Zhao, Y.; Zhang, Z.; Pan, Z.; Liu, Y. Advanced bioactive nanomaterials for biomedical applications. Exploration 2021, 1, 20210089. [Google Scholar] [CrossRef] [PubMed]
- Wan, X.; Zhao, Y.; Li, Z.; Li, L. Emerging polymeric electrospun fibers: From structural diversity to application in flexible bioelectronics and tissue engineering. Exploration 2022, 2, 20210029. [Google Scholar] [CrossRef] [PubMed]
- Zulkifli, M.Z.A.; Nordin, D.; Shaari, N.; Kamarudin, S.K. Overview of Electrospinning for Tissue Engineering Applications. Polymers 2023, 15, 2418. [Google Scholar] [CrossRef] [PubMed]
- Del Olmo, J.; Mikes, P.; Asatiani, N.; Alonso, J.; Martínez, V.; González, R. Alternating Current Electrospinning of Polycaprolactone/Chitosan Nanofibers for Wound Healing Applications. Polymers 2024, 16, 1333. [Google Scholar] [CrossRef] [PubMed]
- Tan, G.Z.; Zhou, Y.G. Electrospinning of biomimetic fibrous scaffolds for tissue engineering: A review. Int. J. Polym. Mater. Polym. Biomater. 2020, 69, 947–960. [Google Scholar] [CrossRef]
- Bigdeli, A.K.; Lyer, S.; Detsch, R.; Boccaccini, A.R.; Beier, J.P.; Kneser, U.; Horch, R.E.; Arkudas, A. Nanotechnologies in tissue engineering. Nanotechnol. Rev. 2013, 2, 411–425. [Google Scholar] [CrossRef]
- Aliko, K.; Aldakhlalla, M.; Leslie, L.; Worthington, T.; Topham, P.; Theodosiou, E. Poly(butylene succinate) fibrous dressings containing natural antimicrobial agents. J. Ind. Text. 2022, 51, 6948S–6967S. [Google Scholar] [CrossRef]
- Elmarco. NS 8S1600U: Scalable Industrial Production Line. Available online: https://www.elmarco.com/production-lines/ns-8s1600u (accessed on 4 April 2020).
- Bionicia. Fluidnatek HT. Available online: https://www.nanoscience.com/products/electrospinning-equipment/fluidnatek-ht/ (accessed on 16 March 2023).
- Li, L.F.; Hao, R.N.; Qin, J.J.; Song, J.; Chen, X.F.; Rao, F.; Zhai, J.L.; Zhao, Y.; Zhang, L.Q.; Xue, J.J. Electrospun Fibers Control Drug Delivery for Tissue Regeneration and Cancer Therapy. Adv. Fiber Mater. 2022, 4, 1375–1413. [Google Scholar] [CrossRef]
- Zhang, C.; Yang, X.; Yu, L.; Chen, X.; Zhang, J.; Zhang, S.; Wu, S. Electrospun polyasparthydrazide nanofibrous hydrogel loading with in-situ synthesized silver nanoparticles for full-thickness skin wound healing application. Mater. Des. 2024, 239, 112818. [Google Scholar] [CrossRef]
- Lannutti, J.; Reneker, D.; Ma, T.; Tomasko, D.; Farson, D.F. Electrospinning for tissue engineering scaffolds. Mater. Sci. Eng. C Biomim. Supramol. Syst. 2007, 27, 504–509. [Google Scholar] [CrossRef]
- Teixeira, M.A.; Amorim, M.T.P.; Felgueiras, H.P. Poly(Vinyl Alcohol)-Based Nanofibrous Electrospun Scaffolds for Tissue Engineering Applications. Polymers 2020, 12, 7. [Google Scholar] [CrossRef] [PubMed]
- Baker, M.I.; Walsh, S.P.; Schwartz, Z.; Boyan, B.D. A review of polyvinyl alcohol and its uses in cartilage and orthopedic applications. J. Biomed. Mater. Res. Part B Appl. Biomater. 2012, 100B, 1451–1457. [Google Scholar] [CrossRef] [PubMed]
- Chong, S.F.; Smith, A.A.A.; Zelikin, A.N. Microstructured, Functional PVA Hydrogels through Bioconjugation with Oligopeptides under Physiological Conditions. Small 2013, 9, 942–950. [Google Scholar] [CrossRef] [PubMed]
- Hassan, C.M.; Peppas, N.A. Structure and applications of poly(vinyl alcohol) hydrogels produced by conventional crosslinking or by freezing/thawing methods. Biopolym./Pva Hydrogels/Anionic Polym. Nanocompos. 2000, 153, 37–65. [Google Scholar]
- Diez, B.; Homer, W.J.A.; Leslie, L.J.; Kyriakou, G.; Rosal, R.; Topham, P.D.; Theodosiou, E. Chemically cross-linked poly(vinyl alcohol) electrospun fibrous mats as wound dressing materials. J. Chem. Technol. Biotechnol. 2022, 97, 620–632. [Google Scholar] [CrossRef]
- Vashisth, P.; Pruthi, V. Synthesis and characterization of crosslinked gellan/PVA nanofibers for tissue engineering application. Mater. Sci. Eng. C Mater. Biol. Appl. 2016, 67, 304–312. [Google Scholar] [CrossRef]
- Dabiri, G.; Damstetter, E.; Phillips, T. Choosing a Wound Dressing Based on Common Wound Characteristics. Adv. Wound Care 2016, 5, 32–41. [Google Scholar] [CrossRef]
- Iacob, A.T.; Dragan, M.; Ionescu, O.M.; Profire, L.; Ficai, A.; Andronescu, E.; Georgeta, L.; Lupascu, D. An Overview of Biopolymeric Electrospun Nanofibers Based on Polysaccharides for Wound Healing Management. Pharmaceutics 2020, 12, 983. [Google Scholar] [CrossRef] [PubMed]
- Kus, K.J.B.; Ruiz, E.S. Wound Dressings—A Practical Review. Curr. Dermatol. Rep. 2020, 9, 298–308. [Google Scholar] [CrossRef]
- Homer, W.J.A.; Lisnenko, M.; Gardner, A.C.; Kostakova, E.K.; Valtera, J.; Wall, I.B.; Jencova, V.; Topham, P.D.; Theodosiou, E. Assessment of thermally stabilized electrospun poly(vinyl alcohol) materials as cell permeable membranes for a novel blood salvage device. Biomater. Adv. 2023, 144, 213197. [Google Scholar] [CrossRef] [PubMed]
- Homer, W.J.A. Thermally Stabilised, Crosslinker-Free Poly (Vinyl Alcohol) Nanofibers Produced by Electrospinning: Applications in Cell Processing and Tissue Engineering; Aston University: Birmingham, UK, 2023. [Google Scholar]
- Koprivova, B.; Lisnenko, M.; Solarska-Sciuk, K.; Prochazkova, R.; Novotny, V.; Mullerova, J.; Mikes, P.; Jencova, V. Large-scale electrospinning of poly (vinylalcohol) nanofibers incorporated with platelet-derived growth factors. Express Polym. Lett. 2020, 14, 987–1000. [Google Scholar] [CrossRef]
- Horakova, J.; Mikes, P.; Saman, A.; Svarcova, T.; Jencova, V.; Suchy, T.; Heczkova, B.; Jakubkova, S.; Jirousova, J.; Prochazkova, R. Comprehensive assessment of electrospun scaffolds hemocompatibility. Mater. Sci. Eng. C-Mater. Biol. Appl. 2018, 82, 330–335. [Google Scholar] [CrossRef] [PubMed]
- Kim, B.S.; Mooney, D.J. Development of biocompatible synthetic extracellular matrices for tissue engineering. Trends Biotechnol. 1998, 16, 224–230. [Google Scholar] [CrossRef] [PubMed]
- Chen, S.X.; Li, R.Q.; Li, X.R.; Xie, J.W. Electrospinning: An enabling nanotechnology platform for drug delivery and regenerative medicine. Adv. Drug Deliv. Rev. 2018, 132, 188–213. [Google Scholar] [CrossRef] [PubMed]
- Muthukrishnan, L. An overview on electrospinning and its advancement toward hard and soft tissue engineering applications. Colloid Polym. Sci. 2022, 300, 875–901. [Google Scholar] [CrossRef]
- Park, J.-C.; Ito, T.; Kim, K.-O.; Kim, K.-W.; Kim, B.-S.; Khil, M.-S.; Kim, H.-Y.; Kim, I.-S. Electrospun poly(vinyl alcohol) nanofibers: Effects of degree of hydrolysis and enhanced water stability. Polym. J. 2010, 42, 273–276. [Google Scholar] [CrossRef]
- Tretinnikov, O.N.; Zagorskaya, S.A. Determination of the degree of crystallinity of poly(vinyl alcohol) by FT-IR spectroscopy. J. Appl. Spectrosc. 2012, 79, 521–526. [Google Scholar] [CrossRef]
- Alhosseini, S.N.; Moztarzadeh, F.; Mozafari, M.; Asgari, S.; Dodel, M.; Samadikuchaksaraei, A.; Kargozar, S.; Jalali, N. Synthesis and characterization of electrospun polyvinyl alcohol nanofibrous scaffolds modified by blending with chitosan for neural tissue engineering. Int. J. Nanomed. 2012, 7, 25–34. [Google Scholar] [CrossRef]
- Jipa, I.M.; Stroescu, M.; Stoica-Guzun, A.; Dobre, T.; Jinga, S.; Zaharescu, T. Effect of gamma irradiation on biopolymer composite films of poly(vinyl alcohol) and bacterial cellulose. Nucl. Instrum. Methods Phys. Res. Sect. B Beam Interact. Mater. At. 2012, 278, 82–87. [Google Scholar] [CrossRef]
- Meszlényi, G.; Körtvélyessy, G. Direct determination of vinyl acetate content of ethylene-vinyl acetate copolymers in thick films by infrared spectroscopy. Polym. Test. 1999, 18, 551–557. [Google Scholar] [CrossRef]
- Yang, H.G.; Xu, S.B.; Jiang, L.; Dan, Y. Thermal decomposition behavior of poly (vinyl alcohol) with different hydroxyl content. J. Macromol. Sci. Part B Phys. 2012, 51, 464–480. [Google Scholar] [CrossRef]
- Miraftab, M.; Saifullah, A.N.; Çay, A. Physical stabilisation of electrospun poly(vinyl alcohol) nanofibres: Comparative study on methanol and heat-based crosslinking. J. Mater. Sci. 2014, 50, 1943–1957. [Google Scholar] [CrossRef]
- Song, Y.; Zhang, S.; Kang, J.; Chen, J.; Cao, Y. Water absorption dependence of the formation of poly(vinyl alcohol)-iodine complexes for poly(vinyl alcohol) films. RSC Adv. 2021, 11, 28785–28796. [Google Scholar] [CrossRef] [PubMed]
- Restrepo, I.; Medina, C.; Meruane, V.; Akbari-Fakhrabadi, A.; Flores, P.; Rodriguez-Llamazares, S. The effect of molecular weight and hydrolysis degree of poly(vinyl alcohol)(PVA) on the thermal and mechanical properties of poly(lactic acid)/PVA blends. Polim. Cienc. E Tecnol. 2018, 28, 169–177. [Google Scholar] [CrossRef]
- Fong, R.J.; Robertson, A.; Mallon, P.E.; Thompson, R.L. The Impact of Plasticizer and Degree of Hydrolysis on Free Volume of Poly(vinyl alcohol) Films. Polymers 2018, 10, 1036. [Google Scholar] [CrossRef] [PubMed]
- Liebschner, M.; Bucklen, B.; Wettergreen, M. Mechanical Aspects of Tissue Engineering. Semin. Plast. Surg. 2005, 19, 217–228. [Google Scholar] [CrossRef]
- Sahithi, K.; Swetha, M.; Ramasamya, K.; Sriniyasan, N.; Selyamurugan, N. Polymeric composites containing carbon nanotubes for bone tissue engineering. Int. J. Biol. Macromol. 2010, 46, 281–283. [Google Scholar] [CrossRef]
- Zuidema, J.M.; Gilbert, R.J. An Argument for the Importance of Material Property Characterization of Hydrogels. In Proceedings of the IEEE 37th Annual Northeast Bioengineering Conference (NEBEC), Rensselaer Polytechn Inst (RPI), Troy, NY, USA, 1–3 April 2011. [Google Scholar]
- Zuo, B.; Hu, Y.Y.; Lu, X.L.; Zhang, S.X.; Fan, H.; Wang, X.P. Surface Properties of Poly(vinyl alcohol) Films Dominated by Spontaneous Adsorption of Ethanol and Governed by Hydrogen Bonding. J. Phys. Chem. C 2013, 117, 3396–3406. [Google Scholar] [CrossRef]
- Menzies, K.L.; Jones, L. The Impact of Contact Angle on the Biocompatibility of Biomaterials. Optom. Vis. Sci. 2010, 87, 387–399. [Google Scholar] [CrossRef] [PubMed]
- Al-Azzam, N.; Alazzam, A. Micropatterning of cells via adjusting surface wettability using plasma treatment and graphene oxide deposition. PLoS ONE 2022, 17, e0269914. [Google Scholar] [CrossRef] [PubMed]
- Moeendarbary, E.; Harris, A.R. Cell mechanics: Principles, practices, and prospects. Wiley Interdiscip. Rev. Syst. Biol. Med. 2014, 6, 371–388. [Google Scholar] [CrossRef]
- Miller, C.H.; Platt, S.J.; Rice, A.S.; Kelly, F.; Soucie, J.M.; Hemophilia Inhibitor Res Study, I. Validation of Nijmegen-Bethesda assay modifications to allow inhibitor measurement during replacement therapy and facilitate inhibitor surveillance. J. Thromb. Haemost. 2012, 10, 1055–1061. [Google Scholar] [CrossRef]
- ISO 10993-4:2017; Biological evaluation of medical devices—Part 4: Selection of tests for interactions with blood. International Organization for Standardization: Geneva, Switzerland, 2017.


| Heat Treatment Duration (h) | Crystallinity | |
|---|---|---|
| 98% DH PVA | 99% DH PVA | |
| 0 | 19.9 | 39.0 |
| 1 | 29.2 | 53.4 |
| 4 | 31.1 | 53.6 |
| 8 | 26.8 | 57.0 |
| 16 | 19.5 | 19.5 |
Disclaimer/Publisher’s Note: The statements, opinions and data contained in all publications are solely those of the individual author(s) and contributor(s) and not of MDPI and/or the editor(s). MDPI and/or the editor(s) disclaim responsibility for any injury to people or property resulting from any ideas, methods, instructions or products referred to in the content. |
© 2024 by the authors. Licensee MDPI, Basel, Switzerland. This article is an open access article distributed under the terms and conditions of the Creative Commons Attribution (CC BY) license (https://creativecommons.org/licenses/by/4.0/).
Share and Cite
Homer, W.J.A.; Lisnenko, M.; Hauzerova, S.; Heczkova, B.; Gardner, A.C.; Kostakova, E.K.; Topham, P.D.; Jencova, V.; Theodosiou, E. Thermally Stabilised Poly(vinyl alcohol) Nanofibrous Materials Produced by Scalable Electrospinning: Applications in Tissue Engineering. Polymers 2024, 16, 2079. https://doi.org/10.3390/polym16142079
Homer WJA, Lisnenko M, Hauzerova S, Heczkova B, Gardner AC, Kostakova EK, Topham PD, Jencova V, Theodosiou E. Thermally Stabilised Poly(vinyl alcohol) Nanofibrous Materials Produced by Scalable Electrospinning: Applications in Tissue Engineering. Polymers. 2024; 16(14):2079. https://doi.org/10.3390/polym16142079
Chicago/Turabian StyleHomer, W. Joseph A., Maxim Lisnenko, Sarka Hauzerova, Bohdana Heczkova, Adrian C. Gardner, Eva K. Kostakova, Paul D. Topham, Vera Jencova, and Eirini Theodosiou. 2024. "Thermally Stabilised Poly(vinyl alcohol) Nanofibrous Materials Produced by Scalable Electrospinning: Applications in Tissue Engineering" Polymers 16, no. 14: 2079. https://doi.org/10.3390/polym16142079