Article

An Investigation of the Energy-Absorption Characteristics of Thin-Walled Polymer Composite C-Channels: Experiment and Stacked Shell Simulation

1
College of Safety Science and Engineering, Civil Aviation University of China, Tianjin 300300, China
2
Engineering Techniques Training Center, Civil Aviation University of China, Tianjin 300300, China
3
Science and Technology Innovation Research Institute, Civil Aviation University of China, Tianjin 300300, China
4
Sino-European Institute of Aviation Engineering, Civil Aviation University of China, Tianjin 300300, China
*
Author to whom correspondence should be addressed.
Polymers 2024, 16(15), 2099; https://doi.org/10.3390/polym16152099
Submission received: 24 April 2024 / Revised: 15 July 2024 / Accepted: 17 July 2024 / Published: 23 July 2024
(This article belongs to the Special Issue Damage and Failure Analysis of Polymer-Based Composites)

Abstract

:
Polymer composite materials are increasingly used in civil aircraft structures. The failure mode and energy-absorption characteristics of polymer composite structures have garnered significant attention from academia and industry. For thin-walled polymer composite C-channels with layups of [0/90]3s, [45/-45]3s, and [45/90/-45/0]3, low-speed axial compression tests were performed to investigate the failure modes, failure mechanisms, and energy-absorbing characteristics. After parametric studies using [0] and [90] single-element models, stacked shell models of thin-walled composite C-channels were established using the Lavadèze single-layer damage constitutive model, Puck 2000, and Yamada Sun failure criteria. The results show that these thin-walled composite C-channels exhibit a stable progressive crushing process with a local buckling failure mode, encompassing local buckling, fiber break-age, matrix cracks, delamination, and corner cracking. The stacked shell model demonstrates reasonable agreement with the progressive crushing process of thin-walled composites, accurately capturing interlayer matrix failure and interface delamination cracking behavior. A comparison of the specific energy absorption (SEA) and mean crushing force (Fmean) between the simulation and test results yields a difference of less than 6%, indicating a strong correlation between the simulation results and the experimental energy-absorbing characteristics. It also shows that a deep understanding of the parameters is helpful for accurate numerical modeling.

1. Introduction

Due to the advantages of low density, high specific strength, high specific modulus, and great potential for the integrated design of structural materials, polymer composite structures are increasingly used in the automobile and aerospace industries [1,2,3,4]. In recent years, polymer composite structures have played a major role in the primary load-bearing structures and energy-absorbing structures of large aircraft. For composite fuselage structures, an equivalent level of crashworthiness must be provided compared to similar traditional metal fuselage structures under emergency landing conditions [5,6], which mainly ensures that the acceleration and loads experienced by occupants during impact events are consistent with those specified in FAR/CCAR 25.562 (b) and provide sufficient living space for occupants.
The most effective and economical means to meet the crashworthiness requirements is to arrange thin-walled polymer composite structures in the fuselage section to absorb large amounts of impact kinetic energy in a controlled manner [7,8,9]. Taking the Boeing 787 [10], a series of thin-walled polymer composite C-channels were installed under the cargo subfloor, affecting the failure modes and crashworthiness of the fuselage section. Therefore, much research has been carried out by the Boeing Company, the Federal Aviation Administration, and others to verify and improve crashworthiness, achieving great success [11,12]. In recent decades, various thin-walled polymer composite structures with different shapes have been put forward and their axial collapse behaviors studied, including circular tubes [13,14,15], square tubes [16,17], corrugated plates [18,19,20], conical shells [21], composite-reinforced aluminum tubes [22,23], and filled structures [24,25]. Factors such as the trigger [25,26,27], geometric features [28,29,30], mechanical properties of the fiber and matrix [31,32], and layup [33] have also been studied.
With the development of finite-element codes, such as PAM-CRASH [34], LS-DYNA [35], and ABAQUS [36], the combination method, i.e., many finite-element simulations with a small number of experiments, has become an effective way to study the energy-absorbing characteristics of composite structures and to design composite energy-absorbing structures [37,38,39]. Researchers have carried out extensive numerical simulation work, and various failure criteria are employed to predict material failure under different loading conditions. The most commonly used failure criteria include the maximum stress criterion [40,41], maximum strain criterion [42], Tsai–Hill criterion [43], Hashin criterion [44], Puck’s failure criterion [45], LaRC criterion [46], and Yamada–Sun criterion [47]. In addition, the finite-element modeling of composite thin-wall tubes has been researched using single-layer shell models and multi-layer shell models. Palanivelu et al. [48] developed single-layer and two-layer shell models of glass fiber composite thin-wall cylindrical and square tubes, respectively. In the two-layer model, solid adhesive units were established between the two shell elements, and predefined cracks were set in the shell elements to simulate crack propagation. The results show that the single-layer shell model could not capture delamination failure accurately, leading to inaccurate results, whereas the multi-layer shell model could simulate the failure morphology and energy-absorbing characteristics consistent with the test results. Siromani et al. [49] developed the multi-layer shell modeling method to numerically simulate the crushing process of composite cylindrical tubes using the LS-DYNA MAT 54 material model, achieving relatively accurate simulation of the chamfered end and boundary conditions. The average compressive load and SEA obtained by the simulation were relatively in accordance with the test results, though the initial peak load was 8–20% higher. Johnson et al. [50] numerically simulated the quasi-static crush test of [0/90]8 thin-walled structures using the stacked shell model. A rigid element was built at the top of the model, and offset nodes were situated in the upper part of the two shell elements that were located in the middle. In this way, the interlayer separation during the initial compression phase can be simulated. The simulated average compressive load was similar to the experimental results, which verified the effectiveness of the modeling method.
In addition, Feraboli et al. [51,52] explored the LS-DYNA MAT 54 material model and the Chang–Chang failure criteria [53,54], developed by Chang and Chang, which distinguish between tension and compression failures in the fiber and matrix of composite materials. The criteria include fiber tensile failure, fiber compressive failure, matrix tensile failure, matrix compressive failure, and shear failure. The key parameters of the constitutive relations, damage evolution, and failure criteria were identified, and their sensitivity was analyzed. The results exhibit that some model parameters, which are either non-physical or cannot be measured experimentally, enormously influence the simulation. It is expected to lack predictive capability before parameter calibration. However, the study was confined to LS-dyna MAT54, and similar research on other material models is still rarely seen.
In the present work, three groups of thin-walled polymer composite C-channels with different layups, i.e., [0/90]3s, [45/-45]3s, and [45/90/-45/0]3, were analyzed for failure modes, failure mechanisms, and energy-absorbing characteristics by conducting low-speed axial compression tests. The [0] and [90] single-element Lavadèze models were developed to conduct parametric analysis, investigate the sensitivity of various input parameters, and determine the most appropriate parameters based on the stress–strain relationship. Subsequently, the stacked shell models of thin-walled polymer composite C-channels were established using the Lavadèze single-layer damage constitutive model. Owing to the advantages in matrix failure and transverse tensile and shear stress interaction evaluation, the Puck 2000 failure criteria and Yamada–Sun failure criteria have been chosen. These models are further verified based on test results and energy-absorbing characteristics. These findings enhanced the understanding of the behavior of composite materials under axial compression and provided a strategy for calibrating finite-element models.

2. Specimens and Experimental

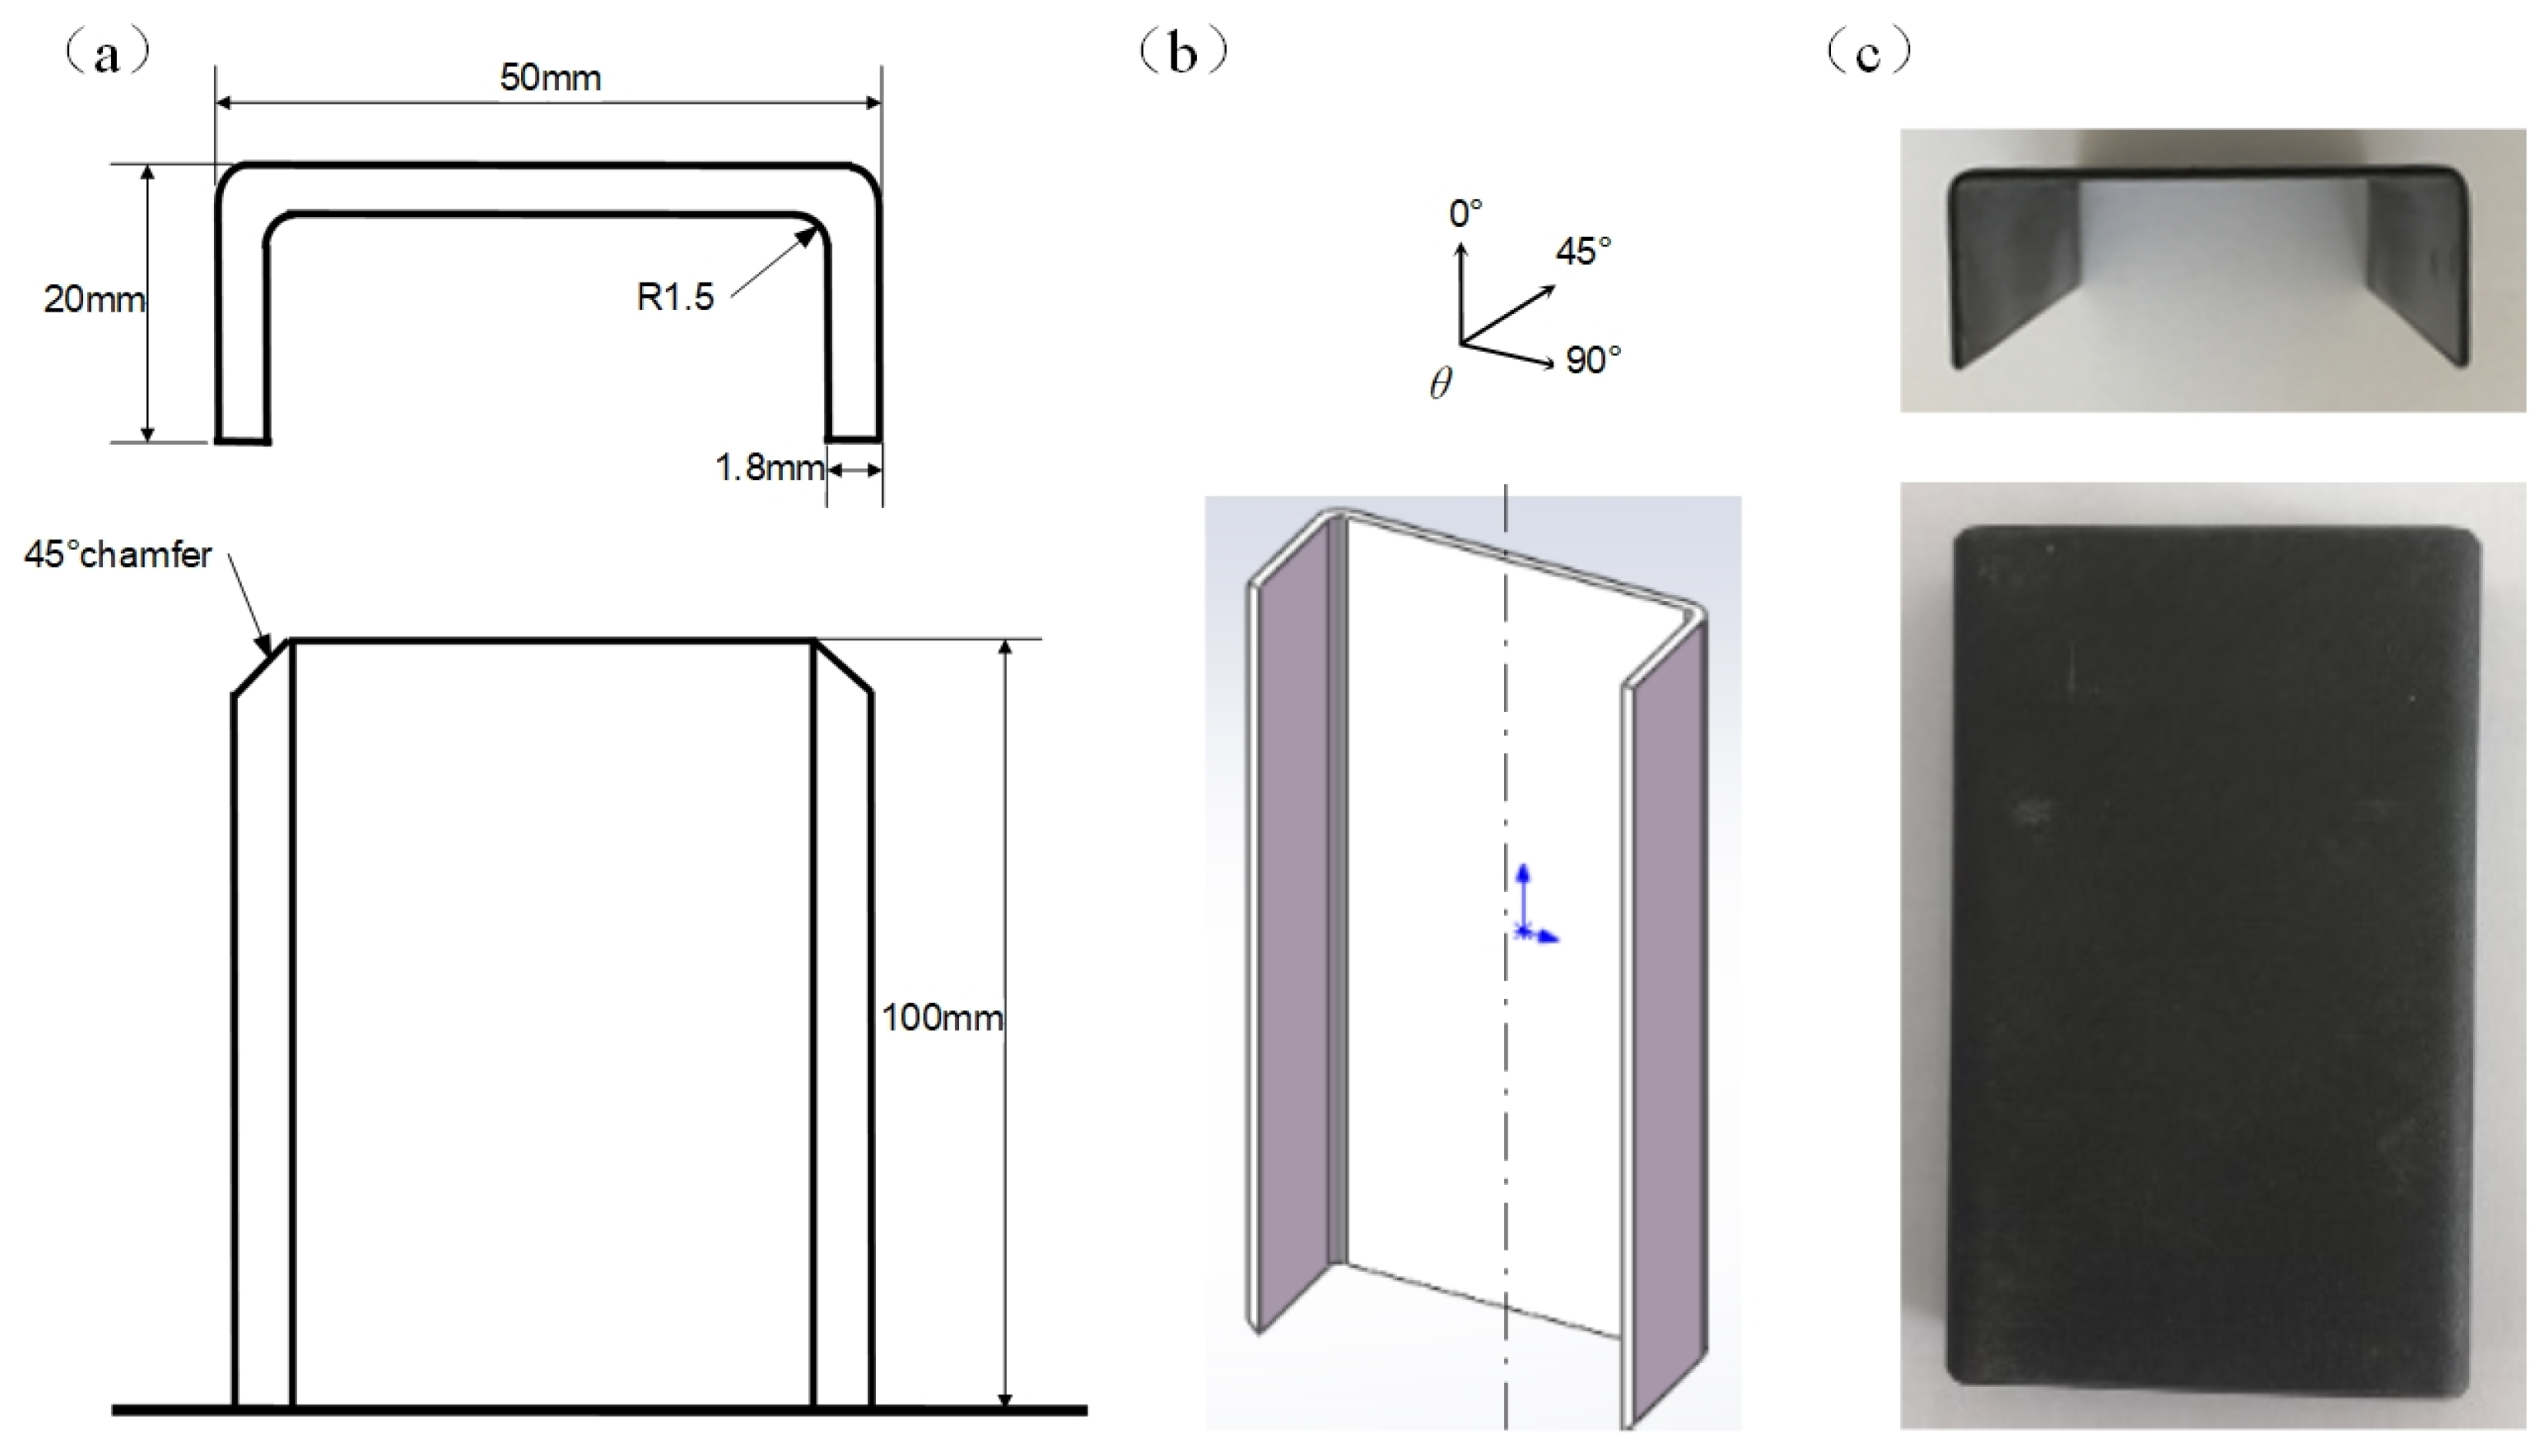
2.1. Specimens Design and Manufacture

In the sub-cargo of aircraft, thin-walled polymer composite C-channels were designed to support the cargo floor crossbeam. During a crash event, they can transfer and absorb the impact load. Thin-walled polymer composite C-channels were fabricated using the T700/MTM28 carbon fiber reinforced epoxy composite provided by AVIC Manufacturing Technology Institute (Beijing, China) through a hot-pressing process. The fiber volume content was approximately 60% according to the standard method in DIN EN ISO 7822 [55]. T700 carbon fibers provide a high specific strength and modulus, making them ideal for aerospace applications where weight reduction and mechanical performance are critical; furthermore, extensive research has validated the effectiveness of T700/MTM28 composites in energy absorption and crashworthiness [18,19,51], making them a well-understood and reliable choice for further study. The geometric configuration of the C-channels is as shown in Figure 1. The total height of the C-channels is 100 mm, with a width of 50 mm. The left and right flanges measure 20 mm in width. The transition arc between flat segment and flange has an inner radius of 1.5 mm, while the outer radius is equivalent to 1.5 mm plus the thickness of the C-channel. A 45° outer chamfer was milled at one end of the C-channel, as shown in Figure 1a. θ is the fiber angle, as shown in Figure 1b. The fiber direction is consistent with the axial direction of the C-channel, if θ = 0°. The thin-walled polymer composite C-channel specimens, as shown in Figure 1c, were designed with a thickness of 1.8 mm, corresponding to 12 layers, i.e., [0/90]3s, [45/-45]3s, and [45/90/-45/0]3. Each type of C-channel was tested at least 3 times to ensure the consistency and reliability of the results.

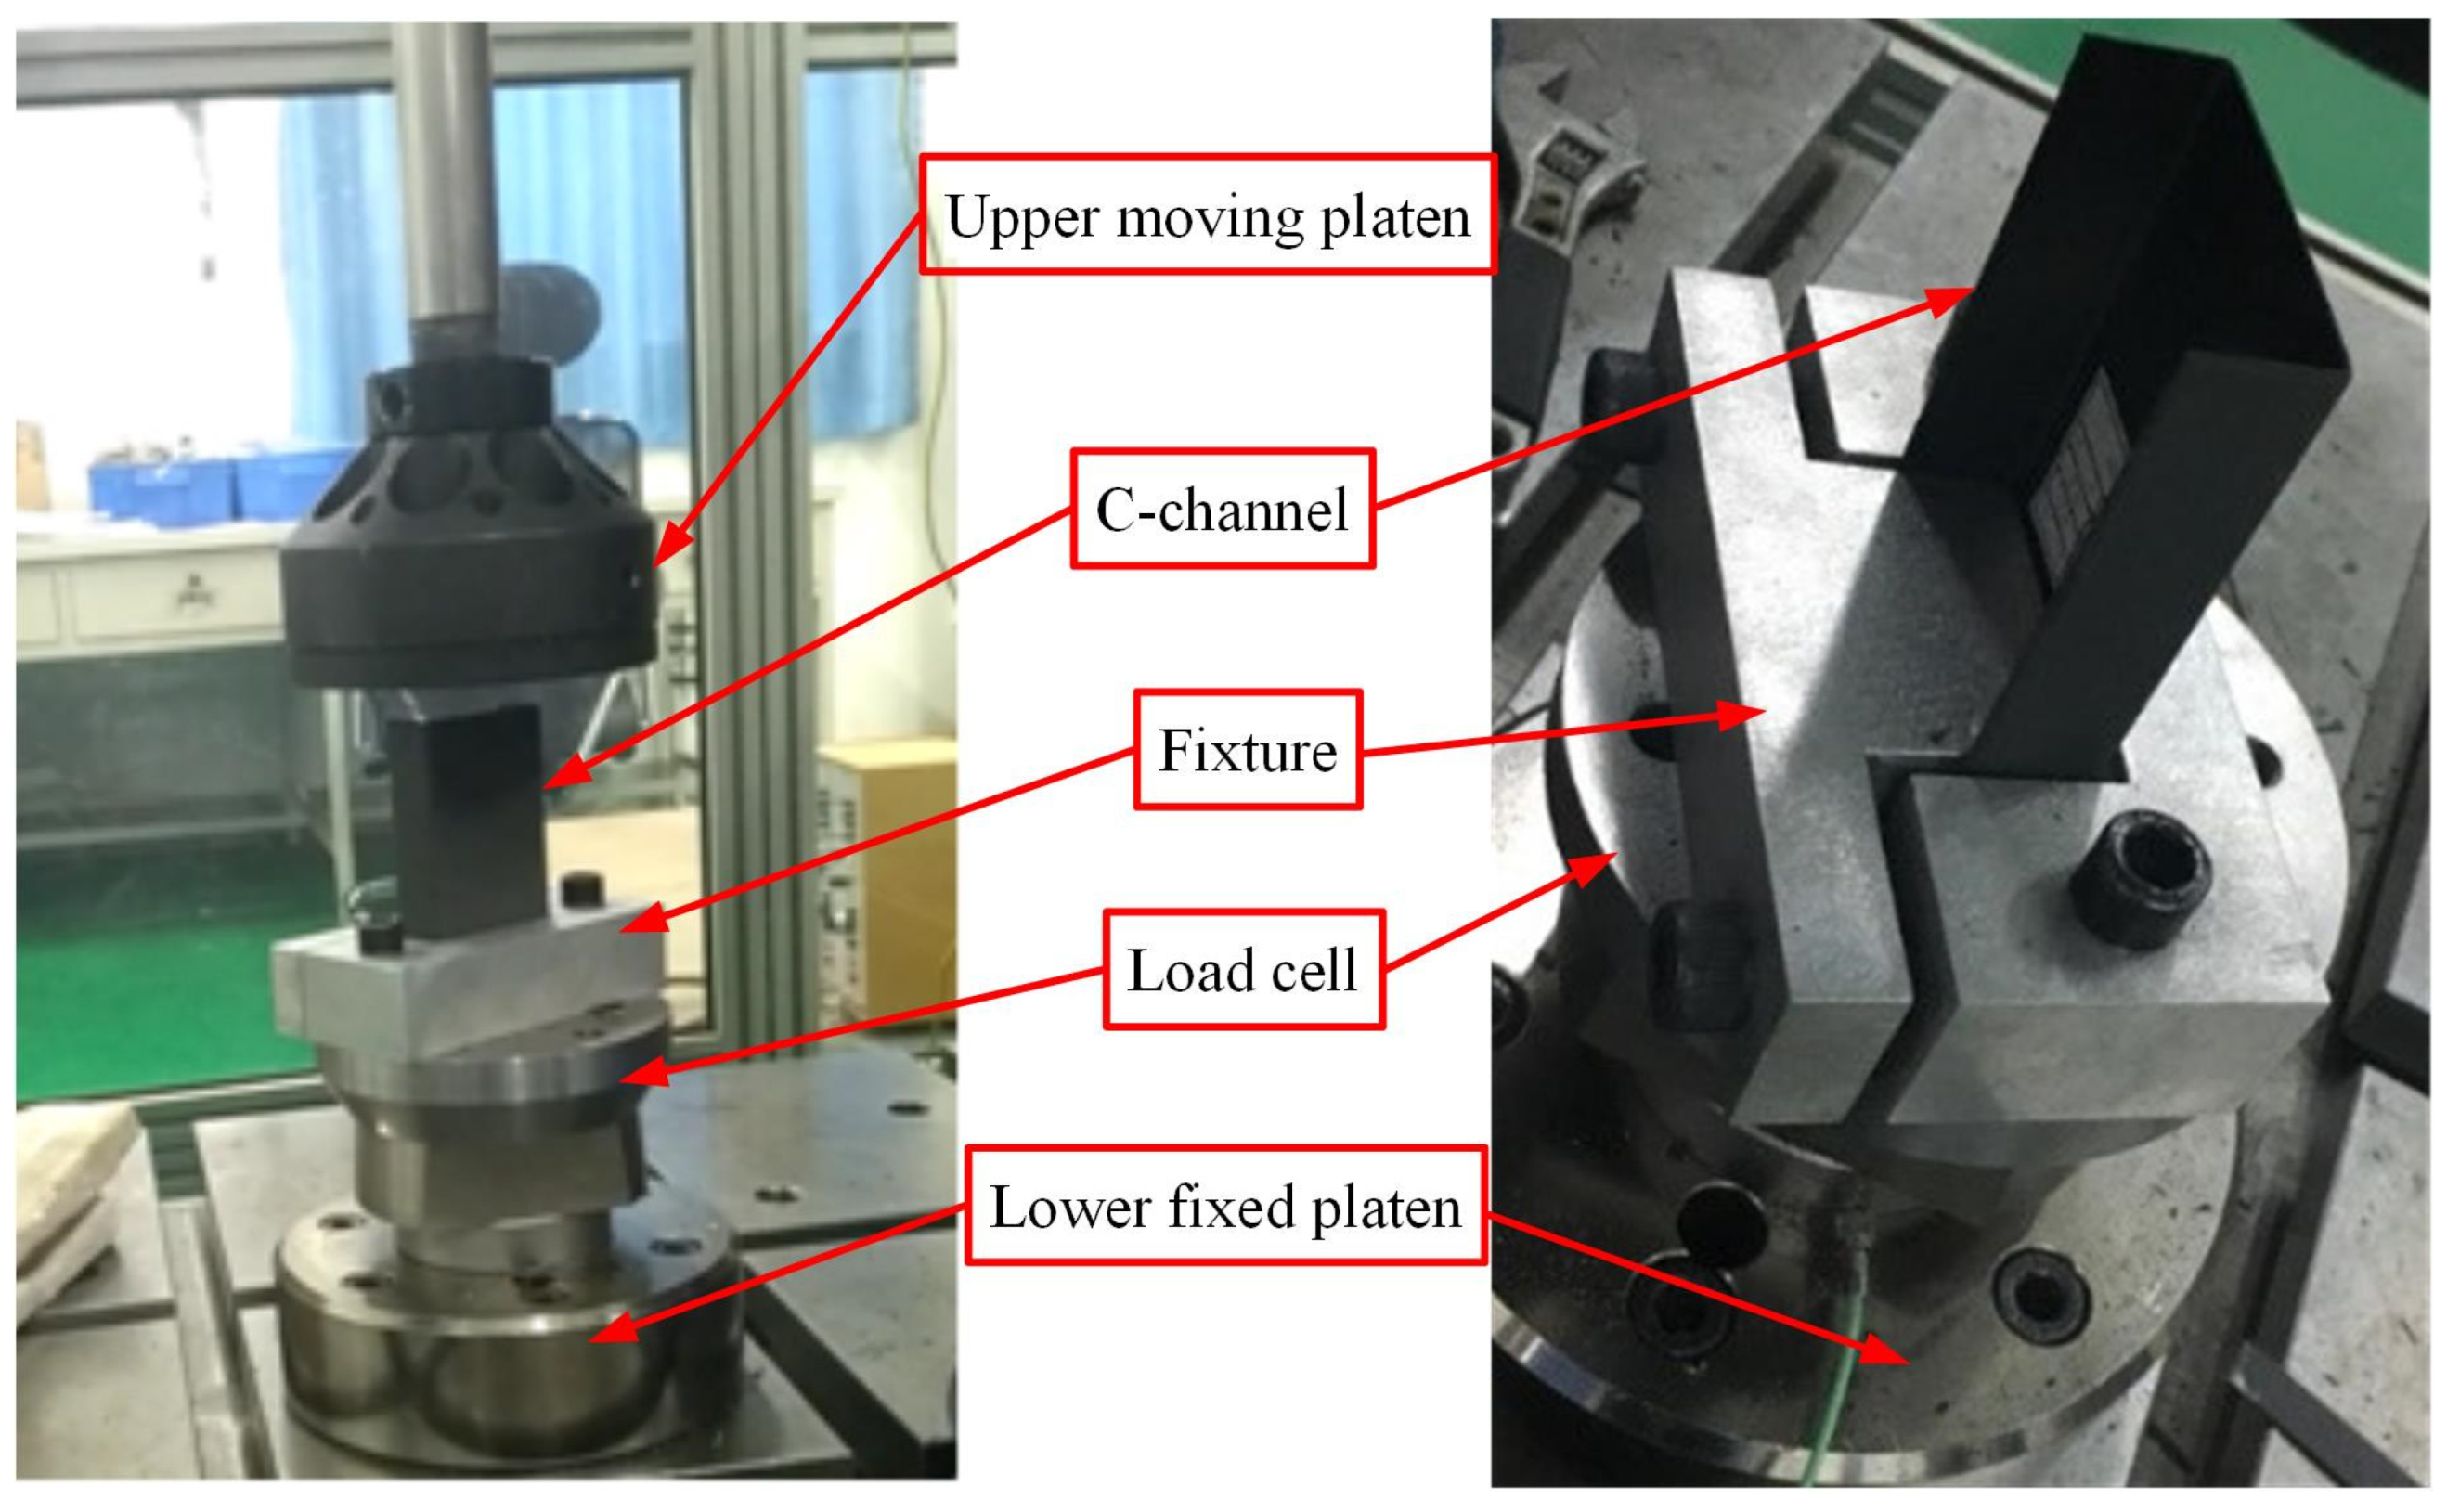
2.2. Experimental Procedures

Low-speed axial compression tests of thin-walled composite C-channels were conducted at room temperature using the INSTRON VHS 160/100-20 (Norwood, MA, USA). The 45° chamfer of the thin-walled composite C-channel was set at the top and free, while the other end was fixed using a clamp mounted on the plate by two bolts. A load cell was installed between the plate and the lower fixed platen to capture the load–time history curve, as shown in Figure 2. The upper moving platen moved downward at a constant velocity of 50 mm/s. The entire process of the low-speed axial compression tests was recorded using PHOTRAN high-speed video (Tokyo, Japan) at 2000 frames per second. Following the experiments, the C-channels were scanned using the ZEISS METROTOM (Deutschland, GmbH, Düsseldorf, Germany) industrial computed tomography (CT) scanning machine.

2.3. Energy-Absorbing Metrics

(1) Energy absorption (EA, unit: kJ): The total energy absorbed by the integration of the crushing force over the entire crushing distance.
E A = F d l
where F is the crushing force.
(2) Specific energy absorption (SEA, unit: kJ/kg): The energy absorbed per unit of mass of the structure. The SEA is an important parameter to measure the energy-absorbing capabilities. The ratio of the total energy to the mass is the SEA, which can be calculated as follows:
S E A = E A ρ A L
where ρ is the density, A is the effective cross-sectional area, and L is the total crushing distance.
(3) Peak crushing force (Fmax, unit: kN): The threshold value of structural damage, which is used to evaluate the structural failure under an external force. This parameter is the peak crushing force of the load–displacement curve.
(4) Mean crushing force (Fmean, unit: kN): The mean crushing force during the entire crushing process, which can be calculated as follows:
F m e a n = E A L

3. Numerical Study

3.1. Constitutive Model

The Lavadèze orthotropic single-layer composite model was used, which judges the matrix damage by using the Puck inter fiber failure (IFF) criteria combined with the Yamada–Sun fiber failure criteria. The failure criteria of the combination of the fiber and matrix can take the failure of the fiber under tensile and compressive loads, the formation of matrix microcracks under a transverse tensile load, and the debonding of the fiber and the matrix under the shear load into consideration. The constitutive relation of the Lavadèze single-layer composite model is shown in Equation (4):
ε 11 e ε 22 e 2 ε 12 e 2 ε 23 e 2 ε 13 e = 1 E 1 ν 12 0 E 1 0 0 0 ν 12 0 E 1 1 E 2 0 0 0 0 0 1 G 12 0 0 0 0 0 1 G 23 0 0 0 0 0 0 1 G 13 σ 11 σ 22 σ 12 σ 23 σ 13
where Direction 1 of the natural coordinates is the fiber direction; Direction 2 is the vertical fiber direction; Direction 3 is the normal direction of the unidirectional composite layer; ε11 is the strain in the direction of the fiber; ε22 is the strain in the vertical direction of the fiber; ε12, ε23, and ε13 are the shear strains in the corresponding directions; σ11 is the stress in the direction of the fiber; σ22 is the stress in the vertical direction of the fiber; σ12, σ23, and σ13 are the shear stresses in the corresponding directions; E1 and E2 are the elastic moduli in the direction of the fiber and the vertical fiber direction; G12 is the shear modulus of the plane 1, 2; G23 is the shear modulus of the plane 2, 3; G13 is the shear modulus of the plane 1, 3; and ν12 is the Poisson’s ratio.

3.2. Failure Criteria

The Puck’s IFF criterion in natural coordinates is shown in Equation (5):
λ M = σ 12 R 12 2 + 1 P 12 + R 22 + R 12 2 σ 22 R 22 + + P 12 + σ 22 R 12 ( σ 22 0 ) 1 R 12 σ 12 2 + p 12 σ 22 2 + p 12 σ 22 ( σ 22 < 0 ,   0 σ 22 σ 12 R 22 A σ 12 c ) σ 12 2 1 + p 22 R 12 2 + σ 22 R 22 R 22 σ 22 ( σ 22 < 0 ,   0 σ 12 σ 22 σ 12 c R 22 A )
where λM is the matrix damage judgment factor; when λM exceeds 1, matrix failure will occur; R 22 + , R 22 , and R 12 represent, respectively, the transverse tensile strength, transverse compressive strength, and matrix shear strength; p 12 + and p 12 are matching parameters of the curve slope, which need to be determined by a multi-axis test.
The Yamada–Sun fiber failure criteria are shown in Equation (6):
F a i l = ε f i b ε 11 + 2 + ε 12 ε 12 + 2 + ε 13 ε 13 + 2 , ε f i b > 0 F a i l = ε f i b ε 11 2 + ε 12 ε 12 2 + ε 13 ε 13 2 , ε f i b < 0 ε f i b = ε 11 + ν 12 ( 1 d ) ε 22
where ε 11 + , ε 12 + , and ε 13 + represent the fiber tensile failure strain, positive in-plane shear failure strain, and positive out-of-plane shear failure strain, respectively; ε 11 , ε 12 , and ε 13 represent the fiber compression failure strain, negative in-plane shear failure strain, and negative out-of-plane shear failure strain, respectively.

3.3. Parametric Analysis

To characterize the basic elasticity, initial failure, and post-failure behavior of a single-element model, the [0] and [90] single-element models are established to obtain the stress–strain curves, and the influence of each parameter on the material performance is determined. Combined with the performance parameters of T700/MTM28, the set values of the material model parameters are determined by inverting the relevant parameters of the material model, which can provide the basis values of the input parameters for the finite-element modeling of thin-walled composite C-channels. A summary of the parametric studies performed is shown in Table 1.

3.3.1. [0] Single-Element Model

A square single-element model of a Belytschko–Tsay shell is developed, with a side length of 1 mm and a thickness of 0.15 mm. The tension/compression load and boundary conditions are shown in Figure 3, and the stress–strain curve can be extracted.
For the [0] single-element model, the typical stress–strain curve, shown in Figure 4, can be divided into the following four stages: the linear elastic stage (0–1), degradation stage (1–2), platform stage (2–3), and element deleting stage (3–4).
The effects of E0t1 and E0c1 on the stress–strain curve are similar, which can determine the slope of the linear elastic stage (0–1) in the stress–strain curve during the tension and compression processes, respectively, as shown in Figure 5a,b. The EPSIfti can determine the maximum strain value of the linear elastic stage (0–1) in the stress–strain curves, as shown in Figure 5c. The EPSIftu can determine the strain value (Point 2 in Figure 4 at the junction between the degradation stage (1–2) and the platform stage (2–3). The greater the EPSIftu, the larger the strain value and the greater the strength after failure, as shown in Figure 5d.
The effects of Dftu and Dfcu on the stress–strain curve are similar, which can determine the strength value (Point 3 in Figure 4) of the platform stage (2–3) in the stress–strain curve during the tension and compression processes, respectively, as shown in Figure 5e,f. The greater the Dftu and Dfcu, the smaller the strength after degradation.
The Dpost can mainly affect the strength of the matrix after degradation. The smaller the Dpost, the greater the strength after the degradation of the matrix, as shown in Figure 5g.
The Xt11 and Xc11 can determine the strain value (Point 4 in Figure 4) of the element deleting stage (3–4) in the stress–strain curve, as shown in Figure 5h,i. The greater the Xt11 and Xc11, the later the element is deleted.
The GAMMA can affect the compressive elastic modulus and further affect the strength limit and the post-degradation compressive strength, as shown in Figure 5j. The value range of GAMMA is [0, 1], which can adjust the linearity of the compressive modulus before failure and the corresponding strength level.

3.3.2. [90] Single-Element Model

The tension/compression load and boundary conditions are shown in Figure 6, and the stress–strain curve can be extracted. For the [90] single-element model, the typical stress–strain curve, shown in Figure 7, can be divided into the following two stages: the elastic stage (0–2) and the degradation and element deleting stage (2–3), which can demonstrate the stress–strain properties of the matrix’s elastic to plasticity.
The E0t2 can determine the slope of the linear elastic stage in the stress–strain curves, as shown in Figure 8a. The larger the E0t2, the larger the slope of the linear elastic stage. At the same time, the E0t2 can affect the variation in the tensile stress–strain curve of the matrix from the elastic stage to the failure stage to a certain extent.
The Ycp and Y0p mainly affect the degradation stage in the stress–strain curve, as shown in Figure 8b,c, and both Ycp and Y0p can affect the tensile strength of the matrix. The larger the Ycp and Y0p, the greater the tensile strength of the matrix.
The effects of R0, BETA, and m on the stress–strain curves are shown in Figure 8d–f. By changing the values of the parameters, the downward trend of the degradation stage in the stress–strain curve can be found, and the failure strain, which causes the element deletion, is changed to varying degrees.

3.3.3. Material Model Parameters

The parameters’ physical meanings and the numerical meanings of the Lavadèze material constitutive model, the Puck IFF failure criteria, and the Yamada–Sun fiber failure criteria were identified through the parametric analysis of a single-element model. Finally, the parameters are presented in Table 2.

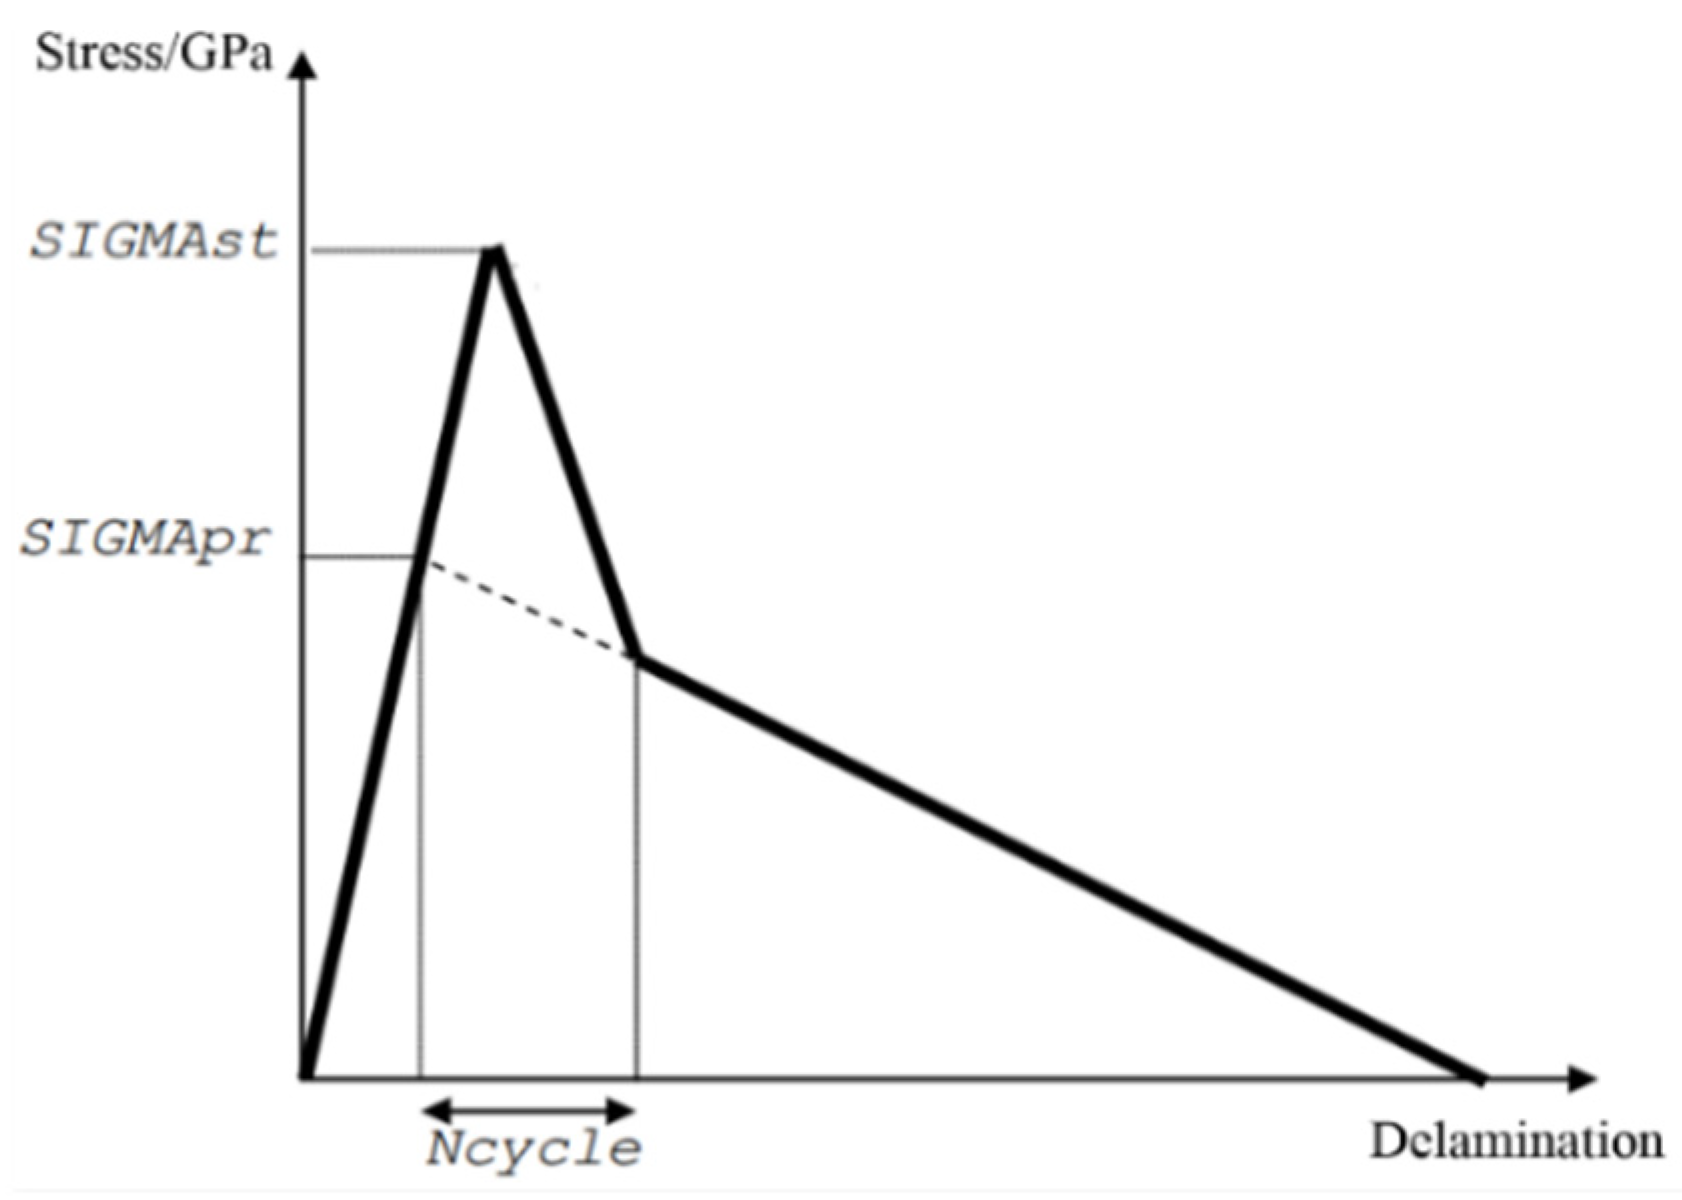
3.4. Stacked Shell Model

Based on the actual dimensions of the composite C-channels, a stacked shell FE model was developed in PAM-CRASH (2G version VPS 2020), i.e., each ply was represented by individual shell elements and stacked together using the cohesive elements to form the entire composite laminate, as shown in Figure 9. Due to stress concentration at the interface between the web and the flanges, the corner region of the C-channel was modeled by introducing a column of corner elements. The 45° outer chamfer section was created by employing a height-by-layer decrement approach. The mesh size of the web and flanges in the model was approximately 1.2 mm × 1.4 mm, while the mesh size of the corner elements was approximately 1.4 mm × 1.4 mm. This mesh density can ensure the accuracy of simulation results without significantly increasing the calculation time. The Belytschko–Tsay shell element was used, and each layer contained 4608 shell elements. The rigid wall had no deformation during the crushing process and provided a compulsive uniform velocity. Therefore, the element size, which was set to 10 mm × 10 mm, was relatively large and comprised a total of 219 elements.
To accurately simulate interlayer failure and ensure the reliability of the finite-element model, the cohesive elements were used to connect each layer, which can effectively simulate the load transmission of interlamination and delamination failure. The parameters of the cohesive element are shown in Table 3.
G u Ι and G u represent Type I and Type II fracture energy, which can be measured by a double cantilever beam test. These two parameters determine the interlaminar strength. In the model, the Pickett criteria [49] was used to couple the Type I and Type II cracks in a linear superposition, and the criteria calculation is shown in Equation (7).
G i I G u I + G i I I G u I I = 1
G i Ι and G i represent Type I and Type II crack propagation energy. In addition, the initial delamination stress, the continuous delamination stress and the stress reduction cycle number were utilized to regulate the relationship between the interlaminar crack length and the interlaminar stress. Taking the Type I crack as an example, the stress–crack length curve is shown in Figure 10.
To prevent the interlayer penetration, which can lead to inaccuracies in the simulation results, the self-contact method was employed for each layer. Accordingly, the node-to-surface contact method was used to avoid penetration between the rigid wall and the composite C-channel. For the finite-element model, the C-channel was immobilized by constraining all degrees of freedom of the bottom row of nodes situated opposite the 45° outer chamfer, while the remaining nodes were entirely free.
The strain rate effect was not considered in the finite-element models. Therefore, to enhance computational efficiency while maintaining simulation accuracy, a loading speed of 6000 mm/s was selected. Accordingly, the crushing distance was set to 44 mm, which was consistent with the test conditions. It took approximately 2–3 h to complete the simulation using a dual-core X5675 CPU and a workstation operating at a speed of 3.06 GHz.

4. Results and Discussion

4.1. Failure Morphology and Mechanism Analysis

The C-channels experienced a progressive crushing process under low-speed axial compression. The failure morphology of the [0/90]3s C-channel, depicted in Figure 11a, shows repeated folding and collapse, leading to large intervals in the load–displacement curve (Figure 12). Horizontal cracks appeared in the flat segment and flange, with some 0° ply detaching within the flat segment. Delamination occurred at the top side of the C-channel and both flange sides. Stress concentration in the corner caused complete fiber and matrix breakage, as 0° fibers failed under axial compression, leaving the 90° fibers unable to provide support.
For the [45/-45]3s C-channel, shown in Figure 11b, no folding occurred due to ±45° fiber reinforcement, which provided shear force resistance. This C-channel displayed significant elastic deformation without buckling failure or fiber fracture. However, local buckling in the flat segment caused matrix slippage along the fiber direction and numerous 45° cracks. The flange exhibited 45° matrix cracks and inward bending in the folding zone. The [45/-45]3s C-channel’s fibers withstood shearing forces, preventing cracking in the corner area, but 45° direction cracks led to fiber and matrix yielding, causing the flat segment to bend outward and causing slight twisting of the C-channel.
The [45/90/-45/0]3 C-channel, illustrated in Figure 11c, exhibited more compact folding. Fiber and matrix fractures, along with delamination, were observed on the top and flange sides. There was 0° layer debonding on the outside of the flat segment, and cracking occurred in the corner area. This C-channel also showed significant elastic deformation due to matrix cracks and fiber in the flat segment region.
The thin-walled composite C-channels were scanned by using CT tomography measuring machine. The three-dimensional image of [0/90]3s C-channel is shown in Figure 13a. There are multiple buckling zones in the region of the flat segment and flange, many fibers and matrix are buckling without breaking, and a small amount of fiber and matrix is fracturing. The failure mode is a local buckling failure mode, resulting in superposition, as shown in Figure 13b. In the initial section, delamination occurs in the chamfer, and it is gradually crushed. Under the combination of debris and the indenter, local buckling failure occur, with fibers breaking or deforming elastically. The interlaminar shear stress are increased because of the buckling failure of fibers, and interlaminar cracks are formed, which causes the delamination and local brittle fracture of the matrix in the buckling zone. The failure mechanisms are intralaminar and interlaminar delamination, the elastic deformation of the fibers, the buckling of the fibers and matrix, the debonding and fracture of the fibers, the deformation cracking of the matrix, and corner cracking.

4.2. Energy-Absorbing Characteristics Analysis

Figure 12 shows the load–displacement curves of thin-walled composite C-channels under low-speed axial compression tests. For three samples with the same layer numbers and layups, the load–displacement curves are very similar, so only one of the three curves is selected to analyze the energy-absorbing characteristics. The energy-absorbing metrics are listed in Table 4.
For the thin-walled composite C-channels with different layups, the crushing loads increase approximately linearly from zero to Fmax: 16.294 kN for the [0/90]3s C-channel, 16.006 kN for the [45/-45]3s C-channel, and 17.225 kN for the [45/90/-45/0]3 C-channel. The chamfers of composite C-channels have been fully crushed, and the crushing loads suddenly drop, reaching a lower sustained crushing load for the remainder of crushing displacement. The [45/-45]3s C-channel experiences the largest load drop, and the Fmean is the minimum. The [0/90]3s C-channel and [45/90/-45/0]3 C-channel experience load drops less severe than exhibited by the [45/-45]3s C-channel. The Fmean of the [0/90]3s C-channel is the maximum, so the SEA value is also the maximum, which are 14.93% and 6.30% higher than the [45/-45]3s C-channel and [45/90/-45/0]3 C-channel, respectively.

4.3. Simulation and Model Verification

The simulated failure morphologies of the 0° layer, 90° layer, and 45° layer are shown in Figure 14. During the process of the axial compression test, the 0° layer was mainly subjected to an axial compressive load, which can provide the axial stiffness for thin-walled composite C-channels. The circumferential strength and stiffness were weak, which resulted in axial bending and circumferential cracking. During the process of the axial compression simulation, brittle fracture failure mainly occurs for the 0° layer. Most of the elements were deleted after reaching the failure strain. A small part of the elements, which were not deleted, were separated from the whole structure, and a few of the elements had larger deformations, as shown in Figure 14a.
During the axial compression test, the 90° layer was primarily supported by the matrix, leading to numerous cracks forming along the fiber direction, ultimately resulting in failure. During the process of the axial compression test, the 90° layer was primarily supported by the matrix, resulting in numerous cracks developing along the direction of the fibers, ultimately leading to failure. During the process of the axial compression simulation, the thin walls folded outward or inward, subsequently resulting in damage in the form of progressive collapse, as shown in Figure 14b.
During the process of the axial compression test, the 45° layer was mainly subjected to shear load, transverse shear load, and adjacent interlaminar forces caused by the axial compressive loads. During the process of the axial compression simulation, a large number of elements were deleted after reaching the failure strain, demonstrating the progressive failure behavior, and some elements exhibited larger deformations, as shown in Figure 14c.
The crushing process of the [0/90]3s C-channel between the test and simulation is shown in Figure 15. With the axial movement of the steel indenter, the [0/90]3s C-channel was continuously folded and exhibited progressive compression failure, resulting in a plurality of transverse cracks, and the fiber and the matrix at the corner area completely broke. The simulated progressive compression failure process is in good agreement with the test results.
For the stacked shell models of composite C-channels, the outer chamfer is firstly crushed under the action of the rigid wall, and delamination can be observed, as shown in Figure 16a. With the progressive crushing process, a small number of elements fail to be deleted, and many elements are deformed and stacked, as shown in Figure 16b.
A comparison of the load–displacement curves of C-channels with three different layers subject to low-speed axial compression was obtained. A low-pass digital filter (SAE 1000 Hz) was applied to filter the simulation results during post-processing. The simulated load–displacement curves aligned well with the test load–displacement curves, as shown in Figure 17. In the early stage of the axial compression process, the load increases linearly until the initial peak is reached. Subsequently, the bearing capacity of the C-channel decreases, and the load value of the load–displacement curve correspondingly decreases. Then, the compression load fluctuates up and down within a certain range.
A comparison of the energy-absorbing characteristics of the C-channels from the test and simulation is shown in Figure 18. The simulation Fmax values are lower by approximately 5% to 30% than the test results, as shown in Figure 18a. This discrepancy is likely due to the exclusion of the strain rate effect in the material constitutive model. Additionally, material processing defects and the manufacturing process contribute to significant dispersion in the Fmax values. The failure behavior of the corner area is complex, and the finite-element model, while simplified, further complicates the accurate simulation of Fmax. However, the differences in Fmean and SEA between the simulation and test results are within 6%, as shown in Figure 18b,c. The model can effectively calculate the energy-absorbing characteristics of specimens and reflect their failure modes.

5. Conclusions

In this paper, low-speed axial compression tests were conducted on carbon fiber T700/MTM28 composite C-channels with different layups. Load–displacement curves and failure damage modes were obtained. Based on the parametric analysis for the [0] and [90] single-element models, some key parameters were determined and stacked shell models of thin-walled composite C-channels were established. The failure mechanism and energy-absorbing characteristics were analyzed, and the reliability of the stacked shell model was verified against the test results. Some conclusions were drawn as follows:
(1) The thin-walled composite C-channels with [0/90]3s, [45/-45]3s, and [45/90/-45/0]3 exhibit a stable progressive crushing progress characterized by local buckling. This stability is crucial for energy-absorption applications in crashworthiness.
(2) The primary failure mechanisms identified include intralaminar and interlaminar delamination, elastic deformation of fibers, buckling of fiber and matrix, debonding and fracture of fibers, deformation cracking of matrix, and corner cracking. These failure modes interact to dissipate energy during compression, enhancing the energy-absorption capacity of the composite structures.
(3) The physical and numerical meanings of the Lavadèze single-layer model, the Puck IFF failure criteria, and the Yamada–Sun fiber failure criteria are clarified by studying the stress–strain relationship of the single-element model. The proposed values of the material model are given by parametric analysis.
(4) The specific energy absorption (SEA) values for the different layups are 18.5kJ/kg([0/90]3s), 15.2kJ/kg([45/-45]3s), and 17.1kJ/kg([45/90/-45/0]3). The mean crushing force (Fmean) values are 14.5kN([0/90]3s), 12.8kN([45/-45]3s), and 13.9kN([45/90/-45/0]3). The stacked shell model can accurately capture the interlayer matrix failure and interface delamination cracking behavior observed in the experiments. The simulations exhibit a discrepancy of less than 6% when compared to the experimental results, indicating a strong correlation between the two sets of data. This modeling approach provides a reliable tool for predicting the energy-absorption characteristics of composite structures.
(5) The methods used in this study, including parametric analysis and finite-element modeling, offer robust tools to assess the service performance of materials produced on a large scale for high-performance applications.
The results obtained in this study demonstrate that the molecular-level interactions and matrix–fiber interactions are fundamental in determining the mechanical properties and failure modes of composite materials. A thorough understanding of these interactions enables more accurate predictions of composite behavior under load and facilitates the design of composites with optimized performance characteristics. Our models, which incorporate these molecular-level considerations, provide a robust framework for analyzing and predicting the energy absorption and failure mechanisms of composite structures.

Author Contributions

Conceptualization, X.Z. and Z.F.; methodology, X.Z. and S.S.; investigation, S.S.; resources, H.M.; data curation, X.Z. and S.S.; writing—original draft preparation, X.Z. and H.M.; supervision, H.M. and Z.F.; project administration, H.M.; funding acquisition, Z.F. All authors have read and agreed to the published version of the manuscript.

Funding

This research was funded by National Key R&D Program of China, grant number 2022YFB4301000; Tianjin Applied Basic Research Multi-Input Fund Project, grant number 21JCYBJC00690, 23JCYBJC00070; and the Fundamental Research Funds for the Central Universities, grant number 3122017020.

Institutional Review Board Statement

Not applicable.

Data Availability Statement

The original contributions presented in the study are included in the article, further inquiries can be directed to the corresponding author.

Conflicts of Interest

The authors declare no conflicts of interest.

References

  1. Sharifah, R.; Ali, J.S.; Shaik, I.; Adib, R. Influence of Composite Skin on the Energy Absorption Characteristics of an Aircraft Fuselage. Int. J. Eng. Mater. Manuf. 2023, 8, 13–20. [Google Scholar] [CrossRef]
  2. Guida, M.; Marulo, F.; Abrate, S. Advances in crash dynamics for aircraft safety. Prog. Aerosp. Sci. 2018, 98, 106–123. [Google Scholar] [CrossRef]
  3. Jacob, G.C.; Fellers, J.F.; Simunovic, S.; Starbuck, J.M. Energy Absorption in Polymer Composites for Automotive Crashworthiness. J. Compos. Mater. 2016, 36, 813–850. [Google Scholar] [CrossRef]
  4. Di Palma, L.; Di Caprio, F.; Chiariello, A.; Ignarra, M.; Russo, S.; Riccio, A.; De Luca, A.; Caputo, F. Vertical Drop Test of Composite Fuselage Section of a Regional Aircraft. AIAA J. 2020, 58, 474–487. [Google Scholar] [CrossRef]
  5. Di Caprio, F.; Ignarra, M.; Marulo, F.; Guida, M.; Lamboglia, A.; Gambino, B. Design of Composite Stanchions for the Cargo Subfloor Structure of a Civil Aircraft. Procedia Eng. 2016, 167, 88–96. [Google Scholar] [CrossRef]
  6. Mou, H.; Xie, J.; Feng, Z. Research status and future development of crashworthiness of civil aircraft fuselage structures: An overview. Prog. Aerosp. Sci. 2020, 119, 100644. [Google Scholar] [CrossRef]
  7. David, M.; Johnson, A.F.; Voggenreiter, H. Analysis of Crushing Response of Composite Crashworthy Structures. Appl. Compos. Mater. 2012, 20, 773–787. [Google Scholar] [CrossRef]
  8. Elahi, S.A.; Rouzegar, J.; Niknejad, A.; Assaee, H. Theoretical study of absorbed energy by empty and foam-filled composite tubes under lateral compression. Thin-Walled Struct. 2017, 114, 1–10. [Google Scholar] [CrossRef]
  9. Reuter, C.; Tröster, T. Crashworthiness and numerical simulation of hybrid aluminium-CFRP tubes under axial impact. Thin-Walled Struct. 2017, 117, 1–9. [Google Scholar] [CrossRef]
  10. Bolukbasi, A.O.; Baxter, T.R.; Nguyen, T.A.; Rassaian, M.; Davis, K.R.; Koch, W.; Firth, L.C. Energy Absorbing Structure for Aircraft. USA. GB2444645A, 11 June 2008. [Google Scholar]
  11. FAA. Special Conditions: Boeing Model 787-8 Airplane. Crashworthiness. In 5-362-SC; Federal Aviation Administration: Washington, DC, USA, 2007. [Google Scholar]
  12. FAA. Special Conditions: Airbus A350-900 Airplane. Crashworthiness, Emergency Landing Conditions. In 25-537-SC; Federal Aviation Administration: Washington, DC, USA, 2014. [Google Scholar]
  13. Mahdi, E.; Sebaey, T.A. An experimental investigation into crushing behavior of radially stiffened GFRP composite tubes. Thin-Walled Struct. 2014, 76, 8–13. [Google Scholar] [CrossRef]
  14. Böhm, H.; Weck, D.; Hornig, A.; Langkamp, A.; Adam, F.; Gude, M. Experimental and Numerical Study on the Axial Crushing Behavior of Textile-Reinforced Thermoplastic Composite Tubes. Adv. Eng. Mater. 2016, 18, 437–443. [Google Scholar] [CrossRef]
  15. Wang, Z.; Jin, X.; Li, Q.; Sun, G. On crashworthiness design of hybrid metal-composite structures. Int. J. Mech. Sci. 2020, 171, 105380. [Google Scholar] [CrossRef]
  16. Rozylo, P.; Debski, H. Stability and load carrying capacity of thin-walled composite columns with square cross-section under axial compression. Compos. Struct. 2024, 329, 117795. [Google Scholar] [CrossRef]
  17. Bussadori, B.P.; Schuffenhauer, K.; Scattina, A. Modelling of CFRP crushing structures in explicit crash analysis. Compos. Part B: Eng. 2014, 60, 725–735. [Google Scholar] [CrossRef]
  18. Jiang, H.; Ren, Y.; Gao, B. Research on the progressive damage model and trigger geometry of composite waved beam to improve crashworthiness. Thin-Walled Struct. 2017, 119, 531–543. [Google Scholar] [CrossRef]
  19. Ren, Y.; Jiang, H.; Ji, W.; Zhang, H.; Xiang, J.; Yuan, F.-G. Improvement of Progressive Damage Model to Predicting Crashworthy Composite Corrugated Plate. Appl. Compos. Mater. 2017, 25, 45–66. [Google Scholar] [CrossRef]
  20. Mou, H.L.; Su, X.; Xie, J.; Feng, Z.Y. Parametric analysis of composite sinusoidal specimens under quasi-static crushing. Aeronaut. J. 2018, 122, 1244–1262. [Google Scholar] [CrossRef]
  21. Lin, J.S.; Wang, X.; Fang, C.Q.; Huang, X. Collapse loading and energy absorption of fiber-reinforced conical shells. Compos. Part B Eng. 2015, 74, 178–189. [Google Scholar] [CrossRef]
  22. Ying, L.W.; Yang, F.P.; Wang, X. Analytical method for the axial crushing force of fiber-reinforced tapered square metal tubes. Compos. Struct. 2016, 153, 222–233. [Google Scholar] [CrossRef]
  23. El-Hage, H.; Mallick, P.K.; Zamani, N. A numerical study on the quasi-static axial crush characteristics of square aluminum–composite hybrid tubes. Compos. Struct. 2006, 73, 505–514. [Google Scholar] [CrossRef]
  24. Paz, J.; Díaz, J.; Romera, L.; Costas, M. Crushing analysis and multi-objective crashworthiness optimization of GFRP honeycomb-filled energy absorption devices. Finite Elem. Anal. Des. 2014, 91, 30–39. [Google Scholar] [CrossRef]
  25. Bi, J.; Fang, H.; Wang, Q.; Ren, X. Modeling and optimization of foam-filled thin-walled columns for crashworthiness designs. Finite Elem. Anal. Des. 2010, 46, 698–709. [Google Scholar] [CrossRef]
  26. Siromani, D.; Henderson, G.; Mikita, D.; Mirarchi, K.; Park, R.; Smolko, J.; Awerbuch, J.; Tan, T.-M. An experimental study on the effect of failure trigger mechanisms on the energy absorption capability of CFRP tubes under axial compression. Compos. Part A Appl. Sci. Manuf. 2014, 64, 25–35. [Google Scholar] [CrossRef]
  27. Feraboli, P. Development of a Modified Flat-plate Test Specimen and Fixture for Composite Materials Crush Energy Absorption. J. Compos. Mater. 2009, 43, 1967–1990. [Google Scholar] [CrossRef]
  28. Palanivelu, S.; Paepegem, W.V.; Degrieck, J.; Kakogiannis, D.; Ackeren, J.V.; Hemelrijck, D.v.; Wastiels, J.; Vantomme, J. Comparative study of the quasi-static energy absorption of small-scale composite tubes with different geometrical shapes for use in sacrificial cladding structures. Polym. Test. 2010, 29, 381–396. [Google Scholar] [CrossRef]
  29. Tran, T.; Hou, S.; Han, X.; Chau, M. Crushing analysis and numerical optimization of angle element structures under axial impact loading. Compos. Struct. 2015, 119, 422–435. [Google Scholar] [CrossRef]
  30. Różyło, P. Experimental-numerical test of open section composite columns stability subjected to axial compression. Arch. Mater. Sci. Eng. 2017, 84, 58–64. [Google Scholar] [CrossRef]
  31. Wysmulski, P. Non-linear analysis of the postbuckling behaviour of eccentrically compressed composite channel-section columns. Compos. Struct. 2023, 305, 116446. [Google Scholar] [CrossRef]
  32. Wysmulski, P.; Debski, H.; Falkowicz, K. Sensitivity of Compressed Composite Channel Columns to Eccentric Loading. Materials 2022, 15, 6938. [Google Scholar] [CrossRef]
  33. Friedrich, L.; Loosen, S.; Liang, K.; Ruess, M.; Bisagni, C.; Schröder, K.-U. Stacking sequence influence on imperfection sensitivity of cylindrical composite shells under axial compression. Compos. Struct. 2015, 134, 750–761. [Google Scholar] [CrossRef]
  34. PAM-CRASH User Manual Version 2014; ESI Group Paris: Paris, France, 2014.
  35. LSDKU Manual. Version 971, Livermore Software Technology Corporation (LSTC); LSDKU Manual: Livermore, CA, USA, 2009. [Google Scholar]
  36. Abaqus Theory Guide, Version 6.14; Dassault Systèmes Simulia. Inc.: Providence, RI, USA, 2014.
  37. Rozylo, P.; Falkowicz, K.; Wysmulski, P.; Debski, H.; Pasnik, J.; Kral, J. Experimental-Numerical Failure Analysis of Thin-Walled Composite Columns Using Advanced Damage Models. Materials 2021, 14, 1506. [Google Scholar] [CrossRef]
  38. Debski, H.; Rozylo, P.; Teter, A. Buckling and limit states of thin-walled composite columns under eccentric load. Thin-Walled Struct. 2020, 149, 106627. [Google Scholar] [CrossRef]
  39. Wysmulski, P.; Debski, H. Post-buckling and limit states of composite channel-section profiles under eccentric compression. Compos. Struct. 2020, 245, 112356. [Google Scholar] [CrossRef]
  40. Vasiliev, V.; Lurie, S.; Salov, V. Estimation of the strength of plates with cracks based on the maximum stress criterion in a scale-dependent generalized theory of elasticity. Phys. Mesomech. 2019, 22, 456–462. [Google Scholar] [CrossRef]
  41. Zhao, L.; Qin, T.; Zhang, J.; Shenoi, R.A. Modified maximum stress failure criterion for composite π joints. J. Compos. Mater. 2013, 47, 2995–3008. [Google Scholar] [CrossRef]
  42. Mirsayar, M. Maximum principal strain criterion for fracture in orthotropic composites under combined tensile/shear loading. Theor. Appl. Fract. Mech. 2022, 118, 103291. [Google Scholar] [CrossRef]
  43. Rao, P.M.; Subba Rao, V. Degradation model based on Tsai-Hill factors to model the progressive failure of fiber metal laminates. J. Compos. Mater. 2011, 45, 1783–1792. [Google Scholar] [CrossRef]
  44. Hashin, Z. Finite thermoelastic fracture criterion with application to laminate cracking analysis. J. Mech. Phys. Solids 1996, 44, 1129–1145. [Google Scholar] [CrossRef]
  45. Lee, C.-S.; Kim, J.-H.; Kim, S.-k.; Ryu, D.-M.; Lee, J.-M. Initial and progressive failure analyses for composite laminates using Puck failure criterion and damage-coupled finite element method. Compos. Struct. 2015, 121, 406–419. [Google Scholar] [CrossRef]
  46. Zheng, J.; Maharaj, C.; Liu, J.; Chai, H.; Liu, H.; Dear, J.P. A comparative study on the failure criteria for predicting the damage initiation in fiber-reinforced composites. Mech. Compos. Mater. 2022, 58, 125–140. [Google Scholar] [CrossRef]
  47. Mohamadzadeh, M.; Haftkhani, A.R.; Ebrahimi, G.; Yoshihara, H. Numerical and experimental failure analysis of screwed single shear joints in wood plastic composite. Mater. Des. 2012, 35, 404–413. [Google Scholar] [CrossRef]
  48. Palanivelu, S.; Van Paepegem, W.; Degrieck, J.; Kakogiannis, D.; Van Ackeren, J.; Van Hemelrijck, D.; Wastiels, J.; Vantomme, J. Parametric study of crushing parameters and failure patterns of pultruded composite tubes using cohesive elements and seam, Part I: Central delamination and triggering modelling. Polym. Test. 2010, 29, 729–741. [Google Scholar] [CrossRef]
  49. Siromani, D.; Awerbuch, J.; Tan, T.-M. Finite element modeling of the crushing behavior of thin-walled CFRP tubes under axial compression. Compos. Part B Eng. 2014, 64, 50–58. [Google Scholar] [CrossRef]
  50. Johnson, A.F.; David, M. Failure mechanisms in energy-absorbing composite structures. Philos. Mag. 2010, 90, 4245–4261. [Google Scholar] [CrossRef]
  51. Feraboli, P.; Wade, B.; Deleo, F.; Rassaian, M.; Higgins, M.; Byar, A. LS-DYNA MAT54 modeling of the axial crushing of a composite tape sinusoidal specimen. Compos. Part A Appl. Sci. Manuf. 2011, 42, 1809–1825. [Google Scholar] [CrossRef]
  52. Feraboli, P.; Wade, B. Simulating Laminated Composite Materials Using LS-DYNA Material Model MAT54: Single-Element Investigation. Federal Aviation Administration Technical Report. 2015. Available online: https://www.researchgate.net/publication/322152587_Simulating_Laminated_Composite_Materials_Using_LS-DYNA_Material_Model_MAT54_Single-Element_Investigation (accessed on 23 April 2024).
  53. Chang, F.-K.; Chang, K.-Y. Post-failure analysis of bolted composite joints in tension or shear-out mode failure. J. Compos. Mater. 1987, 21, 809–833. [Google Scholar] [CrossRef]
  54. Chang, F.-K.; Lessard, L.B. Damage tolerance of laminated composites containing an open hole and subjected to compressive loadings: Part I—Analysis. J. Compos. Mater. 1991, 25, 2–43. [Google Scholar] [CrossRef]
  55. DINENISO7822-2000; Textile Glass Reinforced Plastics—Determination of Void Content—Loss on Ignition, Mechanical Disintegration and statistical Counting Methods. German version 2000. Deutsches Institut für Normung e.V.: Berlin, Germany, 1990; pp. 1–8.
  56. ASTM D792-13; Standard Test Methods for Density and Specific Gravity (Relative Density) of Plastics by Displacement, American Society for Testing and Materials. ASTM: West Conshohocken, PA, USA, 2013.
  57. ASTM D3039/D3039M-17; Standard Test Method for Tensile Properties of Polymer Matrix Composite Materials. ASTM: West Conshohocken, PA, USA, 2015.
  58. ASTM D3410; Standard Test Method for Compressive Properties of Unidirectional or Crossply Fiber-Resin Composites. ASTM: West Conshohocken, PA, USA, 1987.
  59. ASTM D3518/D3518M-18; Standard Test Method for In-Plane Shear Response of Polymer Matrix Composite Materials by Tensile Test of a ±45° Laminate EUA. ASTM: West Conshohocken, PA, USA, 2010.
  60. ASTM D638; Standard Test Method for Tensile Properties of Plastics. ASTM: West Conshohocken, PA, USA, 2008.
  61. ASTM D695; Standard Test Method for Compressive Properties of Rigid Plastics. ASTM: West Conshohocken, PA, USA, 2010.
  62. ASTM D5379; Standard Test Method for Shear Properties of Composite Materials by the V-Notched Beam Method. ASTM: West Conshohocken, PA, USA, 2015.
Figure 1. Schematic diagram of the polymer composite C-channels (a), three-dimensional stereogram (b), and C-channel specimen (c).
Polymers 16 02099 g001
Figure 2. Test scheme, fixture and C-channel.
Polymers 16 02099 g002
Figure 3. Single-element shell models with tension load (a) and compression load (b).
Polymers 16 02099 g003
Figure 4. Typical stress–strain curve of the [0] single-element model, point 0 represents the initial state of the material before any load is applied, point 1 indicates the yield point of the material, point 2 represents the stress value after material degradation, point 3 represents the end of the platform stage, and point 4 represents the element deletion.
Polymers 16 02099 g004
Figure 5. Stress–strain curves of the [0] single-element model, E0t1 (a), E0c1 (b), EPSIfti (c), EPSIftu (d), Dftu (e), Dfcu (f), Dpost (g), Xt11 (h), Xc11 (i), and GAMMA (j).
Polymers 16 02099 g005
Figure 6. Tension load (a) and compression load (b).
Polymers 16 02099 g006
Figure 7. Typical stress–strain curve of the [90] single-element model, point 0 represents the initial state of the material before any load is applied, point 1 is in the early stages of the loading process where the material exhibits linear elastic behavior, point 2 represents the peak stress, also known as the ultimate strength of the material, and point 3 indicates the failure of the material.
Polymers 16 02099 g007
Figure 8. Stress–strain curves of the [90] single-element model, E0t2 (a), Ycp (b), Y0p (c), R0 (d), BETA (e), and m (f).
Polymers 16 02099 g008
Figure 9. Stacked shell model of C-channels.
Polymers 16 02099 g009
Figure 10. Stress-delamination propagation of cohesive element.
Polymers 16 02099 g010
Figure 11. Failure morphology of the [0/90]3s C-channel (a), [45/-45]3s C-channel (b), and [45/90/-45/0]3 C-channel (c).
Polymers 16 02099 g011aPolymers 16 02099 g011b
Figure 12. Load-displacement curves: [0/90]3s, [45/-45]3s, and [45/90/-45/0]3 C-channels.
Polymers 16 02099 g012
Figure 13. Three-dimensional image of the [0/90]3s C-channel (a) and the local buckling failure mode (b).
Polymers 16 02099 g013
Figure 14. Simulation failure morphologies, 0° layer (a), 90° layer (b), and 45° layer (c).
Polymers 16 02099 g014
Figure 15. Test crushing process (a) and simulation crushing process (b).
Polymers 16 02099 g015
Figure 16. Delamination (a) and folding deformation (b).
Polymers 16 02099 g016
Figure 17. Comparison of load–displacement curves between test and simulation: [0/90]3s (a), [45/-45]3s (b), and [45/90/-45/0]3 (c).
Polymers 16 02099 g017
Figure 18. Comparison of energy-absorbing characteristics, Fmax (a), Fmean (b), and SEA (c).
Polymers 16 02099 g018
Table 1. Summary of the parametric studies performed.
ParameterPhysical SignificanceUnitParametric Variation
E0t1Young’s modulus in Direction 1GPa50100200300
EPSIftiTensile fiber initial strain-0.0050.010.0180.02
EPSIftuTensile fiber ultimate strain-0.0180.020.030.035
DftuTensile fiber ultimate damage-0.20.40.81
Xt11Tensile fiber strength/strain for failure-0.050.10.30.4
E0c1Compressive fiber Young’s modulus in Direction 1GPa50100200300
GAMMACompressive factor of modulus correction-00.20.60.8
DfcuCompressive fiber ultimate damage-0.20.40.81
Xc11Compressive tensile fiber strength/strain for failure-0.050.080.20.3
E0t2Young’s modulus in Direction 2GPa67910
YcpCritical transverse damage limitGPa1/20.020.0250.0350.04
Y0pInitial transverse damage limitGPa1/20.0050.00750.01250.015
R0Initial yield stressGPa0.0050.010.050.075
BETAHardening law multiplierGPa1.21.533.5
mHardening law exponent 0.60.70.80.9
DAMpostPost damage of matrix- 10.90.85
Table 2. Material model parameters.
ParametersDefinitionUnitValueMeasurement
RHOMass density of ply materialg/cm31.52ASTM D792 [56]
E0t1Young’s modulus in Direction 1 of fiberGPa126ASTM D3039 [57]
E0t2Young’s modulus in Direction 2 of fiberGPa8.40ASTM D3039
E0c1Compressive Young’s modulus of fiberGPa116ASTM D3410 [58]
G012Shear modulus of 1,2-planeGPa3.69ASTM D3518 [59]
NU12Poisson’s ratio in 1,2-plane-0.3ASTM D3039
R22+Matrix tensile transverse strengthGPa0.0554ASTM D638 [60]
R22-Matrix compressive transverse strengthGPa0.225ASTM D695 [61]
R12Matrix shear strengthGPa0.2ASTM D5379 [62]
EPSIftiTensile fiber initial strain-0.0217
YcpCritical transverse damage limitGPa1/20.0596Calibrated by material coupon level test results.
Y0pInitial transverse damage limitGPa1/20.01
DmaxMaximum allowed damage value for shear damage and transverse damage-1
GAMMACompressive factor of modulus correction-0
R0Initial yield stressGPa0.025
BETAHardening law multipleGPa2.1
mHardening law exponent-0.75
DpostPost damage of matrix-0.96
DftuTensile fiber ultimate damage 0.7~0.85
DfcuCompressive fiber ultimate damage 0.7~0.85
EPSIftuTensile fiber ultimate strain-0.025
Xt11Tensile fiber strain for failure-0.52
Xc11Compressive tensile fiber strain for failure-0.38
Table 3. Cohesive element parameters.
ParametersDefinitionUnitValues
hcontDistance for kinematic computationmm0.3
E0Normal modulusGPa4
G0Shear modulusGPa2.5
SIGprpgNormal stress to continue delaminationGPa0.098
GAMAprpgShear stress to continue delaminationGPa0.094
G u Ι Mode I fracture energyJ/mm20.00047
G u Mode II fracture energyJ/mm20.002
SIGstrtNormal stress to initiate delaminationGPa0.1
GAMAstrtShear stress to initiate delaminationGPa0.1
NcycleStress reduction cycle number 100
Table 4. Energy-absorbing metrics of C-channels.
LayupsFmax/kNFmean/kNEA/kJSEA/(kJ/kg)
[0/90]3s16.2947.801345.05841.793
[45/-45]3s16.0066.776300.23636.364
[45/90/-45/0]317.2257.329324.62539.318
Disclaimer/Publisher’s Note: The statements, opinions and data contained in all publications are solely those of the individual author(s) and contributor(s) and not of MDPI and/or the editor(s). MDPI and/or the editor(s) disclaim responsibility for any injury to people or property resulting from any ideas, methods, instructions or products referred to in the content.

