

An Analysis of the Displacements in 3D-Printed PLA Acoustic Guitars

 , , and
Abstract
:
1. Introduction
1.1. The Top Plate of the Acoustic Guitar
1.2. Additive Manufacturing and Its Use in the Music Industry
2. Materials and Methods
2.1. Materials
2.2. Experimental Procedure
2.3. Analysis of Vibration Result: Test Simulation by FEM
2.4. Harmonic Cap as a Mechanical System Subjected to Vibration
3. Results
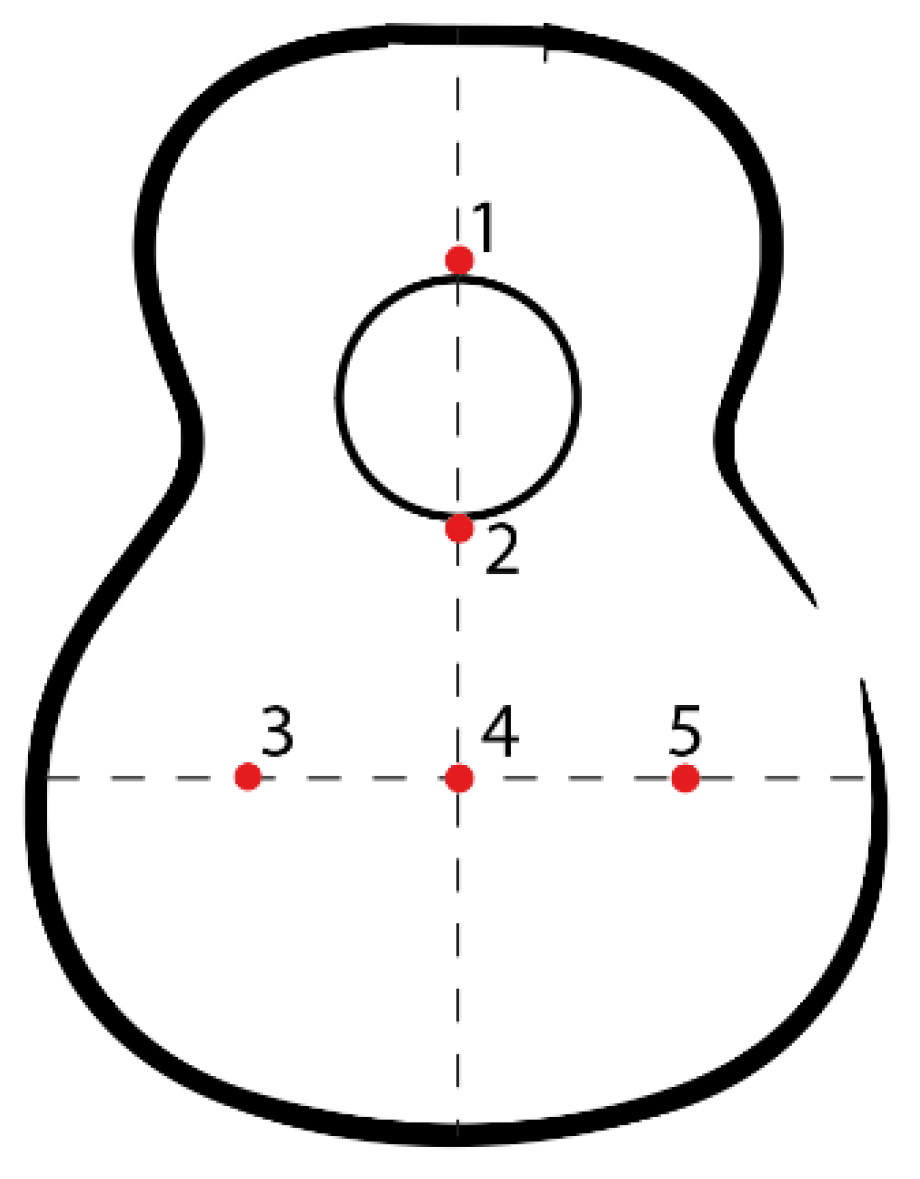
Comparative Analysis of FEM Test/Experimental Test Displacements
4. Discussion
4.1. Laboratory Physical Tests
4.2. Finite Element Testing
4.3. Overall Assessment and Future Lines
5. Conclusions
- The printing directions by additive manufacturing indicates that it allows for modifying vibrational behavior of the harmonic cap.
- Modifying the vibratory behavior adds a new possibility for the design of acoustic guitars, using FFF printing as a fundamental tool to customize the instrument according to the guitarist’s tastes, since it will be possible to parameterize and use the printing parameters for a completely personalized design.
- It is possible to consider mixed directional behaviors, so that one area of the soundboard is printed with one direction and another part with another direction.
- Although the SolidWorks design software is not able to generate the particularities of the printing directions and other parameters of additive manufacturing, it does allow for establishing an initial approximation of the vibrational behavior of the harmonic cap, in case one desires to modify parameters, such as the wandering.
- The specimen printed at 0° generated outliers, causing vibration amplitude at some points quite far from the average of the rest of the specimens.
- The largest displacements in the minor lobe are achieved with a printing direction of 90°, since it transmits the vibration from the major lobe to the minor lobe, as occurs with the traditional wooden caps.
- The displacements at the second point, below the top plate, are enhanced with an impression direction perpendicular to the direction of the strings, i.e., 0°. Concretely, this top concentrates the vibration on the major lobe, approaching the waist of the top.
- At frequencies of 120–300 Hz, an impression angle of −45° causes greater average displacements in the left zone, where the thickest strings would be found and with which bass sounds are generated, so if in addition to that direction, the reinforcement in the central zone of the major lobe is increased.
- It is important to continue the research in this field so as to define quality indexes at a later stage, and to carry out a study according to these parameters.
Author Contributions
Funding
Institutional Review Board Statement
Data Availability Statement
Conflicts of Interest
References
- Friederich, D. La tapa de la guitarra clásica y sus varetados: El dilema del luthier—Simetría o asimetría La caja armónica o de resonancia se compone de dos lados, la parte posterior. In Acústica e Instrumentos Antig. Construcción, Música y Cienc; Française d’Acoustique, S., Ed.; Orfeo Magazine: Madrid, Spain, 2013. [Google Scholar]
- Stanciu, M.D.; Bârsănescu, P.; Goanță, V.; Savin, A. Experimental determination of stress and strain states of the guitar’s wood structure. IOP Conf. Ser. Mater. Sci. Eng. 2020, 916, 012113. [Google Scholar] [CrossRef]
- Olabarri, E.; Jesús, M. El análisis modal: Su aplicación a la acústica musical (The modal analysis: Application to the musical acustic). Formula 1997, 4, 153–165. [Google Scholar]
- Torres, J.A.T. El Puente, Modos de Vibración y Radiación Sonora en Frecuencias Medias de la Guitarra Clásica. Ph.D. Thesis, National Autonomous University of Mexico, Mexico City, Mexico, 2010; p. 89. [Google Scholar] [CrossRef]
- Mihălcică, M.; Stanciu, M.D.; Vlase, S. Frequency Response Evaluation of Guitar Bodies with Different Bracing Systems. Symmetry 2020, 12, 795. [Google Scholar] [CrossRef]
- Thuillier, E.; Lähdeoja, O.; Välimäki, V. Feedback control in an actuated acoustic guitar using frequency shifting. J. Audio Eng. Soc. 2019, 67, 373–381. [Google Scholar] [CrossRef]
- Kantaros, A.; Diegel, O. 3D printing technology in musical instrument research: Reviewing the potential. Rapid Prototyp. J. 2018, 24, 1511–1523. [Google Scholar] [CrossRef]
- Ray, T.; Kaljun, J.; Dolsak, B. Numerical model application to predict the sound quality of an instrument. Int. J. Simul. Model. 2021, 20, 696–706. [Google Scholar] [CrossRef]
- News—MONAD Studio. Available online: https://www.monadstudio.com/ (accessed on 7 September 2021).
- Viala, R.; Placet, V.; Cogan, S. Model-based evidence of the dominance of the guitar brace design over material and climatic variability for dynamic behaviors. Appl. Acoust. 2021, 182, 108275. [Google Scholar] [CrossRef]
- Caldersmith, G. Designing a guitar family. Appl. Acoust. 1995, 46, 3–17. [Google Scholar] [CrossRef]
- Zoran, A. The 3D Printed Flute: Digital Fabrication and Design of Musical Instruments. J. New Music. Res. 2011, 40, 379–387. [Google Scholar] [CrossRef]
- Sumi, T.; Ono, T. Classical guitar top board design by finite element method modal analysis based on acoustic measurements of guitars of different quality. Acoust. Sci. Technol. 2008, 29, 381–383. [Google Scholar] [CrossRef]
- Marano, A. 3D printing to innovate the guitar design. In Advances in Intelligent Systems and Computing; Springer: Cham, Switzerland, 2020; pp. 16–23. [Google Scholar] [CrossRef]
- Torres, J.A.; Boullosa, R.R. Identificación a simple vista de patrones de vibración de una tapa de guitarra. In Acústica; Universidade de Coimbra: Coimbra, Portugal, 2008. [Google Scholar]
- Zhao, J. Nonlinear vibratory properties of additive manufactured continuous carbon fiber reinforced polymer composites. Int. J. Adv. Manuf. Technol. 2021, 117, 1077–1089. [Google Scholar] [CrossRef]
- Lesage, P.; Dembinski, L.; Lachat, R.; Roth, S. Mechanical characterization of 3D printed samples under vibration: Effect of printing orientation and comparison with subtractive manufacturing. Results Eng. 2022, 13, 100372. [Google Scholar] [CrossRef]
- Jasiński, J.; Oleś, S.; Tokarczyk, D.; Pluta, M. On the Audibility of Electric Guitar Tonewood. Arch. Acoust. 2021, 46, 571–578. [Google Scholar] [CrossRef]
- Bilbao, S.; Desvages, C.; Ducceschi, M.; Hamilton, B.; Harrison-Harsley, R.; Torin, A.; Webb, C. Physical Modeling, Algorithms, and Sound Synthesis: The NESS Project. Comput. Music J. 2020, 43, 15–30. [Google Scholar] [CrossRef]
- Wolfe, J.; Tomlinson, V.; Schaupp, K. The immersive guitar project: Imagining possibilities for enriching audience experience through architectural innovation. Leonardo 2021, 54, 446–447. [Google Scholar] [CrossRef]
- Kaselouris, E.; Bakarezos, M.; Tatarakis, M.; Papadogiannis, N.A.; Dimitriou, V. A Review of Finite Element Studies in String Musical Instruments. Acoustics 2022, 4, 183–202. [Google Scholar] [CrossRef]
- Elejabarrieta, M.J.; Ezcurra, A.; Santamaría, C. Coupled modes of the resonance box of the guitar. J. Acoust. Soc. Am. 2002, 111, 2283–2292. [Google Scholar] [CrossRef] [PubMed]
- O’Gorman, D.; Furlong, D.J. Guitar Top-Plate Modelling Using Finite Element Method Techniques. AES Conv. 1996, 1, 4398. [Google Scholar]
- Elejabarrieta, M.J.; Ezcurra, A.; Santamarı’a, C. Air cavity modes in the resonance box of the guitar: The effect of the sound hole. J. Sound Vib. 2002, 252, 584–590. [Google Scholar] [CrossRef]
- Beattie, N.; Bock, N.; Anderson, T.; Edgeworth, T.; Kloss, T.; Swanson, J. Effects of Build Orientation on Mechanical Properties of Fused Deposition Modeling Parts. J. Mater. Eng. Perform. 2021, 30, 5059–5065. [Google Scholar] [CrossRef]
- Kumar, A.; Jaiswal, H.; Jain, R.; Patil, P.P. Free vibration and material mechanical properties influence based frequency and mode shape analysis of transmission gearbox casing. Procedia Eng. 2014, 97, 1097–1106. [Google Scholar] [CrossRef]
- Yao, T.; Deng, Z.; Zhang, K.; Li, S. A method to predict the ultimate tensile strength of 3D printing polylactic acid (PLA) materials with different printing orientations. Compos. Part B Eng. 2019, 163, 393–402. [Google Scholar] [CrossRef]
- ISO 9001; Quality Management Systems. ISO: Geneva, Switzerland, 2023.
- Micro Commercial Components; Unit B Simi Valley. Certificate of RoHS Compliance; Micro Commercial Components: Simi Valley, CA, USA, 2015; p. 2355. [Google Scholar]
- Suárez, L.; Espinosa, M.d.M. Assessment on the use of additive manufacturing technologies for acoustic applications. Int. J. Adv. Manuf. Technol. 2020, 109, 2691–2705. [Google Scholar] [CrossRef]
- Fadhil, T.; Farhad, A.; Othman, M.; Basil, H. Influence of Layer Thickness on Compression Property of 3D-Printed PLA. Al-Muhandis J. 2017, 154, 1–10. [Google Scholar]
- Jansson, E.V.; Akademien, K.M.; Nämnden, M. Function, Construction, and Quality of the Guitar: Papers Given at a Seminar Organized by the Committee for the Acoustics of Music; R. Swedish Acad. Music: Stockholm, Sweden, 1983; 109p. [Google Scholar]
- Stanciu, M.D.; Curtu, I.; Lica, D.; Rosca, I.C.; Grimberg, R. Aspects Regarding the Resonance Frequencies of Guitar Bodies with Different Strutting Systems. In Proceedings of the 5th International Conference EURO Mini Conference “Knowledge-Based Technologies and OR Methodologies for Strategic Decisions of Sustainable Development” KORSD-2009, Vilnius, Lithuania, 30 September–3 October 2009; pp. 415–420. [Google Scholar]
- eSUN, eSUN PLA+ Technical Data Sheet, 2021, 3–4. Available online: https://www.esun3d.com/uploads/eSUN_PLA+-Filament_TDS_V4.0.pdf (accessed on 5 June 2024).
- Rau, M.; Abel, J.S.; James, D.; Smith, J.O. Electric-to-acoustic pickup processing for string instruments: An experimental study of the guitar with a hexaphonic pickup. J. Acoust. Soc. Am. 2021, 150, 385–397. [Google Scholar] [CrossRef] [PubMed]
- Jansson, E. Acoustics for Violin and Guitar Makers. Science 2002, 6. Available online: http://www.speech.kth.se/music/acviguit4/ (accessed on 1 June 2024).
- Ailinei, I.I.; Galațanu, S.V.; Marșavina, L. Influence of Deposition Direction on Vibration Characteristics of 3D Printed Abs Test Specimens. Struct. Integr. Life 2022, 22, 25–28. [Google Scholar]
- Duerinck, T.; Skrodzka, E.; Linde, B.B. Modal analysis of a trapezoidal violin built after the description of félix savart. Arch. Acoust. 2014, 39, 623–628. [Google Scholar] [CrossRef]
- Coaldrake, A.K. A finite element model of the Japanese koto constructed from computed tomography scans. J. Acoust. Soc. Am. 2020, 148, 3153–3170. [Google Scholar] [CrossRef]
- Woodhouse, J. Acoustics of the banjo: Theoretical and numerical modelling. Acta Acust. 2021, 5, 16. [Google Scholar] [CrossRef]
- Ewins, D.J. Modal Testing: Theory and Practice; Research Studies Press: Letchworth, UK; Wiley: New York, NY, USA, 1984; Available online: https://worldcat.org/title/10778609 (accessed on 12 May 2024).
- Carvalho, C.; Baltar, J.P. Picanço Baltar, Simulation of Uniaxial Tensile Test through of Finite Element Method. In Proceedings of the 24th ABCM International Congress of Mechanical Engineering, Curitiba, Brazil, 3–8 December 2017; pp. 2–9. [Google Scholar] [CrossRef]
- Zvoníček, T.; Vašina, M.; Pata, V.; Smolka, P. Three-Dimensional Printing Process for Musical Instruments: Sound Reflection Properties of Polymeric Materials for Enhanced Acoustical Performance. Polymers 2023, 15, 2025. [Google Scholar] [CrossRef] [PubMed]
- Matei, S.; Pop, M.A.; Zaharia, S.-M.; Coșniță, M.; Croitoru, C.; Spîrchez, C.; Cazan, C. Investigation into the Acoustic Properties of Polylactic Acid Sound-Absorbing Panels Manufactured by 3D Printing Technology: The Influence of Nozzle Diameters and Internal Configurations. Materials 2024, 17, 580. [Google Scholar] [CrossRef] [PubMed]


| Angles | ||||
|---|---|---|---|---|
| 0° | 90° | +45° | −45° | ±45° |
 |  |  |  |  |
| Acceleration | 0.1~199.9 m/s2 |
| Velocity | 0.1~199.9 mm/s |
| Displacement | 0.001~1.999 mm |
| Accuracy vibration displacement | 0.01~0.02 mm, ≤±10%, ≥0.02 mm, ≤±5% |
| Accuracy vibration speed | 0~2.0 mm/s, ≤±10%, ≥2.0 mm/s, ≤±5% |
| Accuracy vibration acceleration | 0~2.0 mm/s2, ≤±10%, ≥2.0 mm/s2, ≤±5% |
| High frequency | 1 KHz~15 KHz (HI) |
| Low frequency | 20 Hz~1 KHz (LO) |
| Point | |||||
|---|---|---|---|---|---|
| Mode | 1 | 2 | 3 | 4 | 5 |
| 1 | 0.016 | 0.051 | 0.019 | 0.052 | 0.043 |
| 2 | 0.011 | 0.031 | 0.009 | 0.014 | 0.023 |
| 3 | 0.021 | 0.314 | 0.017 | 0.005 | 0.017 |
| 4 | 0.027 | 0.140 | 0.013 | 0.012 | 0.025 |
| 5 | 0.010 | 0.012 | 0.014 | 0.015 | 0.002 |
| Point 1 the Whole Sample | |||||
|---|---|---|---|---|---|
| Source | SS | df | MS | F | Prob > F |
| Columns | 0.04762 | 4 | 0.01191 | 34.61 | 9.99967 × 10−09 |
| Error | 0.00688 | 20 | 0.00034 | ||
| Total | 0.0545 | 24 | |||
| Point 2 | |||||
| Columns | 0.052 | 4 | 0.013 | 0.53 | 0.7137 |
| Error | 0.48864 | 20 | 0.02443 | ||
| Total | 0.54063 | 24 | |||
| Point 3 | |||||
| Columns | 0.03654 | 4 | 0.00914 | 39.39 | 3.24871 × 10−09 |
| Error | 0.00464 | 20 | 0.00023 | ||
| Total | 0.04118 | 24 | |||
| Point 4 | |||||
| Columns | 0.02059 | 4 | 0.00515 | 7.6 | 0.0007 |
| Error | 0.01354 | 20 | 0.00068 | ||
| Total | 0.03412 | 24 | |||
| Point 5 | |||||
| Columns | 0.04328 | 4 | 0.01082 | 16.02 | 5.00595 × 10−06 |
| Error | 0.01351 | 20 | 0.00068 | ||
| Total | 0.05679 | 24 | |||
| Point 1 No 0° Sample | |||||
|---|---|---|---|---|---|
| Source | SS | df | MS | F | Prob > F |
| Columns | 0.03393 | 4 | 0.00848 | 47.12 | 2.55311 × 10−08 |
| Error | 0.0027 | 15 | 0.00018 | ||
| Total | 0.03663 | 19 | |||
| Point 2 | |||||
| Columns | 0.0344 | 4 | 0.0086 | 6.25 | 0.0036 |
| Error | 0.02063 | 15 | 0.00138 | ||
| Total | 0.05502 | 19 | |||
| Point 3 | |||||
| Columns | 0.02915 | 4 | 0.00729 | 32.07 | 3.44303 × 10−07 |
| Error | 0.00341 | 15 | 0.00023 | ||
| Total | 0.03256 | 19 | |||
| Point 4 | |||||
| Columns | 0.01214 | 4 | 0.00304 | 4.97 | 0.0094 |
| Error | 0.00917 | 15 | 0.00061 | ||
| Total | 0.02131 | 19 | |||
| Point 5 | |||||
| Columns | 0.03225 | 4 | 0.00806 | 15.52 | 3.28682 × 10−05 |
| Error | 0.0078 | 15 | 0.00052 | ||
| Total | 0.04005 | 19 | |||
| Modes | ||||||||||||
|---|---|---|---|---|---|---|---|---|---|---|---|---|
| Point | PD | M2 vs. M4 | M5 | M2 vs. M4 | M5 | M2 vs. M4 | M5 | M2 vs. M4 | M5 | M2 vs. M4 | M5 | |
| 1 | 0° | FEM | 0.159 | 0.082 | 0.159 | 0.082 | 0.159 | 0.082 | 0.159 | 0.082 | 0.159 | 0.082 |
| ED | 0.1 | 0.074 | 0.166 | 0.102 | 0.157 | 0.077 | 0.120 | 0.087 | 0.138 | 0.086 | ||
| RE | −59.6 | −12.0 | 4.2 | 18.7 | −1.3 | −6.9 | −32.4 | 5.3 | −15.6 | 3.6 | ||
| 2 | 90° | FEM | 0.017 | 0.070 | 0.017 | 0.070 | 0.017 | 0.070 | 0.017 | 0.070 | 0.017 | 0.070 |
| ED | 0.381 | 0.055 | 0.159 | 0.046 | 0.044 | 0.079 | 0.062 | 0.063 | 0.071 | 0.071 | ||
| RE | 95.4 | −27.6 | 88.9 | −52.3 | 60.2 | 10.9 | 71.5 | −11.5 | 75.1 | 1.0 | ||
| 3 | +45° | FEM | 0.021 | 0.070 | 0.021 | 0.070 | 0.021 | 0.070 | 0.021 | 0.070 | 0.021 | 0.070 |
| ED | 0.083 | 0.05 | 0.074 | 0.08 | 0.052 | 0.086 | 0.056 | 0.064 | 0.071 | 0.069 | ||
| RE | 74.1 | −40.0 | 70.8 | 12.5 | 58.4 | 18.6 | 61.4 | −9.4 | 69.5 | −1.5 | ||
| 4 | −45° | FEM | 0.113 | 0.066 | 0.113 | 0.066 | 0.113 | 0.066 | 0.113 | 0.066 | 0.113 | 0.066 |
| ED | 0.140 | 0.095 | 0.128 | 0.064 | 0.128 | 0.093 | 0.132 | 0.083 | 0.106 | 0.066 | ||
| RE | 18.9 | 30.0 | 11.0 | −3.9 | 11.0 | 28.8 | 13.7 | 19.9 | −7.4 | −0.8 | ||
| 5 | ±45° | FEM | 0.017 | 0.070 | 0.017 | 0.070 | 0.017 | 0.070 | 0.017 | 0.070 | 0.017 | 0.070 |
| ED | 0.112 | 0.078 | 0.056 | 0.073 | 0.070 | 0.075 | 0.045 | 0.072 | 0.068 | 0.078 | ||
| RE | 84.2 | 9.2 | 68.6 | 3.0 | 74.9 | 6.2 | 60.7 | 1.7 | 74.1 | 9.2 | ||
Disclaimer/Publisher’s Note: The statements, opinions and data contained in all publications are solely those of the individual author(s) and contributor(s) and not of MDPI and/or the editor(s). MDPI and/or the editor(s) disclaim responsibility for any injury to people or property resulting from any ideas, methods, instructions or products referred to in the content. |
© 2024 by the authors. Licensee MDPI, Basel, Switzerland. This article is an open access article distributed under the terms and conditions of the Creative Commons Attribution (CC BY) license (https://creativecommons.org/licenses/by/4.0/).
Share and Cite
Burgos-Pintos, Á.; Fernández-Zacarías, F.; Mayuet, P.F.; Hernández-Molina, R.; Rodríguez-Parada, L. An Analysis of the Displacements in 3D-Printed PLA Acoustic Guitars. Polymers 2024, 16, 2108. https://doi.org/10.3390/polym16152108
Burgos-Pintos Á, Fernández-Zacarías F, Mayuet PF, Hernández-Molina R, Rodríguez-Parada L. An Analysis of the Displacements in 3D-Printed PLA Acoustic Guitars. Polymers. 2024; 16(15):2108. https://doi.org/10.3390/polym16152108
Chicago/Turabian StyleBurgos-Pintos, Álvaro, Francisco Fernández-Zacarías, Pedro F. Mayuet, Ricardo Hernández-Molina, and Lucía Rodríguez-Parada. 2024. "An Analysis of the Displacements in 3D-Printed PLA Acoustic Guitars" Polymers 16, no. 15: 2108. https://doi.org/10.3390/polym16152108
APA StyleBurgos-Pintos, Á., Fernández-Zacarías, F., Mayuet, P. F., Hernández-Molina, R., & Rodríguez-Parada, L. (2024). An Analysis of the Displacements in 3D-Printed PLA Acoustic Guitars. Polymers, 16(15), 2108. https://doi.org/10.3390/polym16152108