Abstract
The comprehensive performance of rubber products could be significantly improved by the addition of functional fillers. To improve research efficiency and decrease the experimental cost, the mechanical and thermal properties of carbon-fiber-reinforced rubber were investigated using finite element simulations and theoretical modeling. The simplified micromechanical model was constructed through the repeatable unit cell with periodic boundary conditions, and the corresponding theoretical models were built based on the rule of mixture (ROM), which can be treated as the mutual verification. The simulation results suggest that, in addition to the fiber volume fraction Vfc increasing from 10% to 70%, the longitudinal Young’s modulus, transversal Young’s modulus, in-plane shear modulus, longitudinal thermal expansion coefficient, and transversal thermal expansion coefficient changed from 2.31 × 10¹⁰ Pa to 16.09 × 10¹⁰ Pa, from 0.54 × 10⁷ Pa to 2.59 × 10⁷ Pa, from 1.66 × 10⁶ Pa to 10.11 × 10⁶ Pa, from −4.98 × 10⁻⁷ K−1 to −5.89 × 10⁻⁷ K−1, and from 5.72 × 10⁻⁴ K−1 to 1.66 × 10⁻⁴ K−1, respectively. The mechanism by which Vfc influences the properties of carbon-fiber-reinforced rubber was revealed through the distribution of Von Mises stress. This research will contribute to improving the performance of carbon-fiber-reinforced rubber and promote its application.
1. Introduction
Rubber products have been widely applied in many fields [1], and their properties are improved by the addition of certain fillers [2,3,4,5,6,7,8,9,10]. Alam et al. [2] improved the mechanical and energy-harvesting abilities of low-cost natural rubber composites made of stearic-acid-modified diatomaceous earth (mDE) and carbon nanotubes (CNTs). The thermal and mechanical performance of carbon-based rubber nanocomposites was reviewed by Shahamatifard et al. [4], whose assessment included the different fillers of carbon black, carbon nanotubes, and graphene derivatives. Sekar et al. [6] selected biobased hydrothermally treated (HTT) lignin as a potential functional filler for a solution styrene butadiene and butadiene rubber blend, which could achieve the complex reinforcement phenomena of using a silane as coupling agent for hydrothermally treated lignin. Wang et al. [8] proved that the strength of the filler–rubber interfacial interaction gradually increased with the addition of hydroxyl groups for similar dispersion states, which would assist with the design of more desirable silica structures with a highly branched structure and multiple hydroxyl groups as an ideal reinforcing agent. Tagliaro et al. [10] studied the possible synergistic self-assembly of nanosilica and sepiolite in the generation of a cooperative hybrid filler network in rubber-based nanocomposites, which was able to enhance the properties of the rubber materials. These studies [2,3,4,5,6,7,8,9,10] improve the performance of rubber products and promote their practical applications.
Among functional fillers, advanced fiber materials, such as aramid fibers [11,12,13,14], carbon fibers [15,16,17,18], and polyethylene fibers [19,20,21,22], can significantly improve the properties of rubber products due to their excellent performance. Inspired by mussel adhesion proteins and mimicking adhesive molecules, a new environmentally friendly dipping system was developed by Zhang et al. [11,12], which was able to improve the interfacial adhesion between aramid fiber and rubber. Yin et al. [13,14] investigated the fatigue behaviors of aramid fiber/styrene butadiene rubber filled with carbon black in terms of changes in the fatigue strain; this method effectively suppressed the propagation of fatigue cracks due to the use of fibers with a well-bonded flexible interface layer. Mei et al. [15] utilized carbon fibers, graphene, and carbon nanotubes to prepare a carbon-based nano-conductive silicone rubber via solution blending; it exhibited good properties and great application prospects. Akbolat et al. studied the influences of hybrid toughening—via core–shell rubber particles and non-woven thermoplastic veils—on the delamination resistance, crack migration, and R-curve behaviors in carbon fiber/epoxy laminates [17]; this approach made it harder for potential cracks to grow. To improve interfacial adhesion to the rubber matrix, a lower-cost surface modification strategy with ultrahigh-molecular-weight polyethylene fibers was proposed by Fang et al. [19,20]; they replaced expensive dopamine with the two-component system of catechol/tetraethylenepentamine, followed by deposits of nano zinc oxide. He et al. [21] used ultra-high-molecular-weight polyethylene short fibers with a diameter of 20 μm and a length of 2 cm as rubber fillers, which helped to improve the tear resistance of industrially prepared rubber conveyor belts.
In studying the overall performance of fiber-reinforced rubber, many detection methods have been utilized to characterize its various properties, such as its mechanical properties [23,24,25], thermal properties [26,27,28,29], sound insulation properties [30,31], aging resistance [32,33], and sealing properties [34,35]. Mechanical tests of unidirectional fiber composites and quasi-isotropic short-fiber composites for human-hair-reinforced nitrile butadiene rubbers were performed by Statnik et al. [23] under tension using a miniature universal testing machine. Chao et al. [24] examined the tensile and flexural properties of jute-fiber-reinforced polymers using ASTM D3039 [36] and ASTM D7264 [37] standards, and the influences of the end condition, the thickness ratio of the core to the face layer, and the thickness ratio of the face layer to the core on the dynamic properties of sandwich panels were presented. A carboxyl-terminated butadiene acrylonitrile liquid rubber, toughened with silicon carbide and a stitched E-glass fiber-reinforced epoxy composite, was prepared by Velmurugan et al. [27]; it was further tested for its relative effect on the material’s thermal, wear, visco-elastic, and fatigue behaviors. Mahendra et al. [29] estimated the reinforcing effect of nanocrystalline cellulose and nanofiber cellulose and its effect as a compatibilizing agent of a polypropylene/cyclic natural rubber blend in terms of its mechanical and thermal properties. El-Wakil et al. [30] showed that a styrene–butadiene rubber composite containing 10 phr of maleates of Eichhornia crassipes fiber had a sound absorption amplitude equal to 0.9 at a frequency of 400 Hz. Miedzianowska et al. [32] researched the effect of different ratios of mixed polymers and the amount of filler on the material’s tensile strength and elongation at break, resistance to thermo-oxidative aging, tear resistance, hardness, barrier and damping properties, and flammability. The mechanical behaviors of a non-orthogonal reticulated fabric-reinforced rubber composite and its complex fabric rubber seal were investigated by Xu et al. [34], and the macroscopic behaviors of the complex fabric rubber seal were studied through experiments and a numerical simulation, which demonstrated the suitability of the proposed macro-mesoscopic characterization approach. The characterizations of the materials’ various abilities provide a scientific basis for the promotion of the practical applications of all kinds of rubber products.
To improve research efficiency and reduce the test costs, finite element simulations have been used to analyze the properties of rubber products [38,39,40,41,42,43,44,45]. Yang and Lou [39] investigated the effects of oxidative aging on the static and dynamic properties of nitrile rubber at the molecular scale using a molecular dynamics simulation, which provided insights into the effect of molecular changes due to oxidative aging on the structural and dynamic properties of rubber materials at the molecular level. Singaravel et al. [41] reviewed the experimental and molecular dynamics simulations of the mechanical properties of carbon-nanotube-reinforced rubber-based composites, presenting the key mechanical properties of these nanocomposites. A molecular dynamics simulation and dissipative particle dynamics simulation were carried out by Ma et al. [43] to predict the compatibility of natural rubber and chloroprene rubber in view of Flory–Huggins parameters. Sodeifian et al. [44] studied the molecular dynamics of epoxy/clay nanocomposites, proving that the chain relaxation process was slowed by polymer–particle interactions. The effect of the impact angle on the resistance of a foamed silicone rubber sandwich structure against low-velocity impacts was studied by Zhang et al. [45] using the finite element method.
In this study, the mechanical and thermal properties of carbon-fiber-reinforced rubber were investigated using finite element simulations; we aimed to study the influence rule and action mechanism. First, a simplified micromechanical model of carbon-fiber-reinforced rubber was constructed using a repeatable unit cell (RUC) with the periodic boundary condition, ensuring high simulation accuracy while improving the simulation efficiency. Second, the mechanical and thermal properties of carbon-fiber-reinforced rubber were investigated in the fiber volume fraction range of 10–70% with the interval of 5%; the investigated properties included the longitudinal Young’s modulus, the transversal Young’s modulus, the in-plane shear modulus, the longitudinal thermal expansion coefficient, and the transversal thermal expansion coefficient. Third, the corresponding theoretical mechanical and thermal properties were derived using various rule of mixture (ROM) models, such as the Voigt–Reuss model [46], the modified Voigt–Reuss model [47], the Chamis model [48], the Halpin–Tsai model [49], and the Halpin–Tsai–Nielsen model [50], which enabled us to conduct a contrastive analysis with the finite simulation results. Fourth, the influencing mechanism of the fiber volume fraction in relation to the properties of the carbon-fiber-reinforced rubber was revealed by examining the distribution of stress with various load types; this offered a visual explanation of the reasons for differences in properties with the various parameters. The abbreviations used in this study and their corresponding full titles are summarized in the Table A1 (Appendix A). This research method is not only applicable to the carbon-fiber-reinforced rubber examined in this study but also can be used to study the properties of other fillers in reinforced rubber products; it can also provide an effective reference for the analysis of other polymer composites.
2. Simplified Micromechanical Model of Carbon-Fiber-Reinforced Rubber
A simplified micromechanical model for carbon-fiber-reinforced rubber was built based on the basic theory of solid mechanics, as shown in Figure 1, which was the foundation for our study of the material’s mechanical and thermal properties. In the geometric model in Figure 1a, the central pink cylinder represents the carbon fiber, and the surrounding green region represents the rubber, which could expand in each direction with the periodic boundary condition. The length of the side for this cubic unit cell was set as 1, and the volume fraction of the carbon fiber Vfc and the corresponding fraction of rubber Vfr (Vfr = 1 − Vfc) could be adjusted by changing the diameter of the carbon fiber dc. Taking into consideration normal carbon-fiber-reinforced rubber, the research scope for Vfc was set to 10% to 70% with the interval of 5%; it was selected as the independent variable in this research. Afterward, the model was gridded and meshed, as shown in Figure 1b. The maximum cell size, minimum cell size, maximum cell-growth rate, curvature factor, and narrow region resolution were set to 2 mm, 0.02 mm, 1.3, 0.2, and 1, respectively. A free triangular mesh was utilized in this research, and the whole domain was constructed by the swept part. In terms of the cell periodicity for the mechanical properties, the boundary condition was set as the mean strain and the computed average attribute was set to the standard elastic matrix for each boundary pair. Homoplastically, in terms of the cell periodicity for thermal properties, the boundary condition was set as free expansion, and the computed average attribute was selected as the thermal expansion coefficient for each boundary pair. Using these methods, the stress envelope of the RUC was obtained, as shown in Figure 1c.
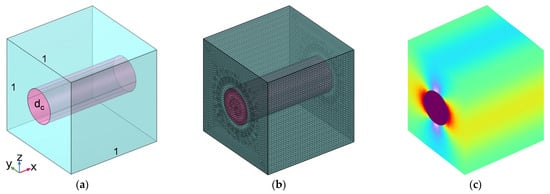
Figure 1.
Simplified micromechanical model for carbon-fiber-reinforced rubber. (a) Geometric model; (b) gridded and meshed model; and (c) stress envelope.
The carbon fiber was treated as an orthotropic material, and the rubber was considered to be an isotropic material. Thus, the selected parameters for the carbon fiber and for the rubber are summarized in Table 1 and Table 2, respectively. The symbols of Exc, Eyc, and Ezc represent the Young’s modulus of the carbon fiber within the x-axis direction, the y-axis direction, and the z-axis direction, respectively, while Gxyc, Gyzc, and Gxzc represent the shear modulus in the x–y oblique plane, the y–z oblique plane, and the x–z oblique plane, respectively. Accordingly, the symbols of υxyc, υyzc, and υxzc represent the Poisson’s ratio in the x-axis direction, the y-axis direction, and the z-axis direction, respectively, while αxyc, αyzc, and αxzc represent the thermal expansion coefficient in the x-axis direction, y-axis direction, and z-axis direction, respectively. The Young’s modulus of the carbon fiber was significantly larger than that of the rubber. Therefore, the carbon fiber was able to reinforce the mechanical and thermal properties of the base material. Meanwhile, various kinds of loads for the cell periodicity were investigated in this study, as shown in Table 3. According to the selected parameters shown in Table 1, Table 2, and Table 3, the longitudinal Young’s modulus, transversal Young’s modulus, in-plane shear modulus, longitudinal thermal expansion coefficient, and transversal thermal expansion coefficient could be obtained using the simplified micromechanical model shown in Figure 1 based on the solid mechanics theory.

Table 1.
Selected parameters for the carbon fiber in the simplified micromechanical model.
Table 2.
Selected parameters for rubber in the simplified micromechanical model.
Table 3.
Various kinds of loads for cell periodicity in the simplified micromechanical model.
3. Theoretical ROM Models for Carbon-Fiber-Reinforced Rubber
The theoretical mechanical and thermal properties for carbon-fiber-reinforced rubber can be derived using various ROM models. Thus, the Voigt–Reuss model [46], modified Voigt–Reuss model [47], Chamis model [48], Halpin–Tsai model [49], and Halpin–Tsai–Nielsen model [50] were used in this study; these can be considered a mode of analysis that contrasts with the simulation results.
3.1. Young’s Modulus
The Young’s modulus E can be derived using the Voigt–Reuss model [46], modified Voigt–Reuss model [47], Chamis model [48], Halpin–Tsai model [49], and Halpin–Tsai–Nielsen model [50]. The computational formulas are as follows.
According the Voigt–Reuss model [46], the Young’s modulus Exx−VR, Eyy−VR, and Ezz−VR can be obtained using Equations (1)–(3), respectively. We observed that Eyy−VR = Ezz−VR, because Eyc was equal to Ezc according to the parameters presented in Table 1:
According to the modified Voigt–Reuss model [47], the Young’s modulus Exx−MVR, Eyy−MVR, and Ezz−MVR can be obtained using Equations (4)–(6), respectively. Here, ηc and ηr were the correction factors for the carbon fiber and the rubber matrix and can be derived from Equations (7) and (8), respectively. The meanings of these symbols are the same as in Table 1 and Table 2:
Similarly, according to the Chamis model [48], the Young’s modulus Exx−C, Eyy−C, and Ezz−C values can be obtained using Equations (9)–(11), respectively:
Analogously, according to the Halpin–Tsai model [49], the Young’s modulus Exx−HT, Eyy−HT, and Ezz−HT values can be obtained using Equations (12)–(14), respectively. Here, ηxc, ηyc, and ηzc were the correction factors in the x-axis direction, y-axis direction, and z-axis direction and are obtained using Equations (15)–(17), respectively. ζxc, ζyc, and ζzc were the enhancement factors in the x-axis direction, y-axis direction, and z-axis direction, respectively, and their values were set to 2 for normal conditions in this study:
Similarly, according to the Halpin–Tsai–Nielsen model [50], the Young’s modulus Exx−HTN, Eyy−HTN, and Ezz−HTN values can be obtained using Equations (18)–(20), respectively. Here, the values of ηxc, ηyc, ηzc, ζxc, ζyc, and ζzc were the same as those in the Halpin–Tsai model [49]. Ψ was the packing factor, which could be calculated using Equation (21). ϕmax was the maximum filling rate, and here it was set to 0.8 for normal conditions:
3.2. Shear Modulus
The shear modulus G can be derived using the Voigt–Reuss model [46], the modified Voigt–Reuss model [47], the Chamis model [48], the Halpin–Tsai model [49], and the Halpin–Tsai–Nielsen model [50]. The computational formulas are as follows.
According the Voigt–Reuss model [46], the shear modulus Gxy−VR, Gyz−VR, and Gxz−VR values can be obtained using Equations (22)–(24), respectively. We also found that Gxy−VR = Gxz−VR, because Gxyc is equal to Exzc according to the parameters shown in Table 1:
According to the modified Voigt–Reuss model [47], the shear modulus Gxy−MVR, Gyz−MVR, and Gxz−MVR values can be obtained using Equations (25)–(27), respectively. Here, ηg was the correction factor, which was set to 0.6 for normal conditions:
According to the Chamis model [48], the shear modulus values for Gxy−C, Gyz−C, and Gxz−C can be obtained using Equations (28)–(30), respectively:
Similarly, according to the Halpin–Tsai model [49], the shear modulus values for Gxy−HT, Gyz−HT, and Gxz−HT can be determined using Equations (31)–(33), respectively. Here, ηxyc, ηyzc, and ηxzc were the correction factors in the x–y oblique plane, the y–z oblique plane, and the x–z oblique plane, which can be obtained using Equations (34)–(36), respectively. ζxyc, ζyzc, and ζxzc were the enhancement factors in the x–y oblique plane, y–z oblique plane, and x–z oblique plane, respectively, and their values were set to 1 for normal conditions in this research:
Similarly, according to the Halpin–Tsai–Nielsen model [50], the shear modulus Gx−HTN, Gyz−HTN, and Gxz−HTN values can be obtained using Equations (37)–(39), respectively. Here, ηxyc, ηyzc, ηxzc, ζxyc, ζyzc, and ζxzc are the same as in Equations (34)–(36). Ψ was the packing factor, which was the same as in Equation (20), and it can also be calculated using Equation (21):
3.3. Thermal Expansion Coefficient
The thermal expansion coefficient α can be calculated using the Voigt–Reuss model [46] and the Chamis model [48]. According the Voigt–Reuss model [46], the thermal expansion coefficient αxx−VR, αyy−VR, and αzz−VR values are given by Equations (40)–(42), respectively. We found that αyy−VR = αzz−VR, because αyc is equal to αzc according to the parameters given in Table 1:
Similarly, according to the Chamis model [48], the thermal expansion coefficient αxx−C, αyy−C, and αzz−C values can be obtained using Equations (43)–(45), respectively:
3.4. Poisson’s Ratio
According to the Voigt–Reuss model [46], the modified Voigt–Reuss model [47], the Halpin–Tsai model [49], and the Halpin–Tsai–Nielsen model [50], the calculation formulas for the Poisson’s ratio υxy−VR, υyz−VR, and υxz−VR values are the same. They are given by Equations (46)–(48), respectively. In addition, for the Chamis model [48], the Poisson’s ratio υxy−VR and υxz−VR values can be obtained using Equations (46) and (48), respectively, and the υyz−VR value can be calculated according to Equation (49):
4. Results and Discussion
Equations (1)–(49) in the theoretical model show that some of these pairs of performance parameters were the same, because the rubber matrix is a homogeneous material and the carbon fiber has similar properties in the y-axis direction and the z-axis direction. Thus, taking the actual applications into account, the longitudinal Young’s modulus Exx, transversal Young’s modulus Eyy, in-plane shear modulus Gxy, longitudinal thermal expansion coefficient αxx, and transversal thermal expansion coefficient αyy were selected as the representative parameters to compare the simulation results with the theoretical data obtained using the various ROM models. This could be considered the mutual verification of the finite element simulation model and the theoretical model.
4.1. Longitudinal Young’s Modulus Exx
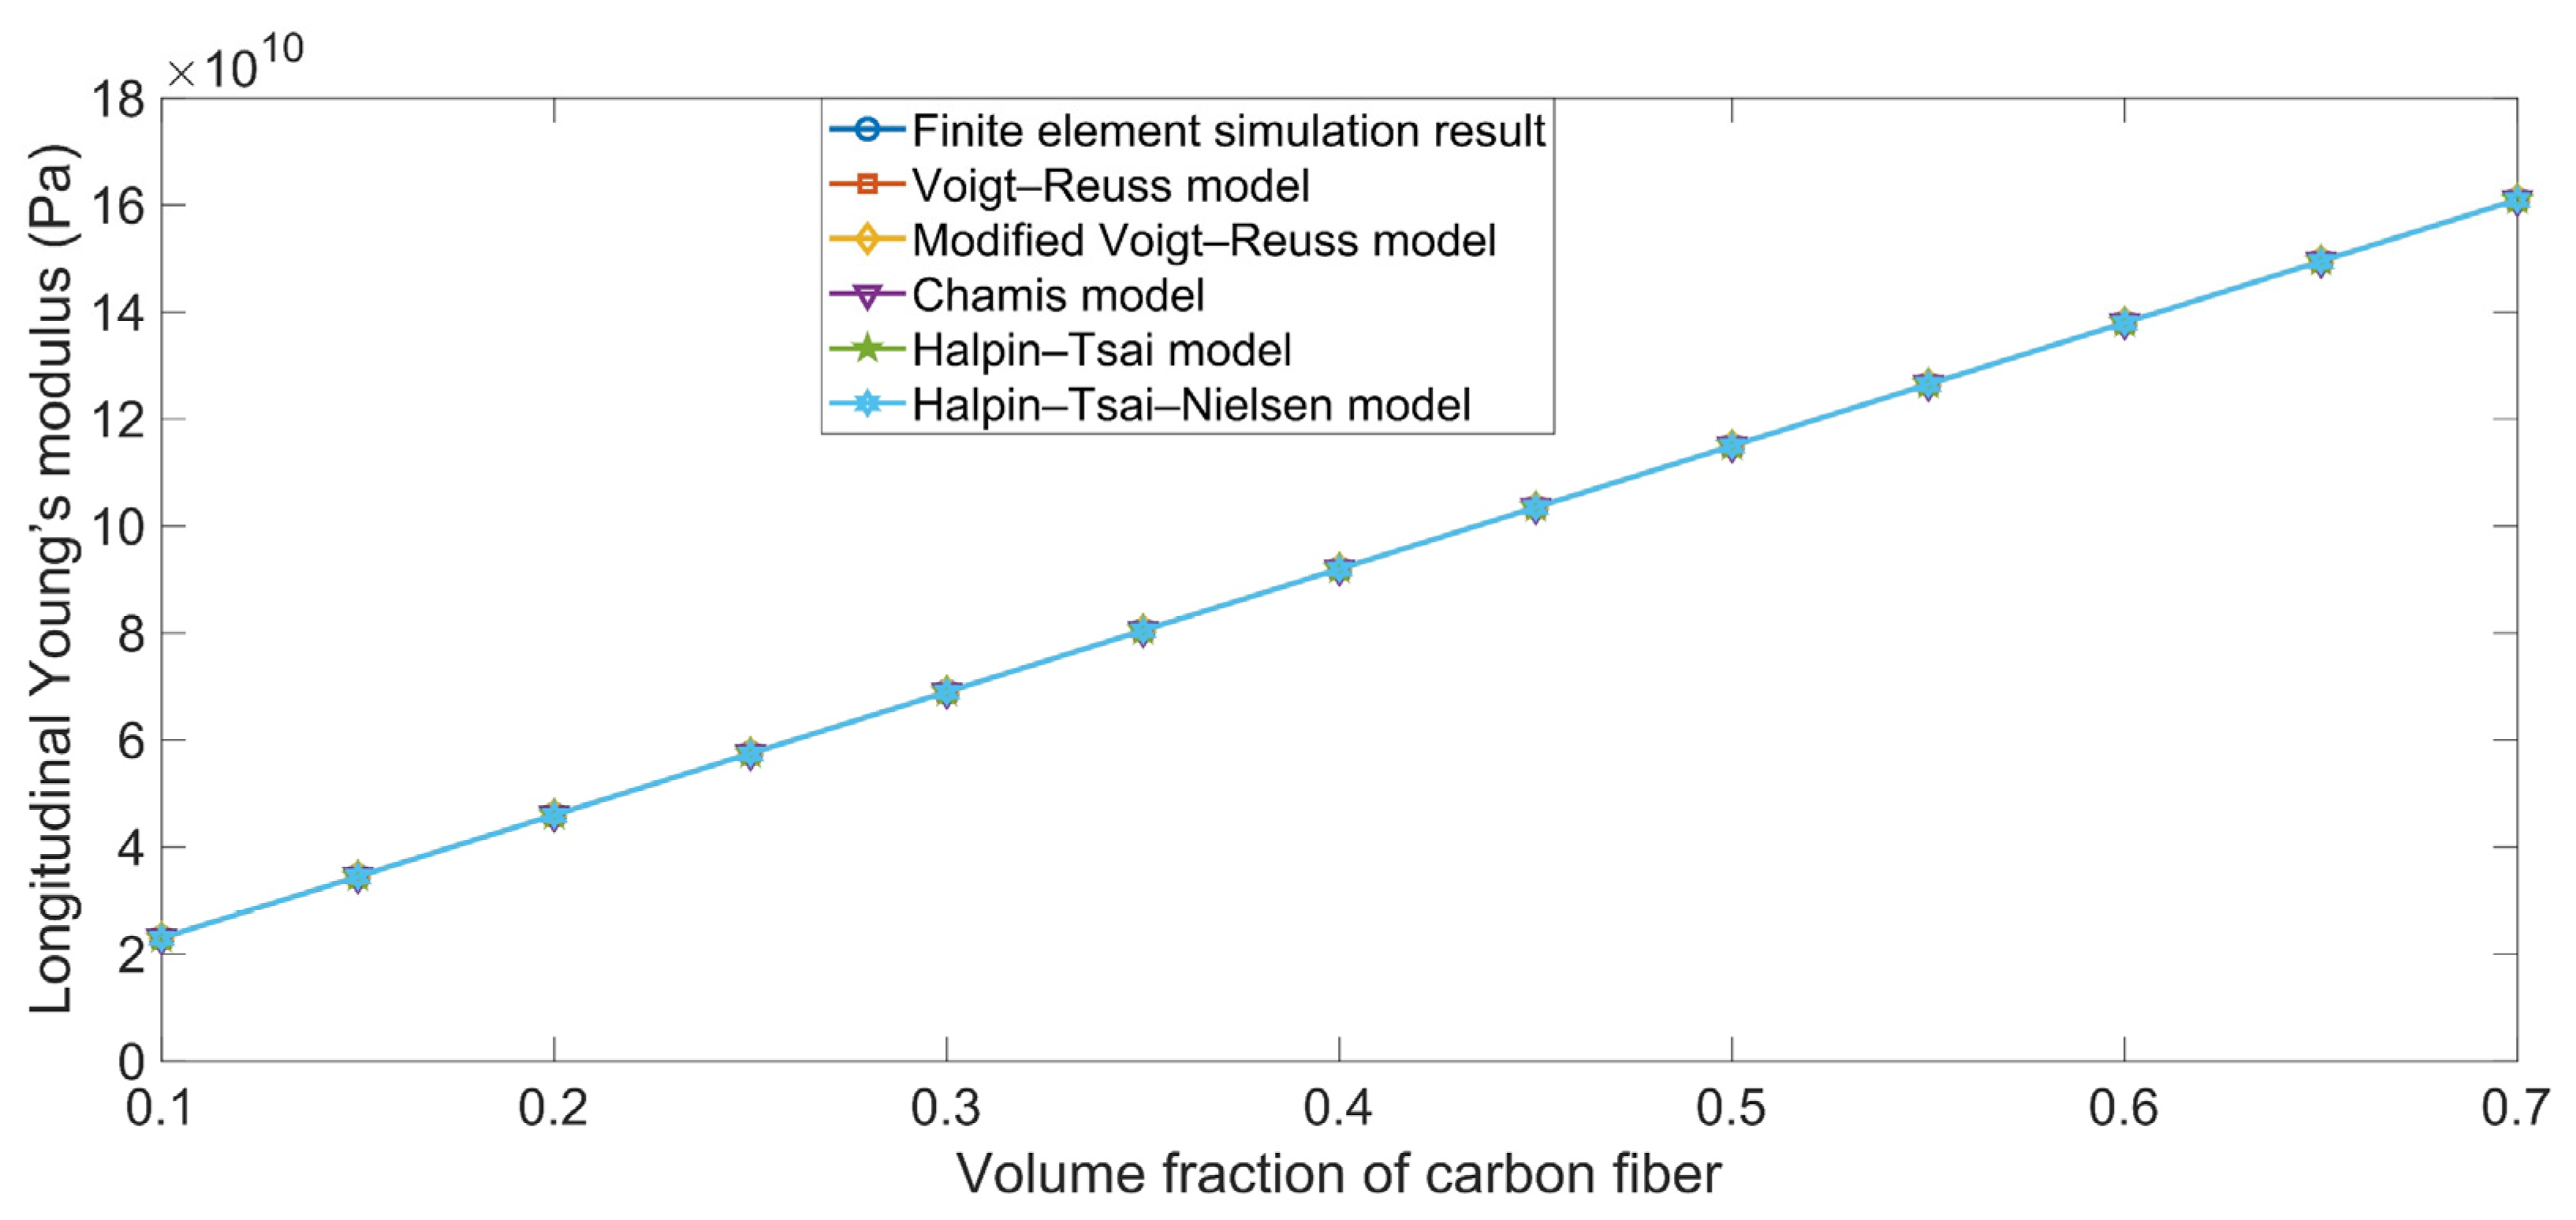
The comparisons between the simulation results and the theoretical data of the longitudinal Young’s modulus Exx are shown in Figure 2. It is clear that the longitudinal Young’s modulus Exx value obtained using the finite element simulation was completely consistent with the values determined using the various ROM models. The main reason for this phenomenon is that the Young’s modulus of the carbon fiber in the x-axis direction Exc (230 GPa) was far larger than that of the rubber matrix Er (4 MPa), meaning that the carbon fiber took most of the load. Meanwhile, the binding force between the carbon fiber and the rubber matrix was large in the x-axis direction, which indicated that the longitudinal Young’s modulus Exx was slightly smaller than that of carbon fiber itself. Furthermore, Equations (1), (4), (9), (12), and (18) suggest that there were almost no differences between the various ROM models when calculating the longitudinal Young’s modulus Exx.
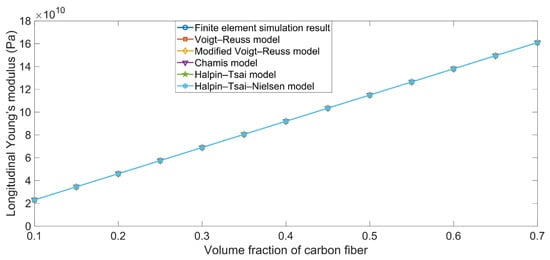
Figure 2.
Comparison between the simulation results and the theoretical data obtained using various ROM models of the longitudinal Young’s modulus Exx values.
4.2. Transversal Young’s Modulus Eyy
The comparison between the simulation results and the theoretical data for the transversal Young’s modulus Eyy are shown in Figure 3. The simulation results tended to be consistent with those of the theoretical data obtained using the various ROM models, and the deviations among the various ROM models can be determined using Equations (2), (5), (10), (13), and (19). Meanwhile, the Eyy in Figure 3 was obviously smaller than the Exx in Figure 2, because the binding force between the carbon fiber and the rubber matrix was small in the y-axis direction and the Eyy value was slightly larger than Er.
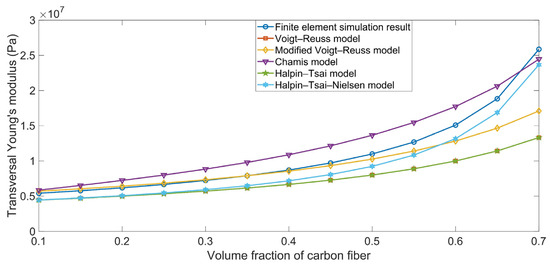
Figure 3.
Comparison between the simulation results and theoretical data obtained using various ROM models for the transversal Young’s modulus Eyy.
4.3. In-Plane Shear Modulus Gxy
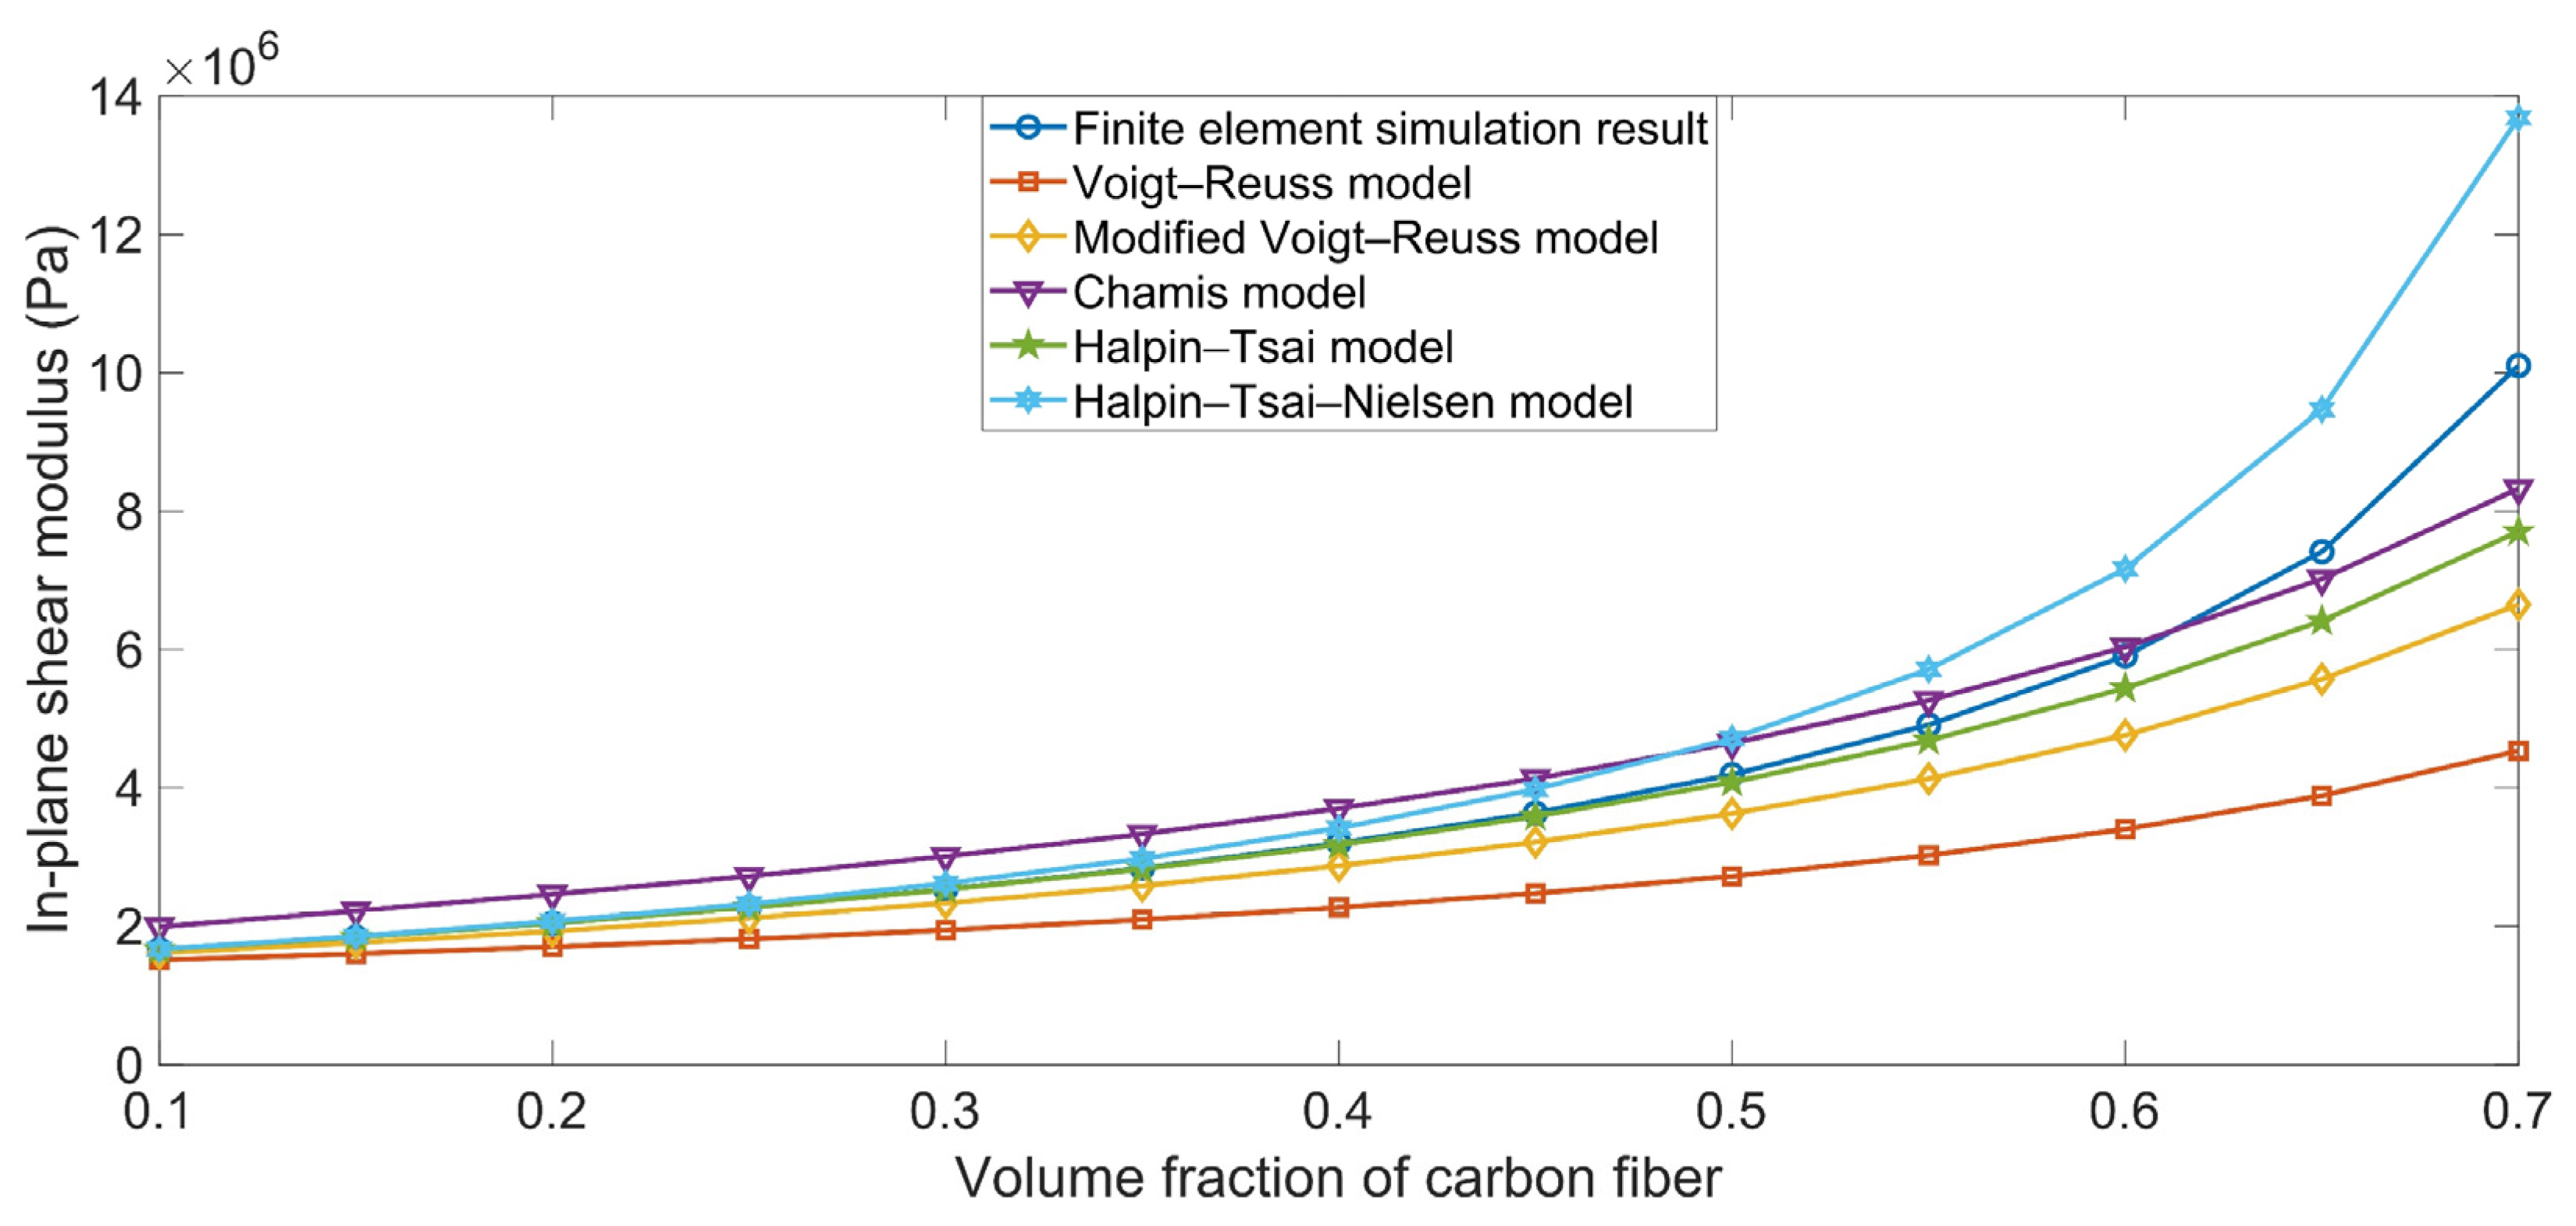
The comparison between the simulation results and the theoretical data for the in-plane shear modulus Gxy are shown in Figure 4. The theoretical data obtained using the various ROM models were derived using Equations (22), (25), (28), (31), and (37). The simulation results were consistent with the theoretical data. Meanwhile, the in-plane shear modulus Gxy ranged from 2 MPa to 10 MPa as the Vfc increased from 10% to 70%, which was slightly larger than the shear modulus of rubber matrix Gr (1.36 GPa); this is because the binding force between the carbon fiber and the rubber matrix was small in the x–y oblique plane. Although the shear modulus of the carbon fiber in x–y oblique plane Gxyc was large, the brittle binding force between the matrix and the reinforcement made the composite material more susceptible to damage.
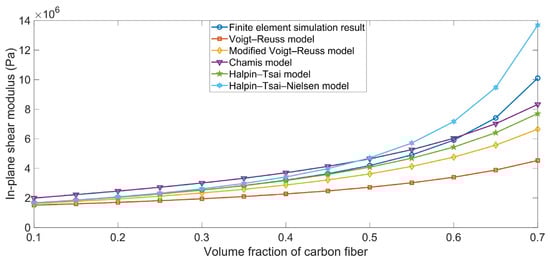
Figure 4.
Comparison between simulation results and theoretical data obtained using the various ROM models for the in-plane shear modulus Gxy.
4.4. Longitudinal Thermal Expansion Coefficient αxx
The comparison between the simulation results and the theoretical data for the longitudinal thermal expansion coefficient αxx are shown in Figure 5. The αxx had a negative value, and it decreased as the Vfc increased from 10% to 70%; this is because the longitudinal thermal expansion coefficient of the carbon fiber αxc was −0.8 × 10⁻⁶ K−1. The theoretical data agreed well with the simulation results, which could be considered to constitute mutual verification. The theoretical data obtained using the Voigt–Reuss model were identical to those obtained using the Chamis model, because their computational formulas were same; this is indicated by Equations (40) and (43).
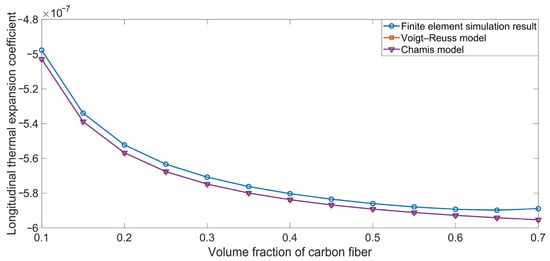
Figure 5.
Comparison between the simulation results and the theoretical data obtained using the various ROM models for the longitudinal thermal expansion coefficient αxx.
4.5. Transversal Thermal Expansion Coefficient αyy
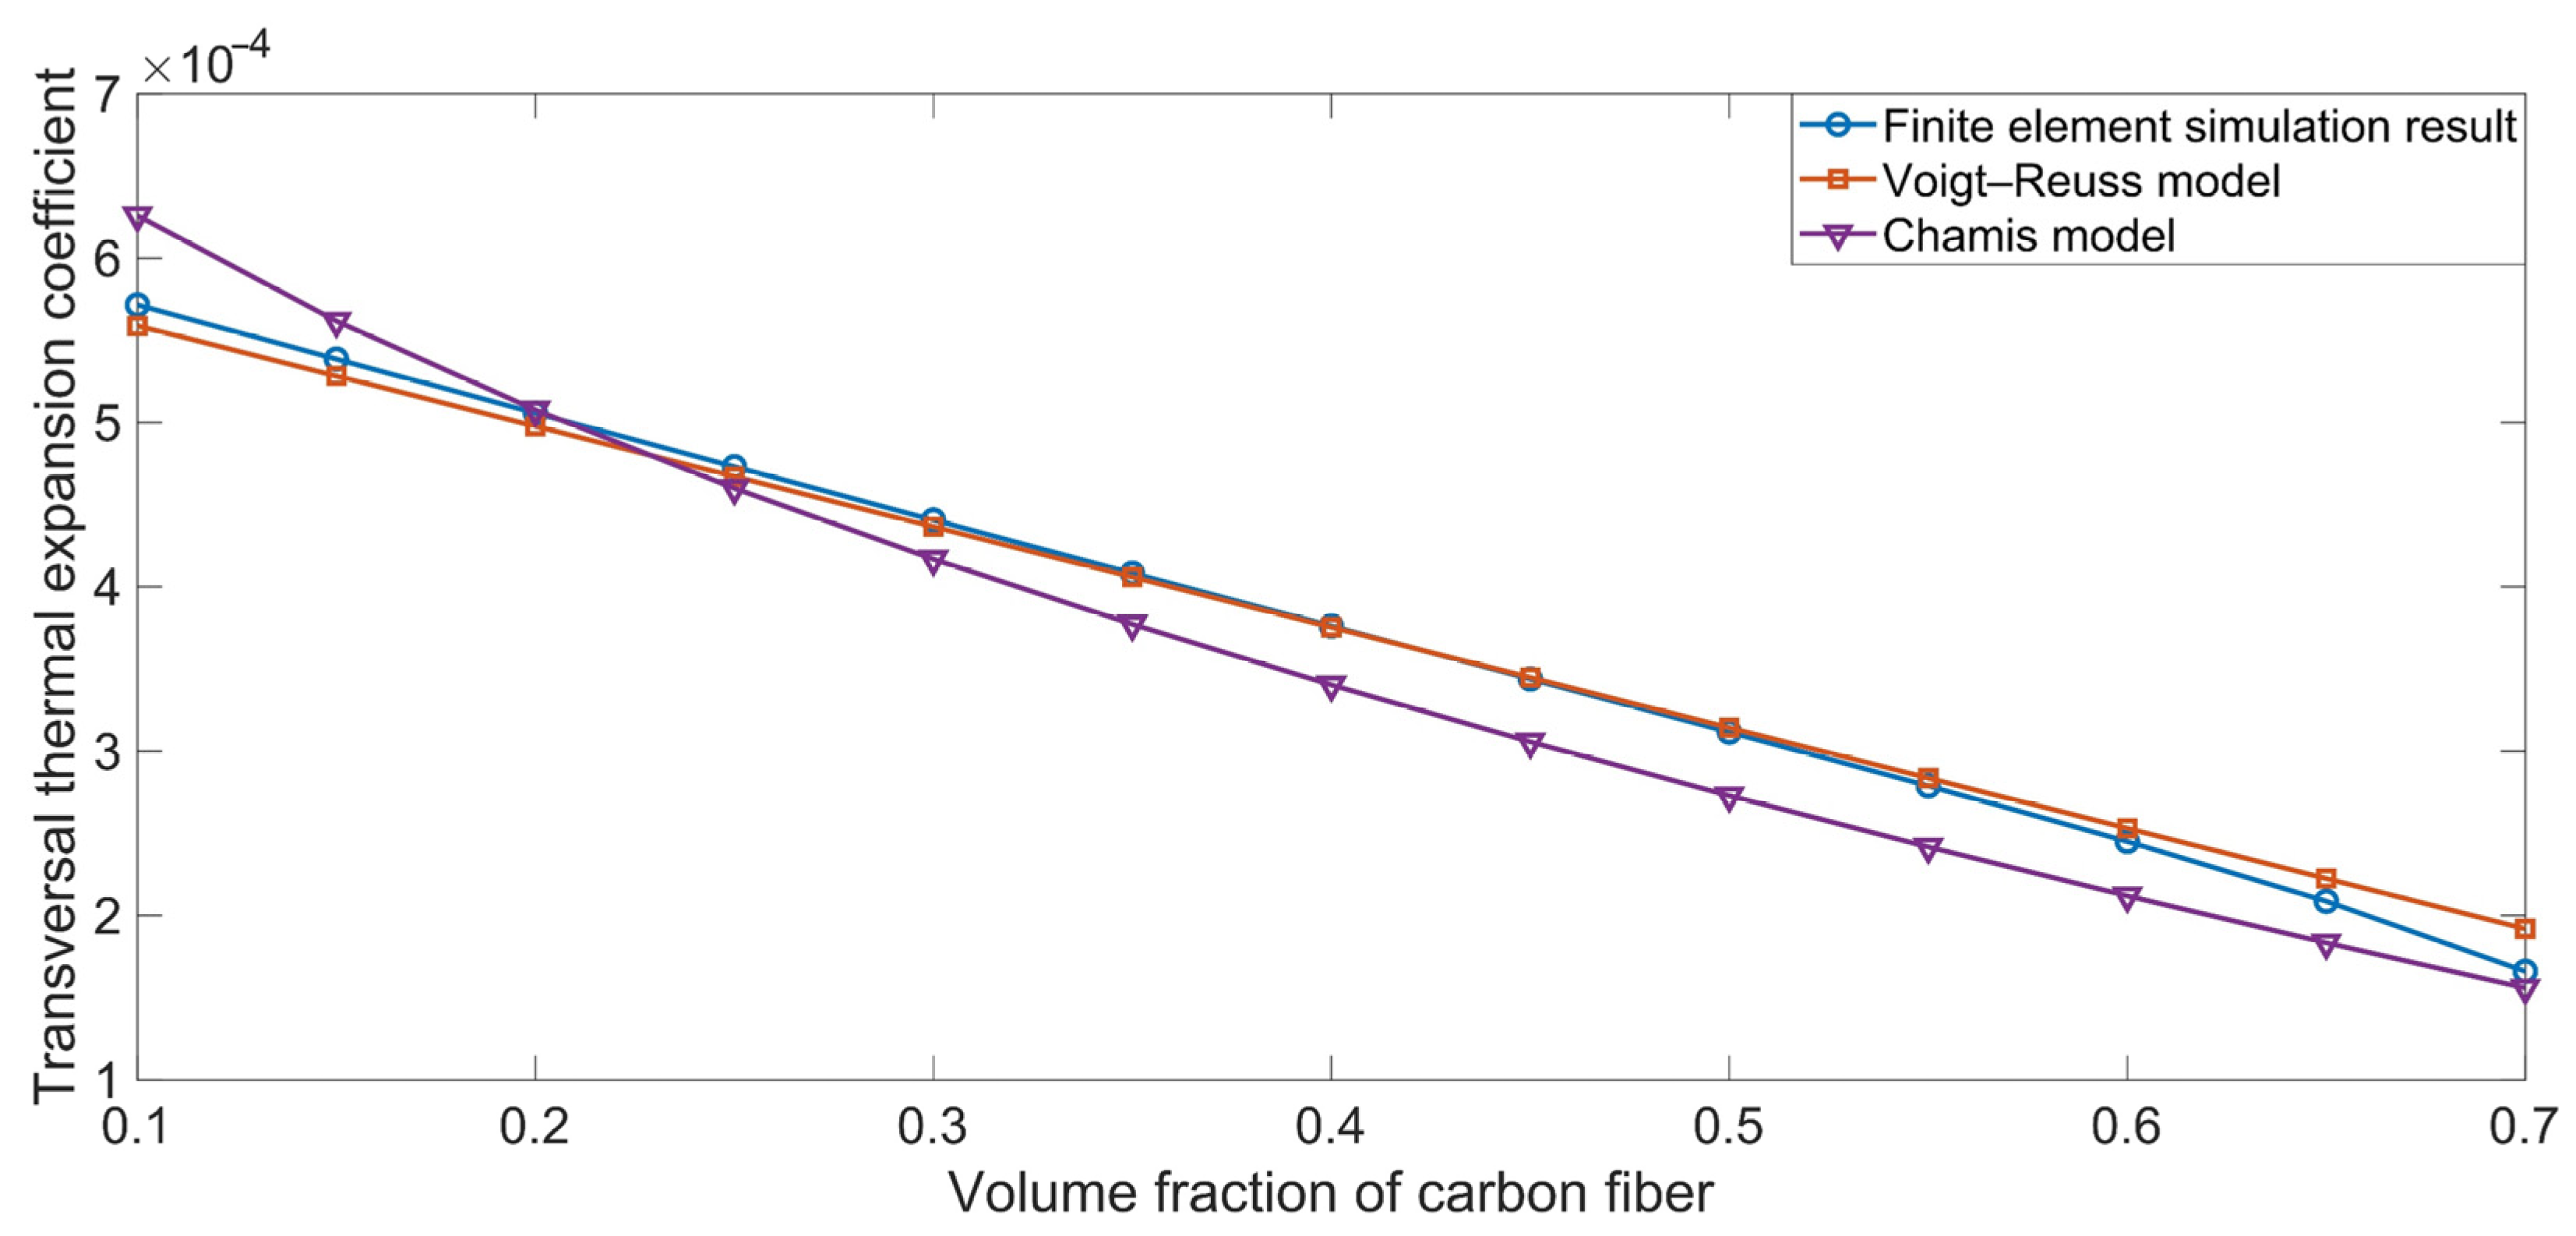
The comparison between the simulation results and the theoretical data for the transversal thermal expansion coefficient αyy are shown in Figure 6. Unlike the corresponding longitudinal thermal expansion coefficient αxx, shown in Figure 5, the αyy value was positive and fell between the thermal expansion coefficient of the carbon fiber αyc (25 × 10−6 K−1) and that of the rubber matrix αr (1 × 10⁻⁴ K−1). Meanwhile, we found slight deviations between the theoretical data obtained using the Voigt–Reuss model and those produced by the Chamis model, which can be assessed according to their computational formulas in Equations (41) and (44). Furthermore, the consistency between the simulation results and the theoretical data can be considered to verify their mutual reliability.
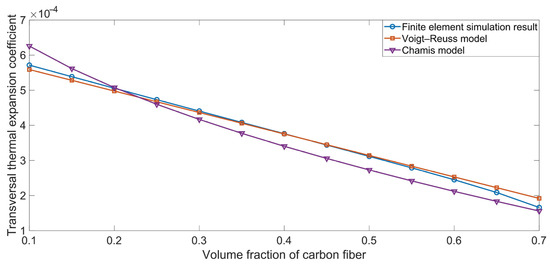
Figure 6.
Comparison between the simulation results and theoretical data obtained using various ROM models for the transversal thermal expansion coefficient αyy.
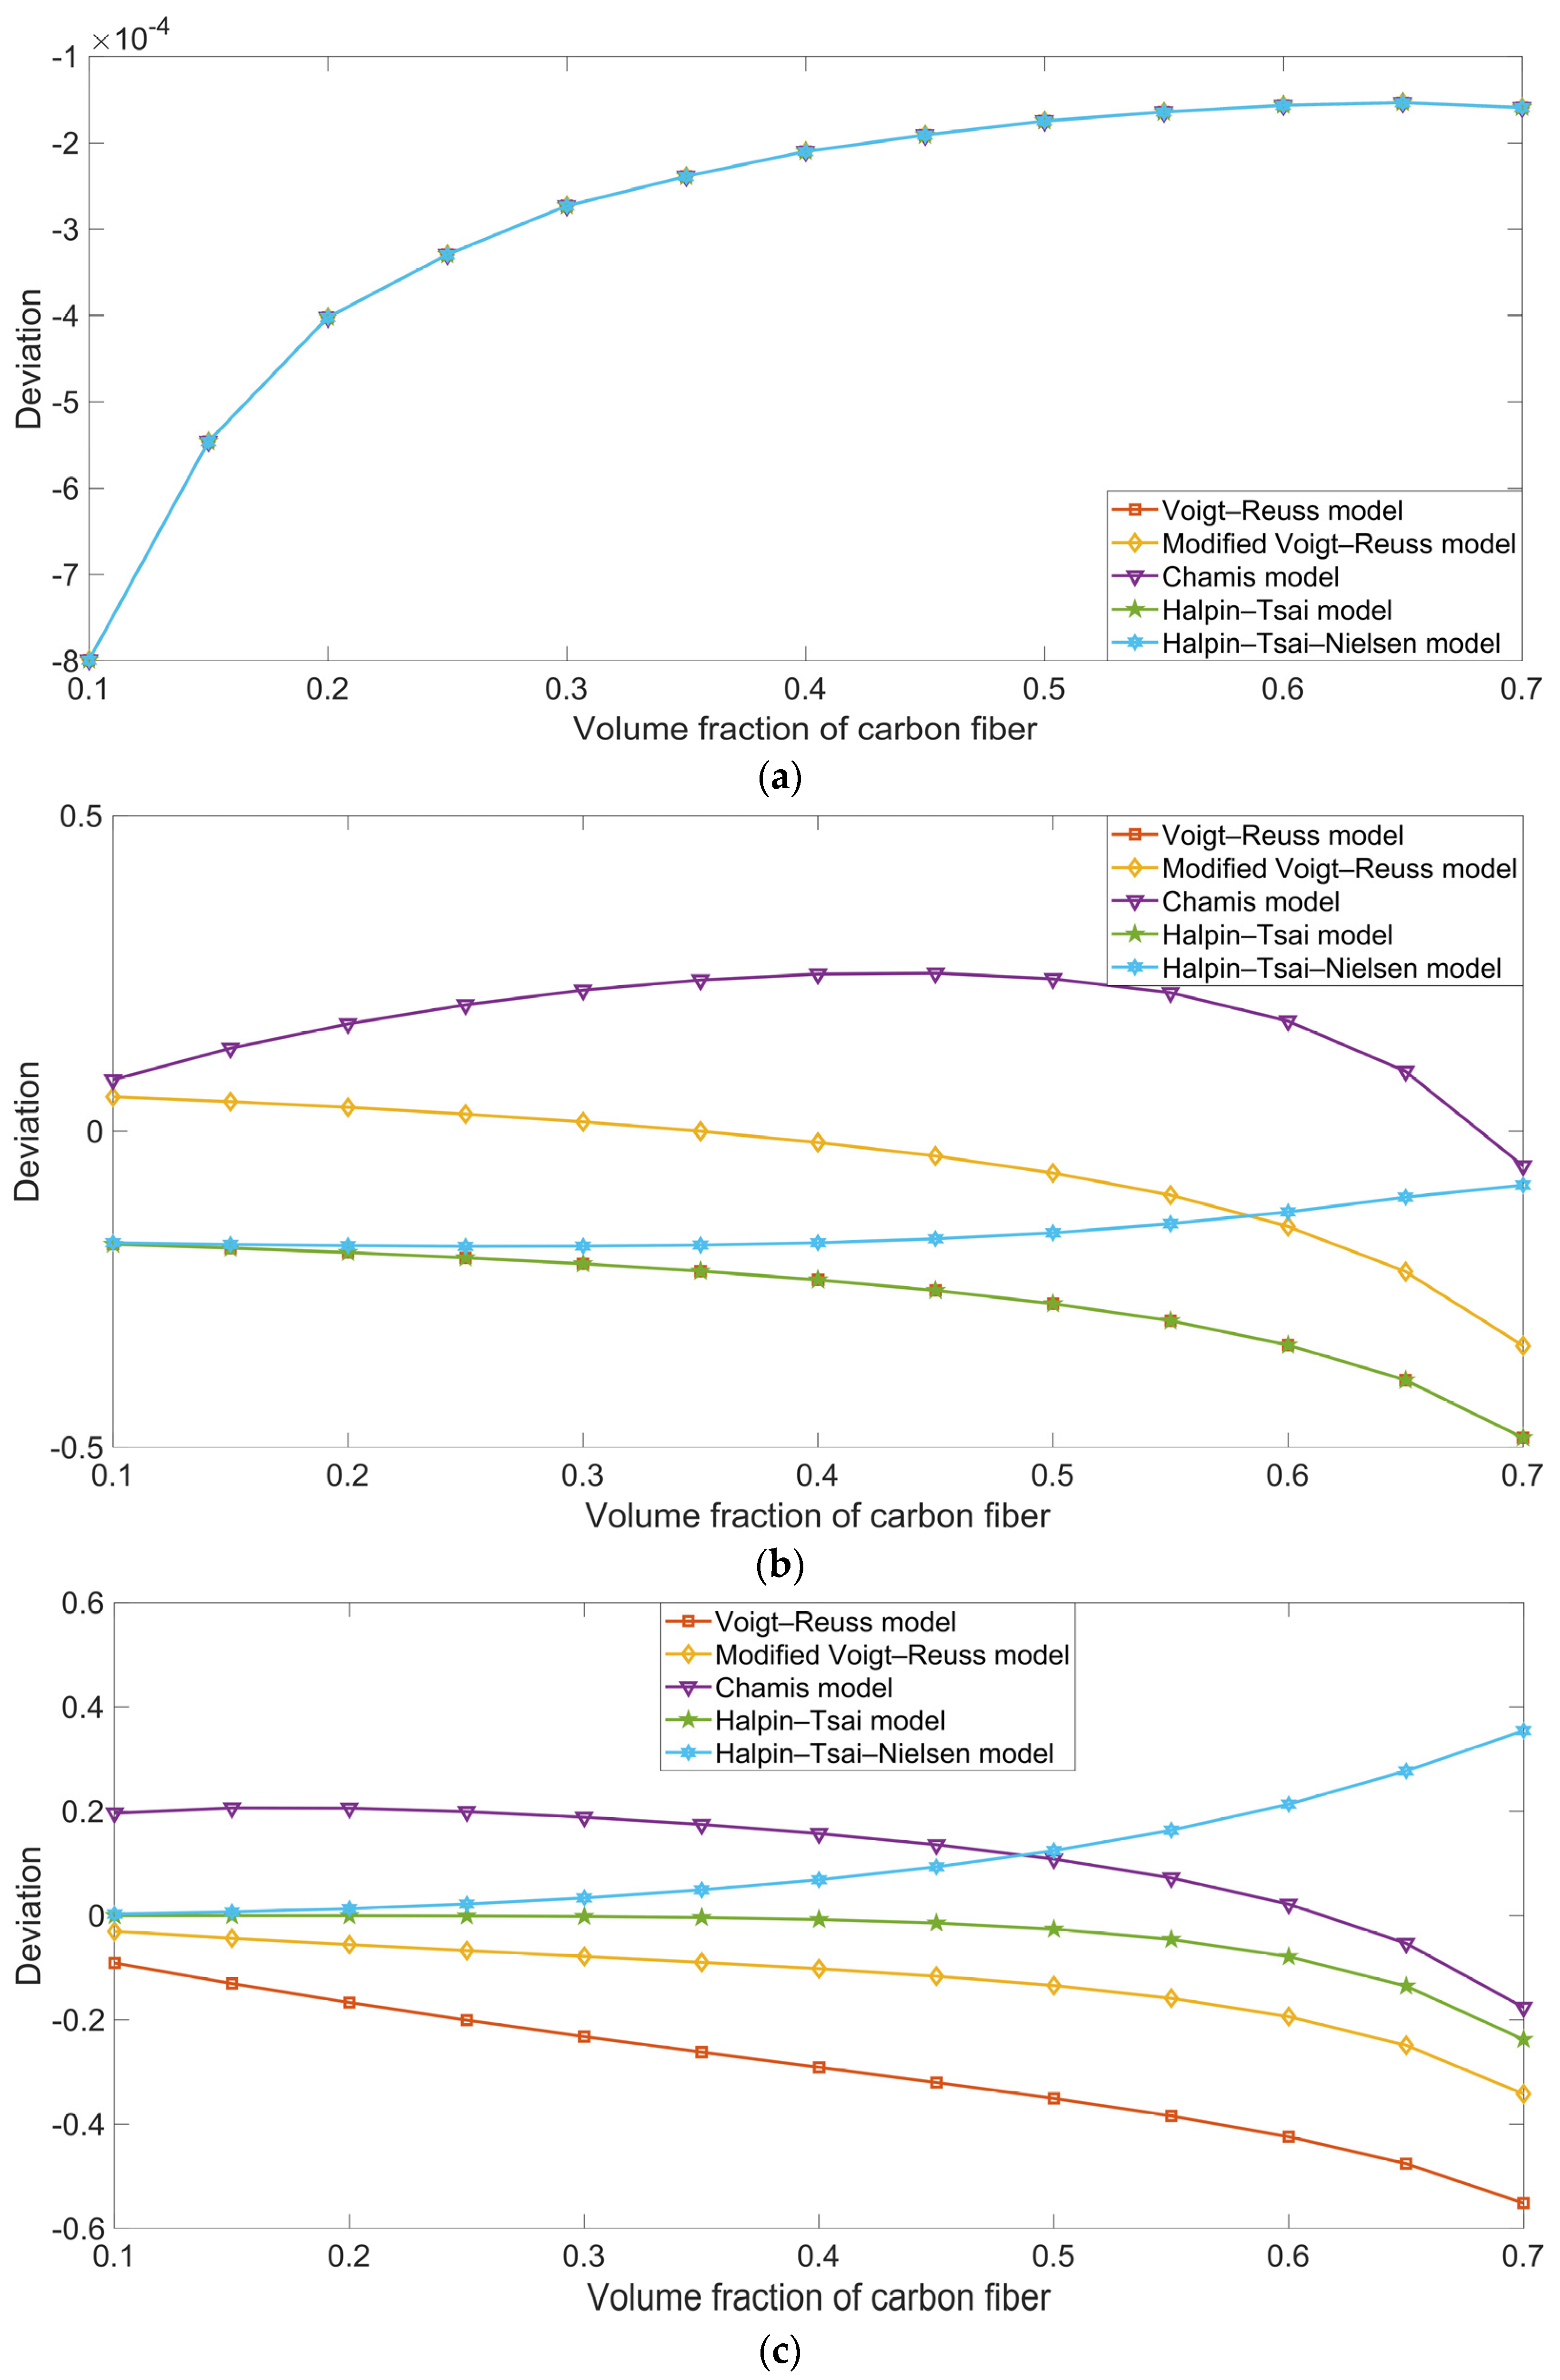
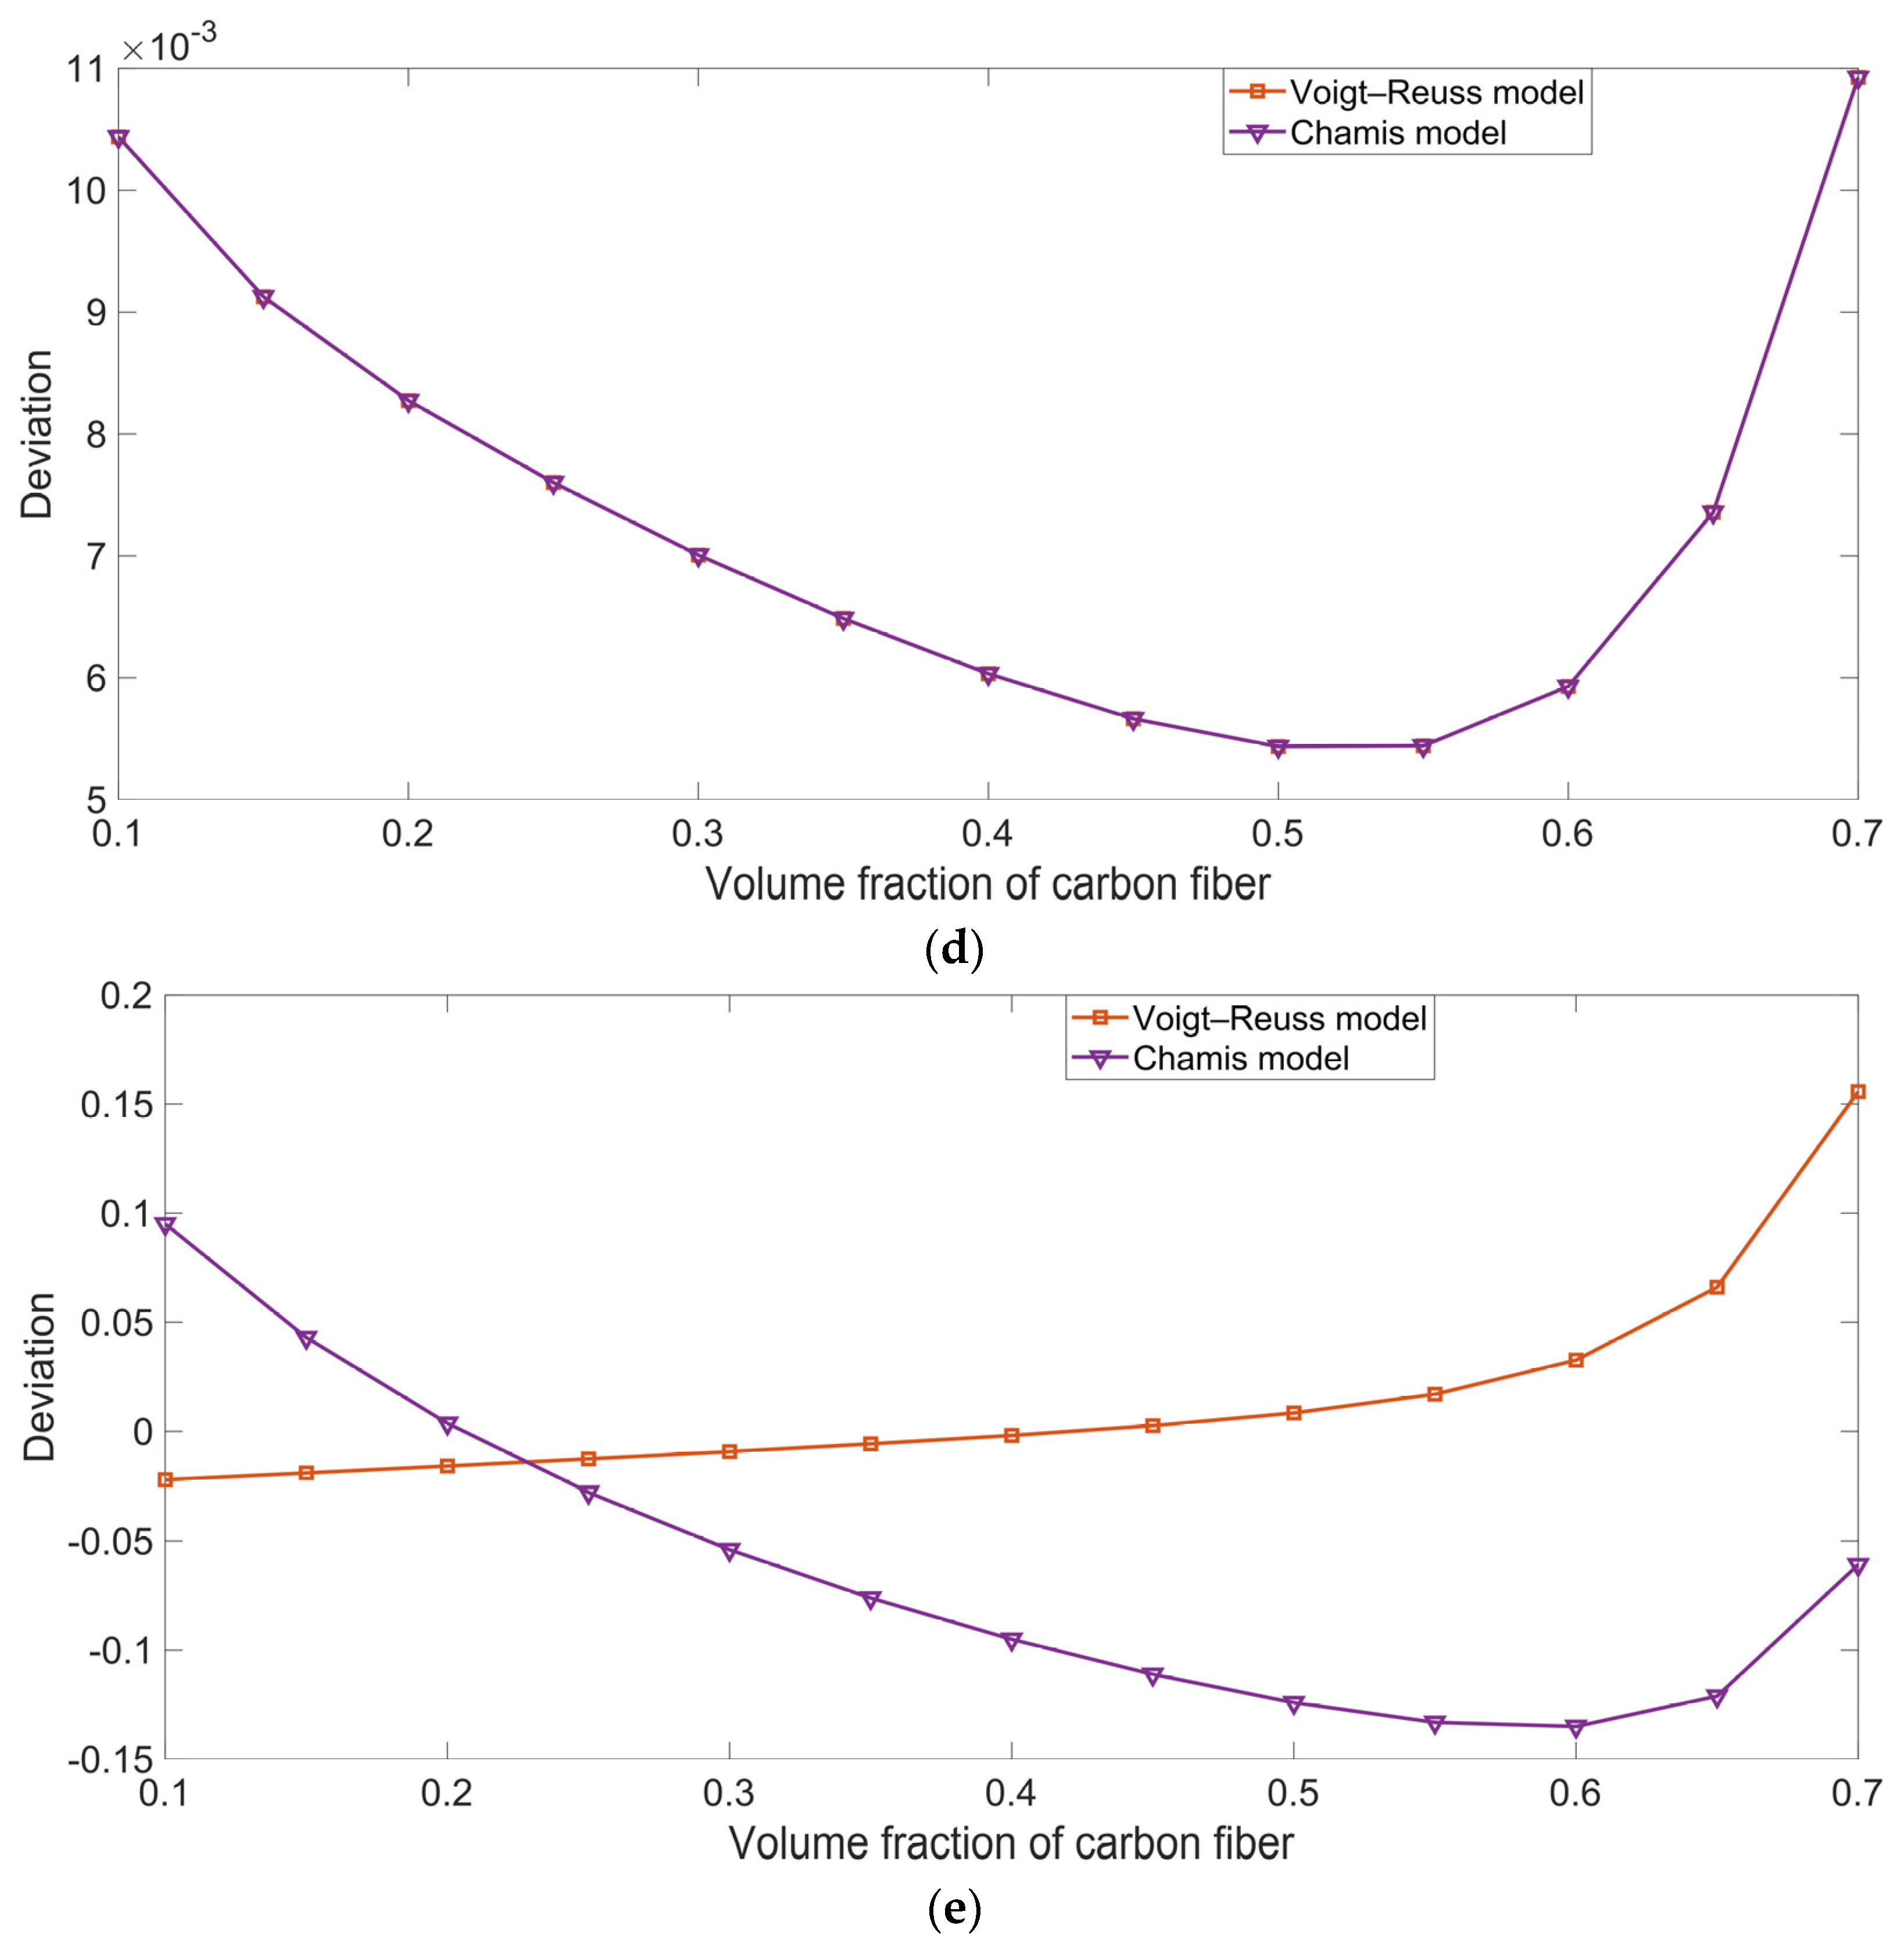
Taking the finite element simulation result as the reference value, the relative deviations for the various ROM models can be derived from Equation (50), and the results are shown in Figure 7. Here, Dr, dataROM, and datasimulation represent the relative deviation, the theoretical data for each ROM model, and the simulation result, respectively:
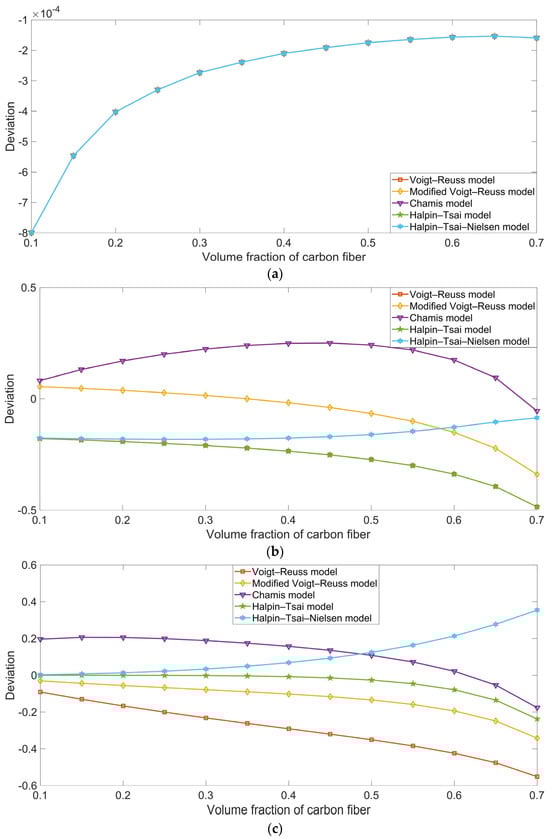
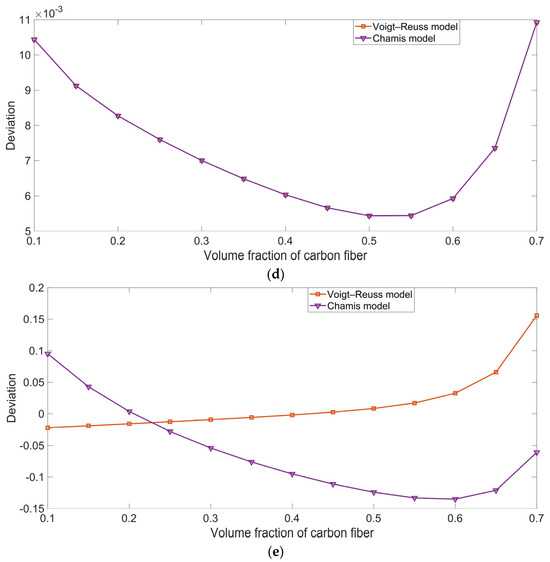
Figure 7.
Relative deviations for the various ROM models, taking the finite element simulation result as the reference value. (a) Longitudinal Young’s modulus Exx; (b) transversal Young’s modulus Eyy; (c) in-plane shear modulus Gxy; (d) longitudinal thermal expansion coefficient αxx; and (e) transversal thermal expansion coefficient αyy.
Figure 7 indicates that, for different properties, the deviations for the various ROM models were not the same. For the longitudinal Young’s modulus Exx, the deviation for each ROM model was almost the same, as is consistent with the results shown in Figure 2. Similarly, for the longitudinal thermal expansion coefficient αxx, the deviation for the Voigt–Reuss model was almost the same as that for the Chamis model. However, for the transversal Young’s modulus Eyy, the in-plane shear modulus Gxy, and the transversal thermal expansion coefficient αyy, the corresponding ROM models with the minimum deviation were the modified Voigt–Reuss model, the Halpin–Tsai model, and the Voigt–Reuss model, respectively. Furthermore, we found that the deviation was also affected by the volume fraction of the carbon fiber Vfc. Taking the relative deviation for the transversal Young’s modulus Eyy in Figure 7b, for example, the modified Voigt–Reuss model obtained higher prediction accuracy when the Vfc was smaller than 0.6, and the thermotical data obtained using the Halpin–Tsai–Nielsen model were closer to the simulation results when the Vfc was larger than 0.6. Analogously, regarding the deviation for the in-plane shear modulus Gxy in Figure 7c, the Halpin–Tsai model achieved higher prediction accuracy with a smaller Vfc value, and the Chamis model achieved better accuracy with a larger Vfc. Thus, each ROM model is suitable for a particular scenario, and the appropriate ROM model should be selected to study the various properties of carbon-fiber-reinforced rubber.
Table 4 shows the comparisons of the longitudinal Young’s modulus Exx, transversal Young’s modulus Eyy, in-plane shear modulus Gxy, longitudinal thermal expansion coefficient αxx, and transversal thermal expansion coefficient αyy between the carbon fiber, the rubber matrix, and the composite material. Here, Vfc = 0% refers to a pure rubber matrix, and Vfc = 100% refers to pure carbon fiber. Meanwhile, the data for the composite material were represented by the finite element simulation value, and those for the carbon fiber and rubber matrix were obtained from Table 1 and Table 2, respectively. We found that the reinforcement of the composite material with carbon fiber increased along with the increase in the Vfc value, which proved the effectiveness of the carbon fiber filler.
Table 4.
Performance comparison of the carbon fiber, rubber matrix, and composite material.
5. Mechanism Analysis
The mechanism of the composite material comprising the rubber matrix and the carbon fiber was intuitively revealed by the distribution of Von Mises stress (N/m2). The anisotropic properties were analyzed according to the condition of different kinds of loads, as shown in Table 3; the mechanical properties and the thermal properties will now be discussed.
5.1. Mechanical Properties
5.1.1. Load 11
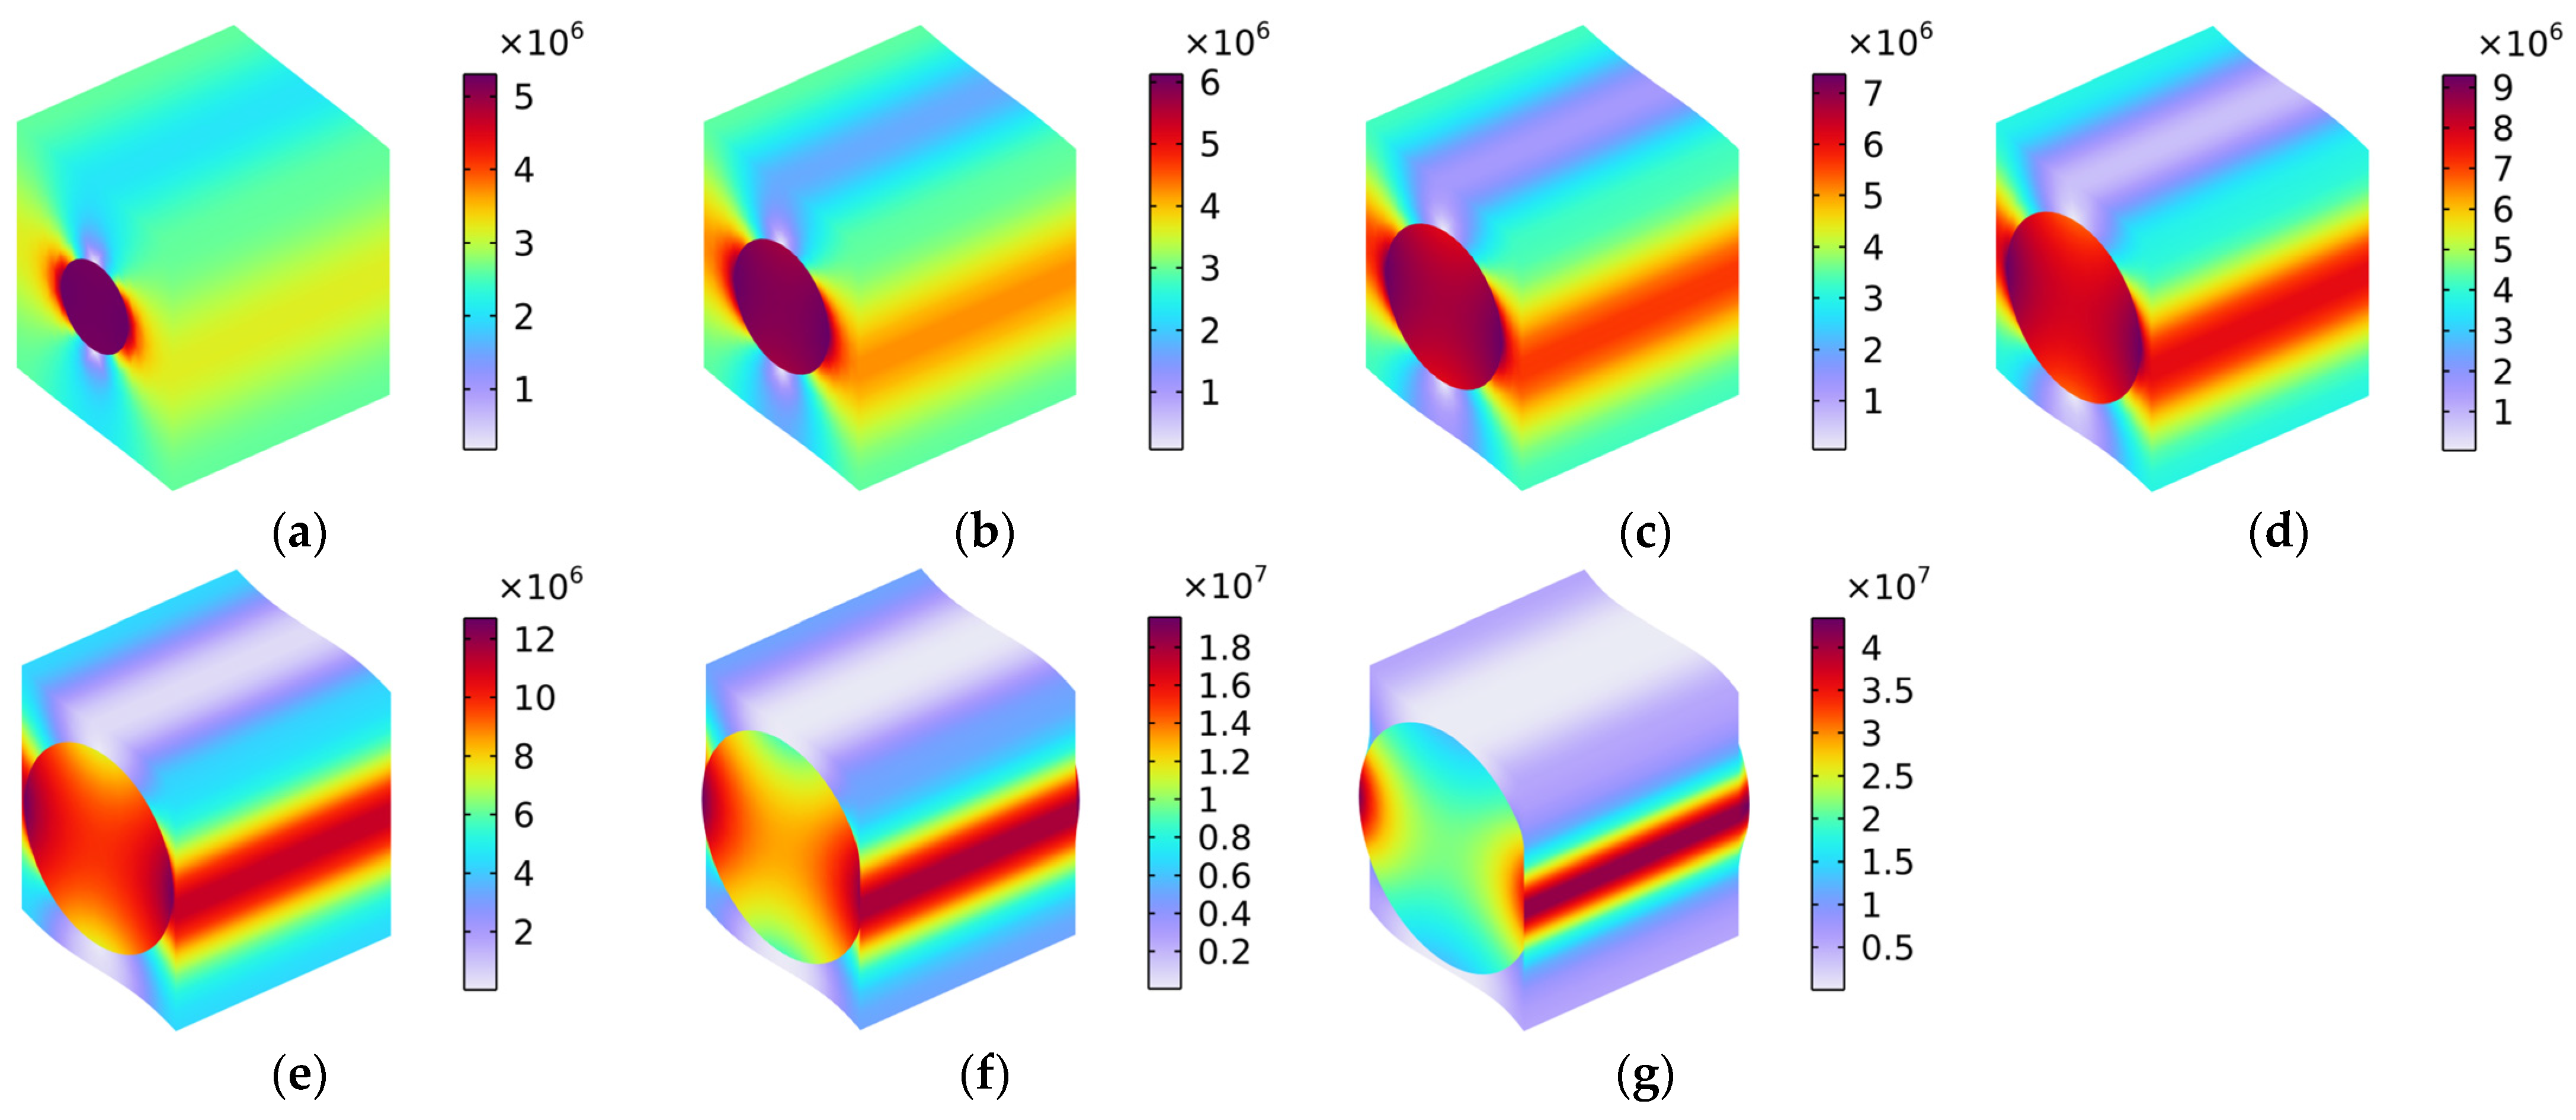
The distribution of Von Mises stress (N/m2) with various fiber volume fractions under the conditions of the load in the x-axis direction is shown in Figure 8. We found that most of the load was placed on the carbon fiber, and the rubber matrix withstood the minimal load; these findings are consistent with the previous analysis of the longitudinal Young’s modulus Exx. The contact area and effective binding force between the carbon fiber and the rubber matrix were large in the x-axis direction. With the increase in the volume fraction of the carbon fiber Vfc from 10% to 70%, the reinforcement of carbon fiber with high strength to the rubber matrix with low strength became more and more significant, which indicated that the composite material could bear a larger load in the x-axis direction.

Figure 8.
Distribution of Von Mises stress (N/m2) with various volume fractions under the conditions of load in the x-axis direction. (a) Vfc = 10%; (b) Vfc = 20%; (c) Vfc = 30%; (d) Vfc = 40%; (e) Vfc = 50%; (f) Vfc = 60%; and (g) Vfc = 70%.
5.1.2. Load 22
The distribution of Von Mises stress (N/m2) with various fiber volume fractions under the conditions of the load in the y-axis direction is shown in Figure 9. Compared with the results shown in Figure 8, the reinforcement of the rubber matrix with carbon fibers in the y-axis direction was far less pronounced than in the x-axis direction. The main reason for this phenomenon is that the binding force between the carbon fiber and the rubber matrix was small in the y-axis direction, since the contact area in the y-axis direction between the two was too small relative to that in the x-axis direction. The results indicate that the bearing capacity of carbon-fiber-reinforced rubber was limited; otherwise, the composite material may be destroyed in the binding region.
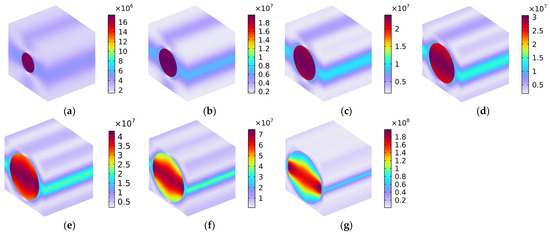
Figure 9.
Distribution of Von Mises stress (N/m2) with various volume fractions under the condition of load in the y-axis direction. (a) Vfc = 10%; (b) Vfc = 20%; (c) Vfc = 30%; (d) Vfc = 40%; (e) Vfc = 50%; (f) Vfc = 60%; and (g) Vfc = 70%.
5.1.3. Load 33
The distribution of Von Mises stress (N/m2) with various fiber volume fractions under the condition of the load in the z-axis direction is shown in Figure 10. The distributions of Von Mises stress shown in Figure 10 were similar to those shown in Figure 9 (rotating 90° in the y–z plane along the x-axis), because the rubber matrix was isotropous and the carbon fiber had the same Young’s modulus in the y-axis direction and the z-axis direction, as can be ascertained from the values of Eyc and Ezc in Table 1. Therefore, the carbon-fiber-reinforced rubber could not withstand a large load in the z-axis direction, for reasons similar to those described for the y-axis direction.
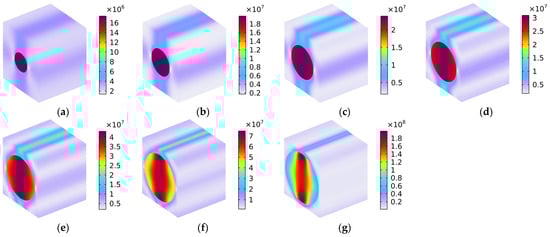
Figure 10.
Distribution of Von Mises stress (N/m2) with various volume fractions under the conditions of load in the z-axis direction. (a) Vfc = 10%; (b) Vfc = 20%; (c) Vfc = 30%; (d) Vfc = 40%; (e) Vfc = 50%; (f) Vfc = 60%; and (g) Vfc = 70%.
5.1.4. Load 12
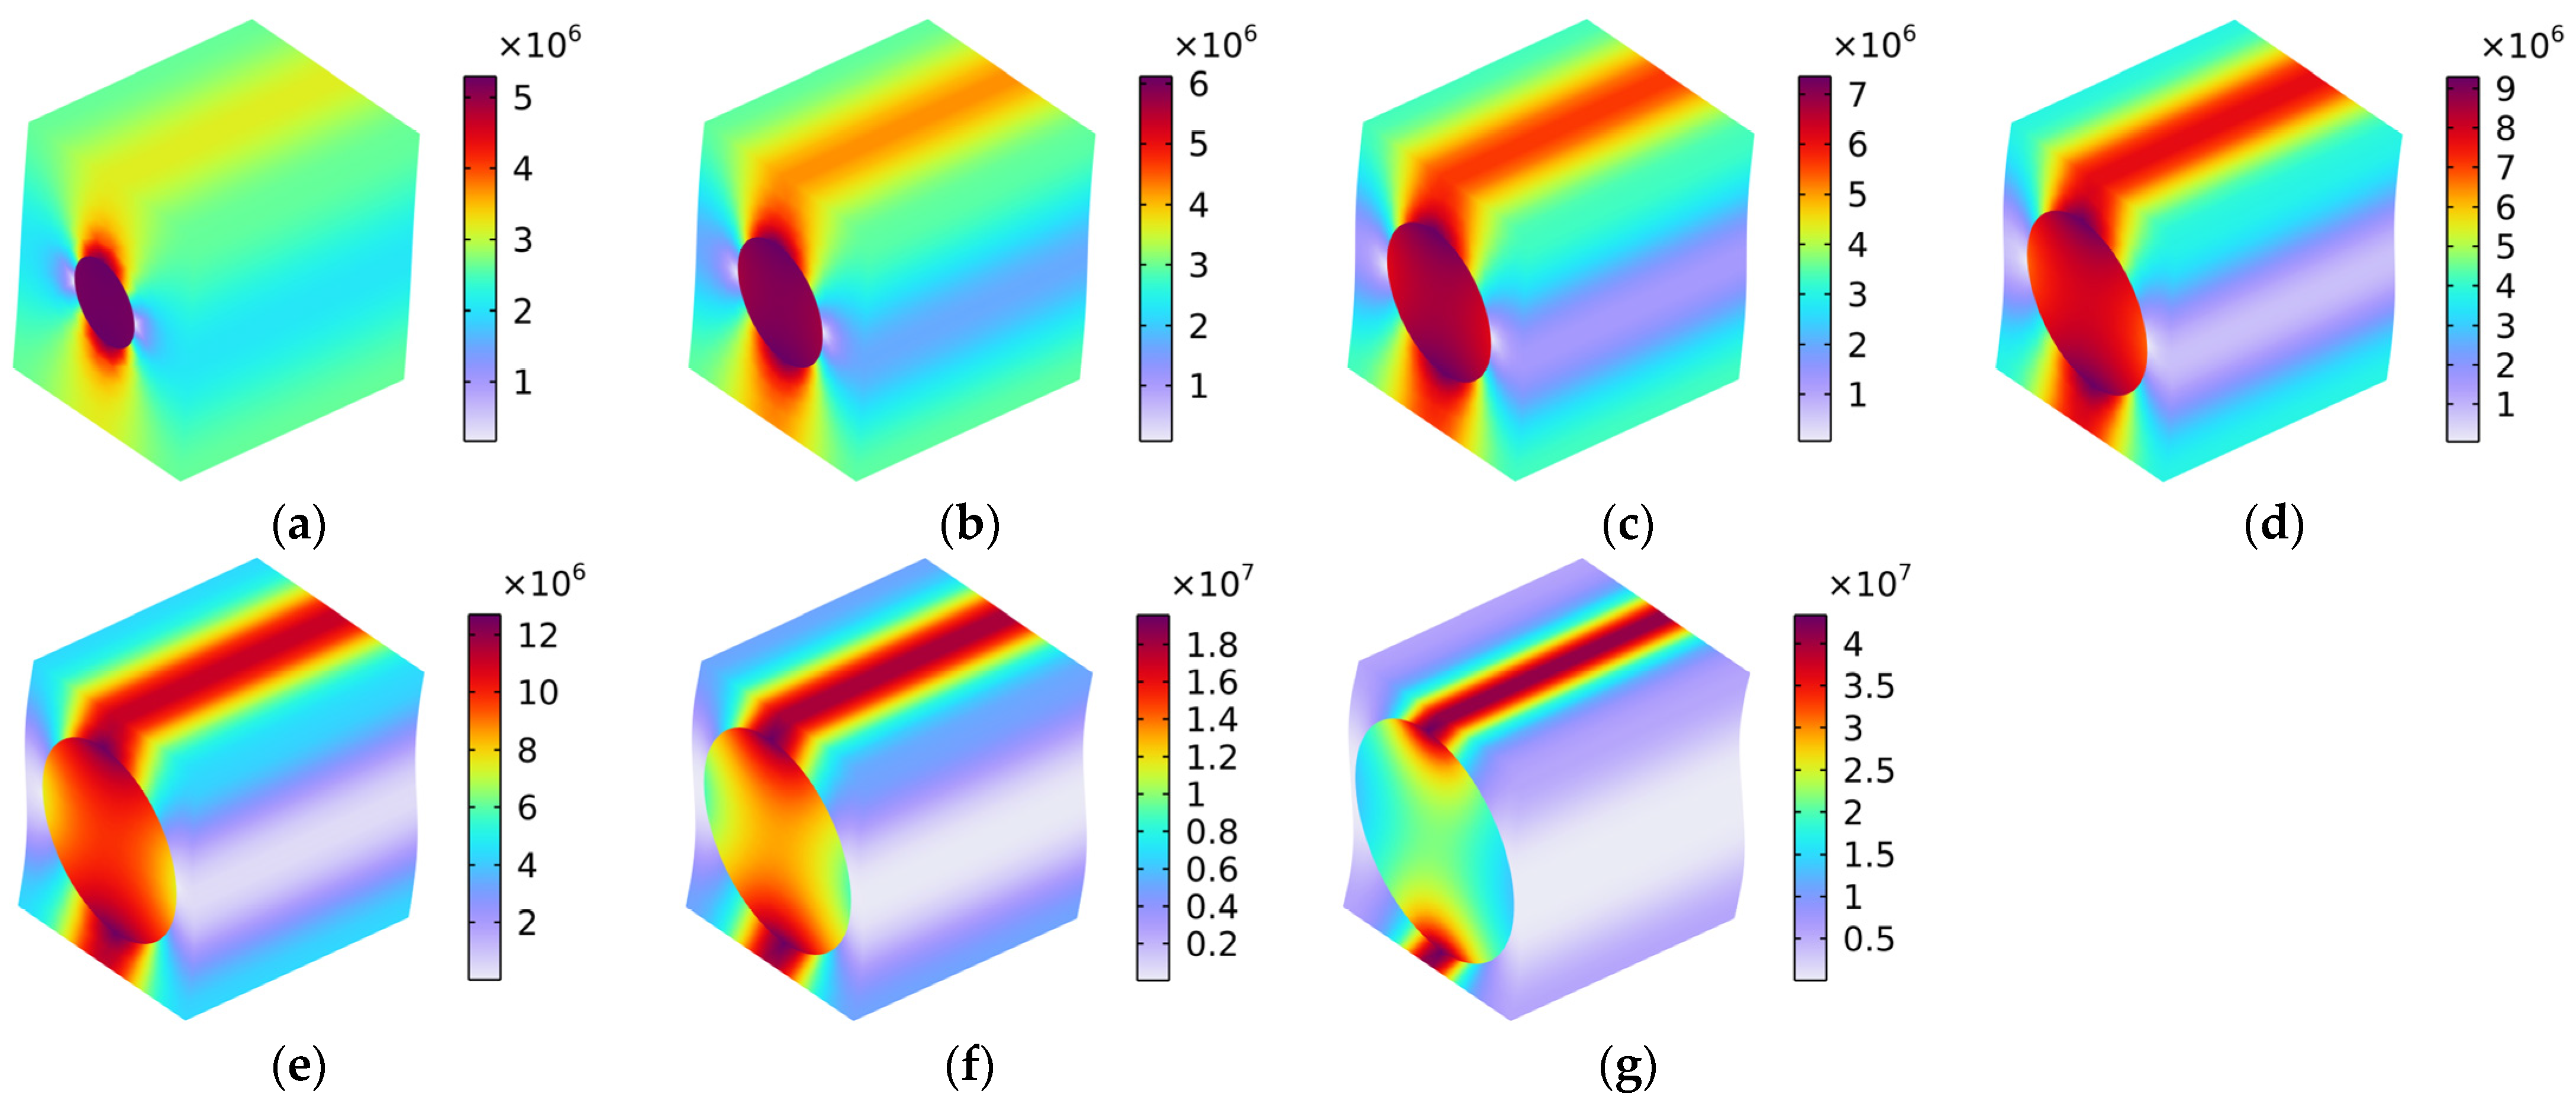
Figure 11 shows the distribution of Von Mises stress (N/m2) with various fiber volume fractions under the conditions of the load in the x–y oblique plane. The load can be divided into the following categories: along the x-axis and along the y-axis. This indicates that the distribution of Von Mises stress shown in Figure 11 is the result of a coupling effect of the Von Mises stress in Figure 8 and that in Figure 9. However, the value of the Von Mises stress in Figure 11 was closer to that in Figure 9 and far smaller than that in Figure 8, because the weak binding force diminished the reinforcement effect. The main difference between the distributions of Von Mises stress in Figure 11 and in Figure 9 was that the interfaces between the carbon fiber and the rubber matrix bore the main stress when the Vfc was large, as shown by Figure 11f,g. On the other hand, when the load was in the y-axis direction, the main stress was concentrated on the carbon fiber, and the interfaces assumed the secondary stress.
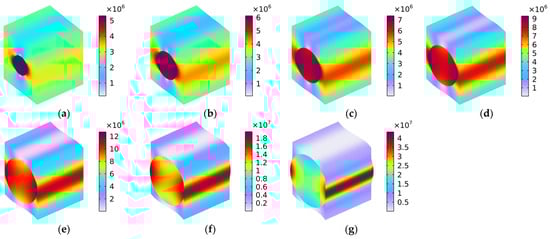
Figure 11.
Distribution of Von Mises stress (N/m2) with various volume fractions under the conditions of load in the x–y oblique plane. (a) Vfc = 10%; (b) Vfc = 20%; (c) Vfc = 30%; (d) Vfc = 40%; (e) Vfc = 50%; (f) Vfc = 60%; and (g) Vfc = 70%.
5.1.5. Load 23
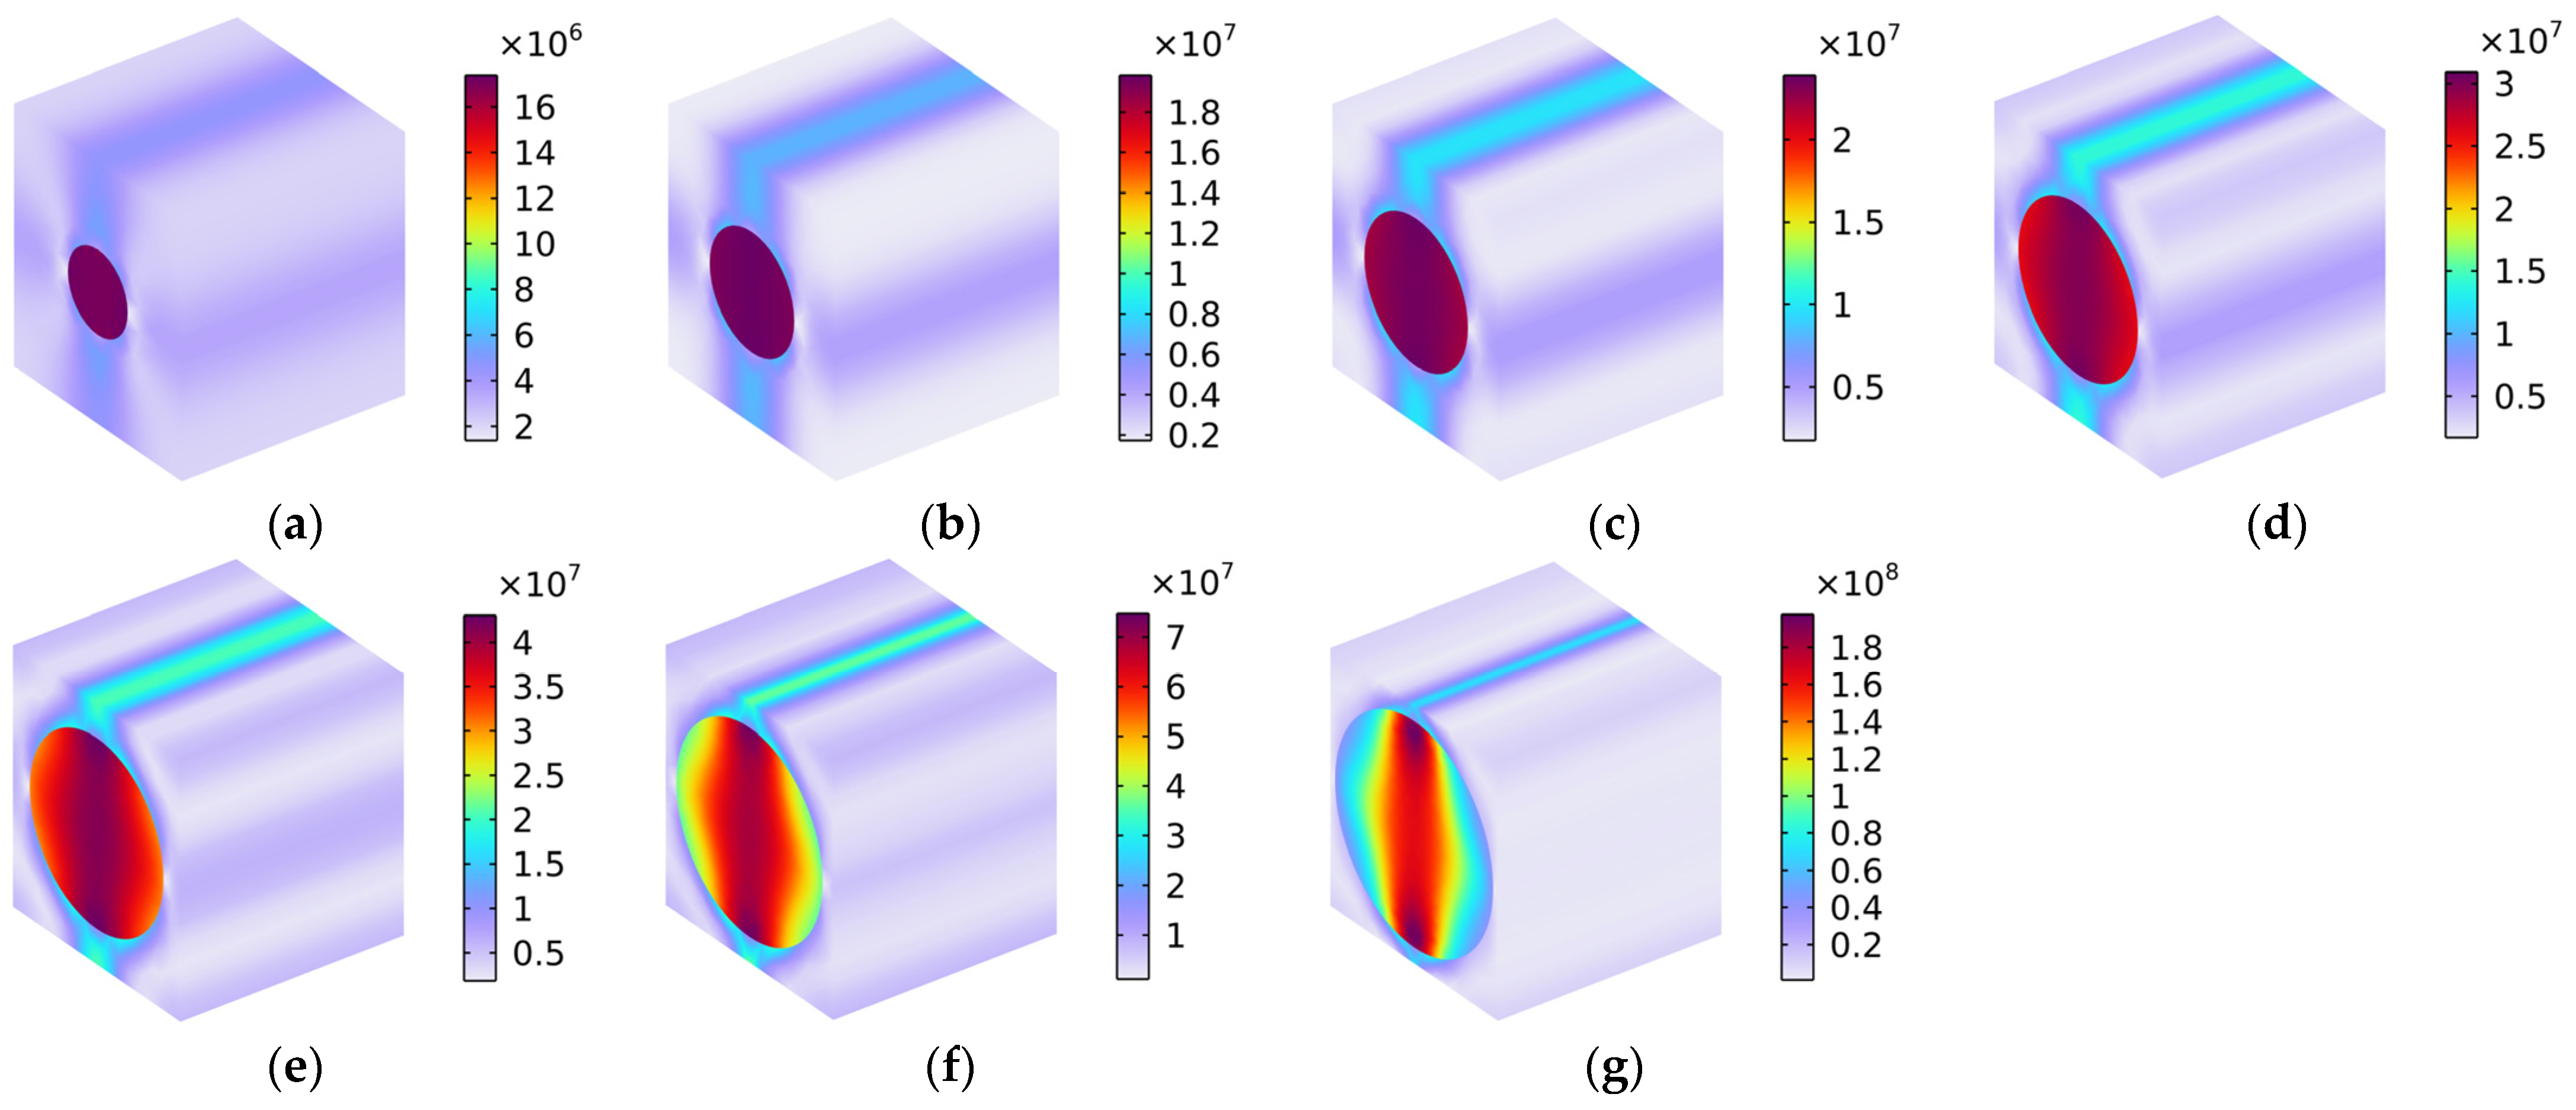
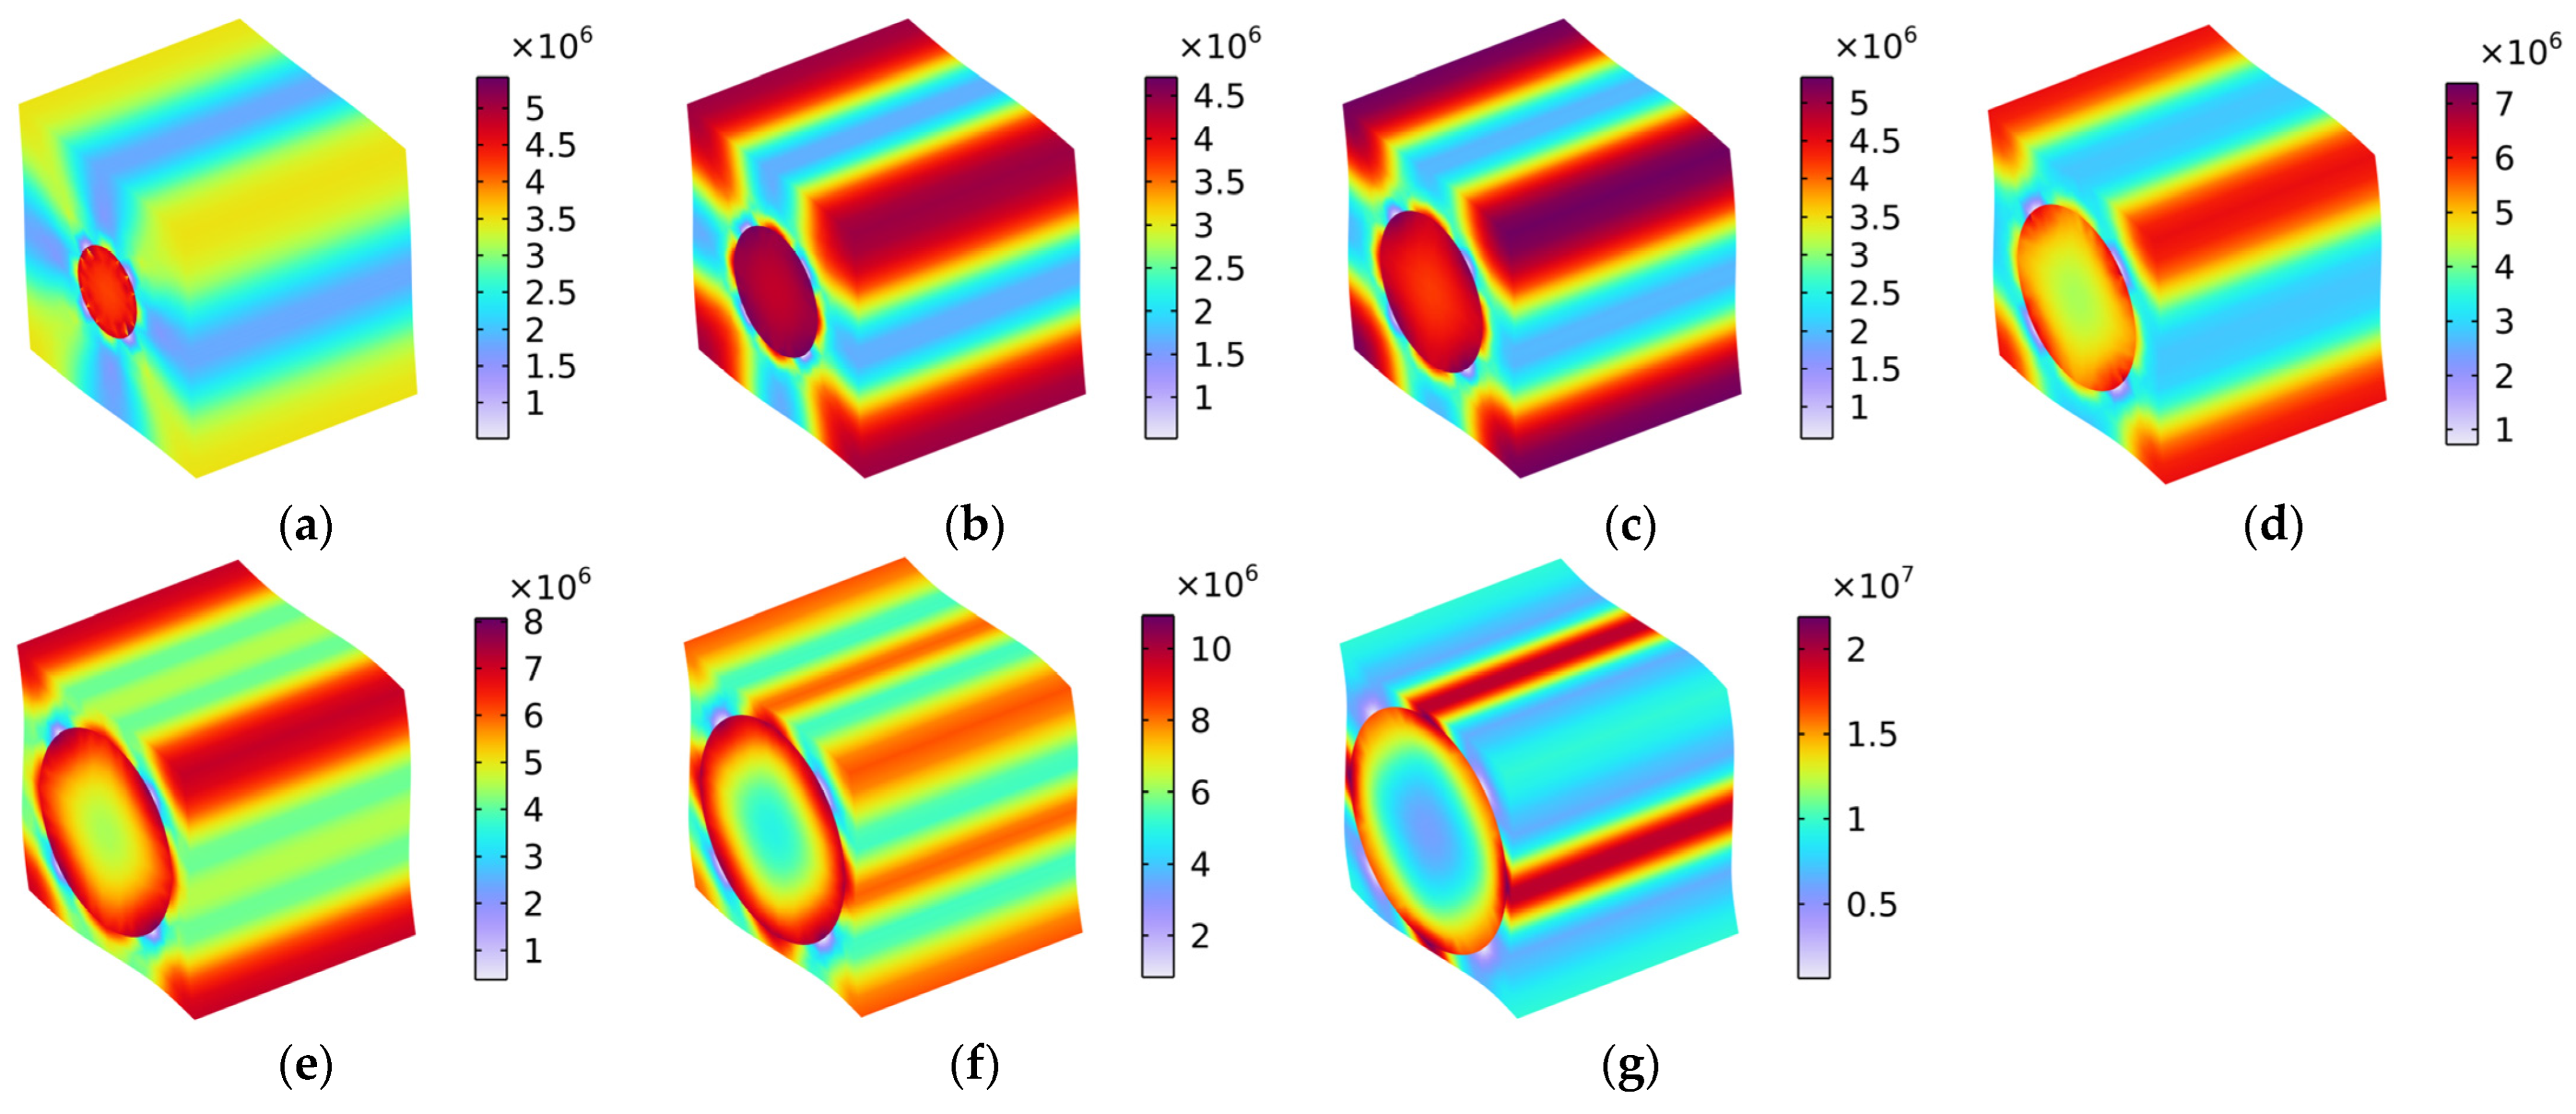
Figure 12 shows the distribution of Von Mises stress (N/m2) with various fiber volume fractions under the conditions of the load in the y–z oblique plane. Similarly, the load comprised one part along the y-axis and the other along the z-axis, which means that the distribution of Von Mises stress in Figure 12 constituted a coupling effect of the Von Mises stress in Figure 9 and that in Figure 10. Notably, when the volume fraction Vfc was lower than 40%, as shown in Figure 12a–d, the Von Mises stress was mainly distributed in the carbon fiber and the four corners of the rubber matrix. When the Vfc increased from 50% to 70%, the distribution of the Von Mises stress gradually transferred to the interfaces between the carbon fiber and the rubber matrix. In particular, when the Vfc was 70%, the Von Mises stress was mainly distributed in the surface of the carbon fiber and the interfaces between the carbon fiber and the rubber matrix. The material broke most easily in the place where the stress was concentrated, which is a finding that is consistent with the previous analysis.

Figure 12.
Distribution of Von Mises stress (N/m2) with various volume fractions under the condition of load in the y–z oblique plane. (a) Vfc = 10%; (b) Vfc = 20%; (c) Vfc = 30%; (d) Vfc = 40%; (e) Vfc = 50%; (f) Vfc = 60%; and (g) Vfc = 70%.
5.1.6. Load 13
Figure 13 shows the distribution of Von Mises stress (N/m2) with various fiber volume fractions under the conditions of the load in the x–z oblique plane. Homoplastically, the load comprises one part along the x-axis and the other along the z-axis, meaning that the distribution of Von Mises stress shown in Figure 13 comprised a coupling effect of the Von Mises stresses in Figure 8 and in Figure 10. The distributions of Von Mises stress under the conditions of load in the x–z oblique plane, as shown in Figure 13, were similar to those presented in Figure 11 (rotating 90° in the y–z plane along the x-axis), because the rubber matrix was isotropous, and the carbon fiber had the same Young’s modulus values in the y-axis direction and the z-axis direction.
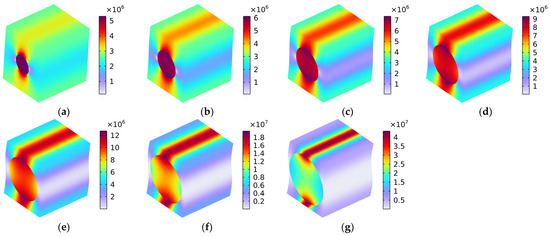
Figure 13.
Distribution of Von Mises stress (N/m2) with various fiber volume fractions under the conditions of load in the x–z oblique plane. (a) Vfc = 10%; (b) Vfc = 20%; (c) Vfc = 30%; (d) Vfc = 40%; (e) Vfc = 50%; (f) Vfc = 60%; and (g) Vfc = 70%.
5.2. Thermal Properties
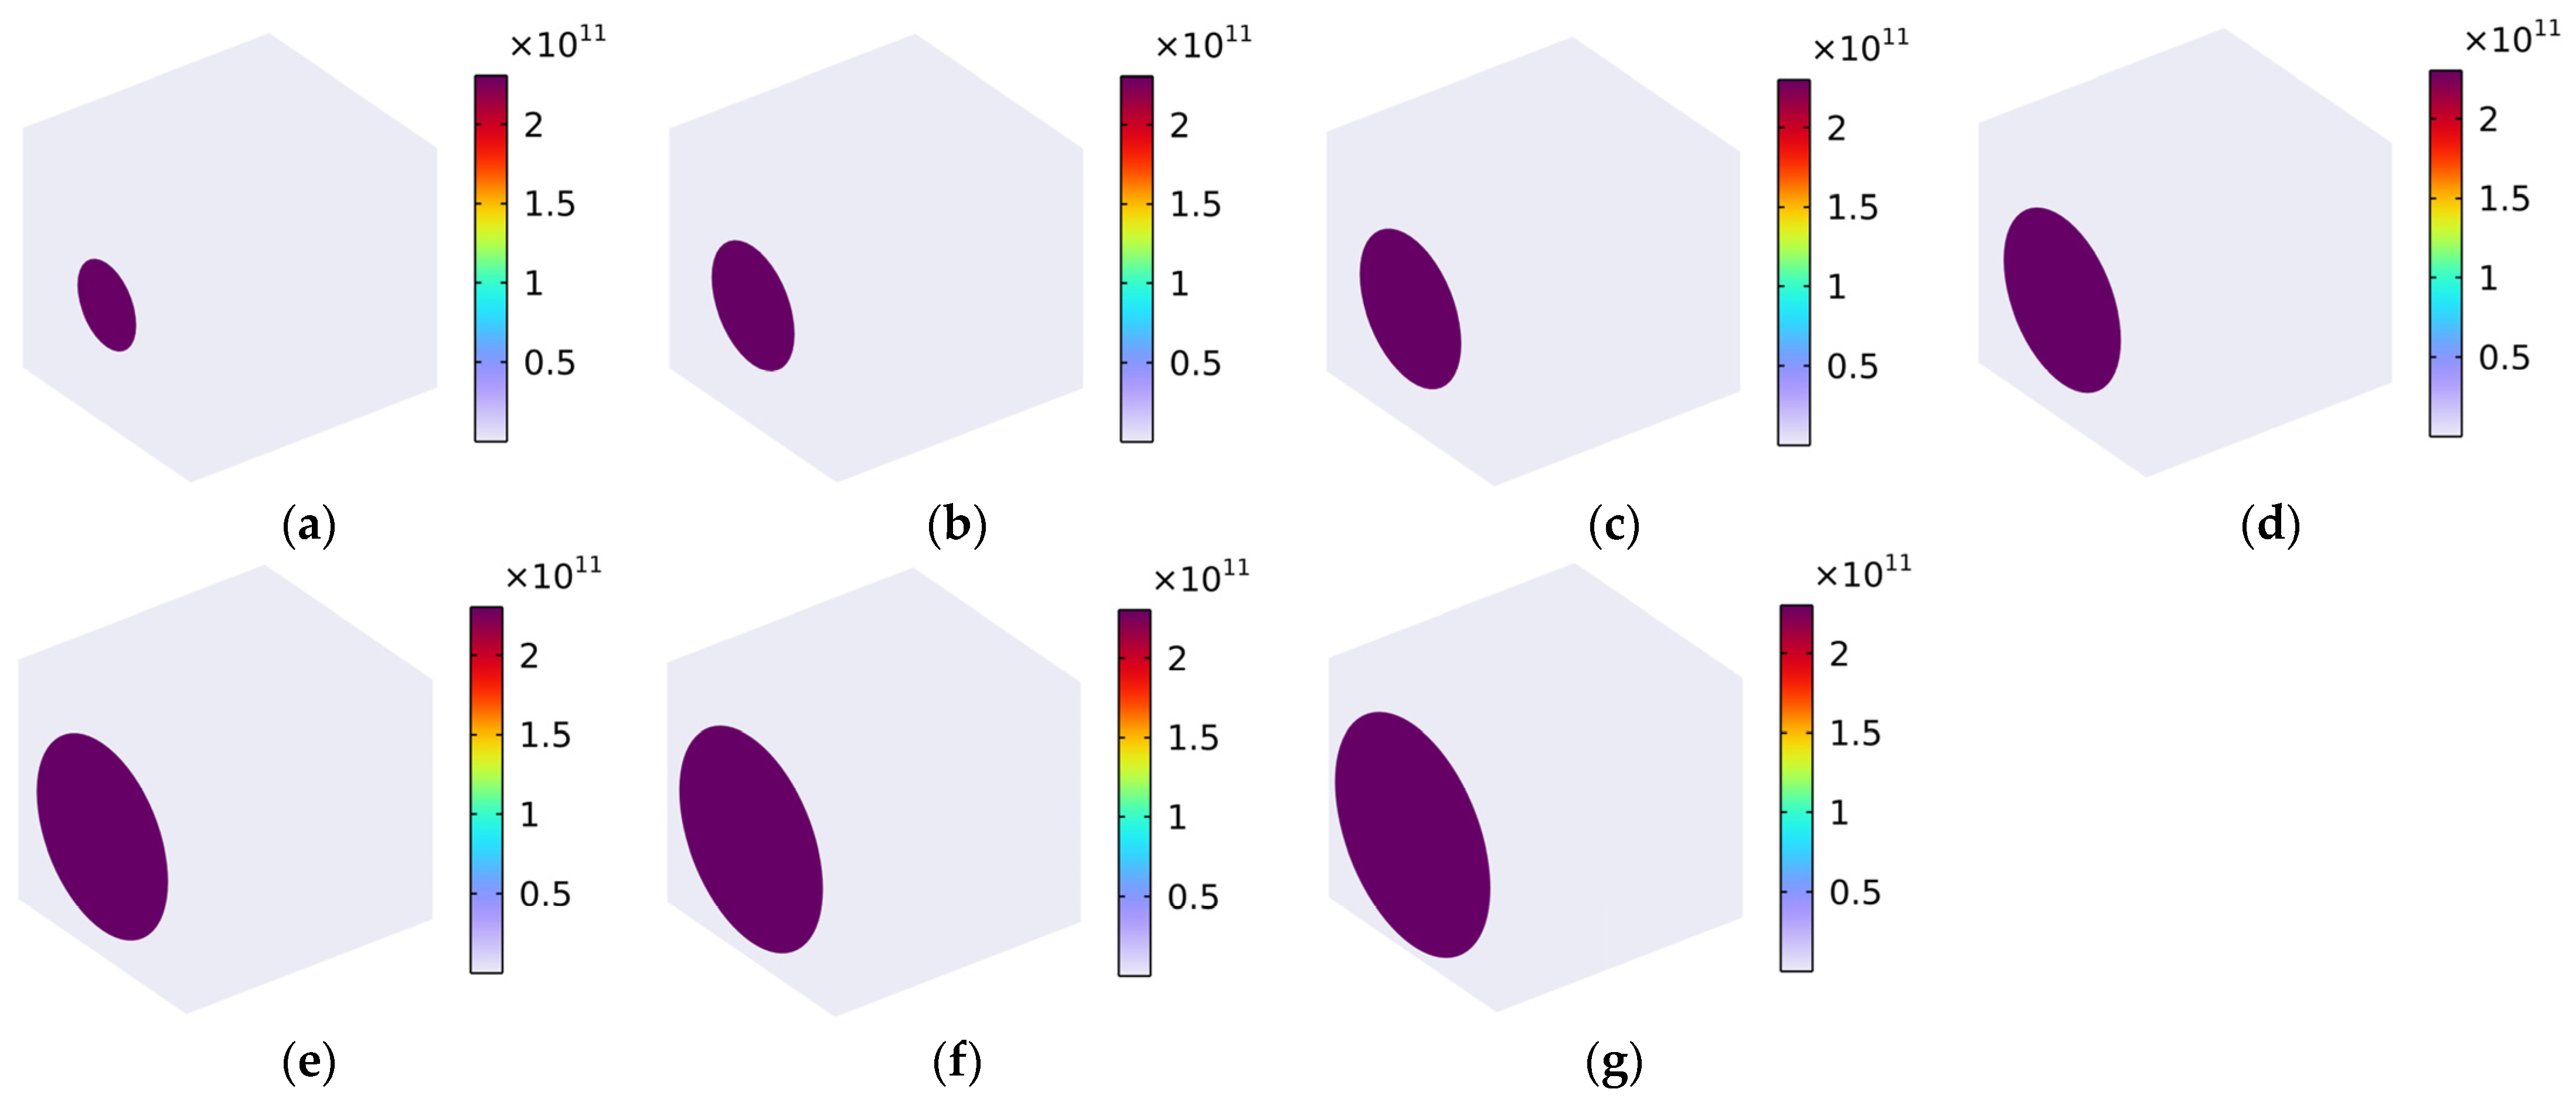
Figure 14 shows the distribution of Von Mises stress (N/m2) with various fiber volume fractions for the thermal properties. Unlike the boundary condition of average strain and the calculation target of the elasticity matrix used for the mechanical properties, the boundary condition of free expansion and the calculation target of the thermal expansion coefficient were selected for the examination of the thermal properties. In the free expansion mode, the Von Mises stress was markedly smaller than in the average strain model. In the x-axis direction, the strain was mainly concentrated on the carbon fiber; this finding was similar to that produced by the analysis of the Von Mises stress with Load 11 in Section 5.1.1. This is why the thermal expansion coefficient of the composite material αxx was close to that of the carbon fiber αxc. Homoplastically, in the y-axis direction, the strain was majorly concentrated on the rubber matrix; this was similar to the Von Mises stress with Load 22, discussed in Section 5.1.2, and this is why the thermal expansion coefficient of the composite material αyy was close to that of the rubber matrix αr. The thermal expansion coefficient of the composite material αzz in the z-axis direction was similar to the αyy value, as is also indicated in Figure 14.
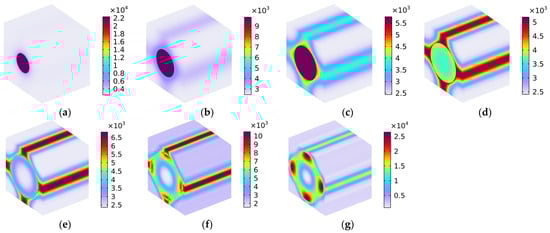
Figure 14.
Distribution of Von Mises stress (N/m2) with various fiber volume fractions for the materials’ thermal properties. (a) Vfc = 10%; (b) Vfc = 20%; (c) Vfc = 30%; (d) Vfc = 40%; (e) Vfc = 50%; (f) Vfc = 60%; and (g) Vfc = 70%.
6. Conclusions
Based on the solid mechanics method in a finite element simulation, the mechanical and thermal properties of carbon-fiber-reinforced rubber with a volume fraction ranging from 10 to 70% were investigated. We aimed to identify the influencing law and mechanism, and mutual verifications were conducted using various ROM models. The major achievements of this study are as follows.
- (1)
- According to the mutual verification of the finite element simulation results obtained using a simplified micromechanical model and the theoretical data presented by the various ROM models, we provided a simple and effective method for investigating the properties of carbon-fiber-reinforced rubber. Compared to complex and time-consuming experimental tests, the finite element simulation method not only reduced the experimental cost but could also provide a visual representation of the influencing mechanism.
- (2)
- The finite element simulation results indicate that, as the fiber volume fraction Vfc increased from 10% to 70%, the mechanical properties of the longitudinal Young’s modulus Exx, the transversal Young’s modulus Eyy, and the in-plane shear modulus Gxy changed from 2.31 × 10¹⁰ Pa to 16.09 × 10¹⁰ Pa, from 0.54 × 10⁷ Pa to 2.59 × 10⁷ Pa, and from 1.66 × 10⁶ Pa to 10.11 × 10⁶ Pa, respectively. The reinforcing effect of the carbon fiber mainly worked in the x-axis direction because the fiber was installed in this direction. Meanwhile, the reinforcing effect gradually improved as the fiber volume fraction Vfc increased. Therefore, the carbon fiber can be installed along the desired direction, and the multidirectional reinforcement of the rubber matrix can be obtained using two-dimensional or three-dimensional braided carbon fibers.
- (3)
- Similarly, the finite element simulation results suggest that, as the fiber volume fraction Vfc increases from 10% to 70%, the longitudinal thermal expansion coefficient αxx and transversal thermal expansion coefficient αyy changed from −4.98 × 10⁻⁷ K−1 to −5.89 × 10⁻⁷ K−1 and from 5.72 × 10⁻⁴ K−1 to 1.66 × 10⁻⁴ K−1, respectively. Moreover, αxx had a negative value, while αyy had a positive value, and both of them decreased as the fiber volume fraction Vfc increased. Thus, the desired thermal properties for the composite material could be obtained by selecting the carbon fiber with the appropriate dimensions and installing it in the right direction.
- (4)
- Using finite element simulation, we determined the influencing mechanism of the volume fraction of carbon fiber Vfc to the distribution of Von Mises stress for the carbon-fiber-reinforced rubber; the resultant picture of stress concentration may provide guidance for subsequent research. The interface between the carbon fiber and the rubber matrix was the weak spot, and the binding force should be improved to further enhance the overall performance of the composite material.
This research promotes the understanding and usage of carbon-fiber-reinforced rubber, which could improve the performance of rubber products and facilitate their practical applications. Moreover, this study provides an effective method for studying the properties and mechanisms of rubber materials reinforced with other various fillers, which could be conducive to promoting the further development of the rubber industry.
Author Contributions
Conceptualization, X.Y., D.H., H.S. and C.Z.; software, X.S., D.H. and W.P.; validation, X.W., R.Z. and C.Z.; investigation, D.H., H.S. and X.W.; data curation, X.W. and R.Z.; writing—original draft preparation, X.Y. and X.S.; writing—review and editing, X.Y., X.S. and W.P.; supervision, X.Y. and W.P.; funding acquisition, X.Y., W.P. and X.S. All authors have read and agreed to the published version of the manuscript.
Funding
This research was supported by National Natural Science Foundation of China, grant numbers 12004178 and 52075538; Jiangsu Qing Lan Project (grant number 202050223RS004); Natural Science Foundation of Jiangsu Province, grant numbers BK20201336 and BK20211356; the Natural Science Foundation of Hunan Province, grant number 2023JJ30622; and the China Postdoctoral Science Foundation, grant number 2021M691579.
Institutional Review Board Statement
Not applicable.
Data Availability Statement
Data are contained within the article.
Conflicts of Interest
The authors declare no conflicts of interest.
Appendix A
The abbreviations used in this study and their corresponding full titles are summarized in Table A1.
Table A1.
Abbreviations and their corresponding full titles.
Table A1.
Abbreviations and their corresponding full titles.
| Serial Number | Abbreviations | Full Title | Location of First Appearance |
|---|---|---|---|
| 1 | mDE | Acid-modified diatomaceous earth | Paragraph 1, Section “1. Introduction” |
| 2 | CNTs | Carbon nanotubes | Paragraph 1, Section “1. Introduction” |
| 3 | HTT | Hydrothermally treated | Paragraph 1, Section “1. Introduction” |
| 4 | RUC | Repeatable unit cell | Paragraph 5, Section “1. Introduction” |
| 5 | ROM | Rule of mixture | Paragraph 5, Section “1. Introduction” |
References
- Kazmi, S.M.S.; Munir, M.J.; Wu, Y.-F. Application of waste tire rubber and recycled aggregates in concrete products: A new compression casting approach. Resour. Conserv. Recycl. 2021, 167, 105353. [Google Scholar] [CrossRef]
- Alam, M.N.; Kumar, V.; Jung, H.-S.; Park, S.-S. Fabrication of High-Performance Natural Rubber Composites with Enhanced Filler–Rubber Interactions by Stearic Acid-Modified Diatomaceous Earth and Carbon Nanotubes for Mechanical and Energy Harvesting Applications. Polymers 2023, 15, 3612. [Google Scholar] [CrossRef] [PubMed]
- Wang, J.; Li, S.; Yang, L.; Liu, B.; Xie, S.; Qi, R.; Zhan, Y.; Xia, H. Graphene-Based Hybrid Fillers for Rubber Composites. Molecules 2024, 29, 1009. [Google Scholar] [CrossRef] [PubMed]
- Shahamatifard, F.; Rodrigue, D.; Mighri, F. Thermal and mechanical properties of carbon-based rubber nanocomposites: A review. Plast. Rubber Compos. 2023, 52, 483–505. [Google Scholar] [CrossRef]
- Álvarez-Cortez, G.; Molina, F.; Urbano, B.F.; Dahrouch, M.; Hernández Santana, M.; Manchado, M.A.L.; Verdejo, R.; Aguilar Bolados, H. Design and Study of Novel Composites Based on EPDM Rubber Containing Bismuth (III) Oxide and Graphene Nanoplatelets for Gamma Radiation Shielding. Polymers 2024, 16, 633. [Google Scholar] [CrossRef]
- Sekar, P.; Noordermeer, J.W.; Anyszka, R.; Gojzewski, H.; Podschun, J.; Blume, A. Hydrothermally Treated Lignin as a Sustainable Biobased Filler for Rubber Compounds. ACS Appl. Polym. Mater. 2023, 5, 2501–2512. [Google Scholar] [CrossRef]
- Wang, H.; Meng, F.; Yi, M.; Fang, L.; Wang, Z.; Wang, S. Highly Strong and Damage-Resistant Natural Rubber Membrane via Self-Assembly and Construction of Double Network. Membranes 2022, 12, 933. [Google Scholar] [CrossRef] [PubMed]
- Wang, B.; Hu, J.; Liu, K.; Zhang, L.; Jiang, H.; Li, C. Reinforcement mechanism of silica surface hydroxyl, the opposite effect. Appl. Surf. Sci. 2023, 623, 157000. [Google Scholar] [CrossRef]
- Bouhamed, A.; Jöhrmann, N.; Naifar, S.; Böhm, B.; Hellwig, O.; Wunderle, B.; Kanoun, O. Collaborative Filler Network for Enhancing the Performance of BaTiO3/PDMS Flexible Piezoelectric Polymer Composite Nanogenerators. Sensors 2022, 22, 4181. [Google Scholar] [CrossRef]
- Tagliaro, I.; Cobani, E.; Carignani, E.; Conzatti, L.; D’Arienzo, M.; Giannini, L.; Martini, F.; Nardelli, F.; Scotti, R.; Stagnaro, P. The self-assembly of sepiolite and silica fillers for advanced rubber materials: The role of collaborative filler network. Appl. Clay Sci. 2022, 218, 106383. [Google Scholar] [CrossRef]
- Zhang, B.; Shao, X.; Tian, M.; Ning, N.; Zhang, L.; Wang, W. Mussel-inspired environmentally friendly dipping system for aramid fiber and its interfacial adhesive mechanism with rubber. Polymer 2022, 238, 124414. [Google Scholar] [CrossRef]
- Zhang, B.; Liang, T.; Shao, X.; Tian, M.; Ning, N.; Zhang, L.; Wang, W. Nondestructive Grafting of ZnO on the Surface of Aramid Fibers Followed by Silane Grafting to Improve its Interfacial Adhesion Property with Rubber. ACS Appl. Polym. Mater. 2021, 3, 4587–4594. [Google Scholar] [CrossRef]
- Yin, L.; Luo, Z.; Zhong, J.; Yang, B.; Ji, Y. Behaviour and mechanism of fatigue crack growth in aramid-fibre-reinforced styrene–butadiene rubber composites. Int. J. Fatigue 2020, 134, 105502. [Google Scholar] [CrossRef]
- Yin, L.; Zhou, Z.; Luo, Z.; Zhong, J.; Li, P.; Yang, B.; Yang, L. Reinforcing effect of aramid fibers on fatigue behavior of SBR/aramid fiber composites. Polym. Test. 2019, 80, 106092. [Google Scholar] [CrossRef]
- Mei, S.; Wang, J.; Wan, J.; Wu, X. Preparation Methods and Properties of CNT/CF/G Carbon-Based Nano-Conductive Silicone Rubber. Appl. Sci. 2023, 13, 6726. [Google Scholar] [CrossRef]
- Lozada, E.R.; Gutiérrez Aguilar, C.M.; Jaramillo Carvalho, J.A.; Sánchez, J.C.; Barrera Torres, G. Vegetable Cellulose Fibers in Natural Rubber Composites. Polymers 2023, 15, 2914. [Google Scholar] [CrossRef] [PubMed]
- Akbolat, M.C.; Katnam, K.B.; Soutis, C.; Potluri, P.; Sprenger, S.; Taylor, J. On mode-I and mode-II interlaminar crack migration and R-curves in carbon/epoxy laminates with hybrid toughening via core-shell rubber particles and thermoplastic micro-fibre veils. Compos. Part B Eng. 2022, 238, 109900. [Google Scholar] [CrossRef]
- Nag, A.; Simorangkir, R.B.; Sapra, S.; Buckley, J.L.; O’Flynn, B.; Liu, Z.; Mukhopadhyay, S.C. Reduced graphene oxide for the development of wearable mechanical energy-harvesters: A review. IEEE Sens. J. 2021, 21, 26415–26425. [Google Scholar] [CrossRef]
- Fang, Z.H.; Tu, Q.Z.; Shen, X.M.; Yang, X.; Liang, K.; Pan, M.; Chen, Z.Y. Biomimetic surface modification of UHMWPE fibers to enhance interfacial adhesion with rubber matrix via constructing polydopamine functionalization platform and then depositing zinc oxide nanoparticles. Surf. Interfaces 2022, 29, 101728. [Google Scholar] [CrossRef]
- Fang, Z.H.; Tu, Q.Z.; Chen, Z.Y.; Shen, X.M.; Pan, M.; Liang, K.; Yang, X. Study on catechol/tetraethylenepentamine and nano zinc oxide co-modifying ultrahigh molecular weight polyethylene fiber surface to improve interfacial adhesion. Polym. Adv. Technol. 2022, 33, 4072–4083. [Google Scholar] [CrossRef]
- He, J.; Huang, B.; Wang, L.; Cai, Z.; Zhang, J.; Feng, J. Enhancing Natural Rubber Tearing Strength by Mixing Ultra-High Molecular Weight Polyethylene Short Fibers. Polymers 2023, 15, 1768. [Google Scholar] [CrossRef] [PubMed]
- Victory, W. A Review on the Utilization of Waste Material in Asphalt Pavements. Environ. Sci. Pollut. Res. 2022, 29, 27279–27282. [Google Scholar] [CrossRef] [PubMed]
- Statnik, E.S.; Cvjetinovic, J.; Ignatyev, S.D.; Wassouf, L.; Salimon, A.I.; Korsunsky, A.M. Hair-Reinforced Elastomer Matrix Composites: Formulation, Mechanical Testing, and Advanced Microstructural Characterization. Polymers 2023, 15, 4448. [Google Scholar] [CrossRef] [PubMed]
- Chao, Q.; Maneengam, A.; Margabandu, S.; Jindal, P.; Patil, P.Y.; Zheng, G.-W.; Selvaraj, R. Mechanical and damping property evaluation of jute fiber reinforced composite periodic core sandwich panels. J. Nat. Fibers 2022, 19, 11424–11434. [Google Scholar] [CrossRef]
- Aslani, F.; Dale, R.; Hamidi, F.; Valizadeh, A. Mechanical and shrinkage performance of 3D-printed rubberised engineered cementitious composites. Constr. Build. Mater. 2022, 339, 127665. [Google Scholar] [CrossRef]
- Sharma, A.; Joshi, S.C. Enhancement in fatigue performance of FRP composites with various fillers: A review. Compos. Struct. 2023, 309, 116724. [Google Scholar] [CrossRef]
- Velmurugan, N.; Manimaran, G.; Ravi, S.; Jayabalakrishnan, D. Effect of silanised reinforcements on thermal, wear, visco-elastic and fatigue behaviour of stitched E-glass fibre-reinforced epoxy hybrid composite. J. Rubber Res. 2021, 24, 41–50. [Google Scholar] [CrossRef]
- Lamy-Mendes, A.; Pontinha, A.D.R.; Santos, P.; Durães, L. Aerogel Composites Produced from Silica and Recycled Rubber Sols for Thermal Insulation. Materials 2022, 15, 7897. [Google Scholar] [CrossRef] [PubMed]
- Mahendra, I.P.; Wirjosentono, B.; Tamrin, T.; Ismail, H.; Mendez, J.A.; Causin, V. The effect of nanocrystalline cellulose and TEMPO-oxidized nanocellulose on the compatibility of polypropylene/cyclic natural rubber blends. J. Thermoplast. Compos. Mater. 2022, 35, 2146–2161. [Google Scholar] [CrossRef]
- El-Wakil, A.E.A.; Abd-Elbasseer, M.; El-Basheer, T.M. Mechanical and Acoustical Properties of Eichhornia crassipes (Water Hyacinth) Fiber-Reinforced Styrene Butadiene Rubber. Polym. Compos. 2021, 42, 3732–3745. [Google Scholar] [CrossRef]
- Yang, X.; Tang, S.; Shen, X.; Peng, W. Research on the Sound Insulation Performance of Composite Rubber Reinforced with Hollow Glass Microsphere Based on Acoustic Finite Element Simulation. Polymers 2023, 15, 611. [Google Scholar] [CrossRef] [PubMed]
- Miedzianowska, J.; Masłowski, M.; Strzelec, K. Thermoplastic Elastomeric Composites Filled with Lignocellulose Bioadditives, Part 2: Flammability, Thermo-Oxidative Aging Resistance, Mechanical and Barrier Properties. Materials 2020, 13, 1608. [Google Scholar] [CrossRef] [PubMed]
- Enieb, M.; Diab, A.; Yang, X. Short- and long-term properties of glass fiber reinforced asphalt mixtures. Int. J. Pavement Eng. 2021, 22, 64–76. [Google Scholar] [CrossRef]
- Xu, X.; Yao, X.; Dong, Y.; Yang, H.; Yan, H. Mechanical behaviors of non-orthogonal fabric rubber seal. Compos. Struct. 2021, 259, 113453. [Google Scholar] [CrossRef]
- He, H.; Wu, P.; Yang, Z.; Shi, Z.; Yu, W.; Liu, F.; Zhu, F.; Zheng, Q.; Zhang, D.; Li, S. A Facile Way to Modify Polyester Fabric to Enhance the Adhesion Behavior to Rubber. Coatings 2022, 12, 1344. [Google Scholar] [CrossRef]
- ASTM D3039; Standard Test Method for Tensile Properties of Polymer Matrix Composite Materials. ASTM International: West Conshehoken, PA, USA, 2000.
- ASTM D7264; Standard Test Method for Flexural Properties of Polymer Matrix Composite Materials. ASTM International: West Conshehoken, PA, USA, 2000.
- Láštic, D.; Řehák, K.; Prokop, A.; Krpalek, D.; Šplíchal, J.; Žlábek, P. An Initial Case Study of the Computational Modeling of Cord–Rubber Segments. Appl. Sci. 2024, 14, 1117. [Google Scholar] [CrossRef]
- Yang, J.; Lou, W. Molecule Dynamics Simulation of the Effect of Oxidative Aging on Properties of Nitrile Rubber. Polymers 2022, 14, 226. [Google Scholar] [CrossRef] [PubMed]
- Heydari, A.; Esmizadeh, E.; Vahidifar, A.; Naderi, G.; Rodrigue, D. Real 3D Structure-Based Finite Element Simulation of Elastomer Foams: Effect of the Foaming Agent Content. Ind. Eng. Chem. Res. 2022, 61, 7881–7890. [Google Scholar] [CrossRef]
- Singaravel, D.K.; Sharma, S.; Kumar, P. Recent progress in experimental and molecular dynamics study of carbon nanotube reinforced rubber composites: A review. Polym.-Plast. Technol. Mater. 2022, 61, 1792–1825. [Google Scholar] [CrossRef]
- Fathi, H.; Khosravi, M.; El-Sayegh, Z.; El-Gindy, M. An Advancement in Truck-Tire–Road Interaction Using the Finite Element Analysis. Mathematics 2023, 11, 2462. [Google Scholar] [CrossRef]
- Ma, Y.; Yuan, X.; Jiang, R.; Liao, J.; Yu, R.; Chen, Y.; Liao, L. Molecular Dynamic and Dissipative Particle Dynamic Simulation on the Miscibility of NR/CR Blends. Polymers 2023, 15, 856. [Google Scholar] [CrossRef] [PubMed]
- Sodeifian, G.; Nikooamal, H.R.; Yousefi, A.A. Molecular dynamics study of epoxy/clay nanocomposites: Rheology and molecular confinement. J. Polym. Res. 2012, 19, 9897. [Google Scholar] [CrossRef]
- Zhang, D.; Dong, H.; Zhao, S.; Yan, W.; Wang, Z. Effect of Impact Angle on the Impact Mechanical Properties of Bionic Foamed Silicone Rubber Sandwich Structure. Polymers 2023, 15, 688. [Google Scholar] [CrossRef] [PubMed]
- Jagadeesh, G.; Gangi Setti, S. A review on micromechanical methods for evaluation of mechanical behavior of particulate reinforced metal matrix composites. J. Mater. Sci. 2020, 55, 9848–9882. [Google Scholar] [CrossRef]
- Kundalwal, S.I. Review on micromechanics of nano-and micro-fiber reinforced composites. Polym. Compos. 2018, 39, 4243–4274. [Google Scholar] [CrossRef]
- Fedotov, A.F. Hybrid model of homogenization of engineering elastic moduli of composites reinforced with ellipsoid particles. Compos. Part B Eng. 2020, 182, 107585. [Google Scholar] [CrossRef]
- Ebrahimi, F.; Dabbagh, A. Vibration analysis of multi-scale hybrid nanocomposite plates based on a Halpin-Tsai homogenization model. Compos. Part B Eng. 2019, 173, 106955. [Google Scholar] [CrossRef]
- Fredi, G.; Dorigato, A.; Fambri, L.; Pegoretti, A. Detailed experimental and theoretical investigation of the thermomechanical properties of epoxy composites containing paraffin microcapsules for thermal management. Polym. Eng. Sci. 2020, 60, 1202–1220. [Google Scholar] [CrossRef]


Disclaimer/Publisher’s Note: The statements, opinions and data contained in all publications are solely those of the individual author(s) and contributor(s) and not of MDPI and/or the editor(s). MDPI and/or the editor(s) disclaim responsibility for any injury to people or property resulting from any ideas, methods, instructions or products referred to in the content. |
© 2024 by the authors. Licensee MDPI, Basel, Switzerland. This article is an open access article distributed under the terms and conditions of the Creative Commons Attribution (CC BY) license (https://creativecommons.org/licenses/by/4.0/).