

Influence of Polymer Fibre Reinforcement on Concrete Anchor Breakout Failure Capacity

Abstract
:1. Introduction
2. Theoretical Background
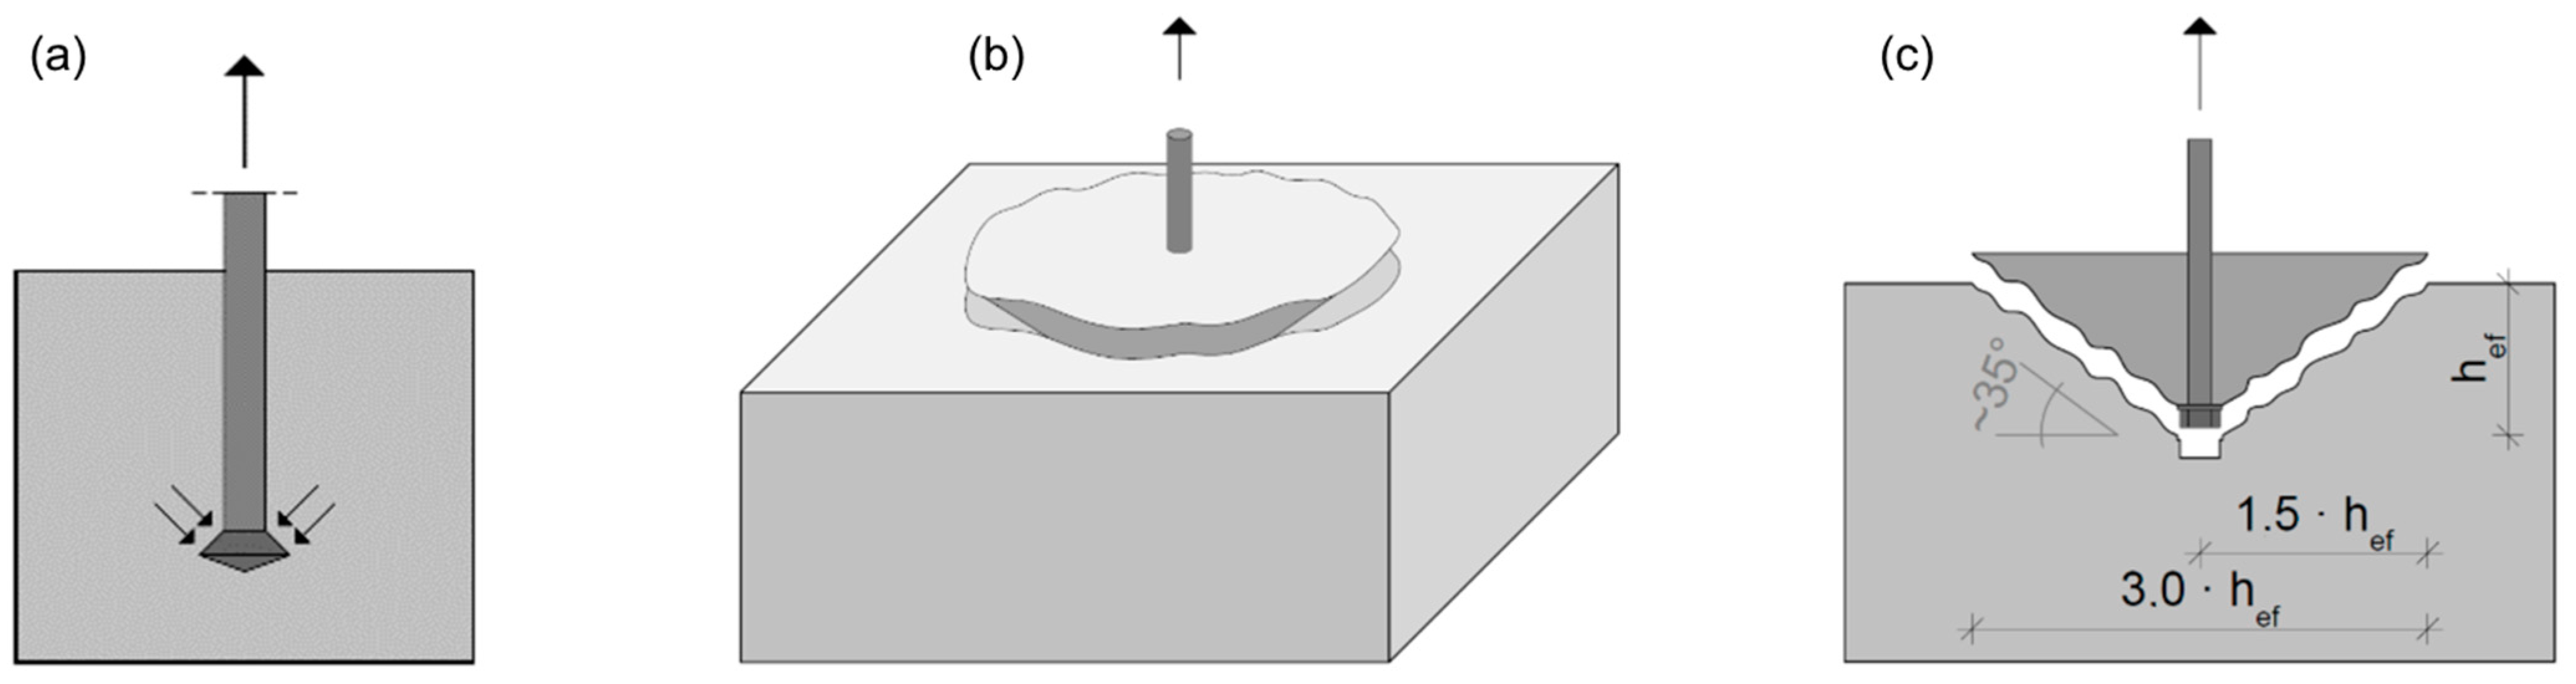
2.1. Basic Principles of Fastening Technology
2.2. Current Knowledge on the Influence of Fibres in Concrete Anchorages
3. Experimental Investigations
Experimental Programme
4. Materials
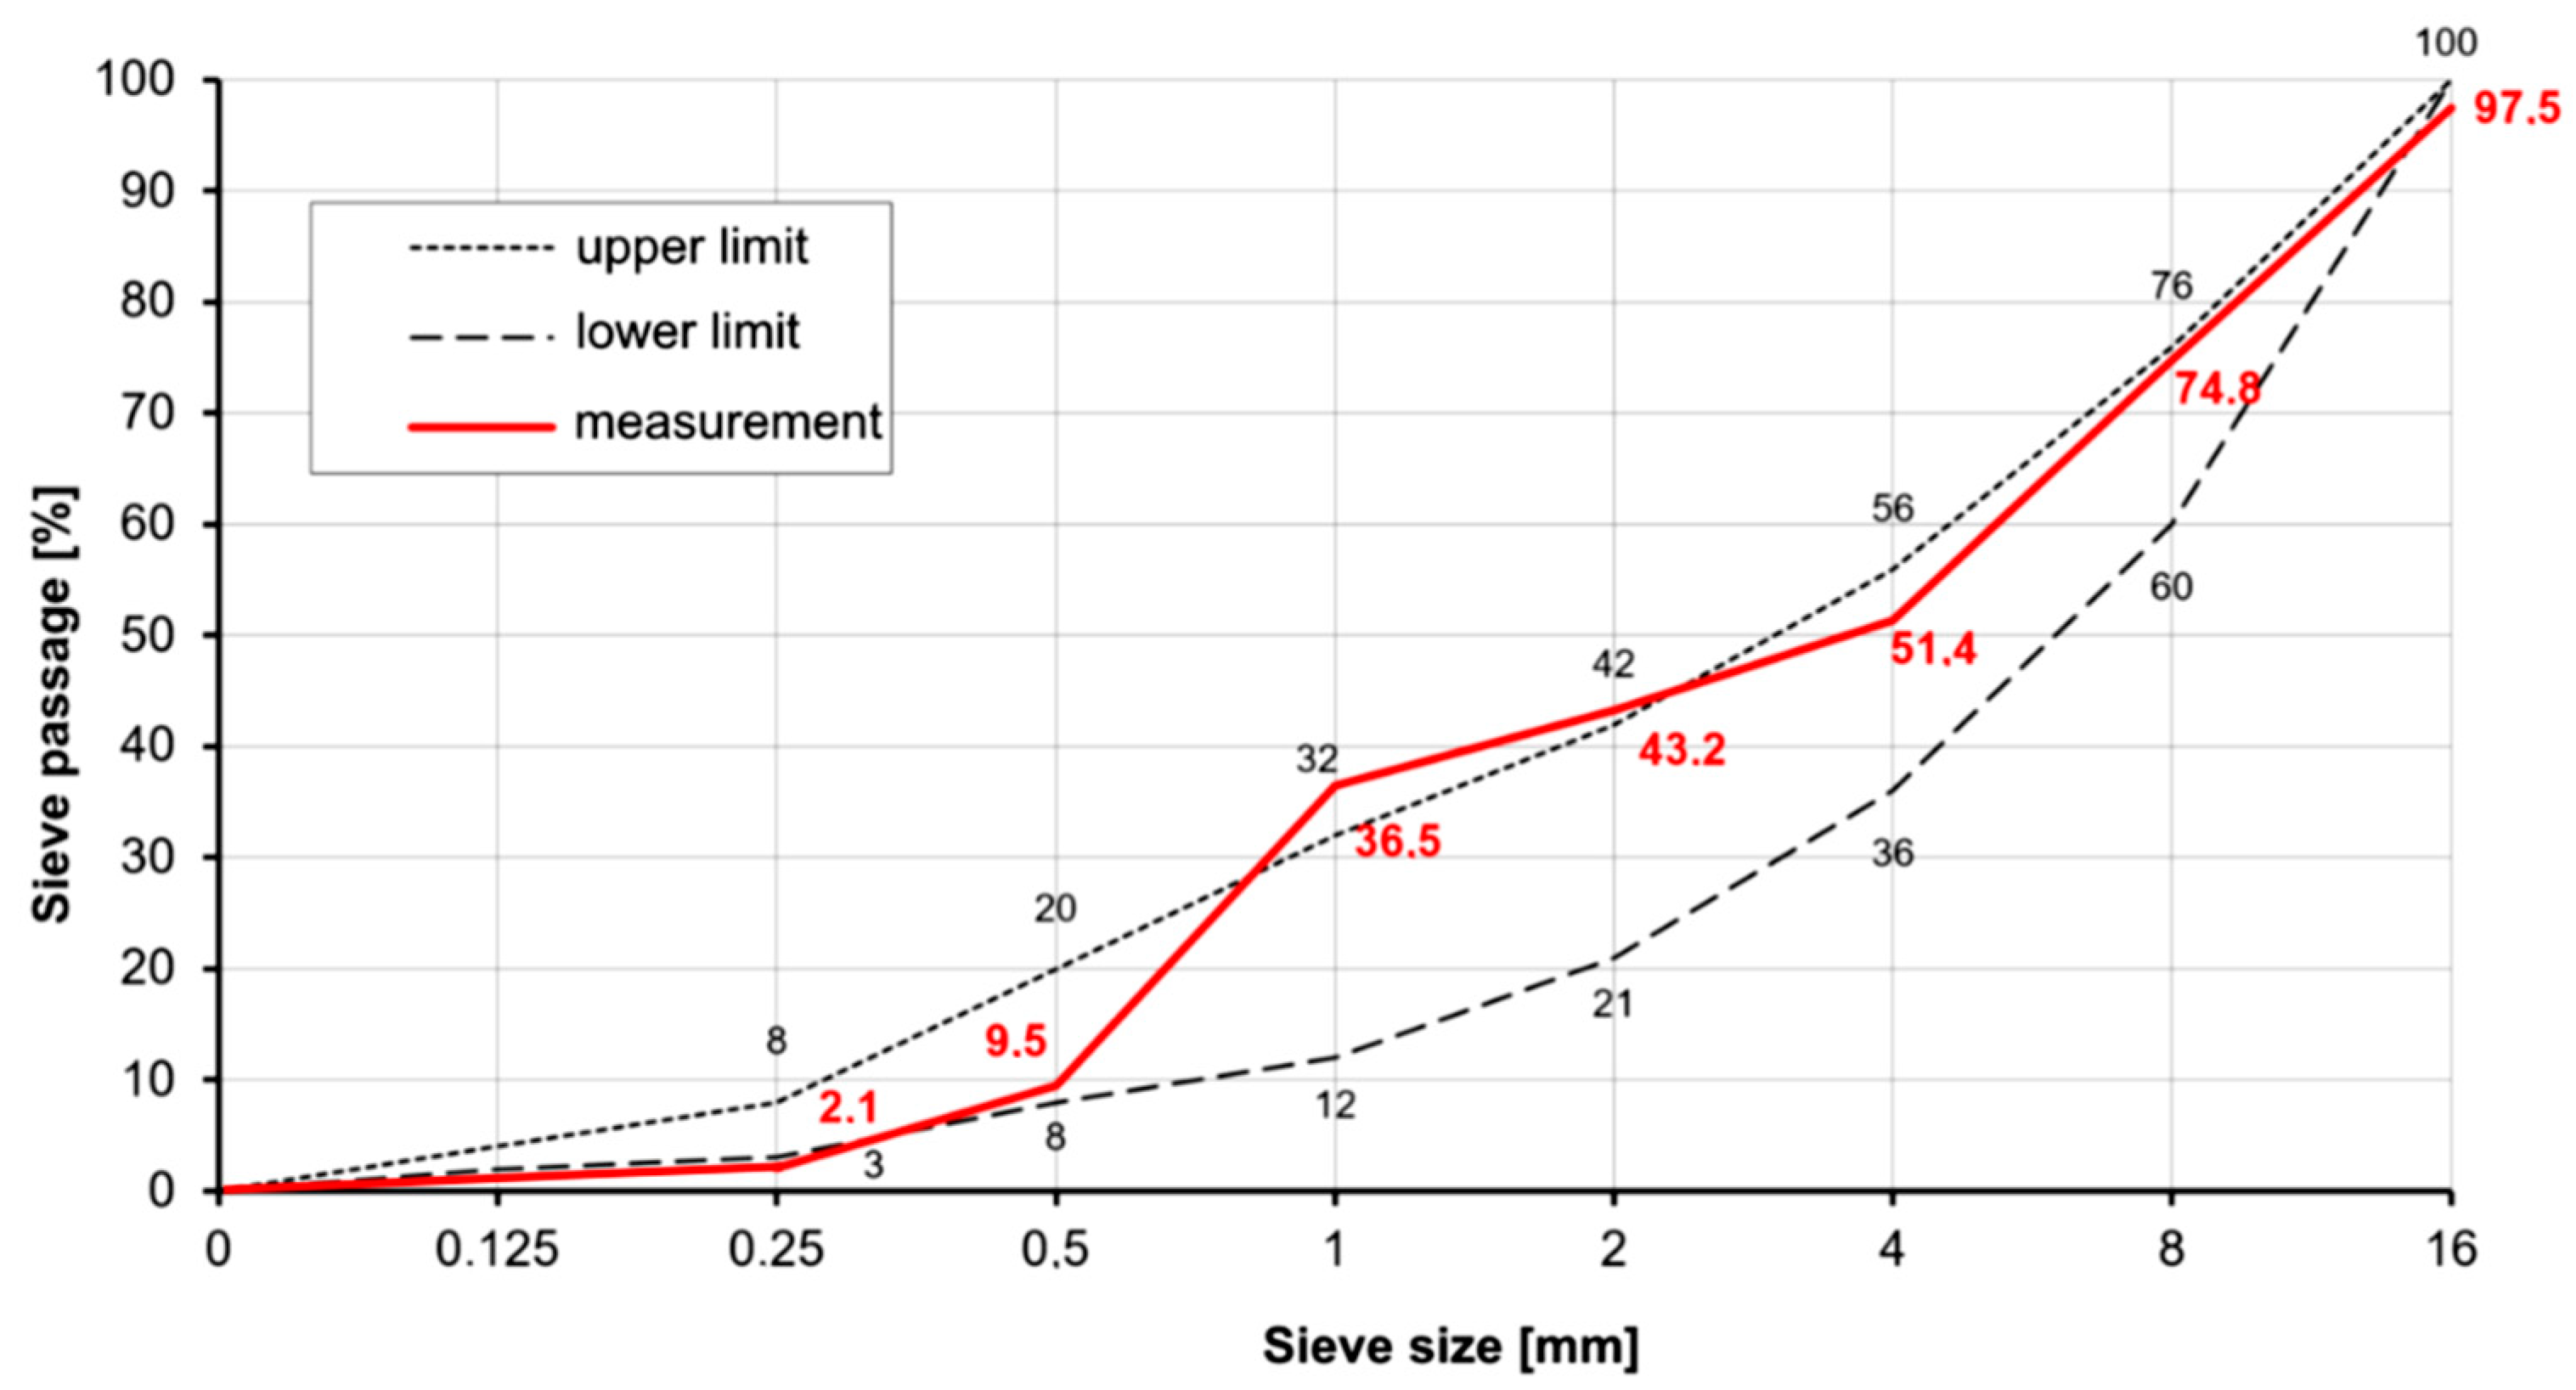
4.1. Concrete
4.1.1. Fibre Reinforcement
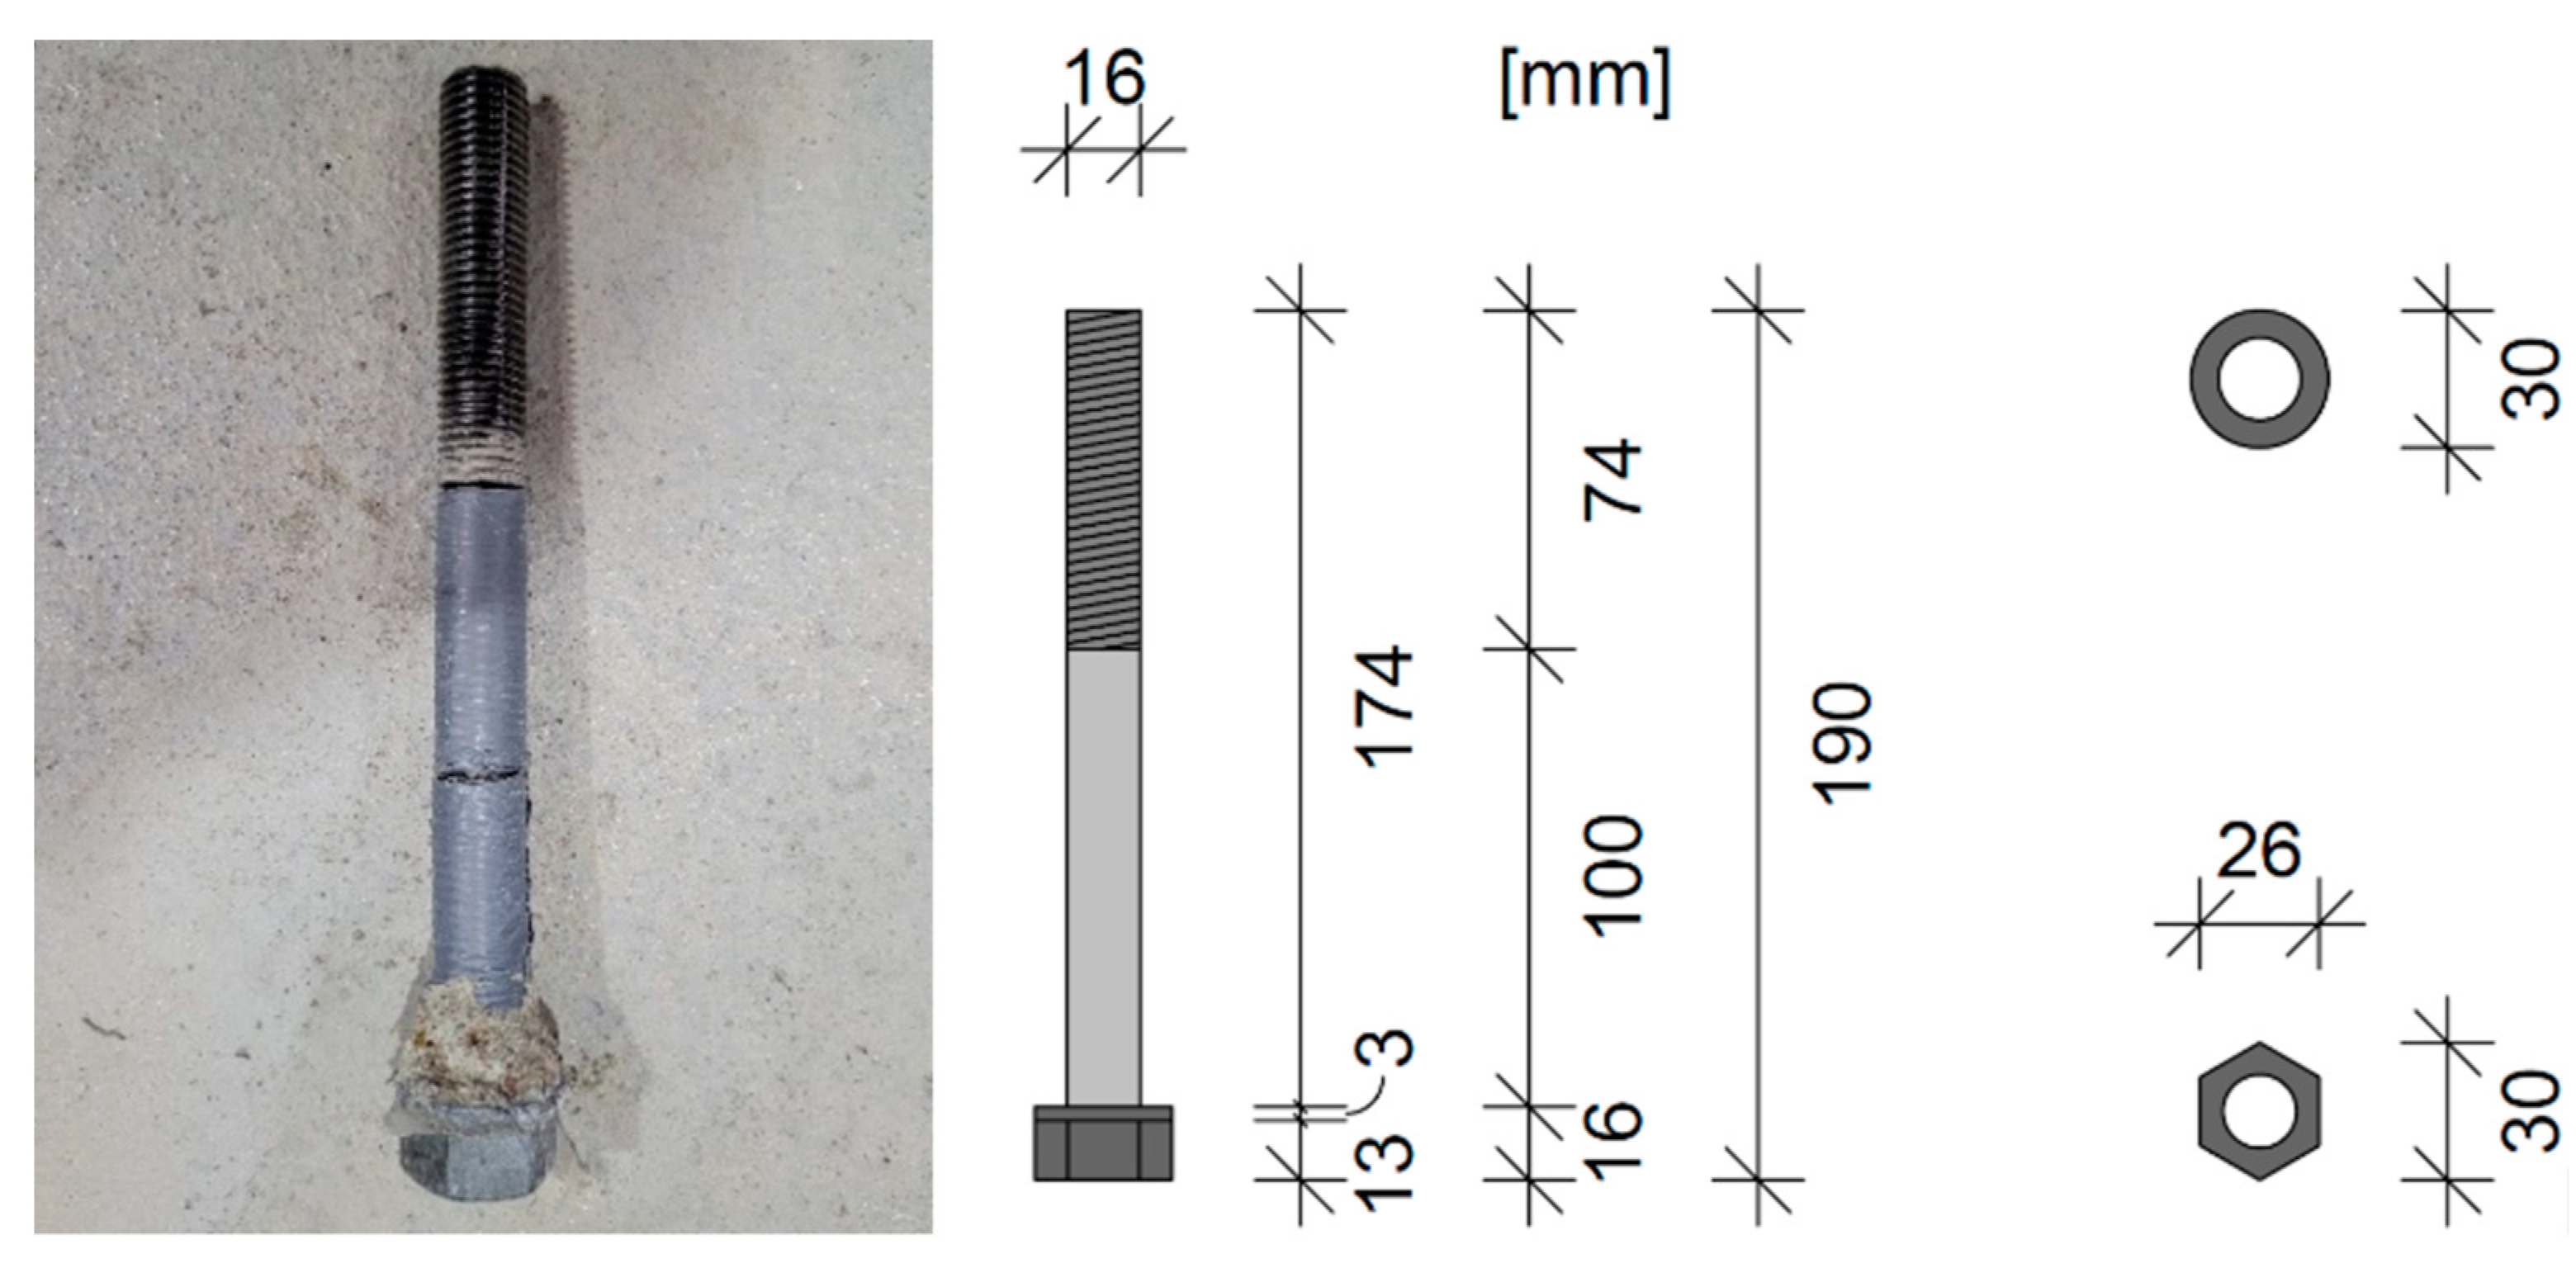
4.1.2. Anchoring Elements
4.2. Experiment Setup and Execution
5. Overview of Test Results
6. Statistical Interpretations and Predictive Modelling
7. Conclusions
- (1)
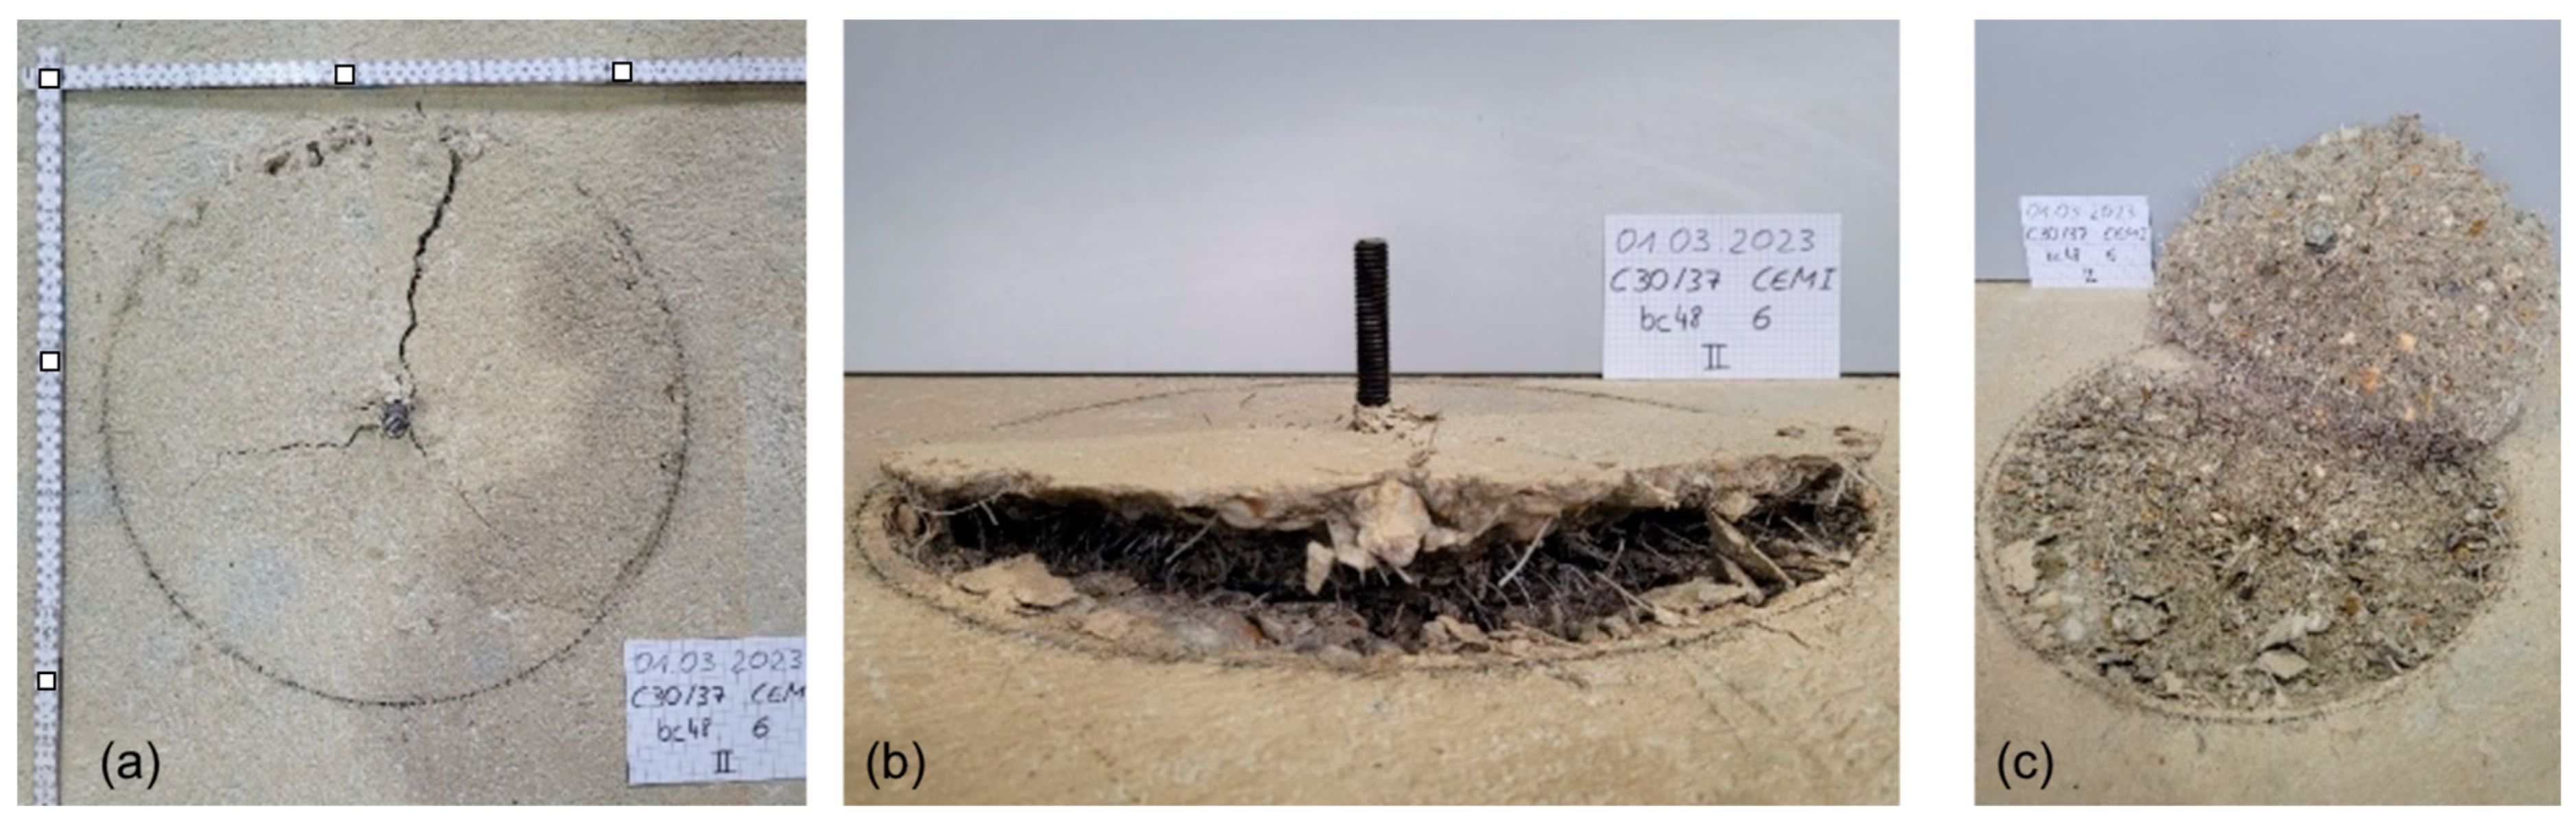
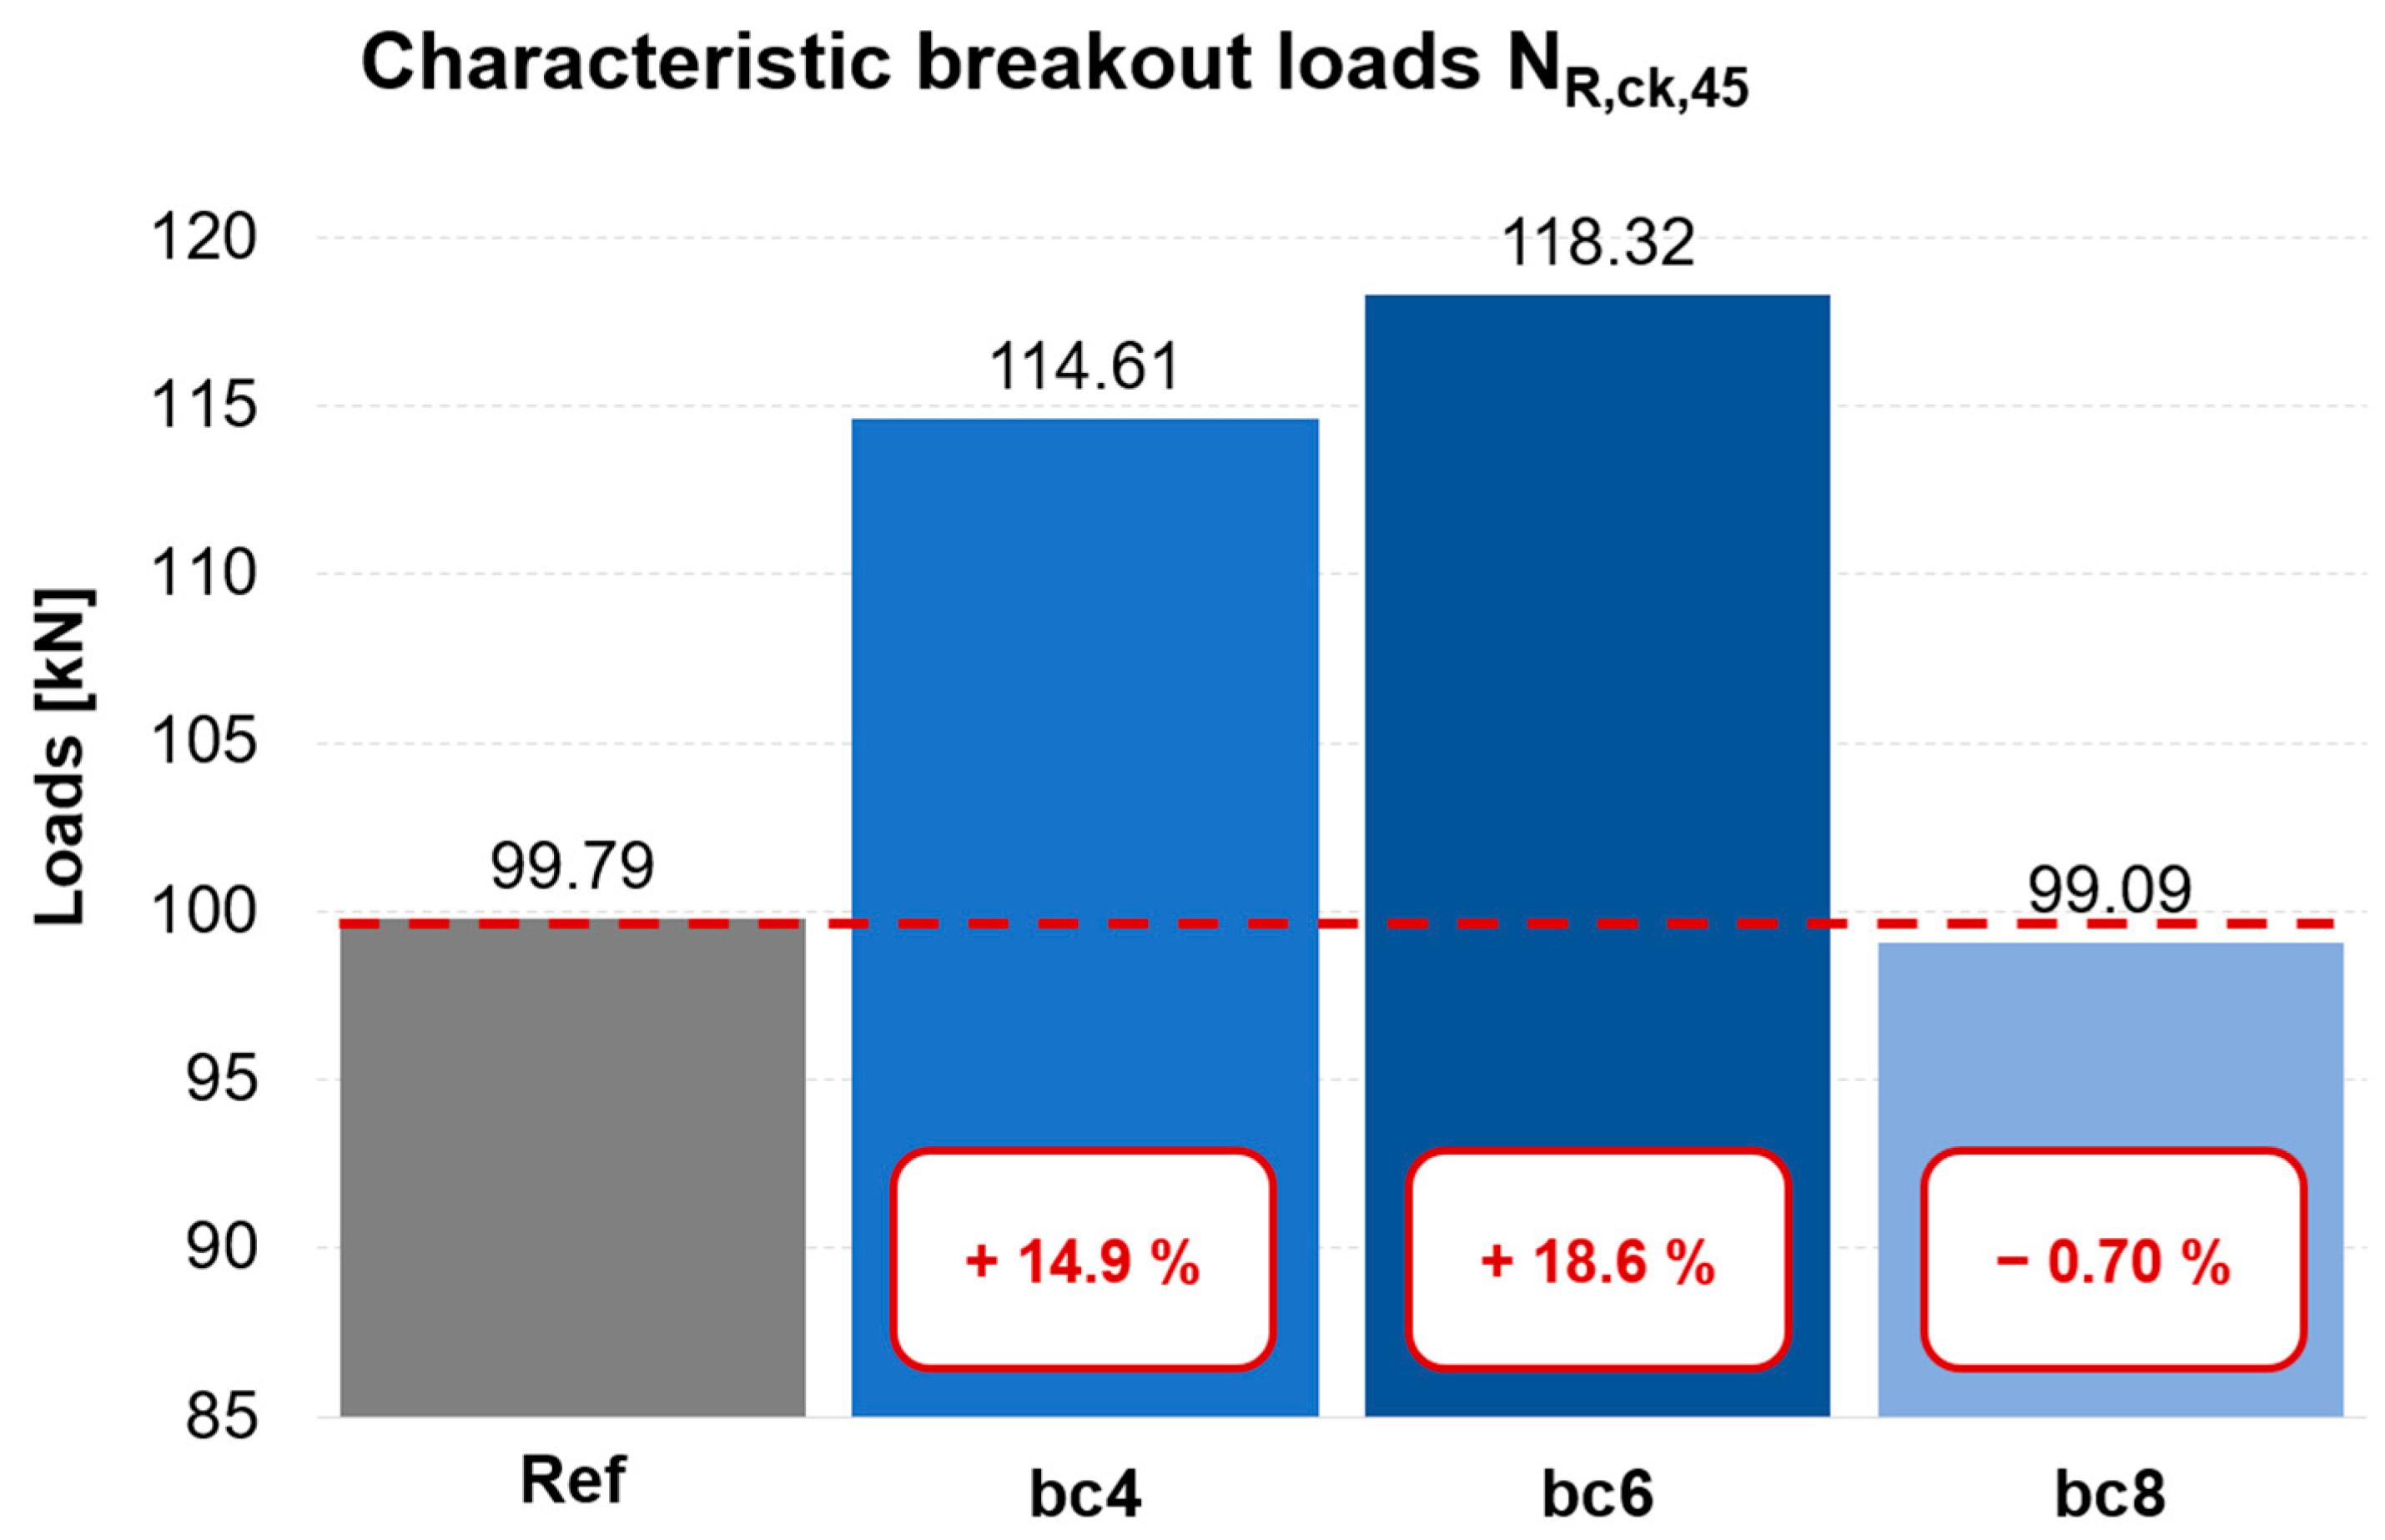
- A positive influence of the fibres was observed in breakout test series bc4 and bc6. The normalised tensile loads based on the cube compressive strength were higher for the fibre-reinforced concrete than for the reference concrete in these cases. Overall, the polymer fibre reinforcement contributed significantly to an increased breakout load in these cases.
- (2)
- It is well known, that the addition of Polymer-Fibres has decisive influence on residual strength properties (post-ductile behaviour—toughness) and minor influence on the axial tensile, splitting and flexural tensile strength (LOP) at failure. Apart from the favourable anchor resistance and ductile post-cracking behaviour of the polymer fibre-reinforced concrete in tests bc4 and bc6, the other results were within the range of the values of the reference concrete. The increased strength of the polymer fibre concrete is mainly due to the different mix designs compared to the mix design of the reference concrete, which is assumed to also lead to an increased bond strength of the fibres and hence a slightly higher contribution thereof. A further optimised mix may allow stronger contribution of fibres in bc8.
- (3)
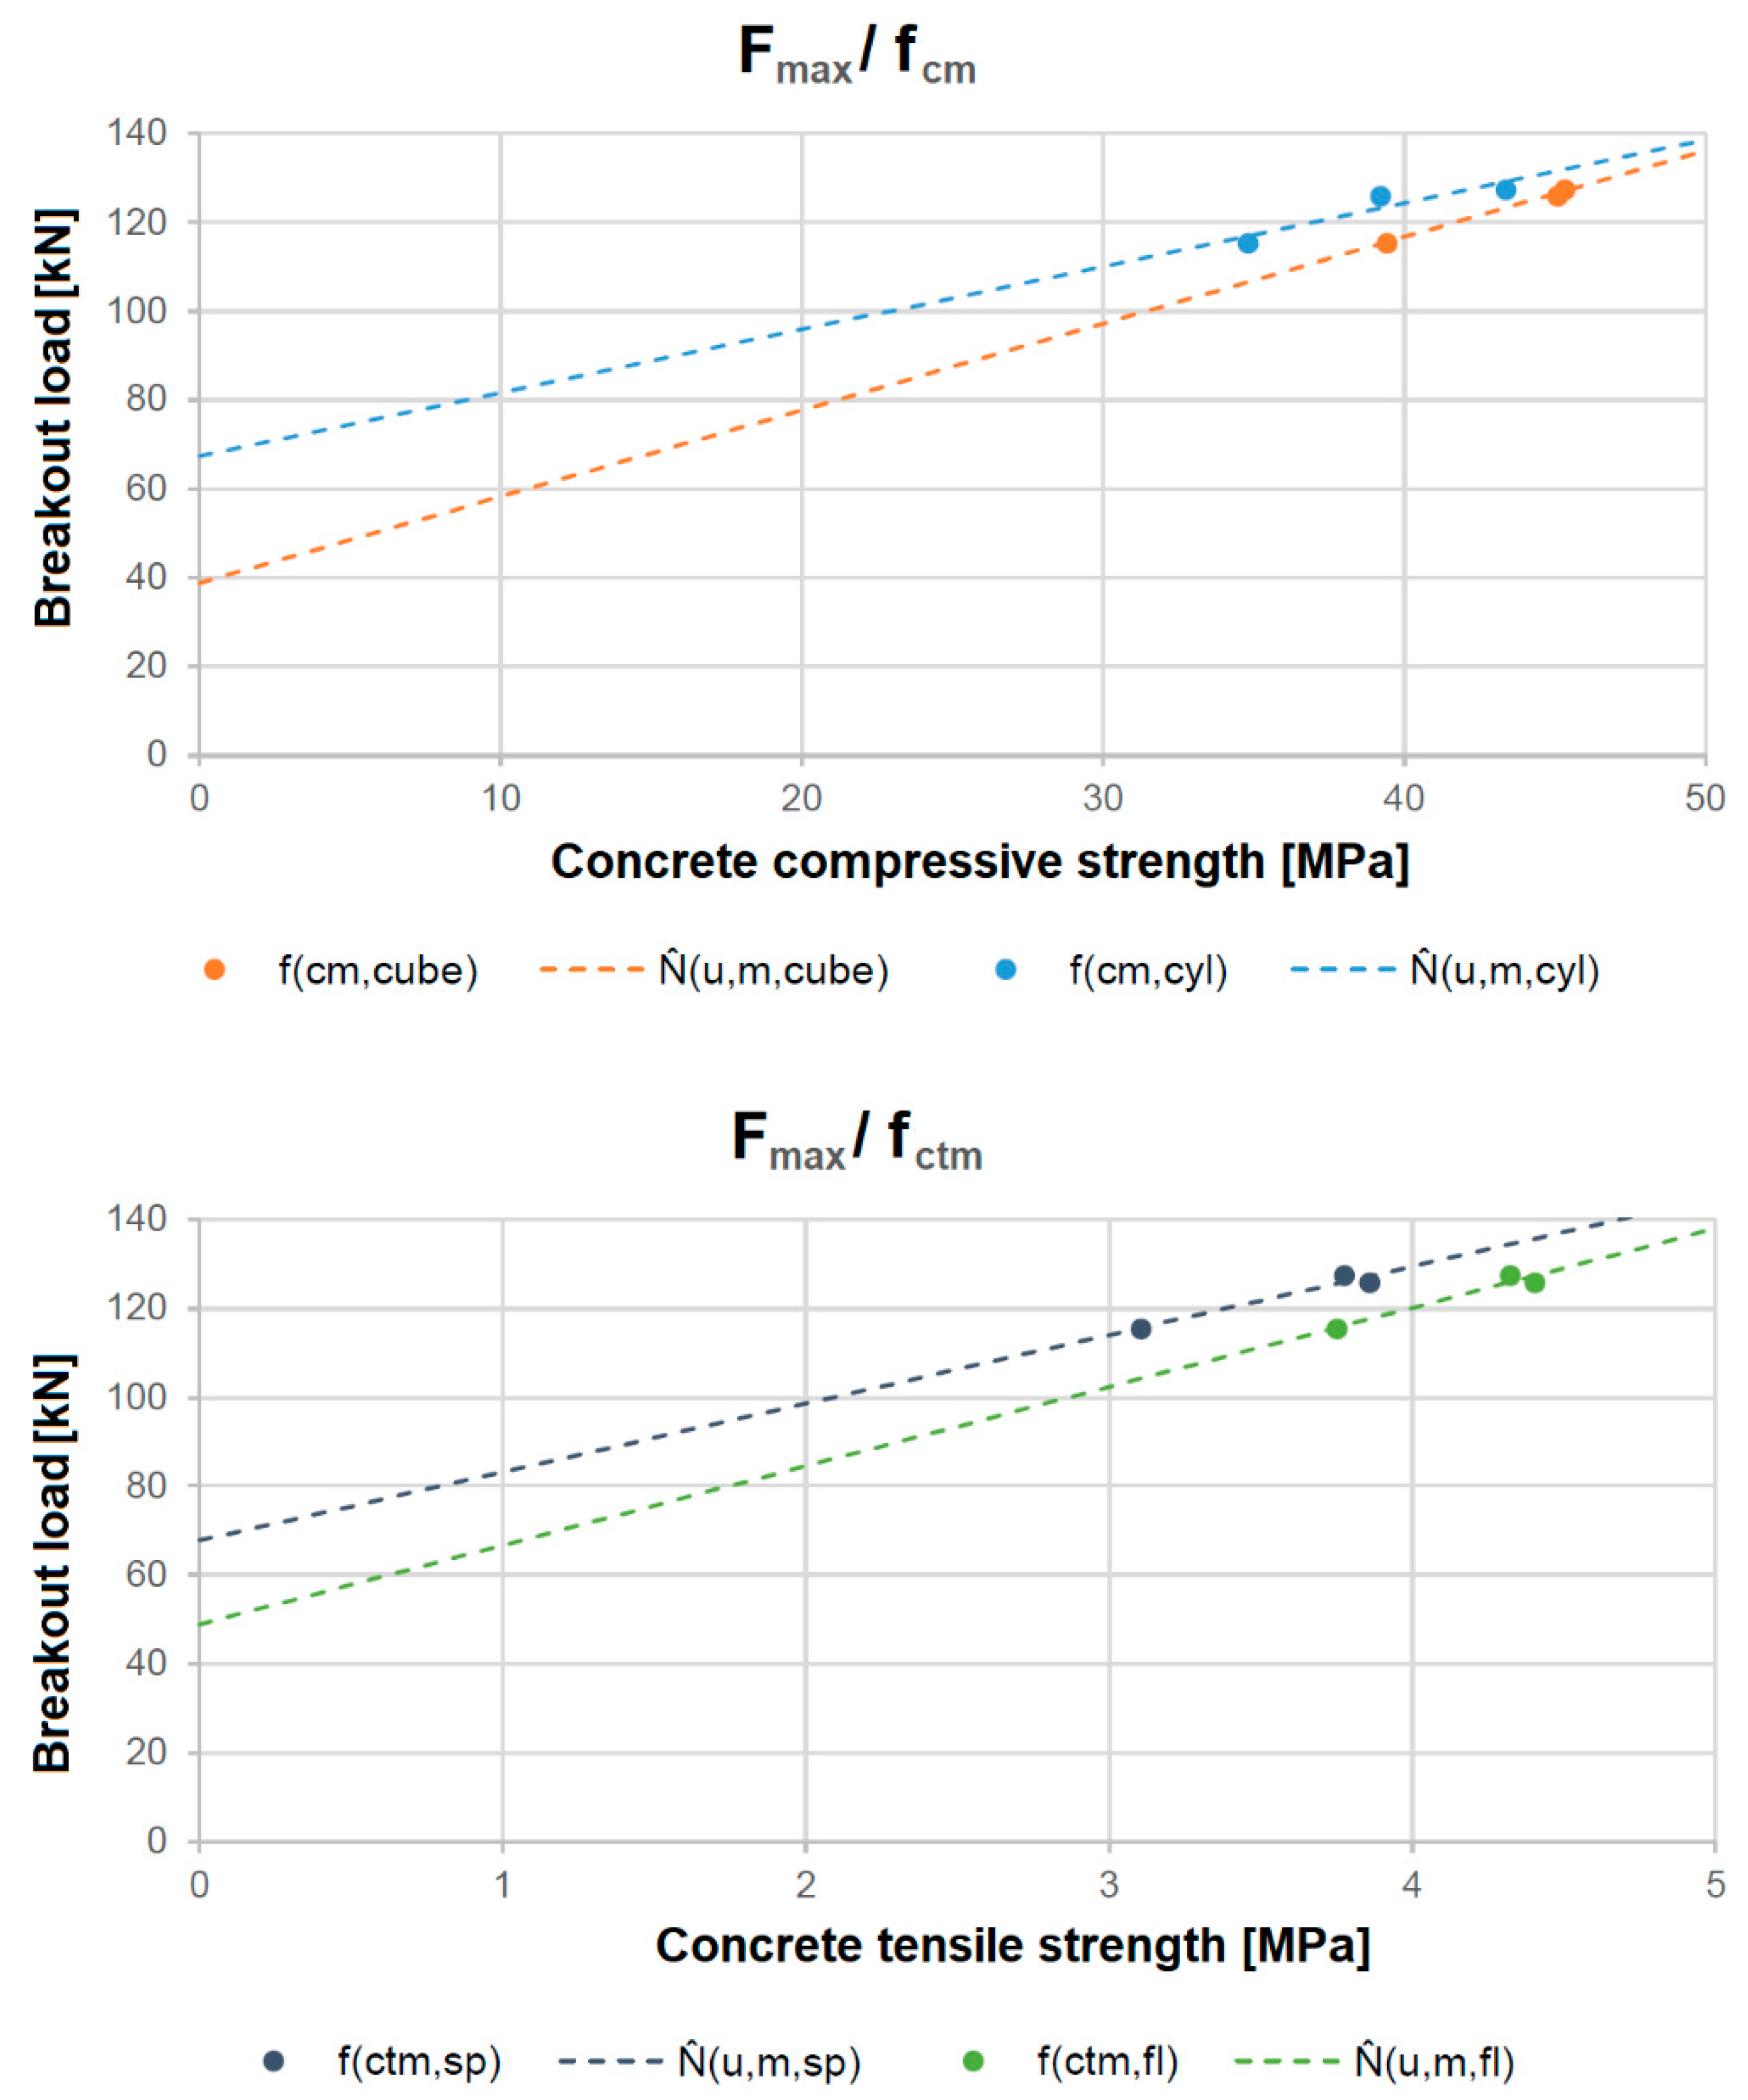
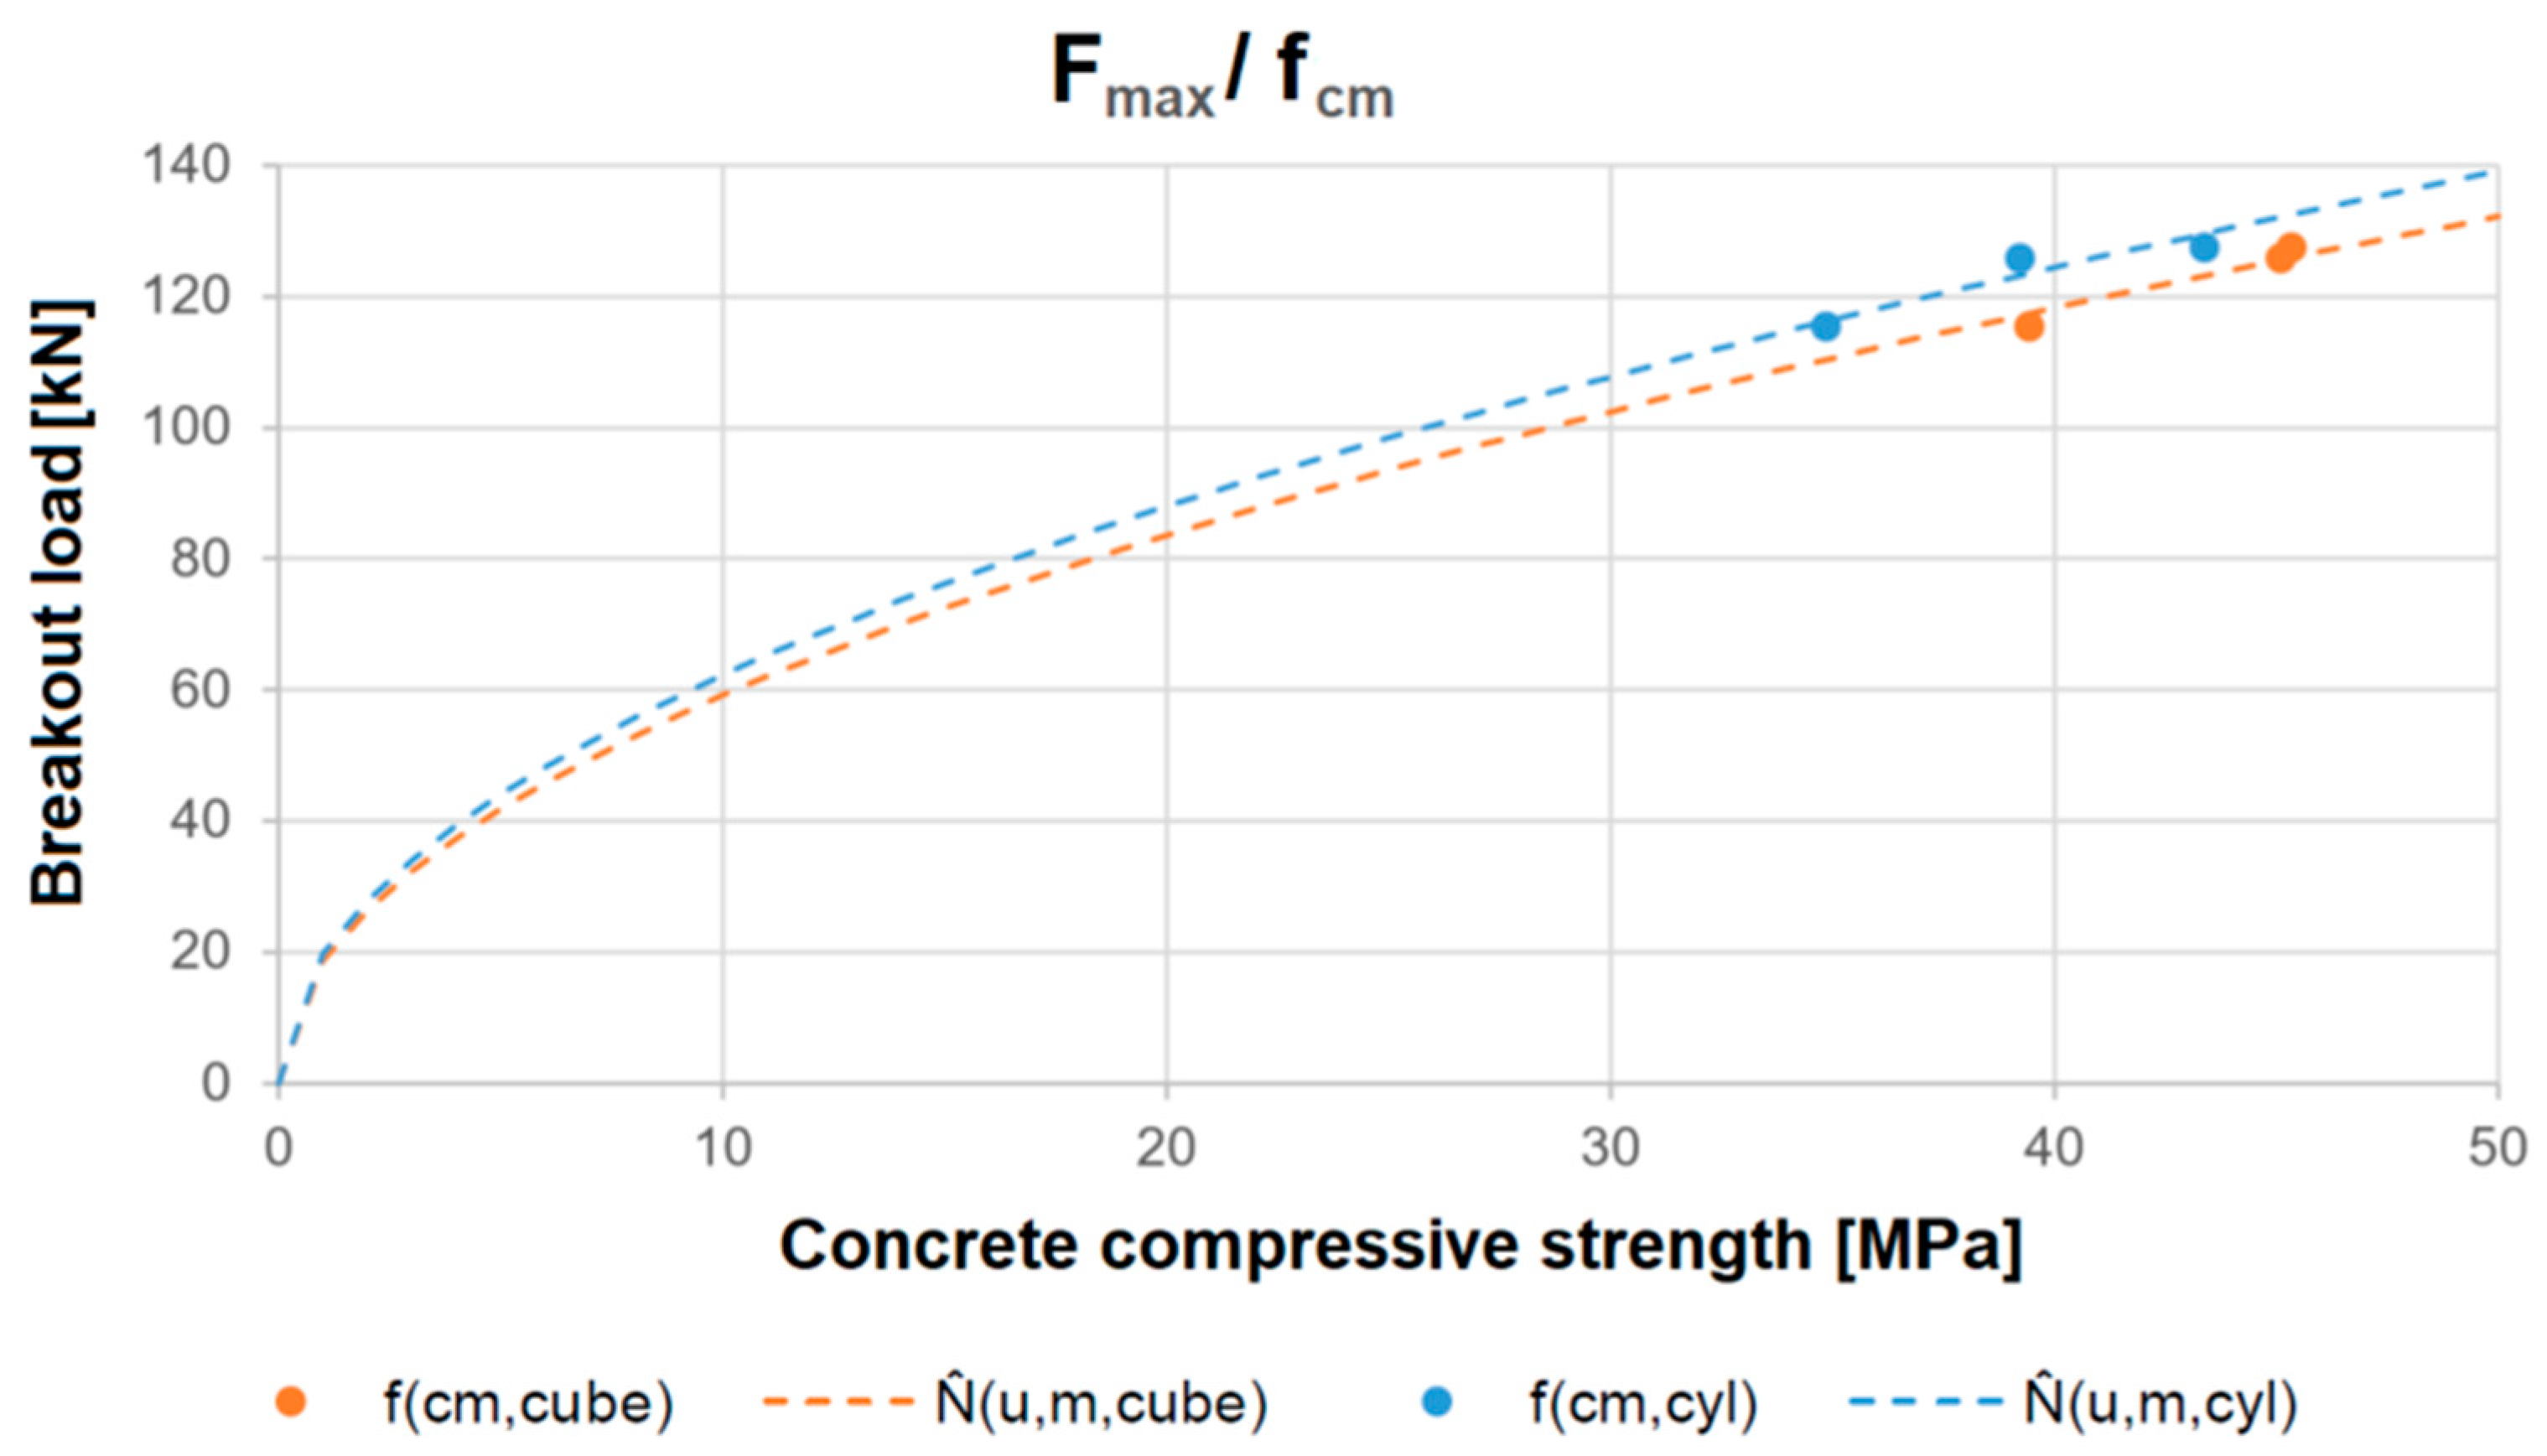
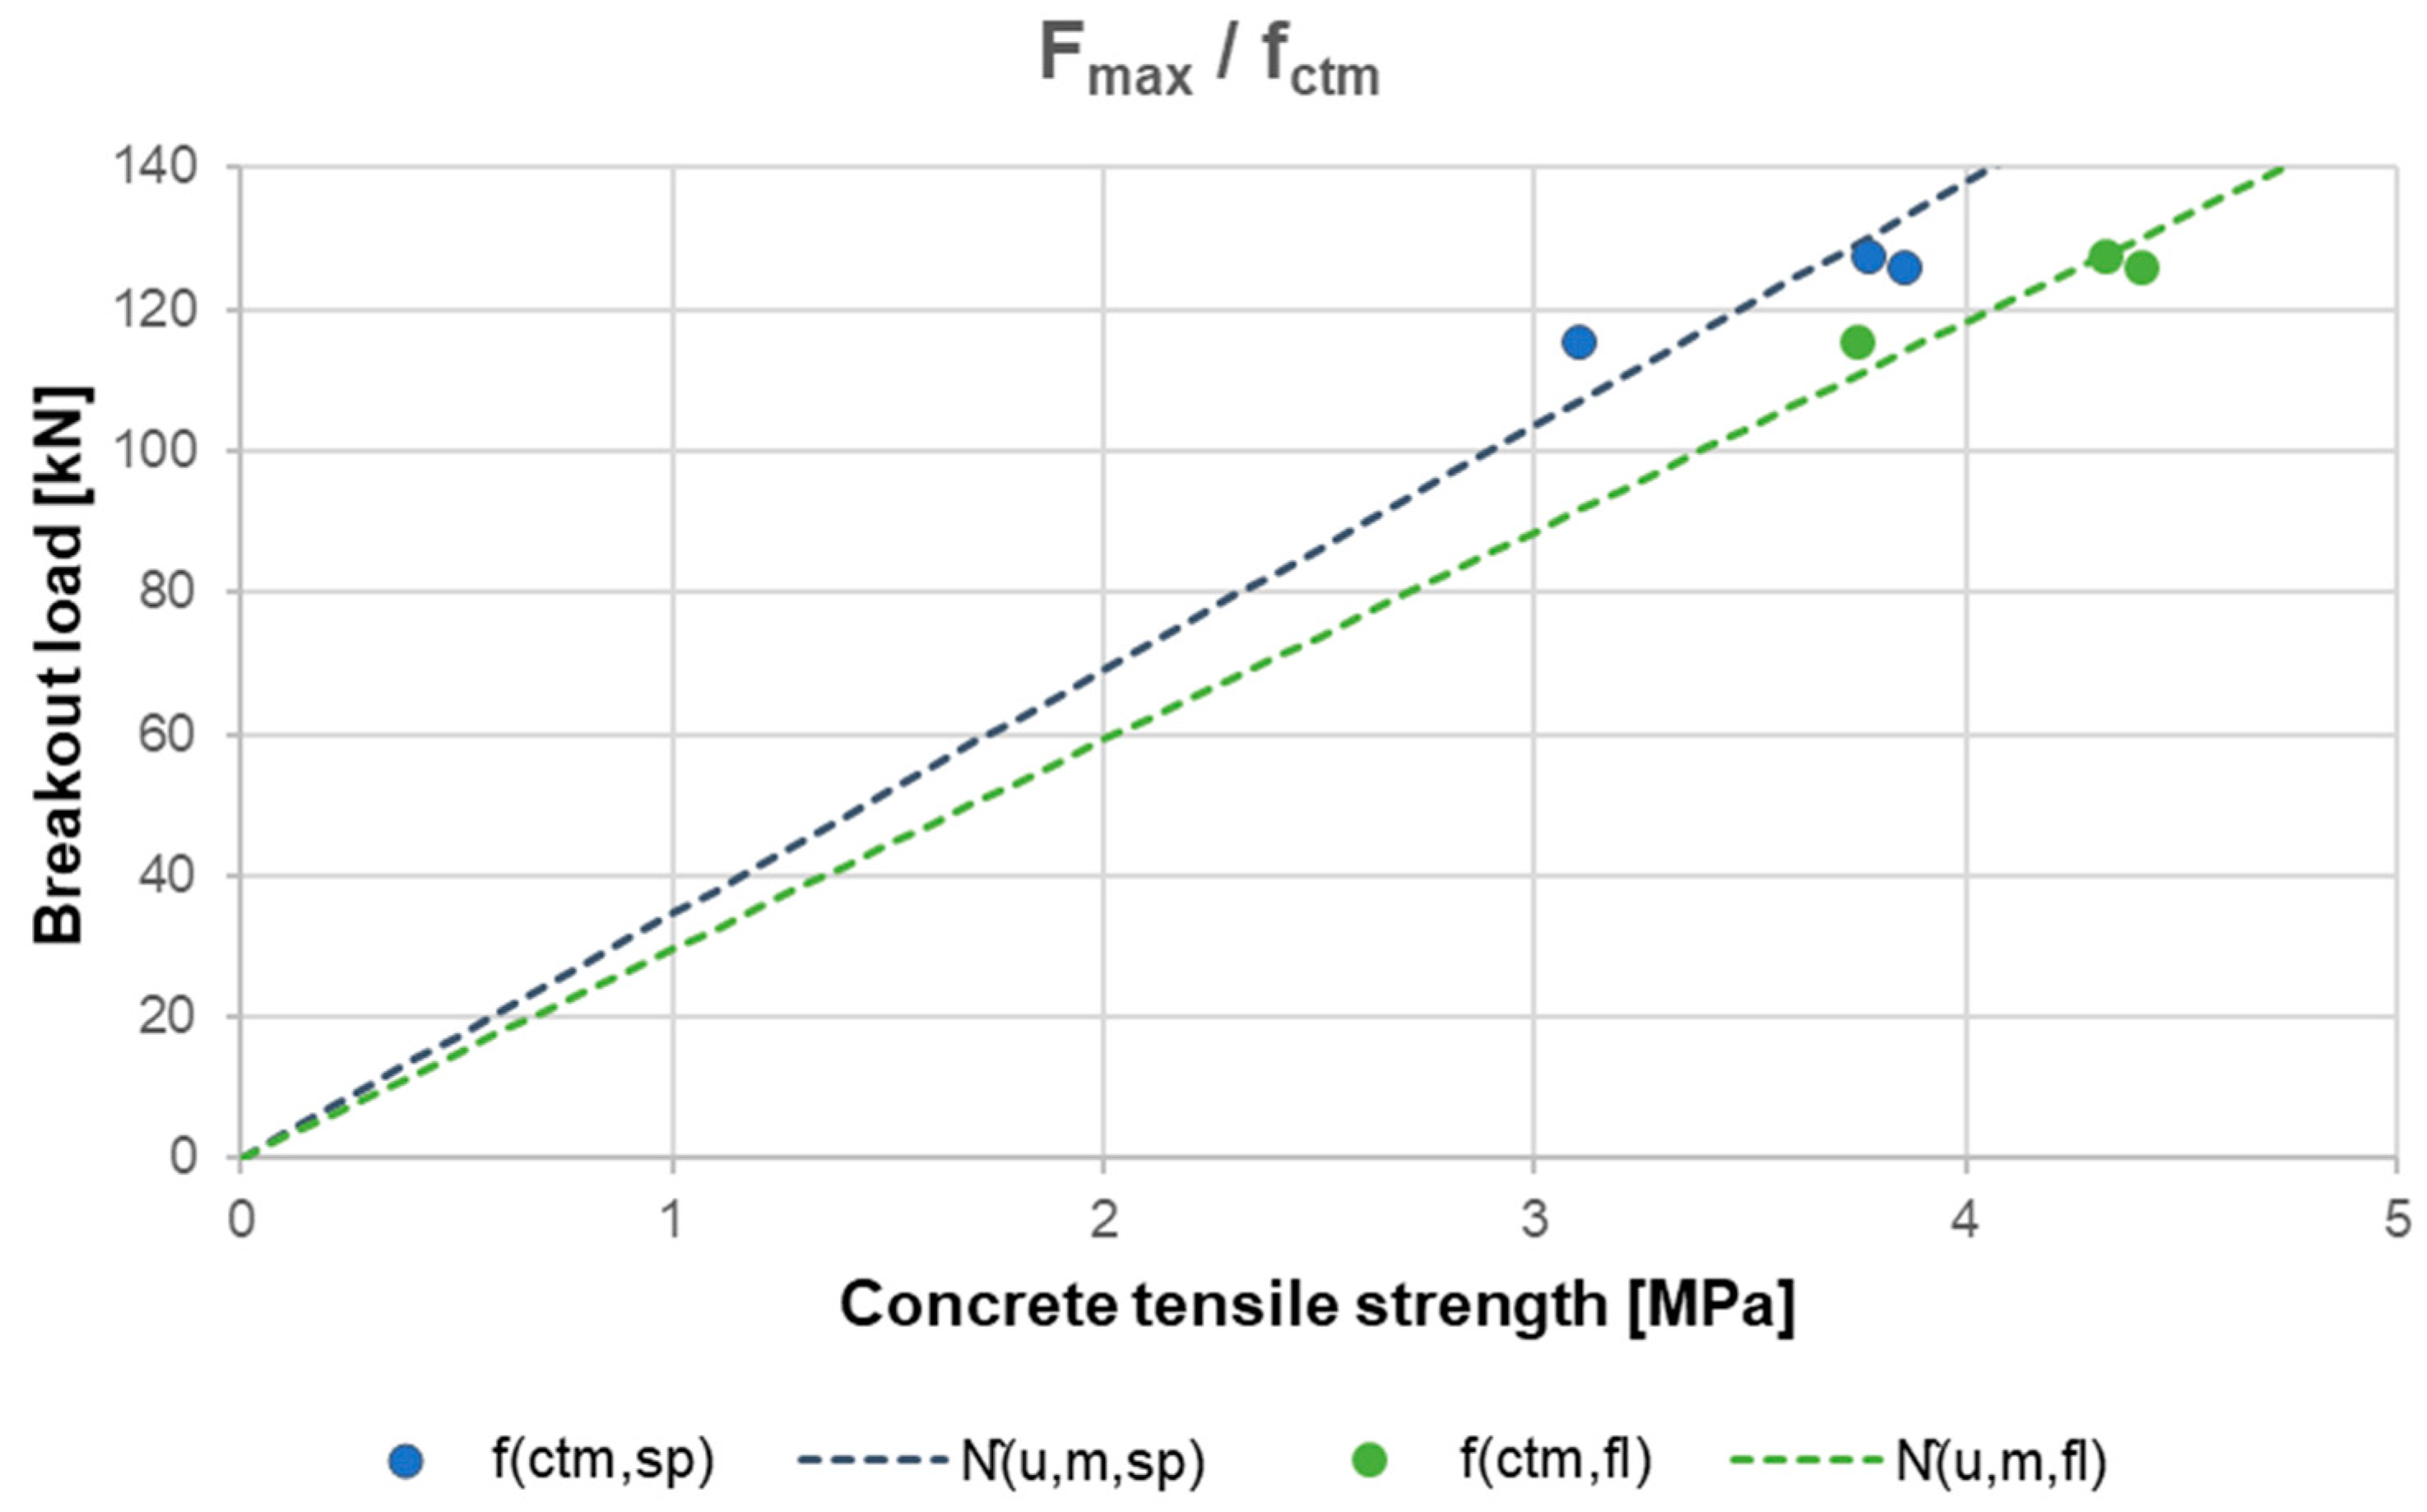
- Based on the test results, and with various failure load-prediction approaches, it is possible to estimate the load-bearing capacity of fastening elements in polymer fibre concrete. The correlations with cube compressive strength have proven to be particularly accurate estimation parameters. Conversely, the compressive strength of concrete cylinders has shown to be less reliable as a predictor. Given that fibre reinforcement primarily influences the tensile properties, it is reasonable to focus on finding optimal correlations between the anchor breakout resistance in fibre-reinforced concrete and its splitting tensile strength as well as its flexural and residual tensile strength.
- (4)
- Based on the tests carried out, no linear correlation could be established between the fibre content and the breakout load. An optimum fibre content may be below the maximum tested fibre content. Based on the experience gained, a hypothesis for future investigations is formed that high fibre contents may lead to optimal mechanical properties of anchorages, if the concrete mix is accordingly designed and produced.
- (5)
- The results herein do not strongly support the benefits of using tensile parameters or the fibre content as a varying design parameter. However, it is anticipated that elaboration of a large, more comprehensive dataset of tests with various fibre-reinforcement types and quantities as well as matrix strength parameters will disclose such assessments with a higher degree of confidence. As a further study prompt, material performance metrics based on toughness test methods should be tested as a representative description of the strength contribution of macrosynthetic fibres for design purposes.
- (6)
- It should be noted that the tendencies of an increased load-bearing capacity of fasteners in fibre-reinforced concrete are so far only taken from a small number of tests and should be verified in the future by more extensive tests with a broader coverage of testing parameters. Nevertheless, the addition of the reinforcing fibres has led to equal or greater load-bearing resistance at mean and at characteristic values for all test series, while the increased ductility of these anchorages confirms an enhancement of their performance in terms of structural safety.
Author Contributions
Funding
Institutional Review Board Statement
Data Availability Statement
Acknowledgments
Conflicts of Interest
References
- Spyridis, P.; Dreier, J.; Mellios, N.; Walter, L.; Biermann, D. Multilateral assessment of anchorage bond characteristics in steel fibre reinforced concrete. Polymers 2022, 14, 1411. [Google Scholar] [CrossRef] [PubMed]
- Kurz, C.; Thiele, C.; Schnell, J.; Reuter, M.; Vitt, G. Tragverhalten von Dübeln in Stahlfaserbeton (Behaviour of anchor systems in steel fibre reinforced concrete). Bautechnik 2012, 89, 545–552. [Google Scholar] [CrossRef]
- Holschemacher, K.; Klug, Y.; Wittmann, F. Experimental Investigations on Fastenings in Steel Fibre Reinforced Concrete. Univ. Leipz. Inst. Für Massivbau Und Baust.-IMB Hrgs. LACER-Leipz. Annu. Civ. Eng. Rep. 2002, 7, 145–158. [Google Scholar]
- Vita, N.; Sharma, A. Behaviour of single bonded anchors in non-cracked and cracked steel fibre reinforced concrete under short-time tensile loading. Eng. Struct. 2021, 245, 112900. [Google Scholar] [CrossRef]
- Spyridis, P.; Mellios, N. Tensile performance of headed anchors in steel fibre reinforced and conventional concrete in uncracked and cracked state. Materials 2022, 15, 1886. [Google Scholar] [CrossRef] [PubMed]
- Mansour, A.; Mohyeddin, A.; Lee, J. Load-bearing behaviour of anchors in fibre-reinforced concrete–A state of the art review. J. Build. Eng. 2024, 91, 109580. [Google Scholar] [CrossRef]
- Schwenn, M.; Voit, K.; Zeman, O.; Bergmeister, K. Post-installed mechanical fasteners in high strength and ultra-high strength performance concrete. Civ. Eng. Des. 2019, 1, 161–167. [Google Scholar] [CrossRef]
- Cattaneo, S.; Muciaccia, G. Adhesive anchors in high performance concrete. Mater. Struct. 2016, 49, 2689–2700. [Google Scholar] [CrossRef]
- Tóth, M.; Bokor, B.; Sharma, A. Anchorage in steel fibre reinforced concrete–concept, experimental evidence and design recommendations for concrete cone and concrete edge break-out failure modes. Eng. Struct. 2019, 181, 60–75. [Google Scholar] [CrossRef]
- Sjölander, A.; Ansell, A.; Nordström, E. On the design of permanent rock support using fibre-reinforced shotcrete. Fibers. 2023, 11, 20. [Google Scholar] [CrossRef]
- Ramli, M.; Kwan, W.H.; Abas, N.F. Application of non-corrosive barchip fibres for high strength concrete enhancements in aggressive environments. Compos. B Eng. 2013, 53, 134–144. [Google Scholar] [CrossRef]
- Camille, C.; Hewage, D.K.; Mirza, O.; Mashiri, F.; Kirkland, B.; Clarke, T. Performance behaviour of macro-synthetic fibre reinforced concrete subjected to static and dynamic loadings for sleeper applications. Constr. Build. Mater. 2021, 270, 121469. [Google Scholar] [CrossRef]
- Eligehausen, R.; Mallée, R.; Silva, J.F. Anchorage in Concrete Construction; John Wiley & Sons: Hoboken, NJ, USA, 2006; Volume 10. [Google Scholar]
- Fuchs, W.; Eligehausen, R.; Breen, J.E. Concrete capacity design (CCD) approach for fastening to concrete. Struct. J. 1995, 92, 73–94. [Google Scholar]
- Karmokar, T.; Mohyeddin, A.; Lee, J. Predictive models for concrete cone capacity of cast-in headed anchors in geopolymer concrete. Eng. Struct. 2023, 285, 116025. [Google Scholar] [CrossRef]
- Mellios, N.; Spyridis, P.; Bergmeister, K. Extended concrete capacity design method for anchors close to non-rectangular edges. Struct. Concr. 2023, 24, 7148–7172. [Google Scholar] [CrossRef]
- EN 1992-4: 2018; Design of Fastenings for Use in Concrete, Parts 4-1 to 4-5. CEN—European Committee for Standardization: Brussels, Belgium, 2018.
- DIN EN 12390-3: 2019-10; Prüfung von Festbeton—Teil 3: Druckfestigkeit von Prüfkörpern (Testing Hardened Concrete—Part 3: Compressive Strength of Test Specimens; German Version). DIN-Normenausschuss Bauwesen (NABau). Deutsche Norm. DIN Deutsches Institut für Normung e.V. (Hrsg.): Beuth, Berlin, 2019.
- DIN EN 12390-6: 2010-09; Prüfung von Festbeton—Teil 6: Spaltzugfestigkeit von Probekörpern (Testing Hardened Concrete—Part 6: Tensile Splitting Strength of Test Specimens; German Version). Normenausschuss Bauwesen (NABau) im DIN, Deutsche Norm. DIN Deutsches Institut für Normung e.V. (Hrsg.): Beuth, Berlin, 2009.
- DIN EN 12390-5: 2019-10; Prüfung von Festbeton—Teil 5: Biegezugfestigkeit von Prüfkörpern (Testing Hardened Concrete—Part 5: Flexural Strength of Test Specimens; German Version). DIN-Normenausschuss Bauwesen (NABau). Deutsche Norm. DIN Deutsches Institut für Normung e.V. (Hrsg.): Beuth, Berlin, 2019.
- DIN EN 12390-4: 2020-04; Prüfung von Festbeton—Teil 4: Bestimmung der Druckfestigkeit—Anforderungen an Prüfmaschinen (Testing Hardened Concrete—Part 4: Compressive Strength—Specification for Testing Machines). DIN-Normenausschuss Bauwesen (NABau), DIN-Normenausschuss Materialprüfung (NMP). Deutsche Norm. DIN Deutsches Institut für Normung e.V. (Hrsg.): Beuth, Berlin, 2019.
- DIN EN 14889-2: 2006-11; Fasern für Beton—Teil 2: Polymerfasern—Begriffe, Festlegungen und Konformität (Fibres for Concrete—Part 2: Polymer Fibres—Definitions, Specifications and Conformity; German Version). Normenausschuss Bauwesen (NABau) im DIN, Deutsche Norm. DIN Deutsches Institut für Normung e.V. (Hrsg.): Beuth, Berlin, 2006.
- Deutscher Beton- und Bautechnik-Verein e.V. (Hrsg.). DBV-Merkblatt: Industrieböden aus Stahlfaserbeton—Besonderheiten bei Bemessung und Konstruktion, Herstellung und Ausführung, Merkblatt (Guide to Good Practice—Steel Fibre Reinforced Industrial Concrete Floors—Special Features of the Design and Detailing, Production and Conformity); Deutscher Beton- und Bautechnik-Verein e.V. (Hrsg.): Eigenverlag, Berlin, 2013. [Google Scholar]
- DIN EN 12350-5: 2019-09; Prüfung von Frischbeton—Teil 5: Ausbreitmaß (Testing Fresh Concrete—Part 5: Flow Table Test; German Version). DIN-Normenausschuss Bauwesen (NABau). Deutsche Norm. DIN Deutsches Institut für Normung e.V. (Hrsg.): Beuth, Berlin, 2019.
- fib MC2020; Model Code for Concrete Structures 2020. International Federation for Structural Concrete: Lausanne Switzerland, 2023.
- EN 1990: 2021-10; Eurocode 0—Besis of Design. CEN—European Committee for Standardization: Brussels, Belgium, 2021.
- Backhaus, K.; Erichson, B.; Gensler, S.; Weiber, R.; Weiber, T. Multivariate Analysis; Springer Books: New York, NY, USA, 2021; Volume 10, pp. 978–983. [Google Scholar]


| Designation | Concrete Class | w/c Ratio | Fibre Reinforcement | Fibre Content |
|---|---|---|---|---|
| Ref | C20/25 | 0.65 | Baseline reference (unreinforced) | 0 kg/m3 |
| bc4 | C30/37 | 0.50 | Polymer fibres BarChip48, | 4 kg/m3 |
| bc6 | C30/37 | 0.50 | Polymer fibres BarChip48, | 6 kg/m3 |
| bc8 | C30/37 | 0.50 | Polymer fibres BarChip48 | 8 kg/m3 |
| Constituents Per m3 | Ref | bc4/6/8 | ||
|---|---|---|---|---|
| Surface moisture | [kg] | 1 | 1 | |
| Added water | [kg] | 171 | 172 | |
| Cement | [kg] | 267 | 344 | |
| Superplasticiser | [L/ton] | - | 0.55 | |
| Aggregates | 8/16 | [kg] | 490 | 473 |
| 2/8 | [kg] | 589 | 568 | |
| 0/2 | [kg] | 883 | 853 | |
| Pore volume | [m3] | 0.015 | 0.015 | |
| Fibres | [kg] | - | 4/6/8 | |
| Test Series | Compressive Strength | Tensile Strength | Breakout Resistance Loads | Failure Displacements | |||||
|---|---|---|---|---|---|---|---|---|---|
| fcm,cube | fcm,cyl | fctm,sp | fctm,fl | Nu,m (St. Dev.) | NRk,c | Nu,m,45 | NR,ck,45 | δ (St. Dev.) | |
| [MPa] | [MPa] | [MPa] | [MPa] | [kN] | [kN] | [kN] | [kN] | [mm] | |
| Ref | 32.8 | 28.1 | 3.00 | 3.6 | 90.02 (4.72) | 85.13 | 105.52 | 99.79 | 4.7 (0.4) |
| bc4 | 45.1 | 39.2 | 3.85 | 4.4 | 126.02 (6.37) | 114.71 | 125.88 | 114.61 | 6.4 (1.6) |
| bc6 | 45.3 | 43.3 | 3.75 | 4.3 | 127.63 (5.66) | 118.74 | 127.21 | 118.32 | 5.7 (0.8) |
| bc8 | 39.4 | 34.8 | 3.10 | 3.8 | 99.61 (4.77) | 92.72 | 106.44 | 99.09 | 4.8 (0.4) |
| Correlation | Function y | R2 |
|---|---|---|
| Fmax/fcm,cube | 1.95x + 38.80 | 0.992 |
| Fmax/fcm,cyl | 1.42x + 67.43 | 0.859 |
| Fmax/fctm,sp | 15.47x + 67.73 | 0.951 |
| Fmax/fctm,fl | 17.86x + 48.83 | 0.944 |
| Test Series | Linear Regression Model | Adjusted CCD Model | |||||||
|---|---|---|---|---|---|---|---|---|---|
| Nu,m | |||||||||
| [kN] | [kN] | [kN] | [kN] | [kN] | [kN] | [kN] | [kN] | [kN] | |
| bc4 | 126.02 | 126.64 | 126.64 | 123.19 | 127.28 | 125.60 | 125.60 | 132.85 | 129.96 |
| bc6 | 127.63 | 127.03 | 127.03 | 129.02 | 125.73 | 125.88 | 125.88 | 129.40 | 127.01 |
| bc8 | 115.56 | 115.54 | 115.54 | 116.93 | 115.68 | 117.40 | 117.40 | 106.97 | 112.24 |
| Model | Function | R2 | SE | Model Performance | ||
|---|---|---|---|---|---|---|
| [-] | [kN] | [%] | M | O | ||
| Linear regression | 0.992 | 0.86 | 0.7 | I | 1 | |
| 0.859 | 3.44 | 2.8 | IV | 8 | ||
| 0.951 | 2.28 | 1.9 | II | 3 | ||
| 0.944 | 2.69 | 2.2 | III | 4 | ||
| Adjusted CCD | 18.70 · | 0.991 | 2.57 | 2.1 | I | 2 |
| 19.68 · | 0.873 | 3.41 | 2.8 | IV | 7 | |
| 34.51 · | 0.941 | 11.12 | 9.0 | II | 5 | |
| 29.54 · | 0.924 | 5.19 | 4.2 | III | 6 | |
Disclaimer/Publisher’s Note: The statements, opinions and data contained in all publications are solely those of the individual author(s) and contributor(s) and not of MDPI and/or the editor(s). MDPI and/or the editor(s) disclaim responsibility for any injury to people or property resulting from any ideas, methods, instructions or products referred to in the content. |
© 2024 by the authors. Licensee MDPI, Basel, Switzerland. This article is an open access article distributed under the terms and conditions of the Creative Commons Attribution (CC BY) license (https://creativecommons.org/licenses/by/4.0/).
Share and Cite
Spyra, J.; Mellios, N.; Borttscheller, M.; Spyridis, P. Influence of Polymer Fibre Reinforcement on Concrete Anchor Breakout Failure Capacity. Polymers 2024, 16, 2203. https://doi.org/10.3390/polym16152203
Spyra J, Mellios N, Borttscheller M, Spyridis P. Influence of Polymer Fibre Reinforcement on Concrete Anchor Breakout Failure Capacity. Polymers. 2024; 16(15):2203. https://doi.org/10.3390/polym16152203
Chicago/Turabian StyleSpyra, Julia, Nikolaos Mellios, Michael Borttscheller, and Panagiotis Spyridis. 2024. "Influence of Polymer Fibre Reinforcement on Concrete Anchor Breakout Failure Capacity" Polymers 16, no. 15: 2203. https://doi.org/10.3390/polym16152203