

Synthesis and Dye Adsorption Dynamics of Chitosan–Polyvinylpolypyrrolidone (PVPP) Composite
 , ,
, ,  and
and
Abstract
:1. Introduction
2. Materials and Methods
2.1. Synthesis and Characterization of Polymer Beads
2.2. Adsorption of Dyes Using CS/PVPP Beads
3. Results and Discussions
3.1. Synthesis and Characterization of Polymer Beads
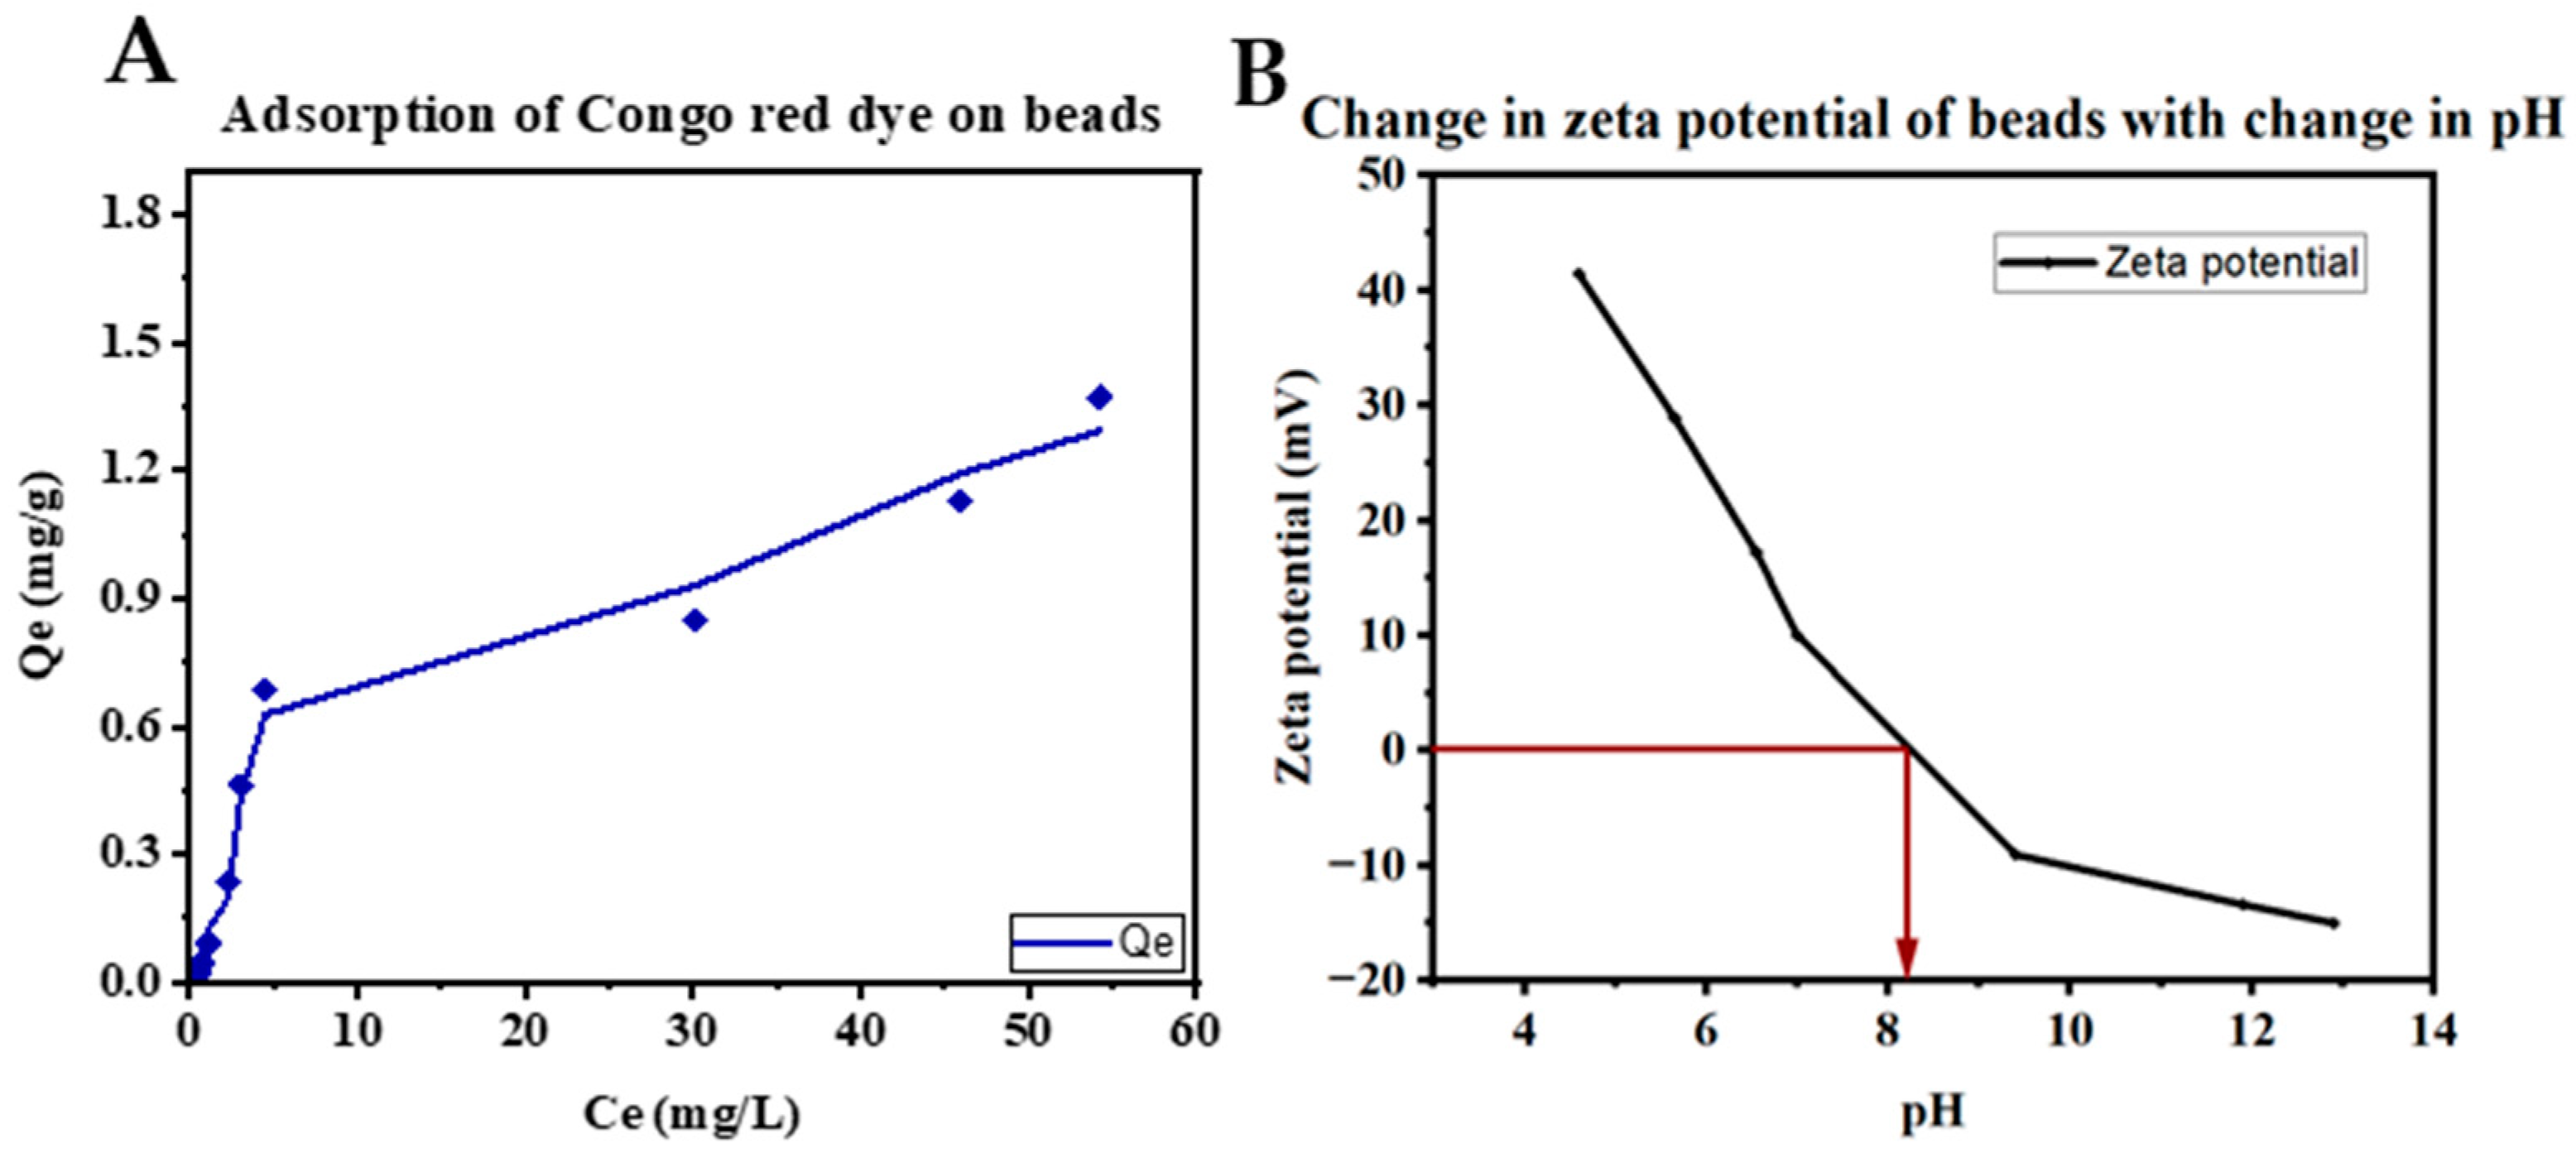
3.1.1. Surface Area and Zeta Potential of the Beads
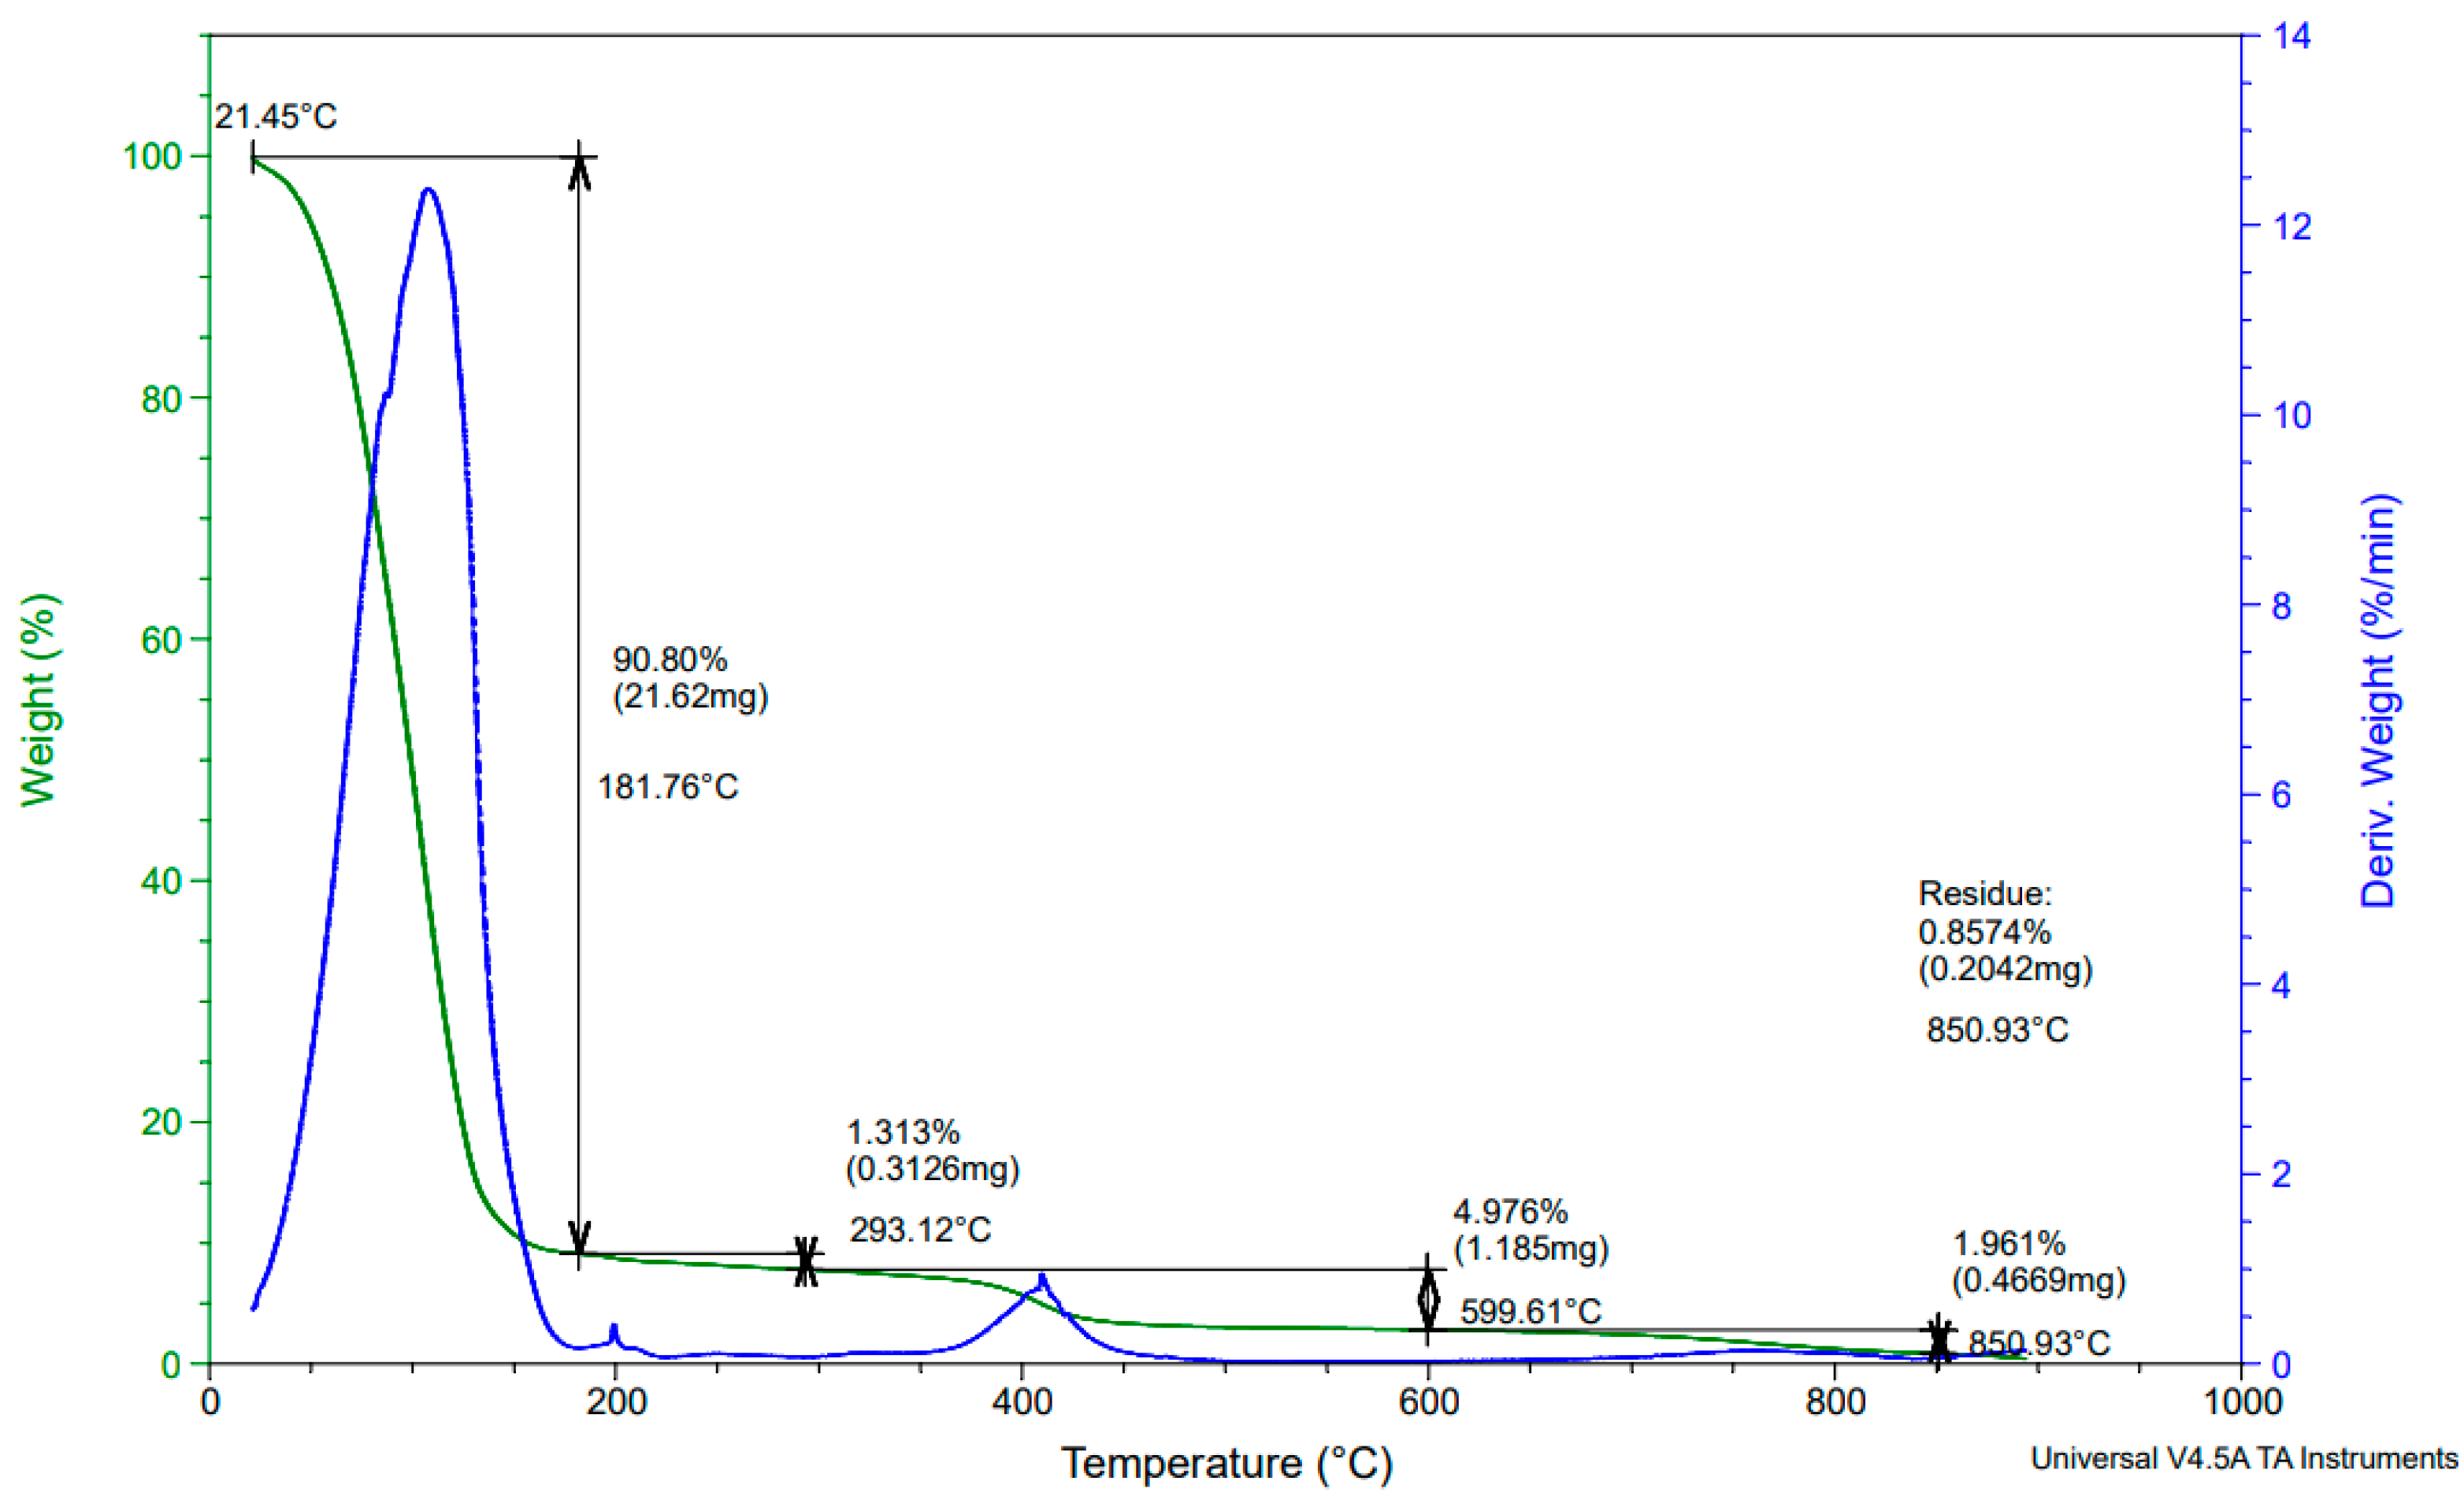
3.1.2. TGA Analysis
3.1.3. FTIR Analysis of Composite Beads before and after Dye Adsorption
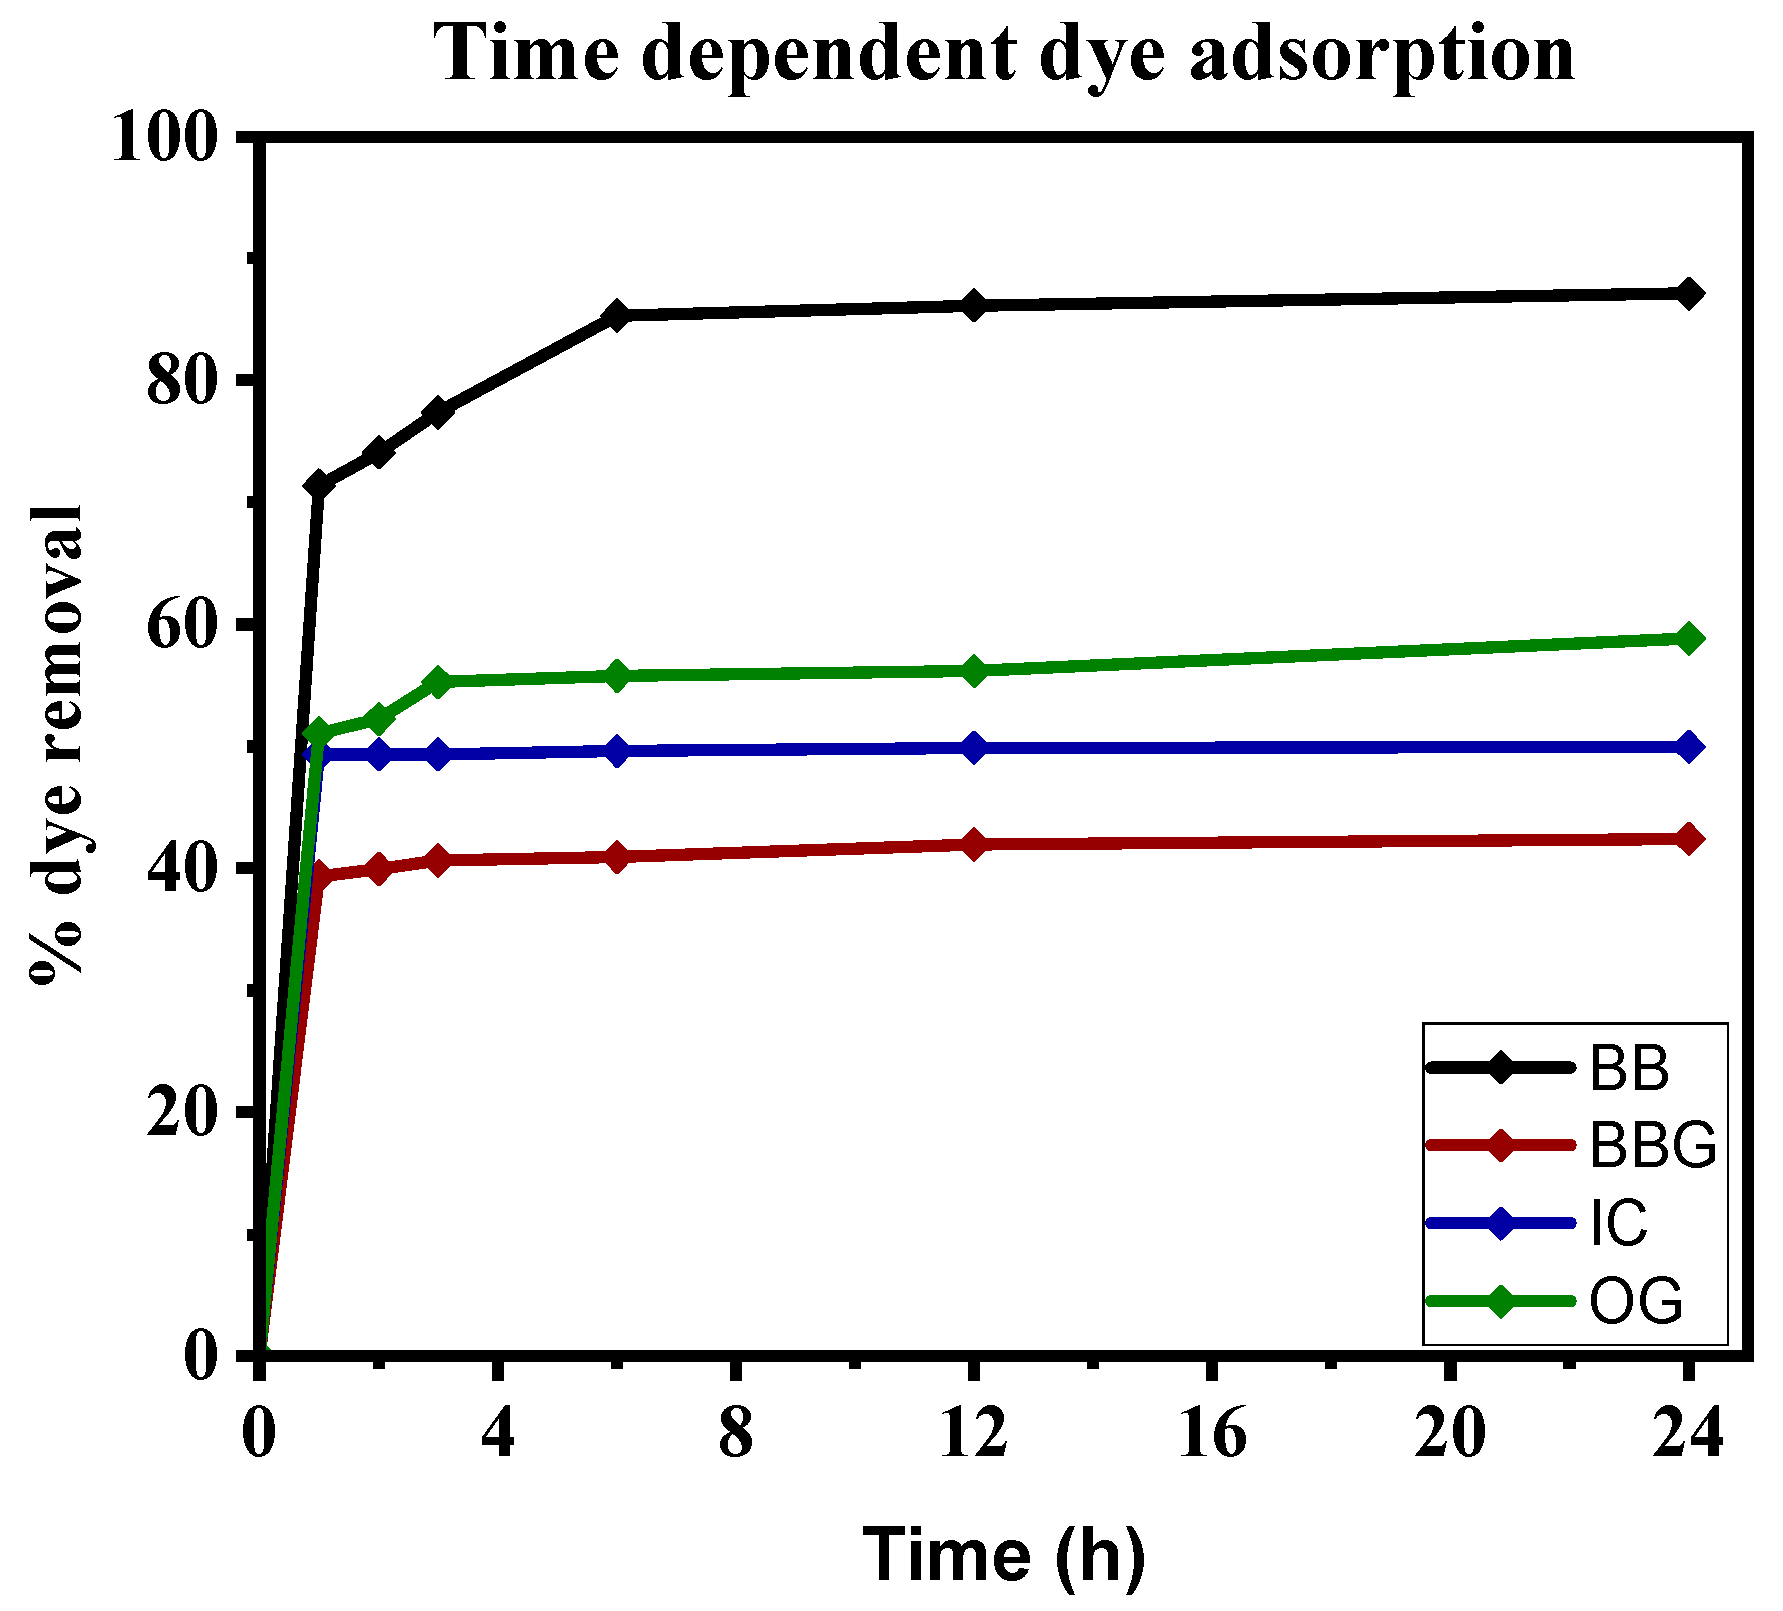
3.2. Effect of Contact Time on Adsorption of Dye
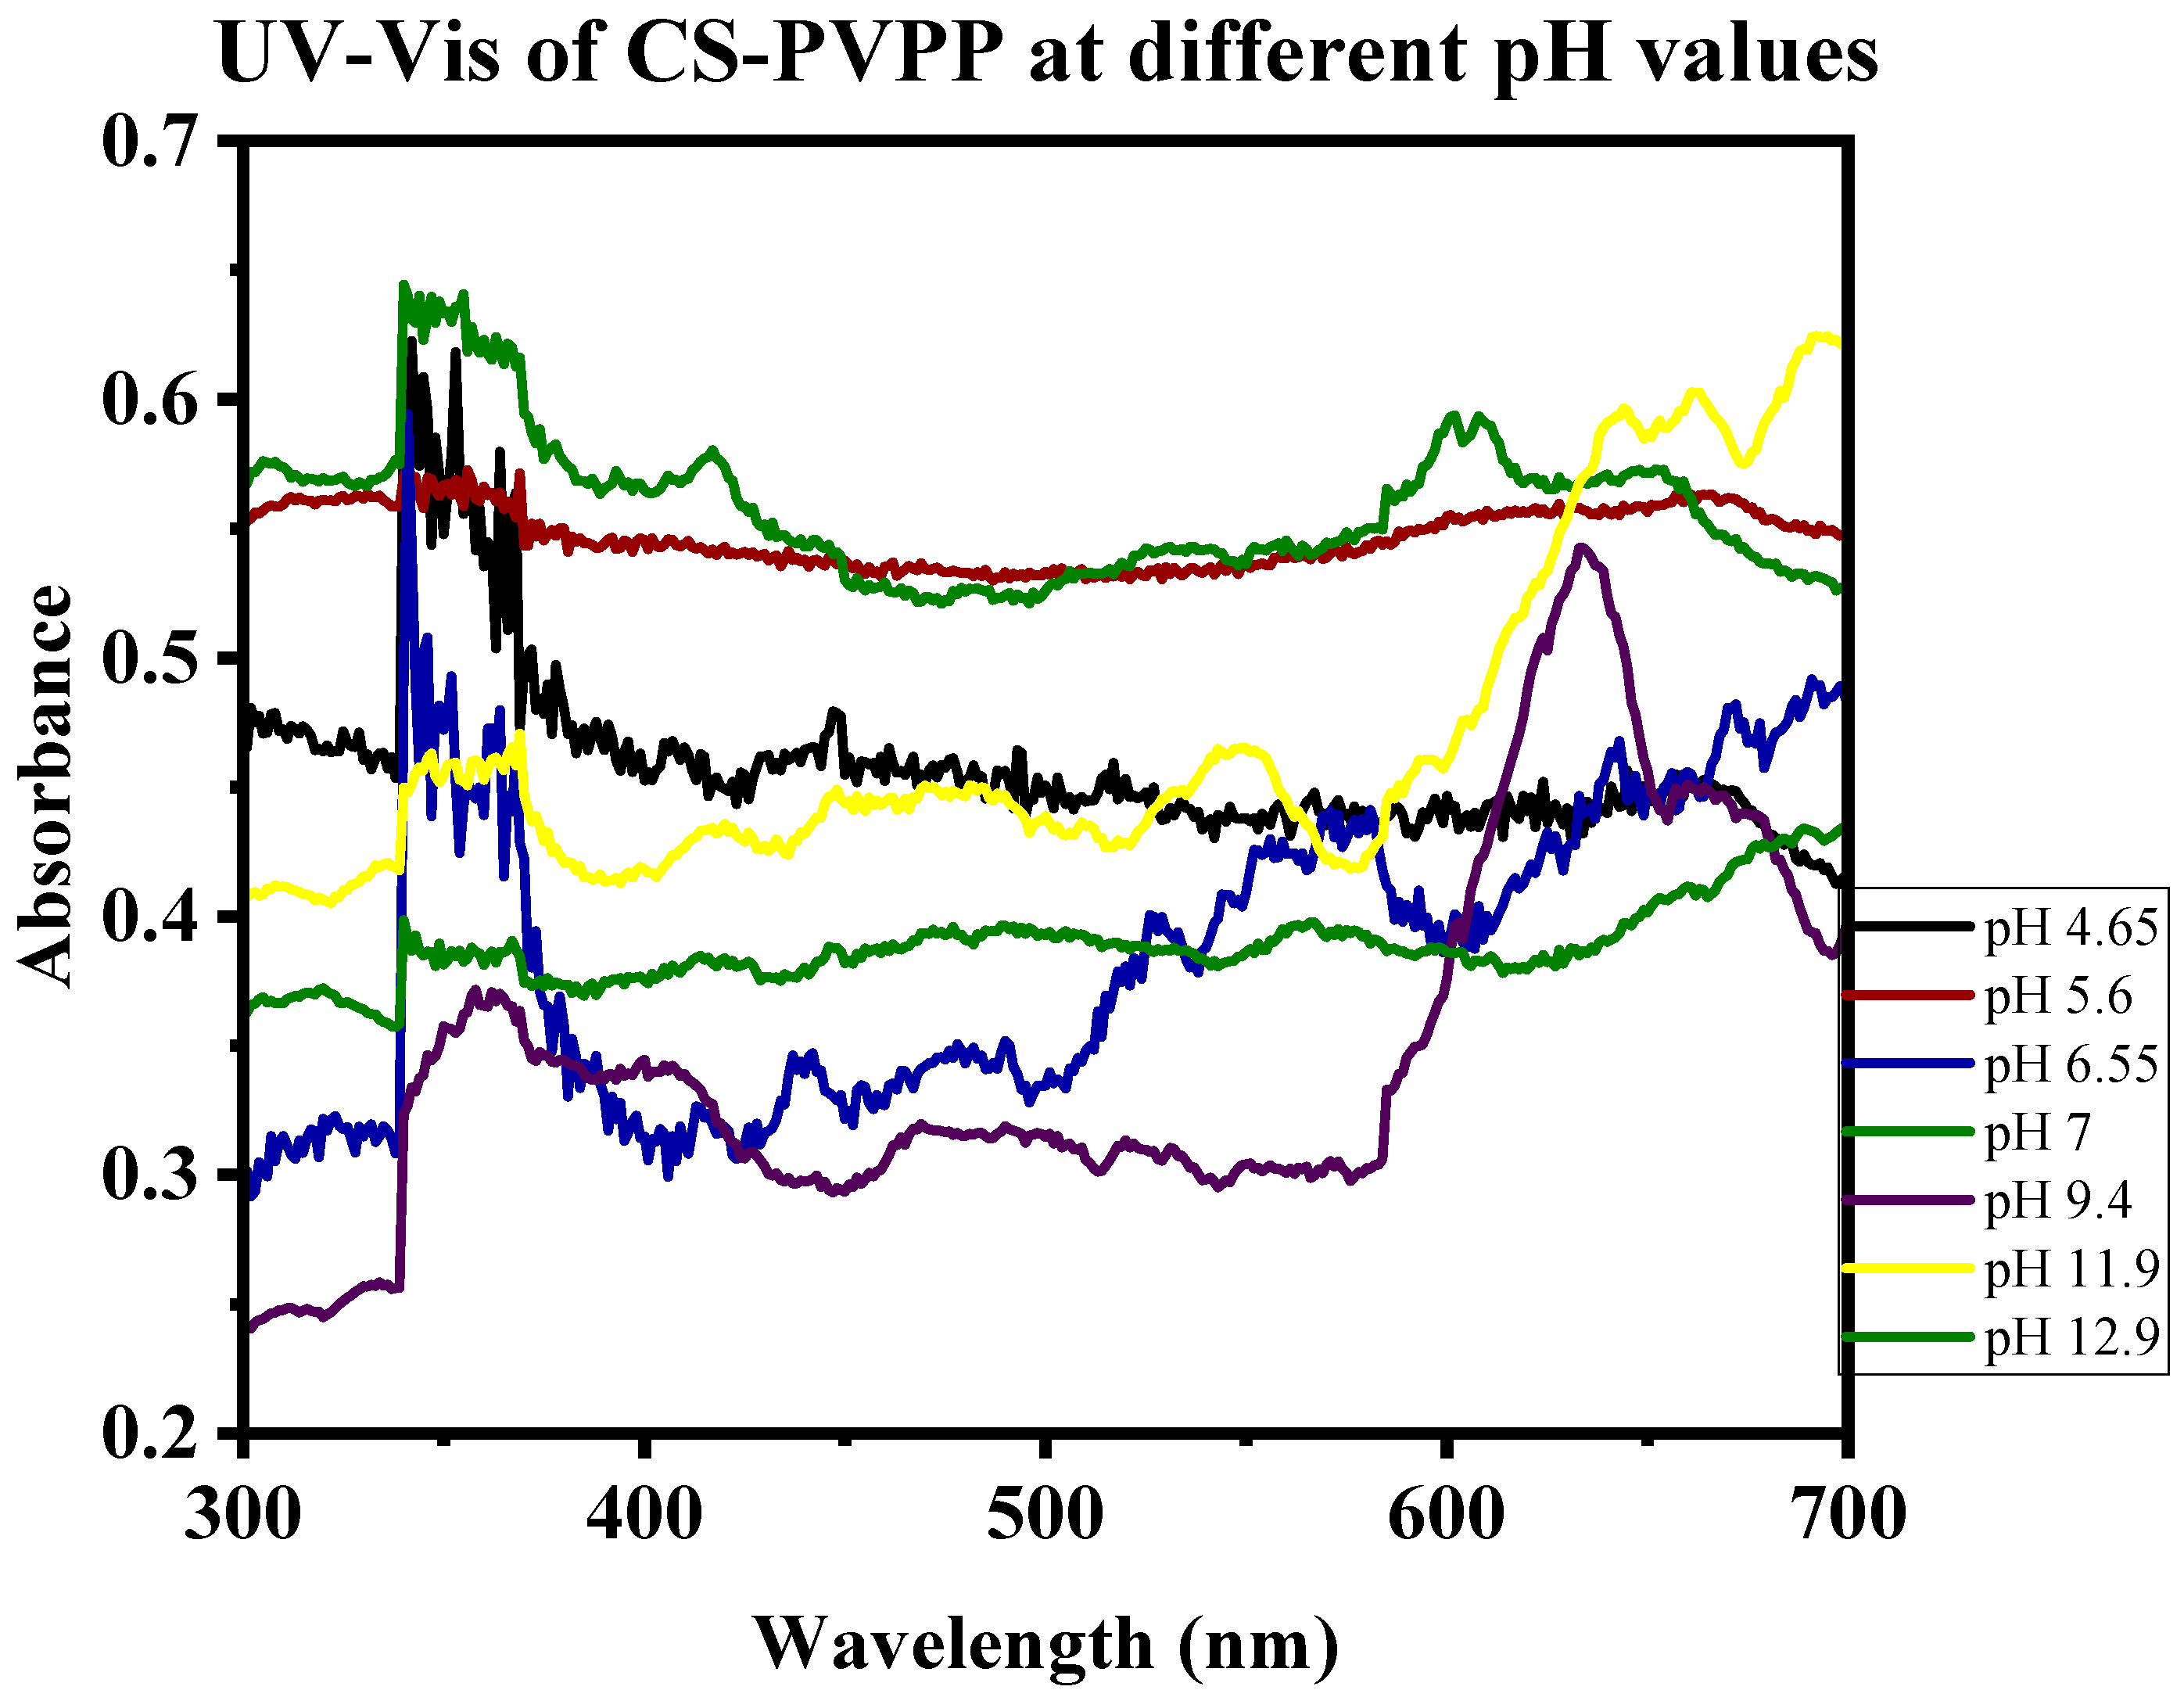
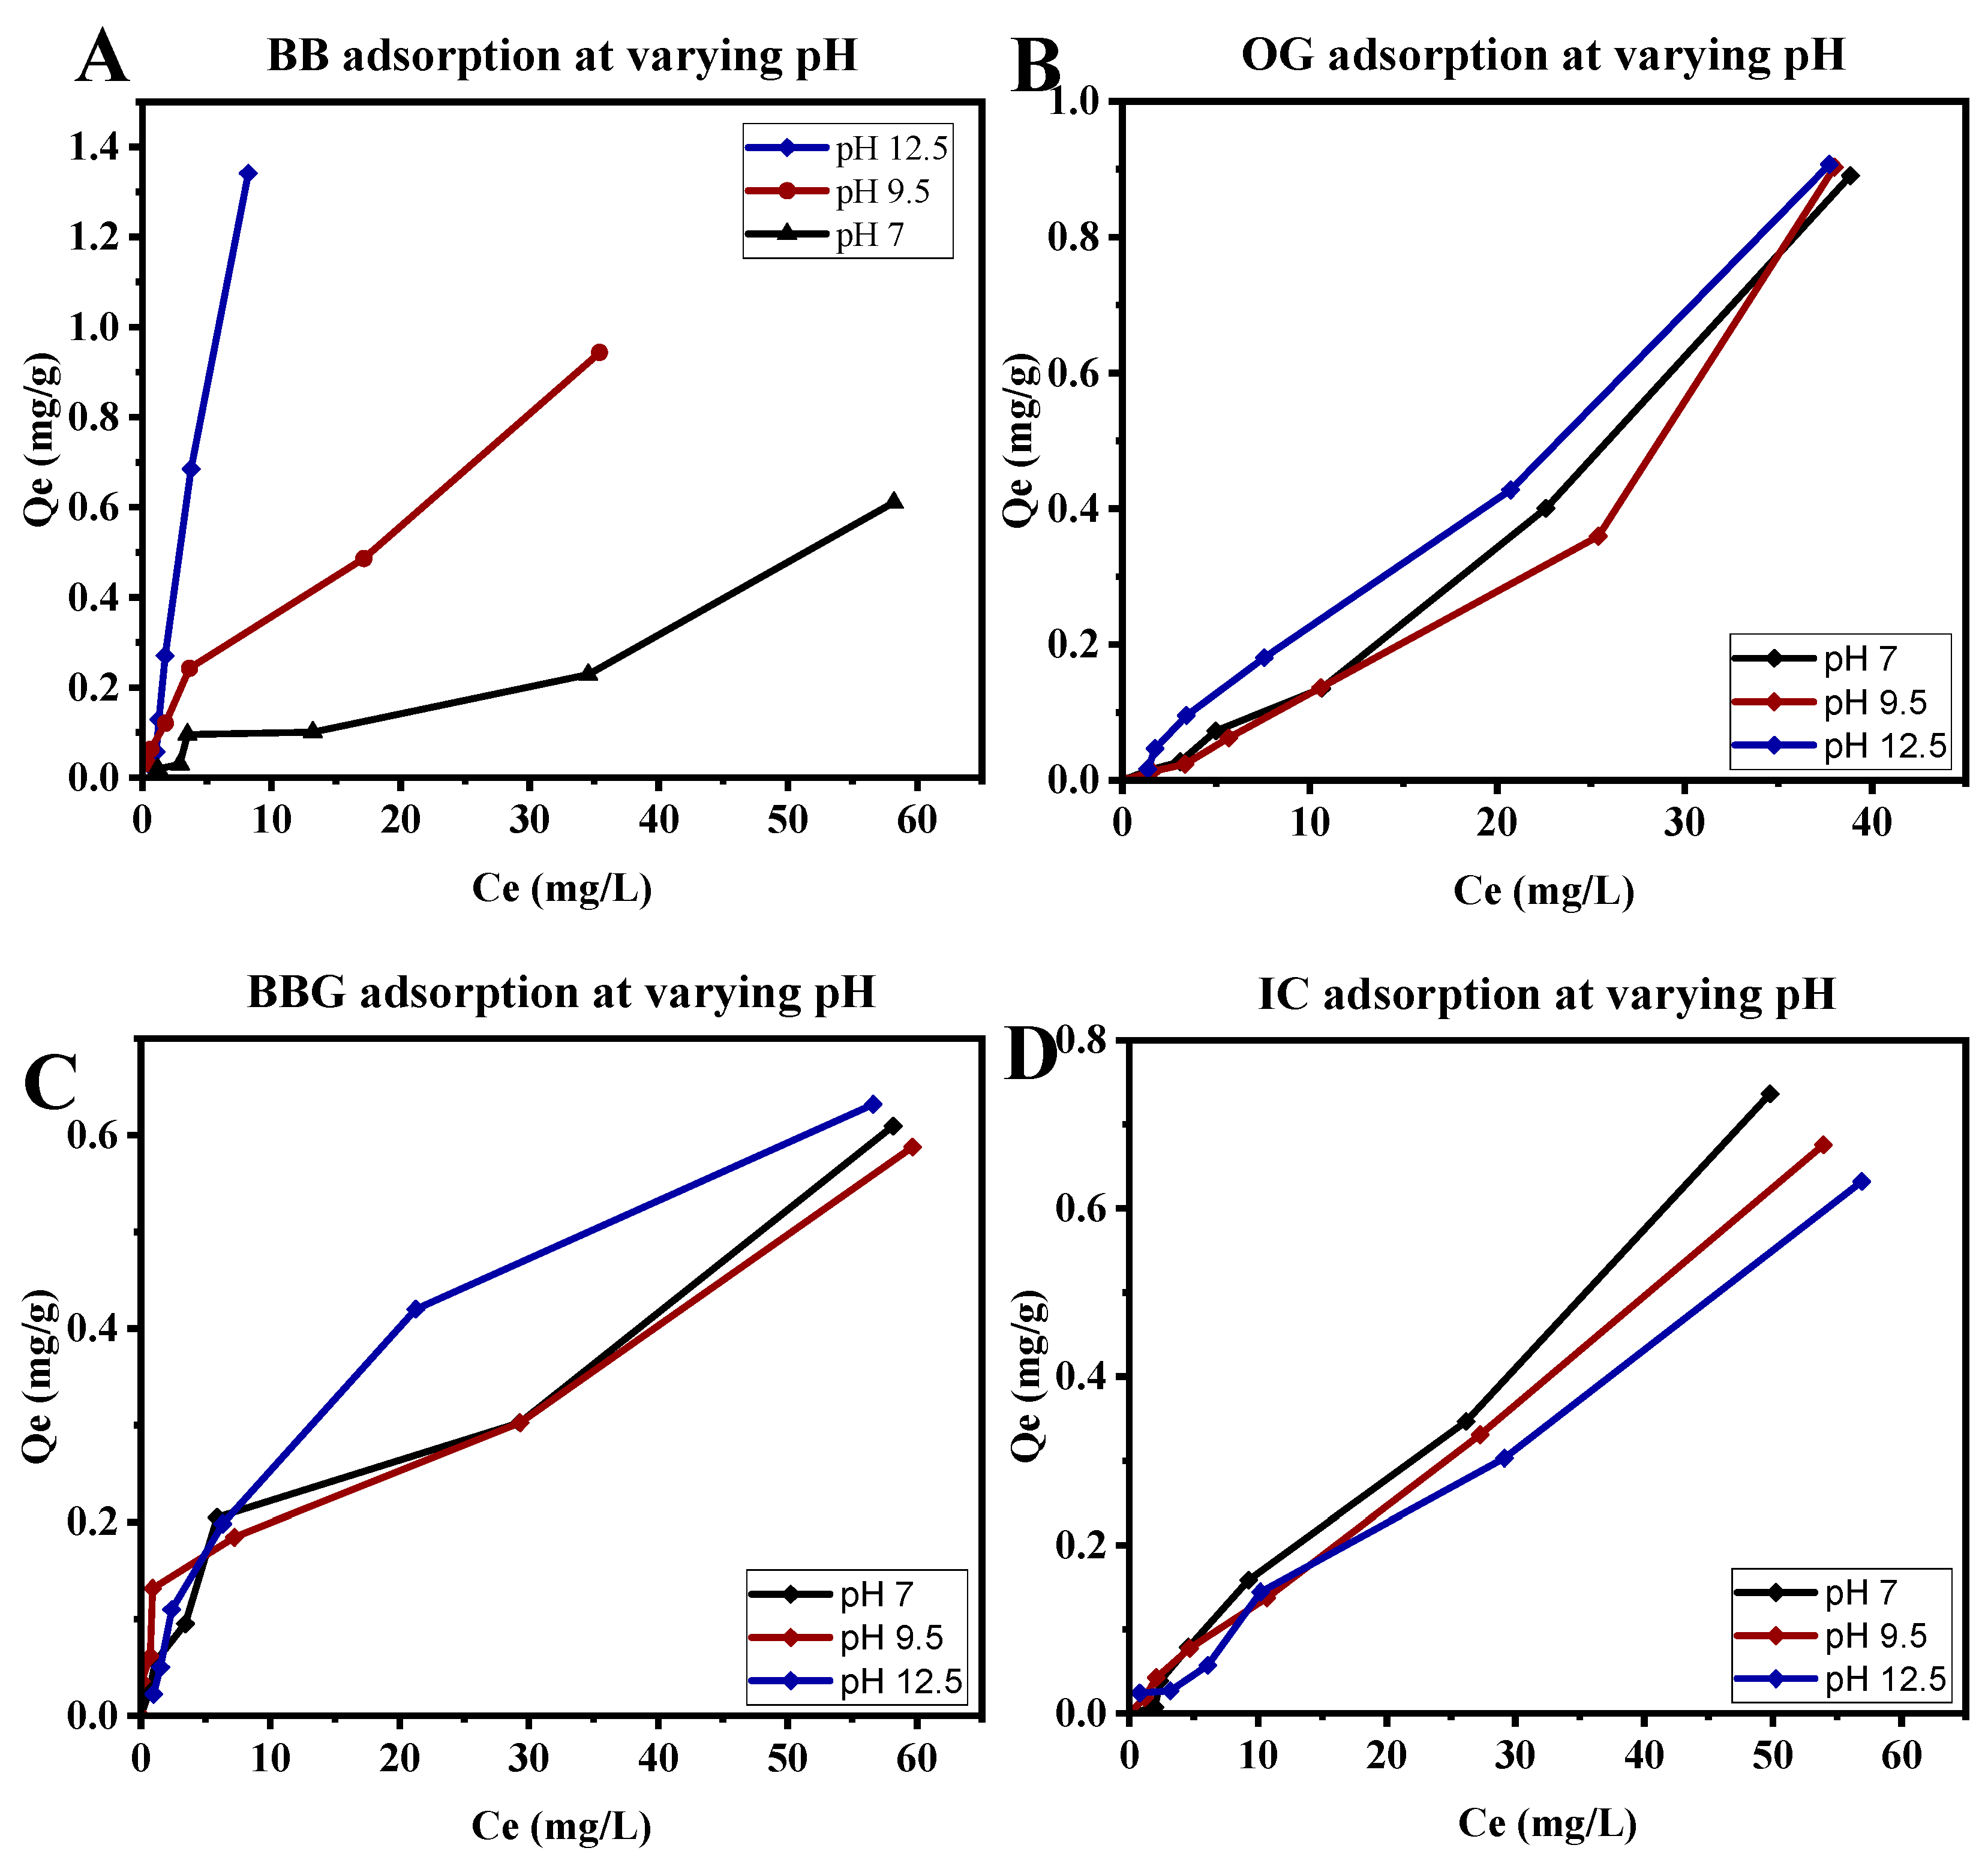
3.3. The Effect of pH
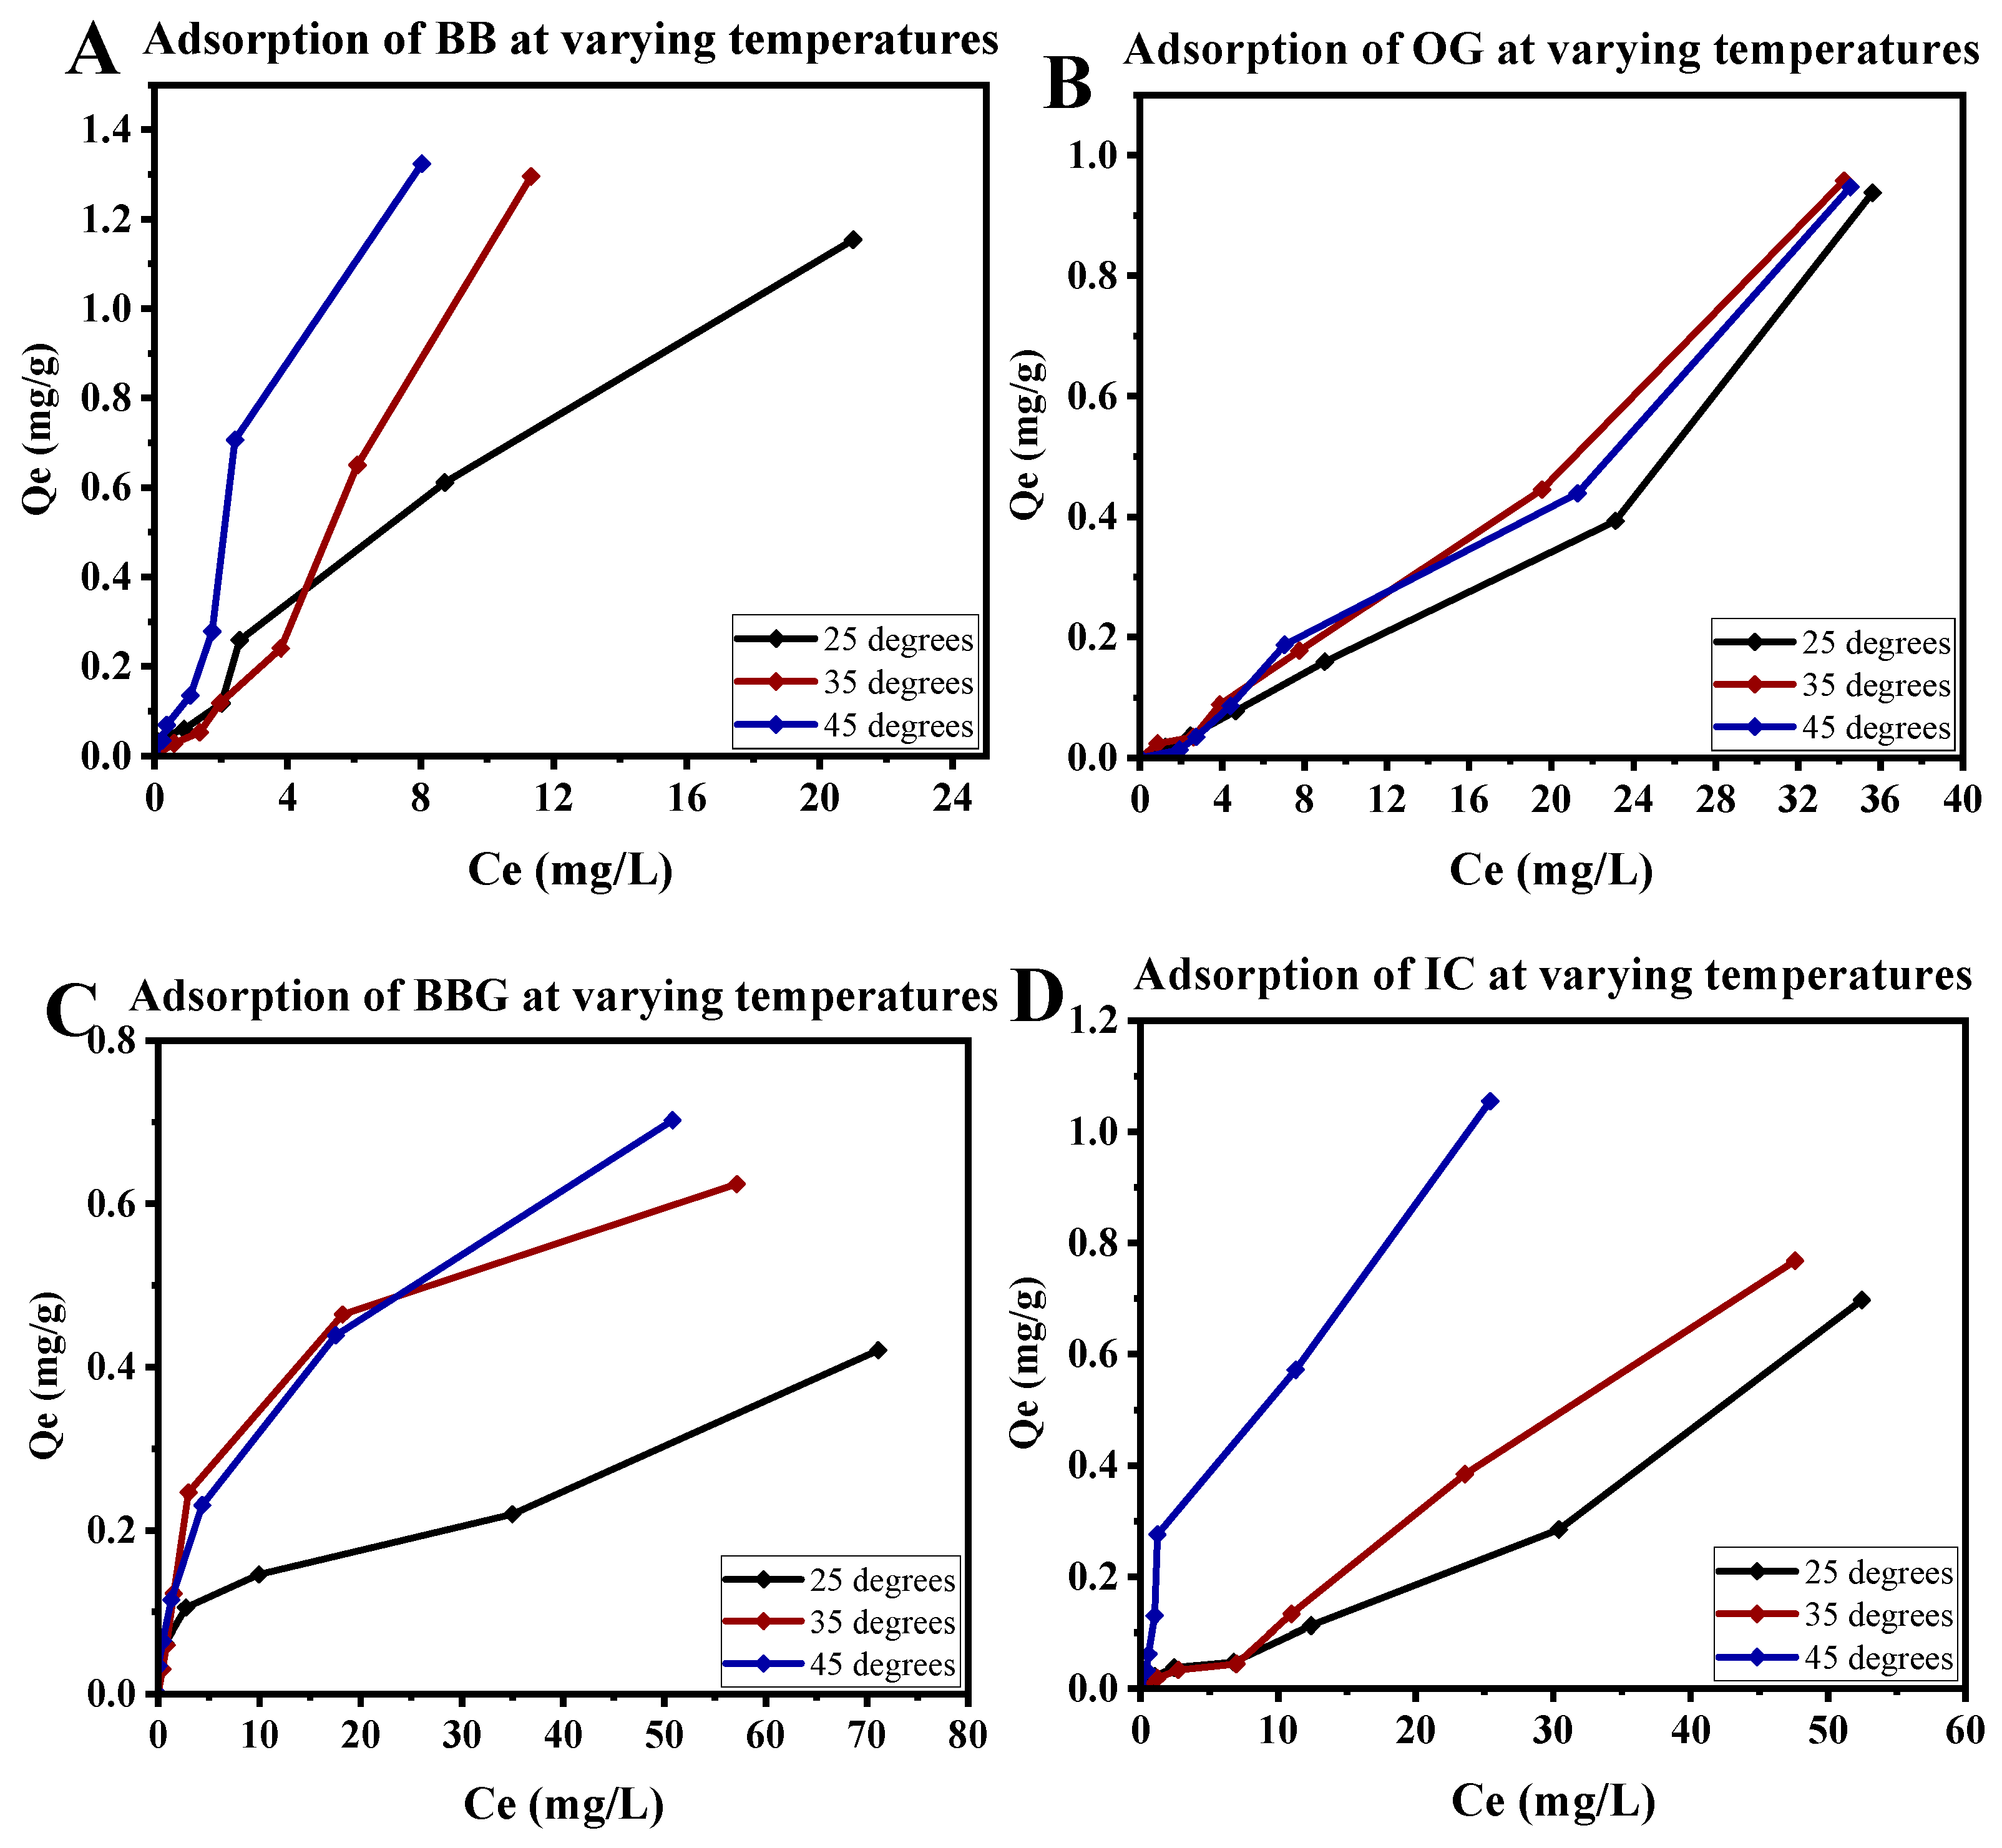
3.4. The Effect of Temperature
3.5. Adsorption Isotherms
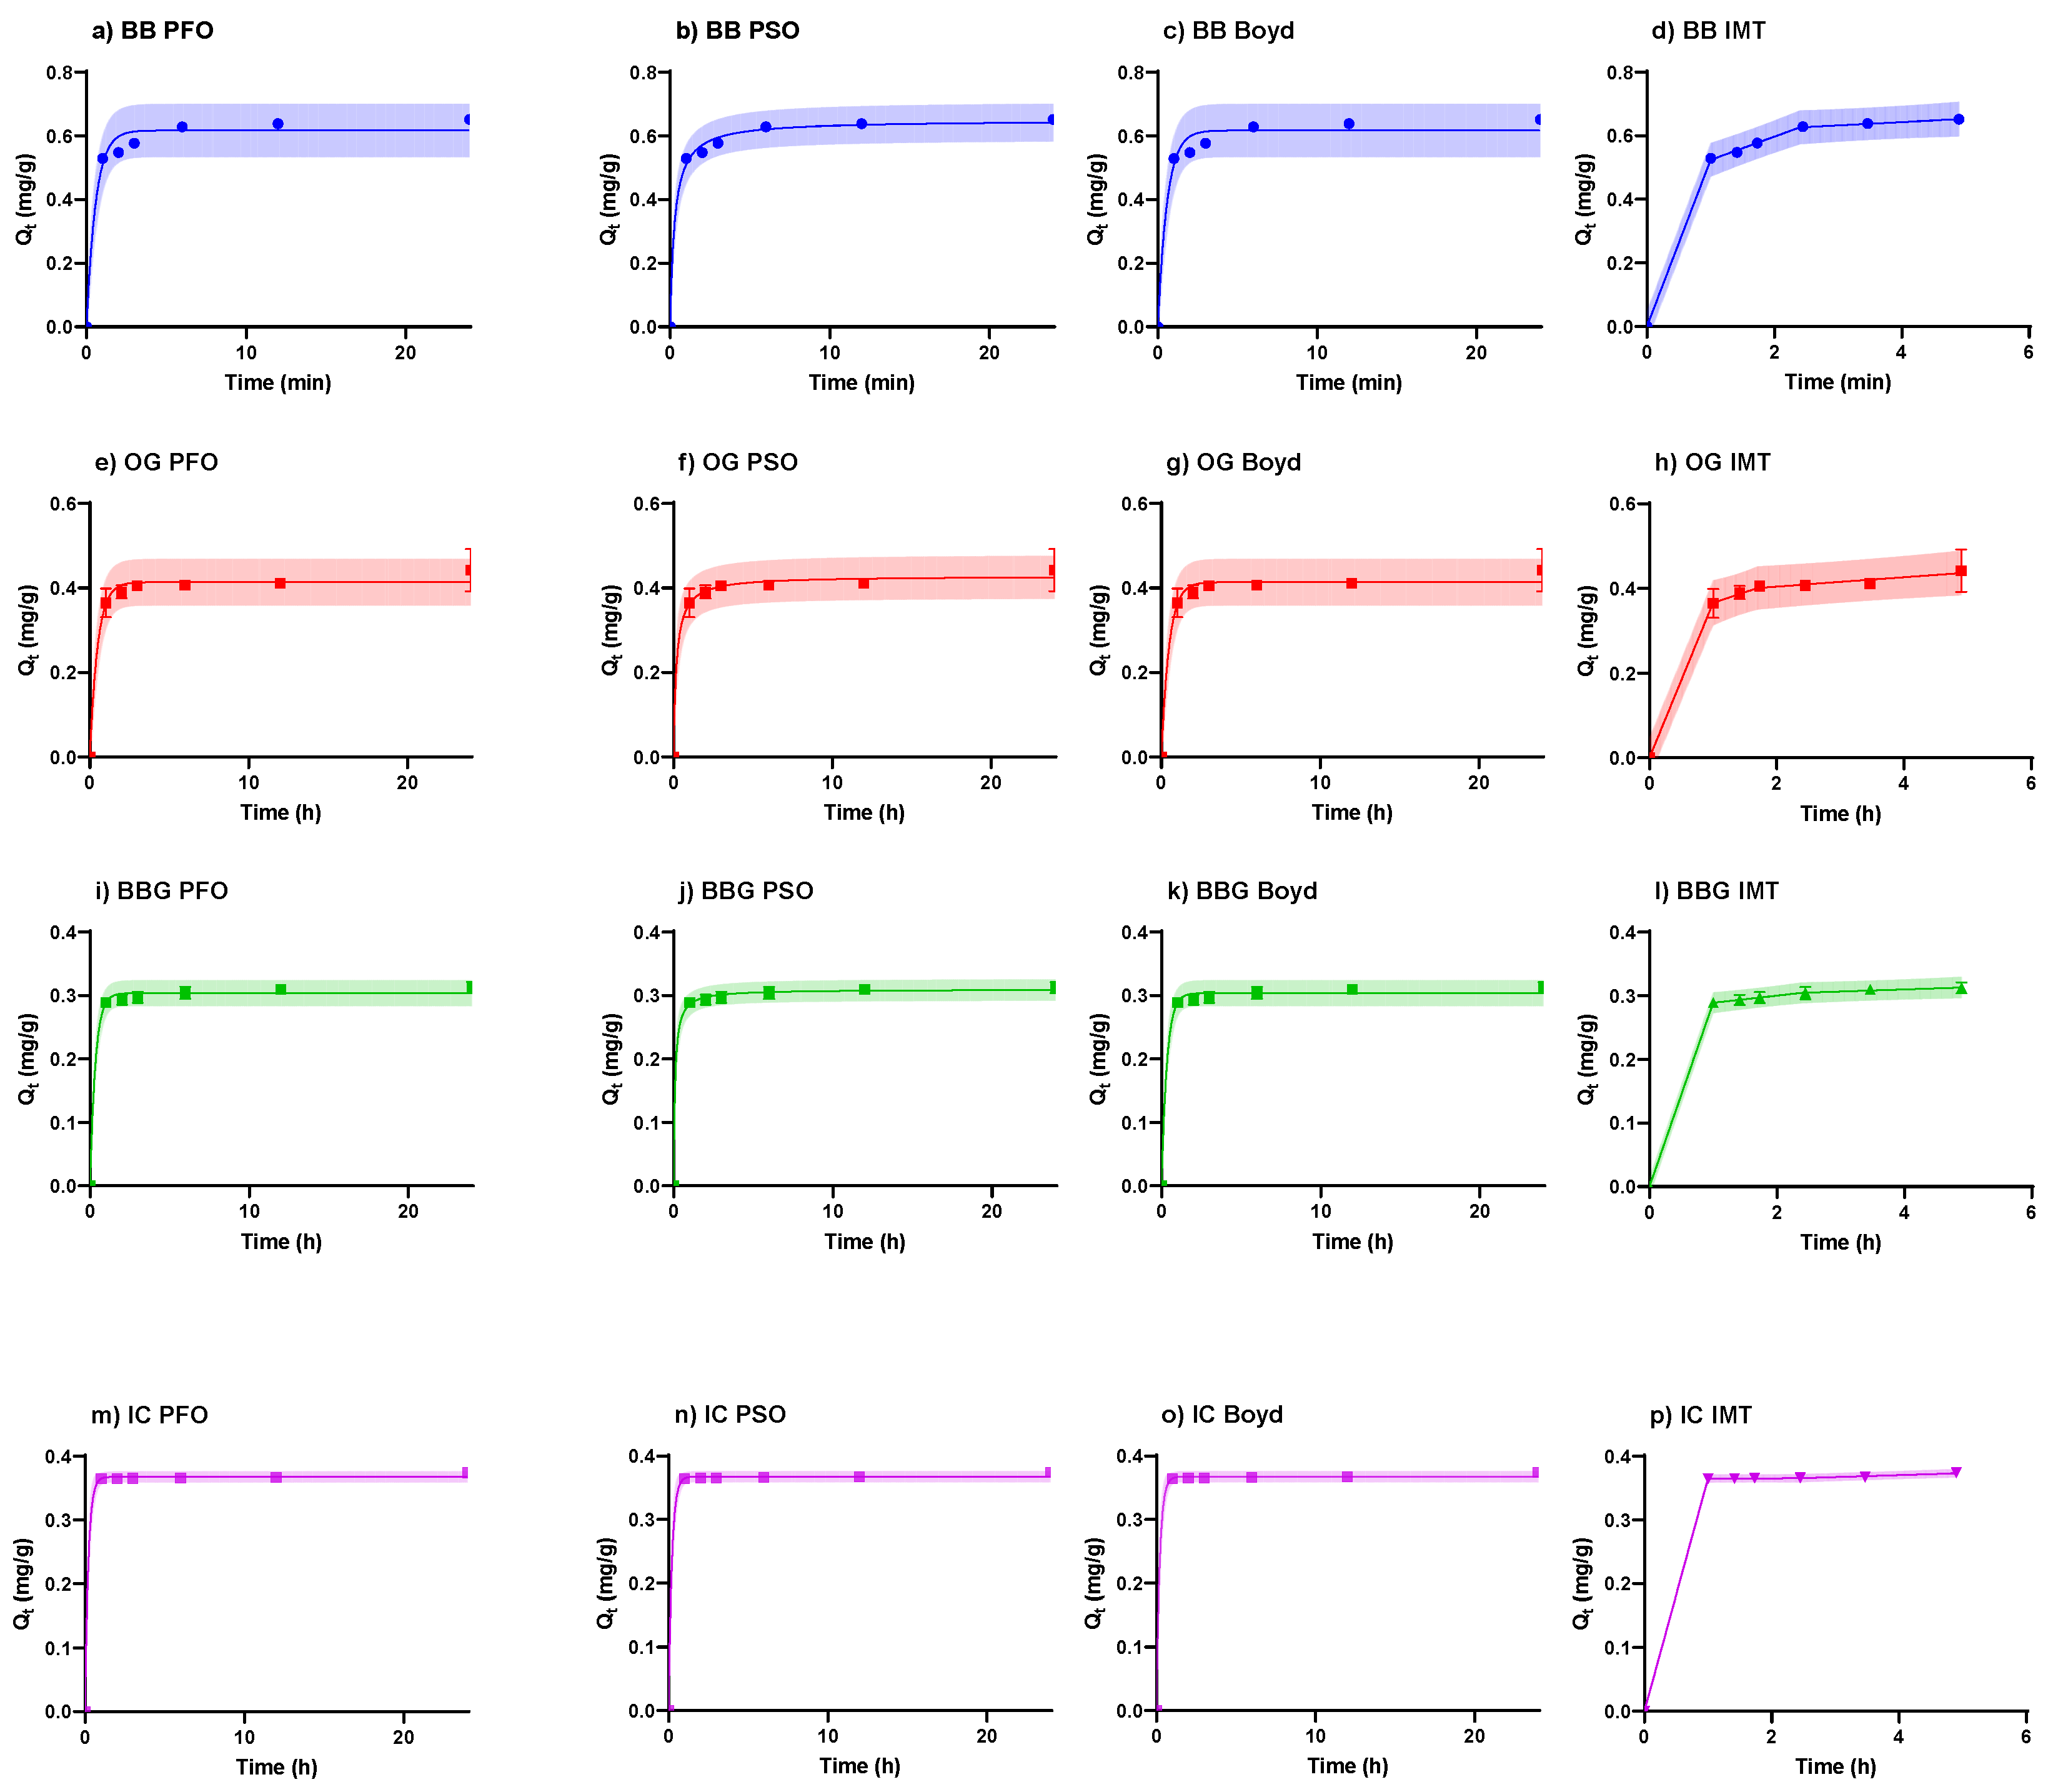
3.6. Adsorption Kinetics and Mass Transfer Studies
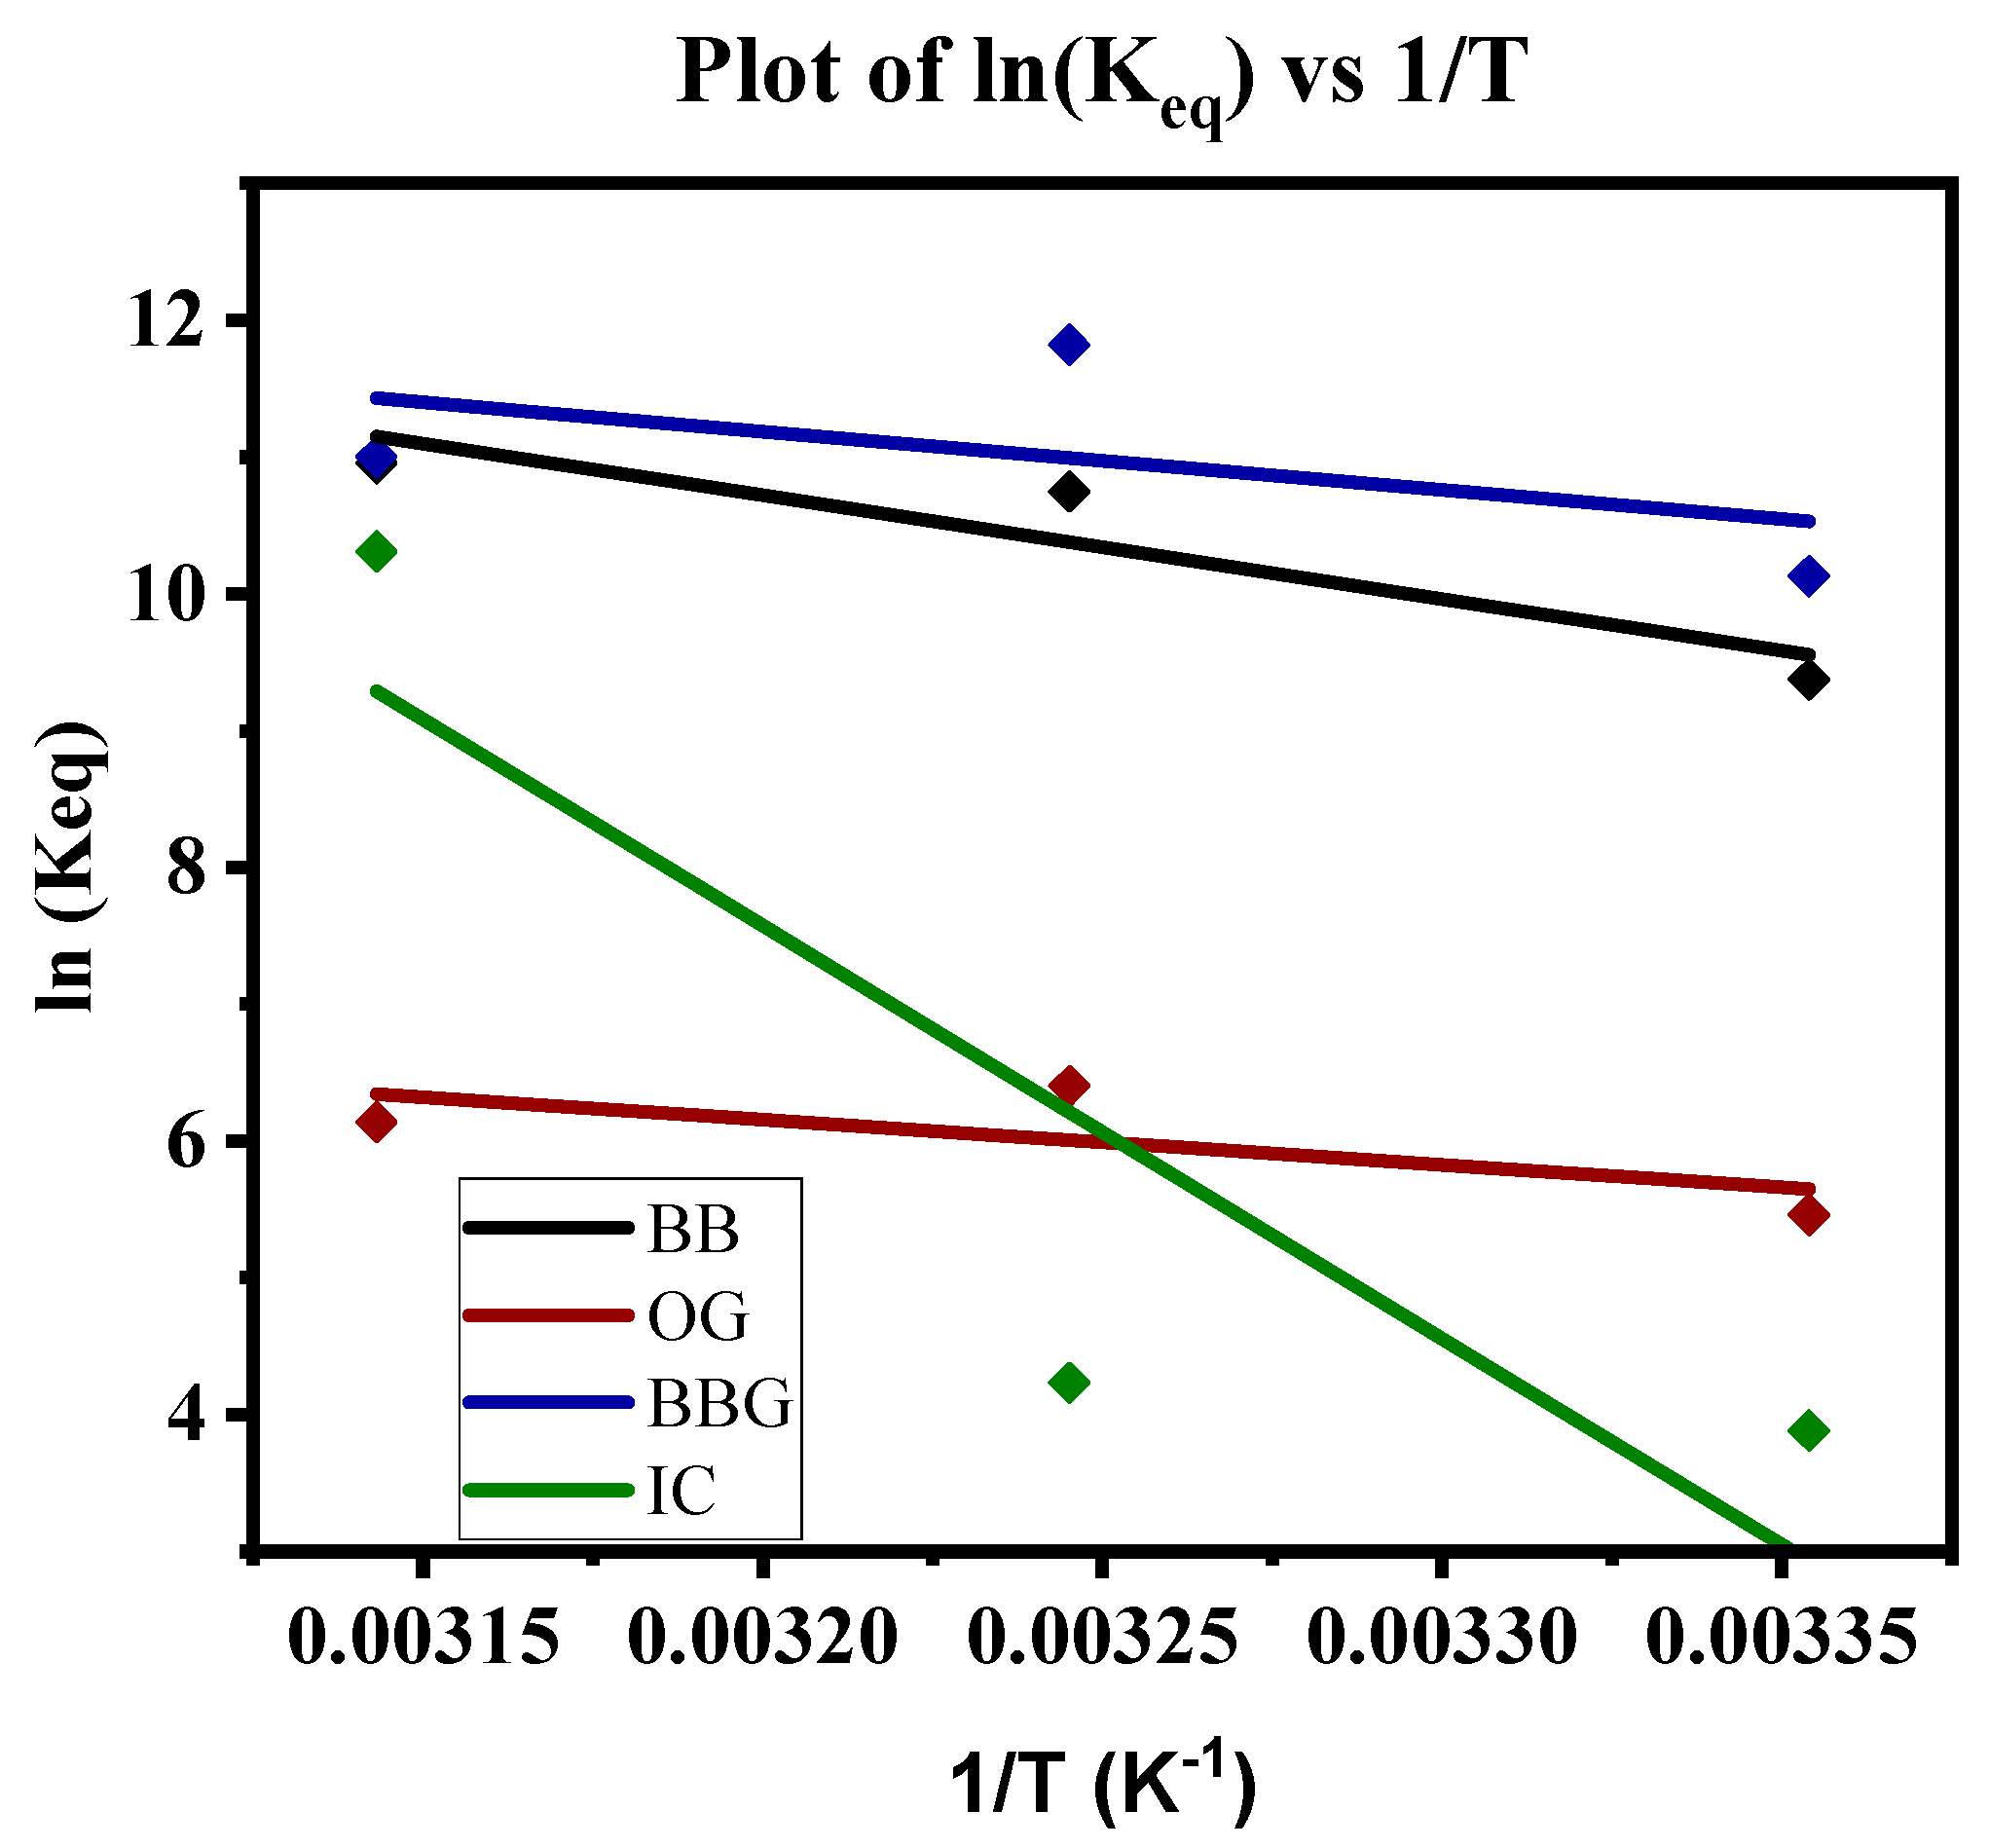
3.7. Adsorption Thermodynamics
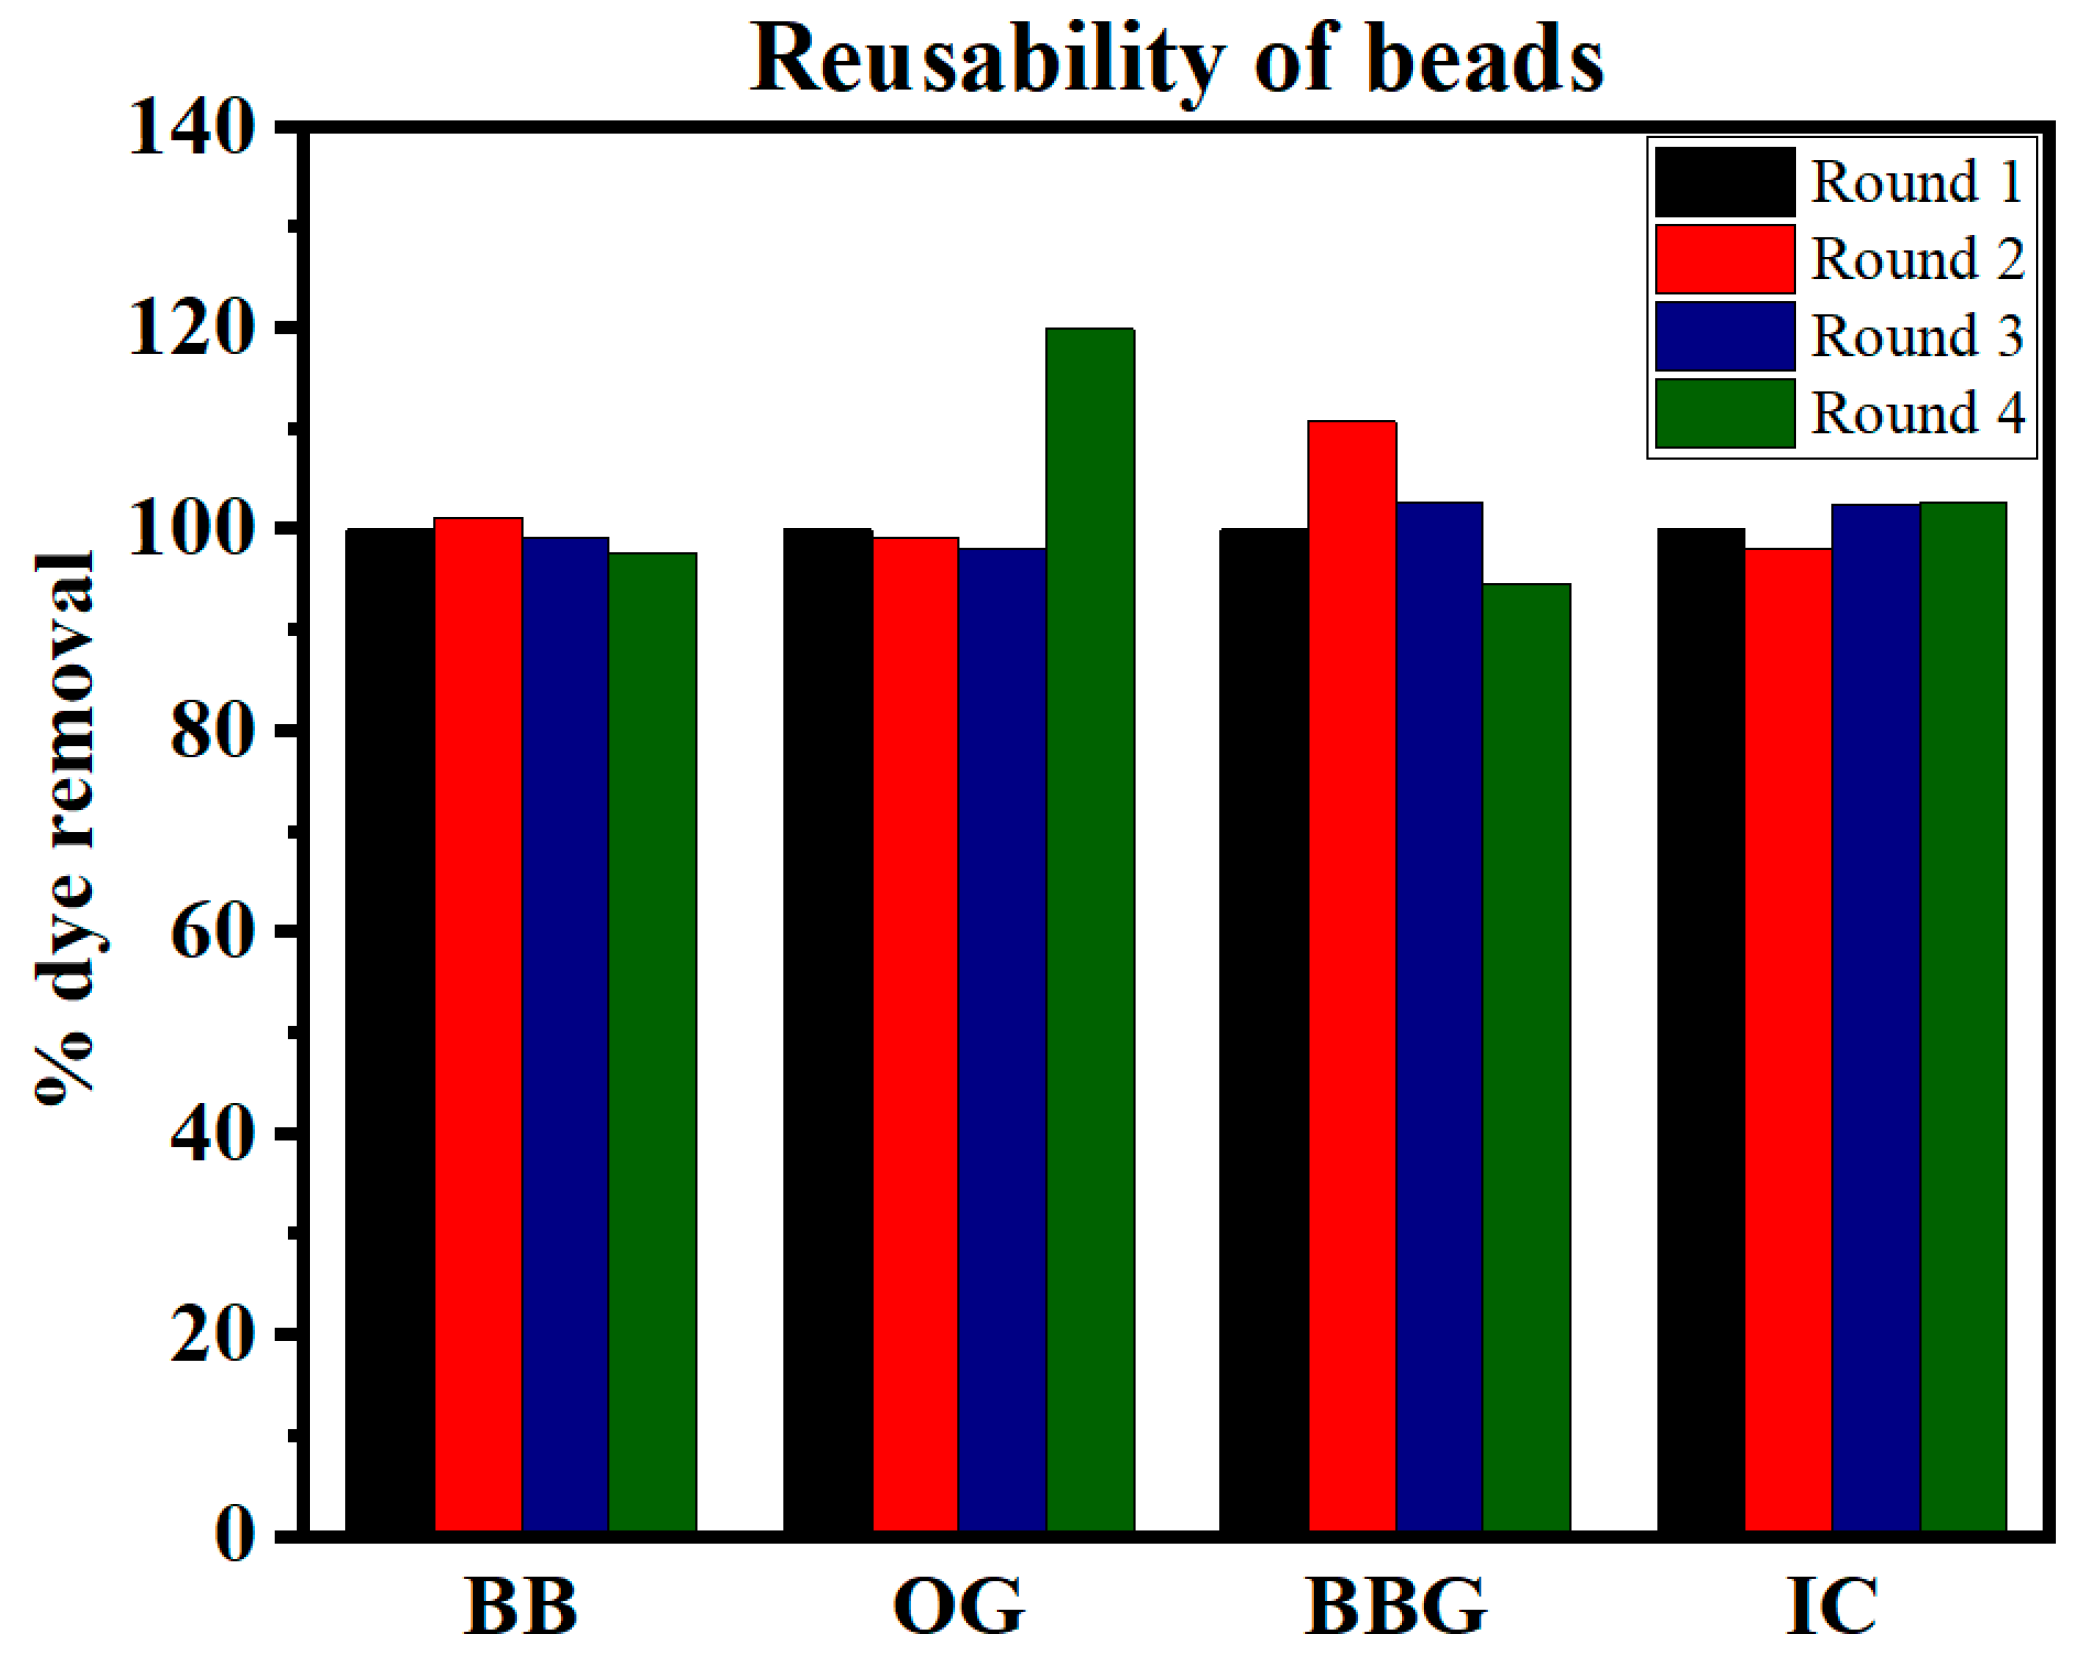
3.8. Reusability
3.9. Degradation of Dye Mixtures
4. Conclusions
Author Contributions
Funding
Institutional Review Board Statement
Data Availability Statement
Conflicts of Interest
Appendix A

References
- Varjani, S.; Rakholiya, P.; Ng, H.Y.; You, S.; Teixeira, J.A. Microbial degradation of dyes: An overview. Bioresour. Technol. 2020, 314, 123728. [Google Scholar] [CrossRef] [PubMed]
- Wang, X.; Jiang, J.; Gao, W. Reviewing textile wastewater produced by industries: Characteristics, environmental impacts, and treatment strategies. Water Sci. Technol. 2022, 85, 2076–2096. [Google Scholar] [CrossRef]
- Zhai, L.; Bai, Z.; Zhu, Y.; Wang, B.; Luo, W. Fabrication of chitosan microspheres for efficient adsorption of methyl orange. Chin. J. Chem. Eng. 2018, 26, 657–666. [Google Scholar] [CrossRef]
- Al-Tohamy, R.; Ali, S.S.; Li, F.; Okasha, K.M.; Mahmoud, Y.A.-G.; Elsamahy, T.; Jiao, H.; Fu, Y.; Sun, J. A critical review on the treatment of dye-containing wastewater: Ecotoxicological and health concerns of textile dyes and possible remediation approaches for environmental safety. Ecotoxicol. Environ. Saf. 2022, 231, 113160. [Google Scholar] [CrossRef]
- Kishor, R.; Purchase, D.; Saratale, G.D.; Saratale, R.G.; Ferreira, L.F.R.; Bilal, M.; Chandra, R.; Bharagava, R.N. Ecotoxicological and health concerns of persistent coloring pollutants of textile industry wastewater and treatment approaches for environmental safety. J. Environ. Chem. Eng. 2021, 9, 105012. [Google Scholar] [CrossRef]
- Tkaczyk, A.; Mitrowska, K.; Posyniak, A. Synthetic organic dyes as contaminants of the aquatic environment and their implications for ecosystems: A review. Sci. Total Environ. 2020, 717, 137222. [Google Scholar] [CrossRef]
- Rai, A.; Chauhan, P.S.; Bhattacharya, S. Remediation of Industrial Effluents. In Water Remediation; Bhattacharya, S., Gupta, A.B., Gupta, A., Pandey, A., Eds.; Springer: Singapore, 2018; pp. 171–187. [Google Scholar] [CrossRef]
- Islam, M.; Mostafa, M. Textile Dyeing Effluents and Environment Concerns—A Review. J. Environ. Sci. Nat. Resour. 2019, 11, 131–144. [Google Scholar] [CrossRef]
- Karri, R.R.; Ravindran, G.; Dehghani, M.H. Chapter 1-Wastewater—Sources, Toxicity, and Their Consequences to Human Health. In Soft Computing Techniques in Solid Waste and Wastewater Management; Karri, R.R., Ravindran, G., Dehghani, M.H., Eds.; Elsevier: Amsterdam, The Netherlands, 2021; pp. 3–33. [Google Scholar] [CrossRef]
- Khan, S.; Malik, A. Environmental and Health Effects of Textile Industry Wastewater. In Environmental Deterioration and Human Health: Natural and Anthropogenic Determinants; Malik, A., Grohmann, E., Akhtar, R., Eds.; Springer: Dordrecht, The Netherlands, 2014; pp. 55–71. [Google Scholar] [CrossRef]
- Liang, C.-Z.; Sun, S.-P.; Li, F.-Y.; Ong, Y.-K.; Chung, T.-S. Treatment of highly concentrated wastewater containing multiple synthetic dyes by a combined process of coagulation/flocculation and nanofiltration. J. Membr. Sci. 2014, 469, 306–315. [Google Scholar] [CrossRef]
- Hussain, S.; Kamran, M.; Khan, S.A.; Shaheen, K.; Shah, Z.; Suo, H.; Khan, Q.; Shah, A.B.; Rehman, W.U.; Al-Ghamdi, Y.O.; et al. Adsorption, kinetics and thermodynamics studies of methyl orange dye sequestration through chitosan composites films. Int. J. Biol. Macromol. 2021, 168, 383–394. [Google Scholar] [CrossRef]
- Bastami, T.R.; Khaknahad, S.; Malekshahi, M. Sonochemical versus reverse-precipitation synthesis of CuxO/Fe2O3/MoC nano-hybrid: Removal of reactive dyes and evaluation of smartphone for colorimetric detection of organic dyes in water media. Environ. Sci. Pollut. Res. 2020, 27, 9364–9381. [Google Scholar] [CrossRef]
- Joseph, J.; Radhakrishnan, R.C.; Johnson, J.K.; Joy, S.P.; Thomas, J. Ion-exchange mediated removal of cationic dye-stuffs from water using ammonium phosphomolybdate. Mater. Chem. Phys. 2020, 242, 122488. [Google Scholar] [CrossRef]
- Al-Othman, A.; Darwish, N.N.; Qasim, M.; Tawalbeh, M.; Darwish, N.A.; Hilal, N. Nuclear desalination: A state-of-the-art review. Desalination 2019, 457, 39–61. [Google Scholar] [CrossRef]
- Moradihamedani, P. Recent advances in dye removal from wastewater by membrane technology: A review. Polym. Bull. 2022, 79, 2603–2631. [Google Scholar] [CrossRef]
- Selim, M.T.; Salem, S.S.; Mohamed, A.A.; El-Gamal, M.S.; Awad, M.F.; Fouda, A. Biological Treatment of Real Textile Effluent Using Aspergillus flavus and Fusarium oxysporium and Their Consortium along with the Evaluation of Their Phytotoxicity. J. Fungi 2021, 7, 193. [Google Scholar] [CrossRef]
- Rafiq, A.; Ikram, M.; Ali, S.; Niaz, F.; Khan, M.; Khan, Q.; Maqbool, M. Photocatalytic degradation of dyes using semiconductor photocatalysts to clean industrial water pollution. J. Ind. Eng. Chem. 2021, 97, 111–128. [Google Scholar] [CrossRef]
- Katheresan, V.; Kansedo, J.; Lau, S.Y. Efficiency of various recent wastewater dye removal methods: A review. J. Environ. Chem. Eng. 2018, 6, 4676–4697. [Google Scholar] [CrossRef]
- Bal, G.; Thakur, A. Distinct approaches of removal of dyes from wastewater: A review. Mater. Today Proc. 2022, 50, 1575–1579. [Google Scholar] [CrossRef]
- Adesanmi, B.; Hung, Y.-T.; Paul, H.; Huhnke, C. Comparison of dye wastewater treatment methods: A review. GSC Adv. Res. Rev. 2022, 10, 126–137. [Google Scholar] [CrossRef]
- García-Montaño, J.; Torrades, F.; García-Hortal, J.A.; Domènech, X.; Peral, J. Combining photo-Fenton process with aerobic sequencing batch reactor for commercial hetero-bireactive dye removal. Appl. Catal. B Environ. 2006, 67, 86–92. [Google Scholar] [CrossRef]
- Zeb, S.; Hussain, S.; Khan, H.A.; Ali, Z.; Khan, N.; Khan, K.I.; Ali, F.; khan, S.; del Pilar Taboada Sotomayor, M.; Gul, S. Electrochemical Oxidation of Acid Brown 98 using Ti/Ru0.3Ti0.7O2 Composite Anode. Int. J. Electrochem. Sci. 2018, 13, 9428–9440. [Google Scholar] [CrossRef]
- Wang, J.; Yao, J.; Wang, L.; Xue, Q.; Hu, Z.; Pan, B. Multivariate optimization of the pulse electrochemical oxidation for treating recalcitrant dye wastewater. Sep. Purif. Technol. 2020, 230, 115851. [Google Scholar] [CrossRef]
- Mok, C.F.; Ching, Y.C.; Muhamad, F.; Osman, N.A.A.; Hai, N.D.; Hassan, C.R.C. Adsorption of Dyes Using Polyvinyl alcohol PVA and PVA-Based Polymer Composite Adsorbents: A Review. J. Polym. Environ. 2020, 28, 775–793. [Google Scholar] [CrossRef]
- Sadiq, A.C.; Olasupo, A.; Ngah, W.S.W.; Rahim, N.Y.; Suah, F.B.M. A decade development in the application of chitosan-based materials for dye adsorption: A short review. Int. J. Biol. Macromol. 2021, 191, 1151–1163. [Google Scholar] [CrossRef] [PubMed]
- Thakur, S. An overview on alginate based bio-composite materials for wastewater remedial. Mater. Today Proc. 2021, 37, 3305–3309. [Google Scholar] [CrossRef]
- Tolkou, A.K.; Tsoutsa, E.K.; Kyzas, G.Z.; Katsoyiannis, I.A. Sustainable use of low-cost adsorbents prepared from waste fruit peels for the removal of selected reactive and basic dyes found in wastewaters. Environ. Sci. Pollut. Res. 2024, 31, 14662–14689. [Google Scholar] [CrossRef]
- Sonal, S.; Acharya, S.; Mishra, B.K. Mesoporous carbon structure impregnated with 2D engineered zirconium: A sustainable adsorbent for the removal of dyes from the aqueous solution. J. Environ. Manag. 2022, 314, 115009. [Google Scholar] [CrossRef]
- Kavitha, V.U.; Kandasubramanian, B. Tannins for wastewater treatment. SN Appl. Sci. 2020, 2, 1081. [Google Scholar] [CrossRef]
- Chenab, K.K.; Sohrabi, B.; Jafari, A.; Ramakrishna, S. Water treatment: Functional nanomaterials and applications from adsorption to photodegradation. Mater. Today Chem. 2020, 16, 100262. [Google Scholar] [CrossRef]
- Chai, W.S.; Cheun, J.Y.; Kumar, P.S.; Mubashir, M.; Majeed, Z.; Banat, F.; Ho, S.-H.; Show, P.L. A review on conventional and novel materials towards heavy metal adsorption in wastewater treatment application. J. Clean. Prod. 2021, 296, 126589. [Google Scholar] [CrossRef]
- Dutta, S.; Gupta, B.; Kumar, S.; Kumar, A. Recent advances on the removal of dyes from wastewater using various adsorbents: A critical review. Mater. Adv. 2021, 2, 4497–4531. [Google Scholar] [CrossRef]
- Raninga, M.; Mudgal, A.; Patel, V.K.; Patel, J.; Sinha, M.K. Modification of activated carbon-based adsorbent for removal of industrial dyes and heavy metals: A review. Mater. Today: Proc. 2023, 77, 286–294. [Google Scholar] [CrossRef]
- Sultana, M.; Rownok, M.H.; Sabrin, M.; Rahaman, M.H.; Alam, S.M.N. A review on experimental chemically modified activated carbon to enhance dye and heavy metals adsorption. Clean. Eng. Technol. 2022, 6, 100382. [Google Scholar] [CrossRef]
- Adegoke, K.A.; Akinnawo, S.O.; Adebusuyi, T.A.; Ajala, O.A.; Adegoke, R.O.; Maxakato, N.W.; Bello, O.S. Modified biomass adsorbents for removal of organic pollutants: A review of batch and optimization studies. Int. J. Environ. Sci. Technol. 2023, 20, 11615–11644. [Google Scholar] [CrossRef]
- Mishra, S.; Cheng, L.; Maiti, A. The utilization of agro-biomass/byproducts for effective bio-removal of dyes from dyeing wastewater: A comprehensive review. J. Environ. Chem. Eng. 2021, 9, 104901. [Google Scholar] [CrossRef]
- Ewis, D.; Ba-Abbad, M.M.; Benamor, A.; El-Naas, M.H. Adsorption of organic water pollutants by clays and clay minerals composites: A comprehensive review. Appl. Clay Sci. 2022, 229, 106686. [Google Scholar] [CrossRef]
- Zhang, T.; Wang, W.; Zhao, Y.; Bai, H.; Wen, T.; Kang, S.; Song, G.; Song, S.; Komarneni, S. Removal of heavy metals and dyes by clay-based adsorbents: From natural clays to 1D and 2D nano-composites. Chem. Eng. J. 2021, 420, 127574. [Google Scholar] [CrossRef]
- Waheed, A.; Baig, N.; Ullah, N.; Falath, W. Removal of hazardous dyes, toxic metal ions and organic pollutants from wastewater by using porous hyper-cross-linked polymeric materials: A review of recent advances. J. Environ. Manag. 2021, 287, 112360. [Google Scholar] [CrossRef]
- Stejskal, J. Interaction of conducting polymers, polyaniline and polypyrrole, with organic dyes: Polymer morphology control, dye adsorption and photocatalytic decomposition. Chem. Pap. 2020, 74, 1–54. [Google Scholar] [CrossRef]
- Biswas, S.; Pal, A. Application of biopolymers as a new age sustainable material for surfactant adsorption: A brief review. Carbohydr. Polym. Technol. Appl. 2021, 2, 100145. [Google Scholar] [CrossRef]
- Crini, G. Non-conventional low-cost adsorbents for dye removal: A review. Bioresour. Technol. 2006, 97, 1061–1085. [Google Scholar] [CrossRef]
- Liu, X.; Zhao, X.; Liu, Y.; Zhang, T. Review on preparation and adsorption properties of chitosan and chitosan composites. Polym. Bull. 2022, 79, 2633–2665. [Google Scholar] [CrossRef]
- Desbrières, J.; Guibal, E. Chitosan for wastewater treatment. Polym. Int. 2018, 67, 7–14. [Google Scholar] [CrossRef]
- Elzahar, M.M.H.; Bassyouni, M. Removal of direct dyes from wastewater using chitosan and polyacrylamide blends. Sci. Rep. 2023, 13, 15750. [Google Scholar] [CrossRef] [PubMed]
- Mohan, K.; Rajan, D.K.; Rajarajeswaran, J.; Divya, D.; Ganesan, A.R. Recent trends on chitosan based hybrid materials for wastewater treatment: A review. Curr. Opin. Environ. Sci. Health 2023, 33, 100473. [Google Scholar] [CrossRef]
- Aramesh, N.; Bagheri, A.R.; Bilal, M. Chitosan-based hybrid materials for adsorptive removal of dyes and underlying interaction mechanisms. Int. J. Biol. Macromol. 2021, 183, 399–422. [Google Scholar] [CrossRef]
- Das, L.; Das, P.; Bhowal, A.; Bhattachariee, C. Synthesis of hybrid hydrogel nano-polymer composite using Graphene oxide, Chitosan and PVA and its application in waste water treatment. Environ. Technol. Innov. 2020, 18, 100664. [Google Scholar] [CrossRef]
- Zhao, X.; Wang, X.; Lou, T. Simultaneous adsorption for cationic and anionic dyes using chitosan/electrospun sodium alginate nanofiber composite sponges. Carbohydr. Polym. 2022, 276, 118728. [Google Scholar] [CrossRef]
- Wu, S.; Shi, W.; Li, K.; Cai, J.; Xu, C.; Gao, L.; Lu, J.; Ding, F. Chitosan-based hollow nanofiber membranes with polyvinylpyrrolidone and polyvinyl alcohol for efficient removal and filtration of organic dyes and heavy metals. Int. J. Biol. Macromol. 2023, 239, 124264. [Google Scholar] [CrossRef]
- Khorshidi, A.G.; Khalaji, A.D. Chitosan-polyvinylpyrrolidone composite as an efficient adsorbent for eosin Y dye from aqueous solution. J. Polym. Environ. 2024, 32, 4577–4588. [Google Scholar] [CrossRef]
- Zhang, Y.; Wang, F.; Wang, Y. Recent developments of electrospun nanofibrous materials as novel adsorbents for water treatment. Mater. Today Commun. 2021, 27, 102272. [Google Scholar] [CrossRef]
- Alwi, M.A.M.; Normaya, E.; Ismail, H.; Iqbal, A.; Piah, B.M.; Samah, M.A.A.; Ahmad, M.N. Two-Dimensional Infrared Correlation Spectroscopy, Conductor-like Screening Model for Real Solvents, and Density Functional Theory Study on the Adsorption Mechanism of Polyvinylpolypyrrolidone for Effective Phenol Removal in an Aqueous Medium. ACS Omega 2021, 6, 25179–25192. [Google Scholar] [CrossRef] [PubMed]
- Ougiya, H.; Hioki, N.; Watanabe, K.; Morinaga, Y.; Yoshinaga, F.; Samejima, M. Relationship between the Physical Properties and Surface Area of Cellulose Derived from Adsorbates of Various Molecular Sizes. Biosci. Biotechnol. Biochem. 1998, 62, 1880–1884. [Google Scholar] [CrossRef] [PubMed]
- Spence, K.L.; Venditti, R.A.; Rojas, O.J.; Habibi, Y.; Pawlak, J.J. The effect of chemical composition on microfibrillar cellulose films from wood pulps: Water interactions and physical properties for packaging applications. Cellulose 2010, 17, 835–848. [Google Scholar] [CrossRef]
- da Silva, P.M.M.; Camparotto, N.G.; de Figueiredo Neves, T.; Lira, K.T.G.; Mastelaro, V.R.; Picone, C.S.F.; Prediger, P. Effective removal of basic dye onto sustainable chitosan beads: Batch and fixed-bed column adsorption, beads stability and mechanism. Sustain. Chem. Pharm. 2020, 18, 100348. [Google Scholar] [CrossRef]
- Zhang, W.; Wang, P.; Deng, Y.; He, X.; Yang, X.; Chen, R.; Lei, Z. Preparation of superabsorbent polymer gel based on PVPP and its application in water-holding in sandy soil. J. Environ. Chem. Eng. 2021, 9, 106760. [Google Scholar] [CrossRef]
- Qiao, C.; Ma, X.; Wang, X.; Liu, L. Structure and properties of chitosan films: Effect of the type of solvent acid. LWT 2021, 135, 109984. [Google Scholar] [CrossRef]
- Gupta, S.; Vasanth, D.; Kumar, A. Physicochemical analysis of chitosan oligosaccharide revealed its usefulness in effective delivery of drugs. J. Biomater. Sci. Polym. Ed. 2024, 9, 1–19. [Google Scholar] [CrossRef]
- Han, X.; Zheng, Z.; Yu, C.; Deng, Y.; Ye, Q.; Niu, F.; Chen, Q.; Pan, W.; Wang, Y. Preparation, characterization and antibacterial activity of new ionized chitosan. Carbohydr. Polym. 2022, 290, 119490. [Google Scholar] [CrossRef] [PubMed]
- Sudatta, B.P.; Sugumar, V.; Varma, R.; Nigariga, P. Extraction, characterization and antimicrobial activity of chitosan from pen shell, Pinna bicolor. Int. J. Biol. Macromol. 2020, 163, 423–430. [Google Scholar] [CrossRef]
- Zhang, W.; Cao, J.; Jiang, W. Analysis of film-forming properties of chitosan with different molecular weights and its adhesion properties with different postharvest fruit surfaces. Food Chem. 2022, 395, 133605. [Google Scholar] [CrossRef]
- Jabli, M.; Hamdaoui, M.; Jabli, A.; Ghandour, Y.; Hassine, B.B. A comparative study on the performance of dye removal, from aqueous suspension, using 2-hydroxypropyl-β-cyclodextrin-CS, PVP-PVA-CS, PVA-CS, PVP-CS and plain CS microspheres. J. Text. Inst. 2014, 105, 661–675. [Google Scholar] [CrossRef]
- Pourhakkak, P.; Taghizadeh, A.; Taghizadeh, M.; Ghaedi, M.; Haghdoust, S. Chapter 1-Fundamentals of adsorption technology. In Interface Science and Technology; Ghaedi, M., Ed.; Elsevier: Amsterdam, The Netherlands, 2021; pp. 1–70. [Google Scholar] [CrossRef]
- Tang, H.; Zhao, Y.; Shan, S.; Yang, X.; Liu, D.; Cui, F.; Xing, B. Theoretical insight into the adsorption of aromatic compounds on graphene oxide. Environ. Sci. Nano 2018, 5, 2357–2367. [Google Scholar] [CrossRef]
- Yang, X.; Wan, Y.; Zheng, Y.; He, F.; Yu, Z.; Huang, J.; Wang, H.; Ok, Y.S.; Jiang, Y.; Gao, B. Surface functional groups of carbon-based adsorbents and their roles in the removal of heavy metals from aqueous solutions: A critical review. Chem. Eng. J. 2019, 366, 608–621. [Google Scholar] [CrossRef] [PubMed]
- Mokhtar, A.; Abdelkrim, S.; Djelad, A.; Sardi, A.; Boukoussa, B.; Sassi, M.; Bengueddach, A. Adsorption behavior of cationic and anionic dyes on magadiite-chitosan composite beads. Carbohydr. Polym. 2020, 229, 115399. [Google Scholar] [CrossRef]
- Zhang, Y.; Zhao, M.; Cheng, Q.; Wang, C.; Li, H.; Han, X.; Fan, Z.; Su, G.; Pan, D.; Li, Z. Research progress of adsorption and removal of heavy metals by chitosan and its derivatives: A review. Chemosphere 2021, 279, 130927. [Google Scholar] [CrossRef]
- Wang, X.; Liu, Y.; Zheng, J. Removal of AsIII and AsV from water by chitosan and chitosan derivatives: A review. Environ. Sci. Pollut. Res. 2016, 23, 13789–13801. [Google Scholar] [CrossRef]
- Timaeva, O.; Pashkin, I.; Mulakov, S.; Kuzmicheva, G.; Konarev, P.; Terekhova, R.; Sadovskaya, N.; Czakkel, O.; Prevost, S. Synthesis and physico-chemical properties of polyN-vinyl pyrrolidone-based hydrogels with titania nanoparticles. J. Mater. Sci. 2020, 55, 3005–3021. [Google Scholar] [CrossRef]
- Du, R.; Cao, H.; Wang, G.; Dou, K.; Tsidaeva, N.; Wang, W. PVP modified rGO/CoFe2O4 magnetic adsorbents with a unique sandwich structure and superior adsorption performance for anionic and cationic dyes. Sep. Purif. Technol. 2022, 286, 120484. [Google Scholar] [CrossRef]
- Sirajudheen, P.; Poovathumkuzhi, N.C.; Vigneshwaran, S.; Chelaveettil, B.M.; Meenakshi, S. Applications of chitin and chitosan based biomaterials for the adsorptive removal of textile dyes from water—A comprehensive review. Carbohydr. Polym. 2021, 273, 118604. [Google Scholar] [CrossRef]
- Qamar, S.A.; Ashiq, M.; Jahangeer, M.; Riasat, A.; Bilal, M. Chitosan-based hybrid materials as adsorbents for textile dyes–A review. Case Stud. Chem. Environ. Eng. 2020, 2, 100021. [Google Scholar] [CrossRef]
- Ahmadi, Y.; Kim, K.-H. Hyperbranched polymers as superior adsorbent for the treatment of dyes in water. Adv. Colloid Interface Sci. 2022, 302, 102633. [Google Scholar] [CrossRef] [PubMed]
- Folch-Cano, C.; Olea-Azar, C.; Speisky, H. Structural and thermodynamic factors on the adsorption process of phenolic compounds onto polyvinylpolypyrrolidone. Colloids Surf. A Physicochem. Eng. Asp. 2013, 418, 105–111. [Google Scholar] [CrossRef]
- Solanki, S.; Sinha, S.; Seth, C.S.; Tyagi, S.; Goyal, A.; Singh, R. Enhanced adsorption of Bismark Brown R dye by chitosan conjugated magnetic pectin loaded filter mud: A comprehensive study on modeling and mechanisms. Int. J. Biol. Macromol. 2024, 270, 131987. [Google Scholar] [CrossRef]
- Dai, M. The Effect of Zeta Potential of Activated Carbon on the Adsorption of Dyes from Aqueous Solution: I. The Adsorption of Cationic Dyes: Methyl Green and Methyl Violet. J. Colloid Interface Sci. 1994, 164, 223–228. [Google Scholar] [CrossRef]
- Sivashankar, R.; Sathya, A.B.; Vasantharaj, K.; Sivasubramanian, V. Magnetic composite an environmental super adsorbent for dye sequestration—A review. Environ. Nanotechnol. Monit. Manag. 2014, 1–2, 36–49. [Google Scholar] [CrossRef]
- Huang, C.; Liao, H.; Ma, X.; Xiao, M.; Liu, X.; Gong, S.; Shu, X.; Zhou, X. Adsorption performance of chitosan Schiff base towards anionic dyes: Electrostatic interaction effects. Chem. Phys. Lett. 2021, 780, 138958. [Google Scholar] [CrossRef]
- Gajera, R.; Patel, R.V.; Yadav, A.; Labhasetwar, P.K. Adsorption of cationic and anionic dyes on photocatalytic flyash/TiO2 modified chitosan biopolymer composite. J. Water Process Eng. 2022, 49, 102993. [Google Scholar] [CrossRef]
- Lohrentz, L.; Bhaumik, M.; Brink, H.G. High-capacity adsorption of hexavalent chromium by a polyaniline-Ni0 nanocomposite adsorbent: Expanding the Langmuir-Hinshelwood kinetic model. J. Mol. Liq. 2023, 389, 122931. [Google Scholar] [CrossRef]
- Adeyemo, A.A.; Adeoye, I.O.; Bello, O.S. Adsorption of dyes using different types of clay: A review. Appl. Water Sci. 2017, 7, 543–568. [Google Scholar] [CrossRef]
- Mangla, D.; Sharma, A.; Ikram, S. Synthesis of ecological chitosan/PVP magnetic composite: Remediation of amoxicillin trihydrate from its aqueous solution, isotherm modelling, thermodynamic, and kinetic studies. React. Funct. Polym. 2022, 175, 105261. [Google Scholar] [CrossRef]
- Zhou, Y.; Lu, J.; Zhou, Y.; Liu, Y. Recent advances for dyes removal using novel adsorbents: A review. Environ. Pollut. 2019, 252, 352–365. [Google Scholar] [CrossRef] [PubMed]
- Yagub, M.T.; Sen, T.K.; Afroze, S.; Ang, H.M. Dye and its removal from aqueous solution by adsorption: A review. Adv. Colloid Interface Sci. 2014, 209, 172–184. [Google Scholar] [CrossRef] [PubMed]
- Ouachtak, H.; El Guerdaoui, A.; Haounati, R.; Akhouairi, S.; El Haouti, R.; Hafid, N.; Addi, A.A.; Šljukić, B.; Santos, D.M.F.; Taha, M.L. Highly efficient and fast batch adsorption of orange G dye from polluted water using superb organo-montmorillonite: Experimental study and molecular dynamics investigation. J. Mol. Liq. 2021, 335, 116560. [Google Scholar] [CrossRef]
- Mondal, M.K.; Singh, S.; Umareddy, M.; Dasgupta, B. Removal of Orange G from aqueous solution by hematite: Isotherm and mass transfer studies. Korean J. Chem. Eng. 2010, 27, 1811–1815. [Google Scholar] [CrossRef]
- Banerjee, S.; Dubey, S.; Gautam, R.K.; Chattopadhyaya, M.C.; Sharma, Y.C. Adsorption characteristics of alumina nanoparticles for the removal of hazardous dye, Orange G from aqueous solutions. Arab. J. Chem. 2019, 12, 5339–5354. [Google Scholar] [CrossRef]
- Sircar, S. Comments on practical use of Langmuir gas adsorption isotherm model. Adsorption 2017, 23, 121–130. [Google Scholar] [CrossRef]
- Alafnan, S.; Awotunde, A.; Glatz, G.; Adjei, S.; Alrumaih, I.; Gowida, A. Langmuir adsorption isotherm in unconventional resources: Applicability and limitations. J. Pet. Sci. Eng. 2021, 207, 109172. [Google Scholar] [CrossRef]
- Ebadi, A.; Mohammadzadeh, J.S.S.; Khudiev, A. What is the correct form of BET isotherm for modeling liquid phase adsorption? Adsorption 2009, 15, 65–73. [Google Scholar] [CrossRef]
- van Erp, T.S.; Martens, J.A. A standardization for BET fitting of adsorption isotherms. Microporous Mesoporous Mater. 2011, 145, 188–193. [Google Scholar] [CrossRef]
- Al-Ghouti, M.A.; Da’ana, D.A. Guidelines for the use and interpretation of adsorption isotherm models: A review. J. Hazard. Mater. 2020, 393, 122383. [Google Scholar] [CrossRef]
- Skopp, J. Derivation of the Freundlich Adsorption Isotherm from Kinetics. J. Chem. Educ. 2009, 86, 1341. [Google Scholar] [CrossRef]
- Lagergren, S.K. About the Theory of So-called Adsorption of Soluble Substances. Sven. Vetenskapsakad. Handingarl. 1898, 24, 1–39. [Google Scholar]
- Ho, Y.S.; McKay, G. Pseudo-second order model for sorption processes. Process Biochem. 1999, 34, 451–465. [Google Scholar] [CrossRef]
- Rudzinski, W.; Plazinski, W. Studies of the Kinetics of Solute Adsorption at Solid/Solution Interfaces: On the Possibility of Distinguishing between the Diffusional and the Surface Reaction Kinetic Models by Studying the Pseudo-First-order Kinetics. J. Phys. Chem. C 2007, 111, 15100–15110. [Google Scholar] [CrossRef]
- Salvestrini, S. Analysis of the Langmuir rate equation in its differential and integrated form for adsorption processes and a comparison with the pseudo first and pseudo second order models. Reac Kinet. Mech. Cat. 2018, 123, 455–472. [Google Scholar] [CrossRef]
- Xiao, Y.; Azaiez, J.; Hill, J.M. Erroneous Application of Pseudo-Second-Order Adsorption Kinetics Model: Ignored Assumptions and Spurious Correlations. Ind. Eng. Chem. Res. 2018, 57, 2705–2709. [Google Scholar] [CrossRef]
- Weber, W.J.; Morris, J.C. Kinetics of Adsorption on Carbon from Solution. J. Sanit. Eng. Div. 1963, 89, 31–59. [Google Scholar] [CrossRef]
- Boyd, G.E.; Adamson, A.W.; Myers, L.S. The Exchange Adsorption of Ions from Aqueous Solutions by Organic Zeolites. II. Kinetics 1. J. Am. Chem. Soc. 1947, 69, 2836–2848. [Google Scholar] [CrossRef]
- Reichenberg, D. Properties of Ion-Exchange Resins in Relation to their Structure. III. Kinetics of Exchange. J. Am. Chem. Soc. 1953, 75, 589–597. [Google Scholar] [CrossRef]
- Malash, G.F.; El-Khaiary, M.I. Piecewise linear regression: A statistical method for the analysis of experimental adsorption data by the intraparticle-diffusion models. Chem. Eng. J. 2010, 163, 256–263. [Google Scholar] [CrossRef]
- Hu, Q.; Ma, S.; He, Z.; Liu, H.; Pei, X. A revisit on intraparticle diffusion models with analytical solutions: Underlying assumption, application scope and solving method. J. Water Process Eng. 2024, 60, 105241. [Google Scholar] [CrossRef]
- Wang, J.; Guo, X. Rethinking of the intraparticle diffusion adsorption kinetics model: Interpretation, solving methods and applications. Chemosphere 2022, 309, 136732. [Google Scholar] [CrossRef] [PubMed]
- Wu, F.-C.; Tseng, R.-L.; Juang, R.-S. Initial behavior of intraparticle diffusion model used in the description of adsorption kinetics. Chem. Eng. J. 2009, 153, 1–8. [Google Scholar] [CrossRef]
- Saha, P.; Chowdhury, S. Insight Into Adsorption Thermodynamics. In Thermodynamics; Tadashi, M., Ed.; InTechOpen Limited: London, UK, 2011. [Google Scholar] [CrossRef]
- Cristóvão, R.O.; Tavares, A.P.M.; Ferreira, L.A.; Loureiro, J.M.; Boaventura, R.A.R.; Macedo, E.A. Modeling the discoloration of a mixture of reactive textile dyes by commercial laccase. Bioresour. Technol. 2009, 100, 1094–1099. [Google Scholar] [CrossRef] [PubMed]
- Routoula, E.; Patwardhan, S.V. Degradation of Anthraquinone Dyes from Effluents: A Review Focusing on Enzymatic Dye Degradation with Industrial Potential. Environ. Sci. Technol. 2020, 54, 647–664. [Google Scholar] [CrossRef]
- Tilli, S.; Ciullini, I.; Scozzafava, A.; Briganti, F. Differential decolorization of textile dyes in mixtures and the joint effect of laccase and cellobiose dehydrogenase activities present in extracellular extracts from Funalia trogii. Enzym. Microb. Technol. 2011, 49, 465–471. [Google Scholar] [CrossRef]


| Dye | Structure | Log P | pKa | Solubility (g/L) | BOD (mg/g) |
|---|---|---|---|---|---|
| Bismarck brown |  | 2.26 | 3.34 | 10 | 1.456 |
| Orange G |  | 4.931 | 11.5 | 80 | 1.176 |
| Indigo Carmine | 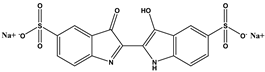 | 3.06 | 12.2 | 10 | 1.072 |
| Brilliant blue G |  | −0.35 | 12.4 | 40 | 0.43 g/g |
| Chitosan |  | −2.3 | 6.5 | Insoluble | - |
| PVPP |  | - | - | Insoluble | - |
| Model | BB | OG | BBG | IC | |
|---|---|---|---|---|---|
| Langmuir | Best-fit values | ||||
| Qm | 3.106 | 5305 * | 0.5927 | 4493 * | |
| KL | 0.02809 | 4.367 × 10⁻⁶ | 0.02632 | 2.691 × 10⁻⁶ | |
| Goodness of Fit | |||||
| R2 | 0.9937 | 0.9472 | 0.8668 | 0.9637 | |
| Freundlich | Best-fit values | ||||
| KF | 0.1026 | 0.002916 | 0.04808 | 0.002293 | |
| n | 1.254 | 0.6219 | 2.045 | 0.6946 | |
| Goodness of Fit | |||||
| R2 | 0.9914 | 0.9844 | 0.9323 | 0.9920 | |
| BET | Best-fit values | ||||
| Qm | 0.9650 | 0.2694 | 0.1470 | 0.2944 | |
| KS | 0.1059 | 0.07362 | 1.010 | 0.03098 | |
| KL | 0.01682 | 0.02070 | 0.009145 | 0.01241 | |
| Goodness of Fit | |||||
| R2 | 0.9926 | 0.9995 | 0.9725 | 0.9980 |
| Model | BB | OG | BBG | IC | |
|---|---|---|---|---|---|
| Pseudo first order | Best-fit values | ||||
| Qe | 0.6170 | 0.4139 | 0.3038 | 0.3677 | |
| k1 | 1.732 | 2.040 | 2.973 | 4.826 | |
| Goodness of Fit | |||||
| R2 | 0.9720 | 0.9733 | 0.9935 | 0.9993 | |
| Pseudo second order | Best-fit values | ||||
| Qe | 0.6489 | 0.4286 | 0.3098 | 0.3692 | |
| k1 | 5.634 | 12.71 | 38.48 | 168.9 | |
| Goodness of Fit | |||||
| R2 | 0.9867 | 0.9782 | 0.9958 | 0.9994 | |
| Boyd | Best-fit values | ||||
| Plateau | 0.6170 | 0.4139 | 0.3038 | 0.3677 | |
| K | 1.732 | 2.040 | 2.973 | 4.826 | |
| Goodness of Fit | |||||
| R2 | 0.9720 | 0.9733 | 0.9935 | 0.9993 | |
| Multiple linear regression | Best-fit values | ||||
| kWM1 | 0.5241 | 0.3661 | 0.2891 | 0.3651 | |
| kWM2 | 0.07301 | 0.05025 | 0.01114 | 0.0002281 | |
| kWM3 | 0.01037 | 0.01104 | 0.003359 | 0.003164 | |
| Goodness of Fit | |||||
| R2 | 0.9909 | 0.9805 | 0.9966 | 0.9997 |
| Dye | ∆G° (kJ/mol) | ∆H° (kJ/mol) | ∆S° (J/mol) | R2 | ||
|---|---|---|---|---|---|---|
| 25 °C | 35 °C | 45 °C | ||||
| BB | −23.24 | −27.53 | −28.99 | 62.95 | 290.55 | 0.8611 |
| OG | −13.53 | −16.40 | −16.23 | 27.37 | 138.74 | 0.5091 |
| BBG | −25.11 | −30.28 | −29.10 | 35.42 | 206.35 | 0.2824 |
| IC | −9.62 | −10.85 | −27.27 | 250.88 | 865.79 | 0.7756 |
Disclaimer/Publisher’s Note: The statements, opinions and data contained in all publications are solely those of the individual author(s) and contributor(s) and not of MDPI and/or the editor(s). MDPI and/or the editor(s) disclaim responsibility for any injury to people or property resulting from any ideas, methods, instructions or products referred to in the content. |
© 2024 by the authors. Licensee MDPI, Basel, Switzerland. This article is an open access article distributed under the terms and conditions of the Creative Commons Attribution (CC BY) license (https://creativecommons.org/licenses/by/4.0/).
Share and Cite
Kyomuhimbo, H.D.; McHunu, W.; Arnold, M.; Feleni, U.; Haneklaus, N.H.; Brink, H.G. Synthesis and Dye Adsorption Dynamics of Chitosan–Polyvinylpolypyrrolidone (PVPP) Composite. Polymers 2024, 16, 2555. https://doi.org/10.3390/polym16182555
Kyomuhimbo HD, McHunu W, Arnold M, Feleni U, Haneklaus NH, Brink HG. Synthesis and Dye Adsorption Dynamics of Chitosan–Polyvinylpolypyrrolidone (PVPP) Composite. Polymers. 2024; 16(18):2555. https://doi.org/10.3390/polym16182555
Chicago/Turabian StyleKyomuhimbo, Hilda Dinah, Wandile McHunu, Marco Arnold, Usisipho Feleni, Nils H. Haneklaus, and Hendrik Gideon Brink. 2024. "Synthesis and Dye Adsorption Dynamics of Chitosan–Polyvinylpolypyrrolidone (PVPP) Composite" Polymers 16, no. 18: 2555. https://doi.org/10.3390/polym16182555