

Dual-Method Characterization and Optimization of Drilling Parameters for Picosecond Laser Drilling Quality in CFRP


Abstract
:1. Introduction
2. Experiment
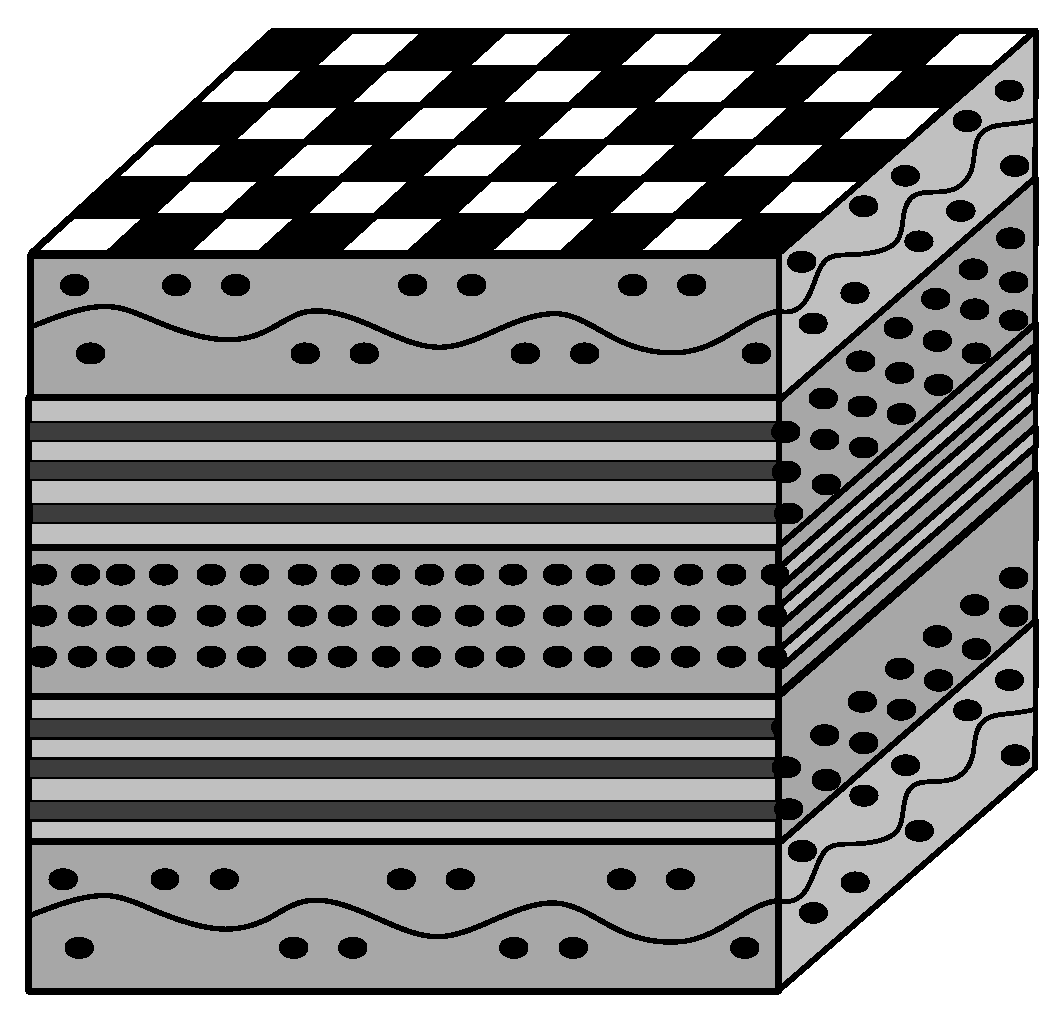
2.1. Materials
2.2. Laser Drilling Experimental Setup
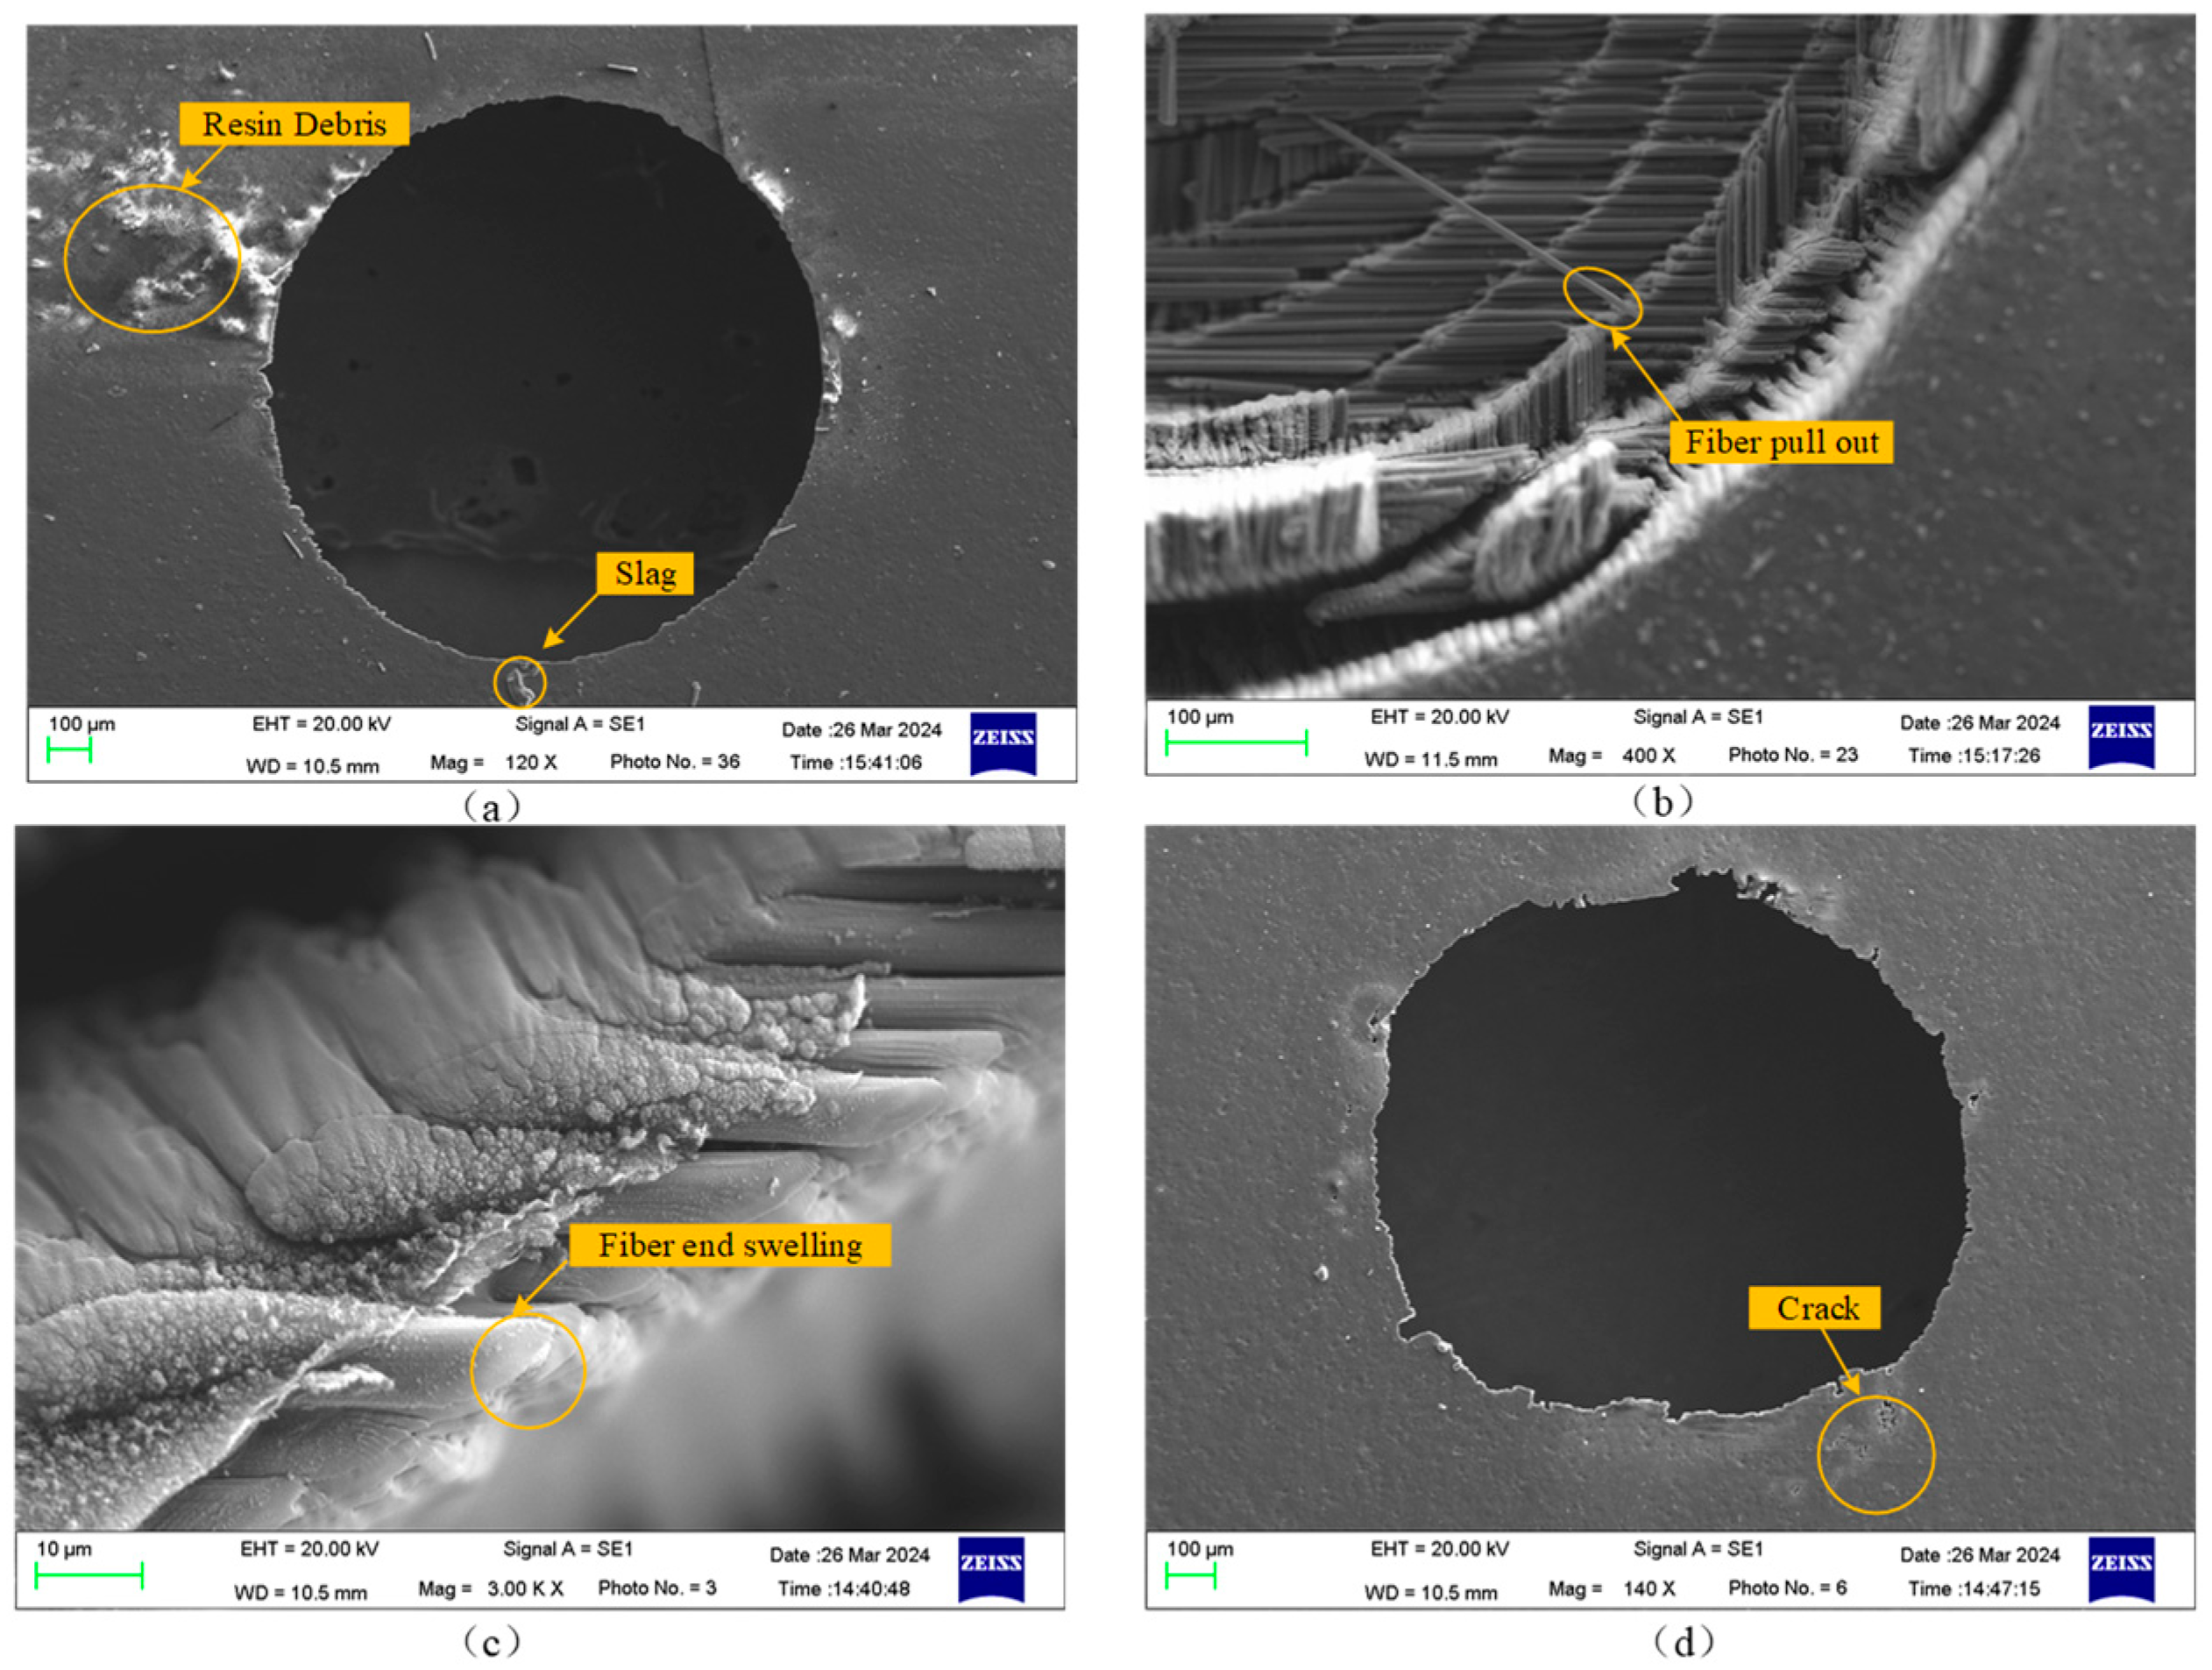
3. Measurement/Characterization
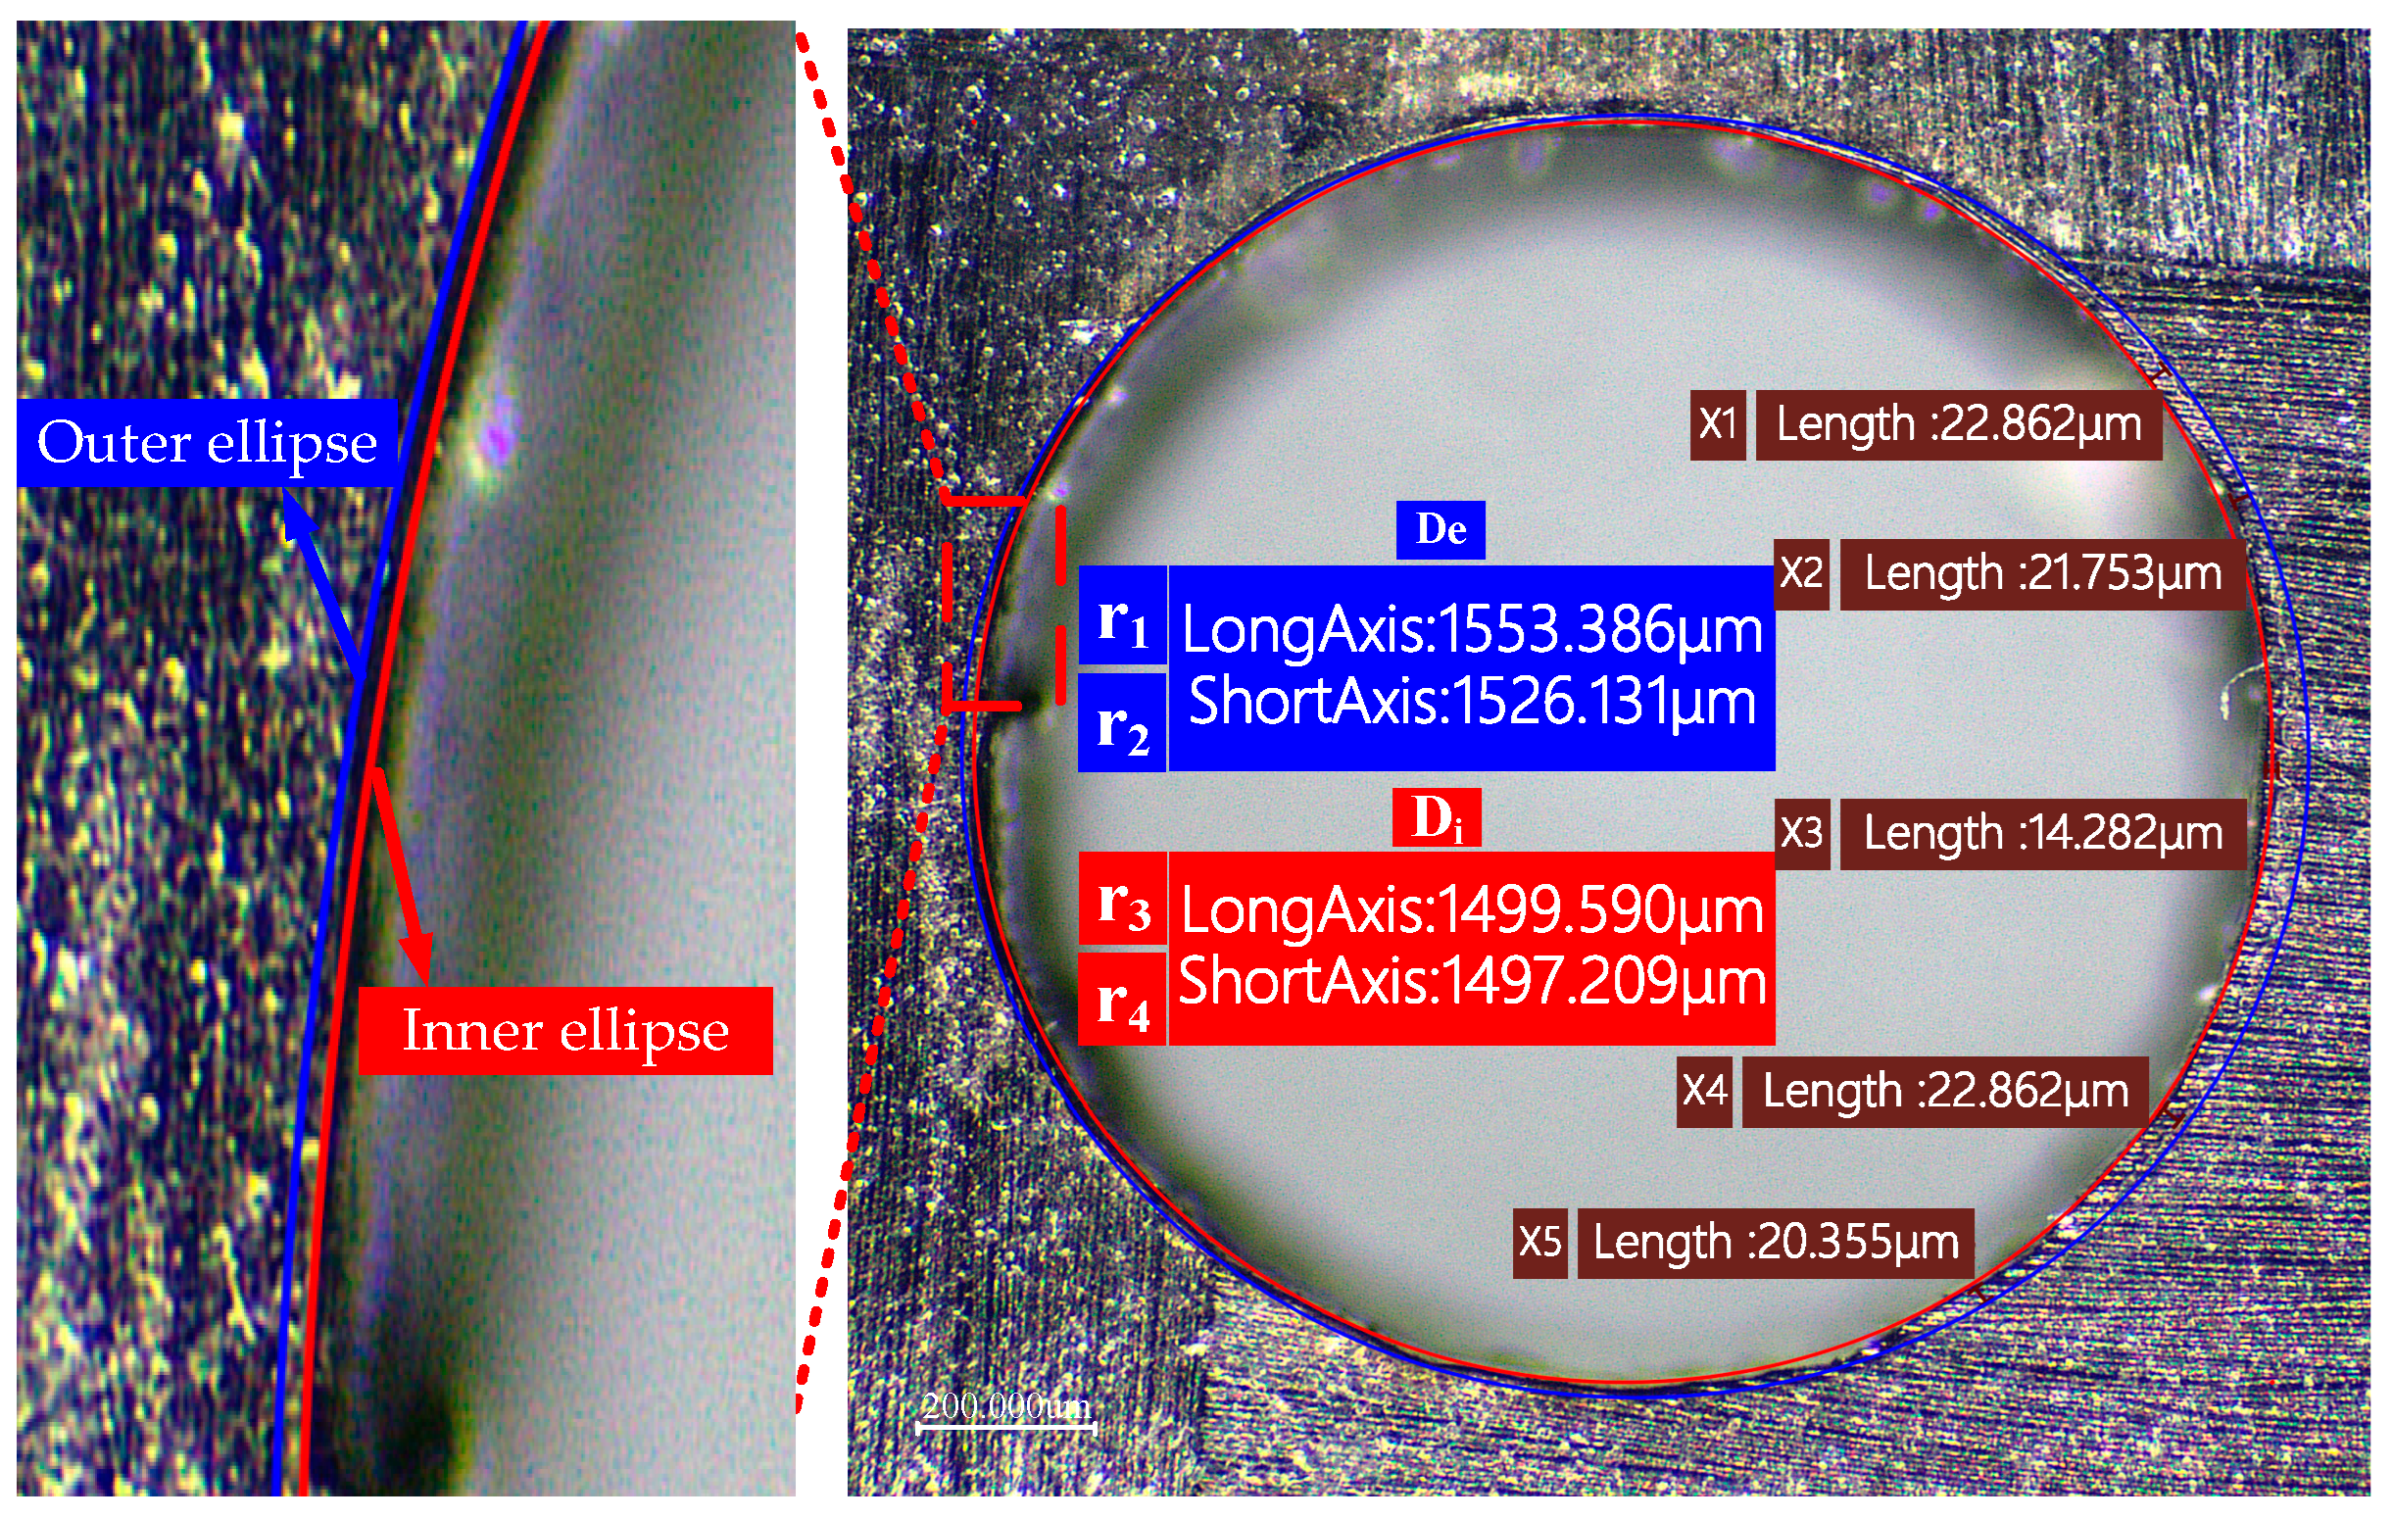
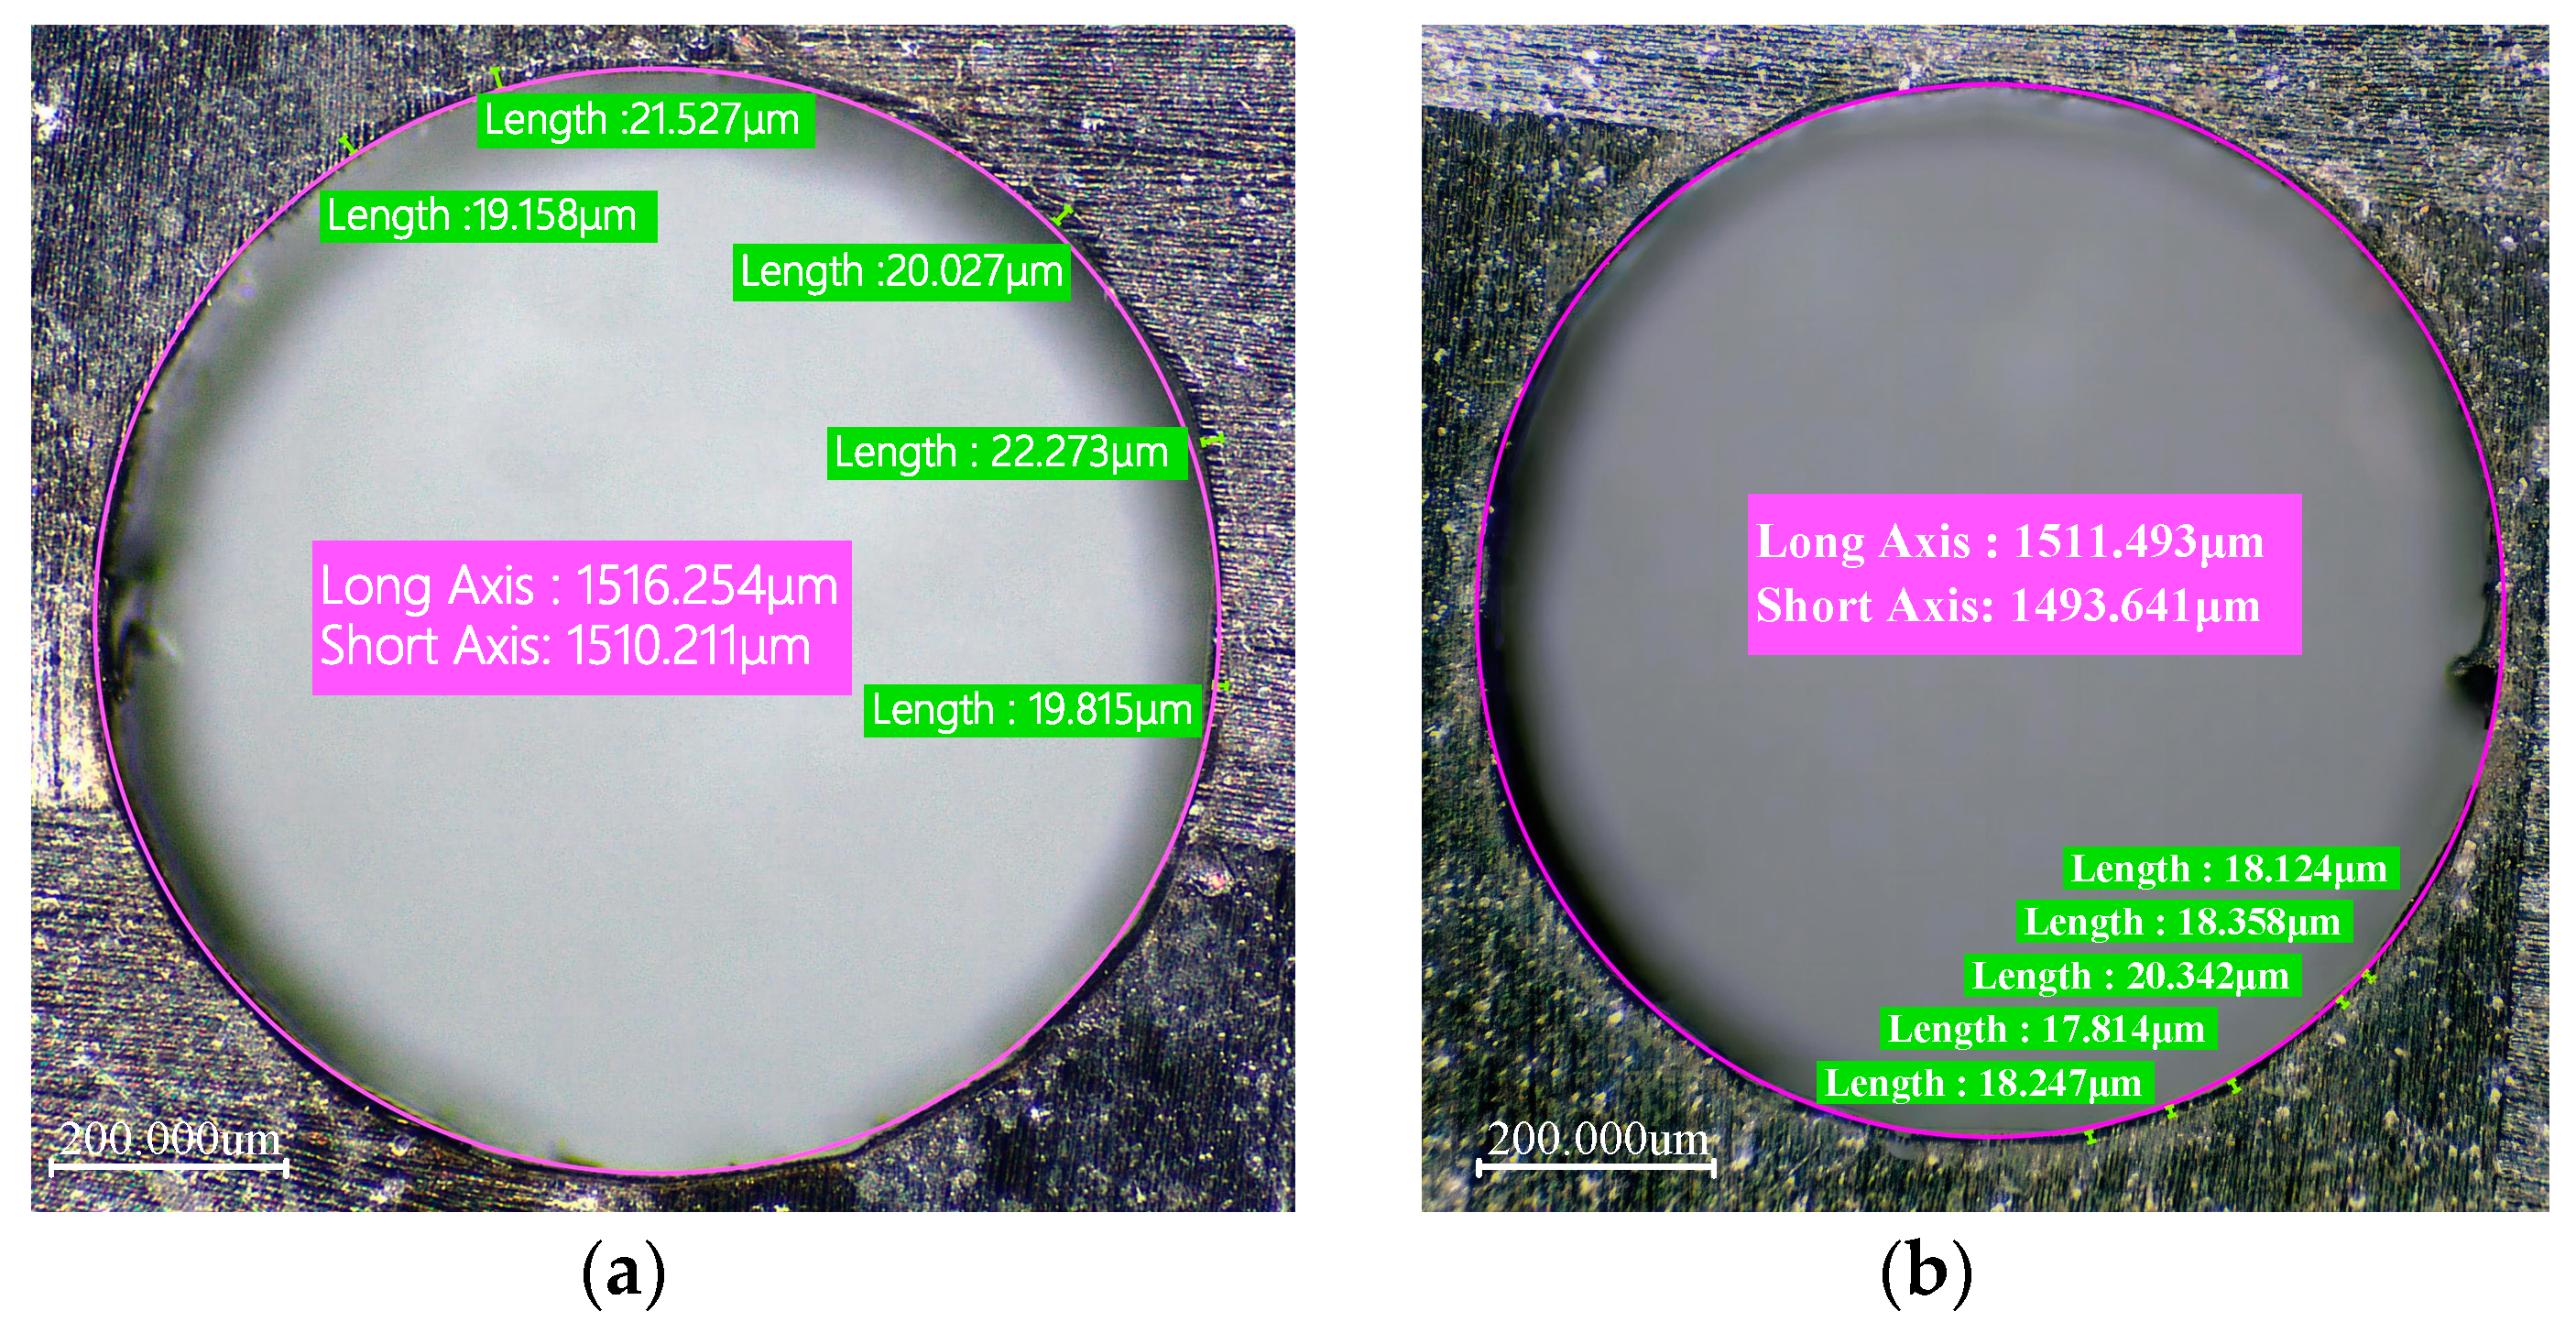
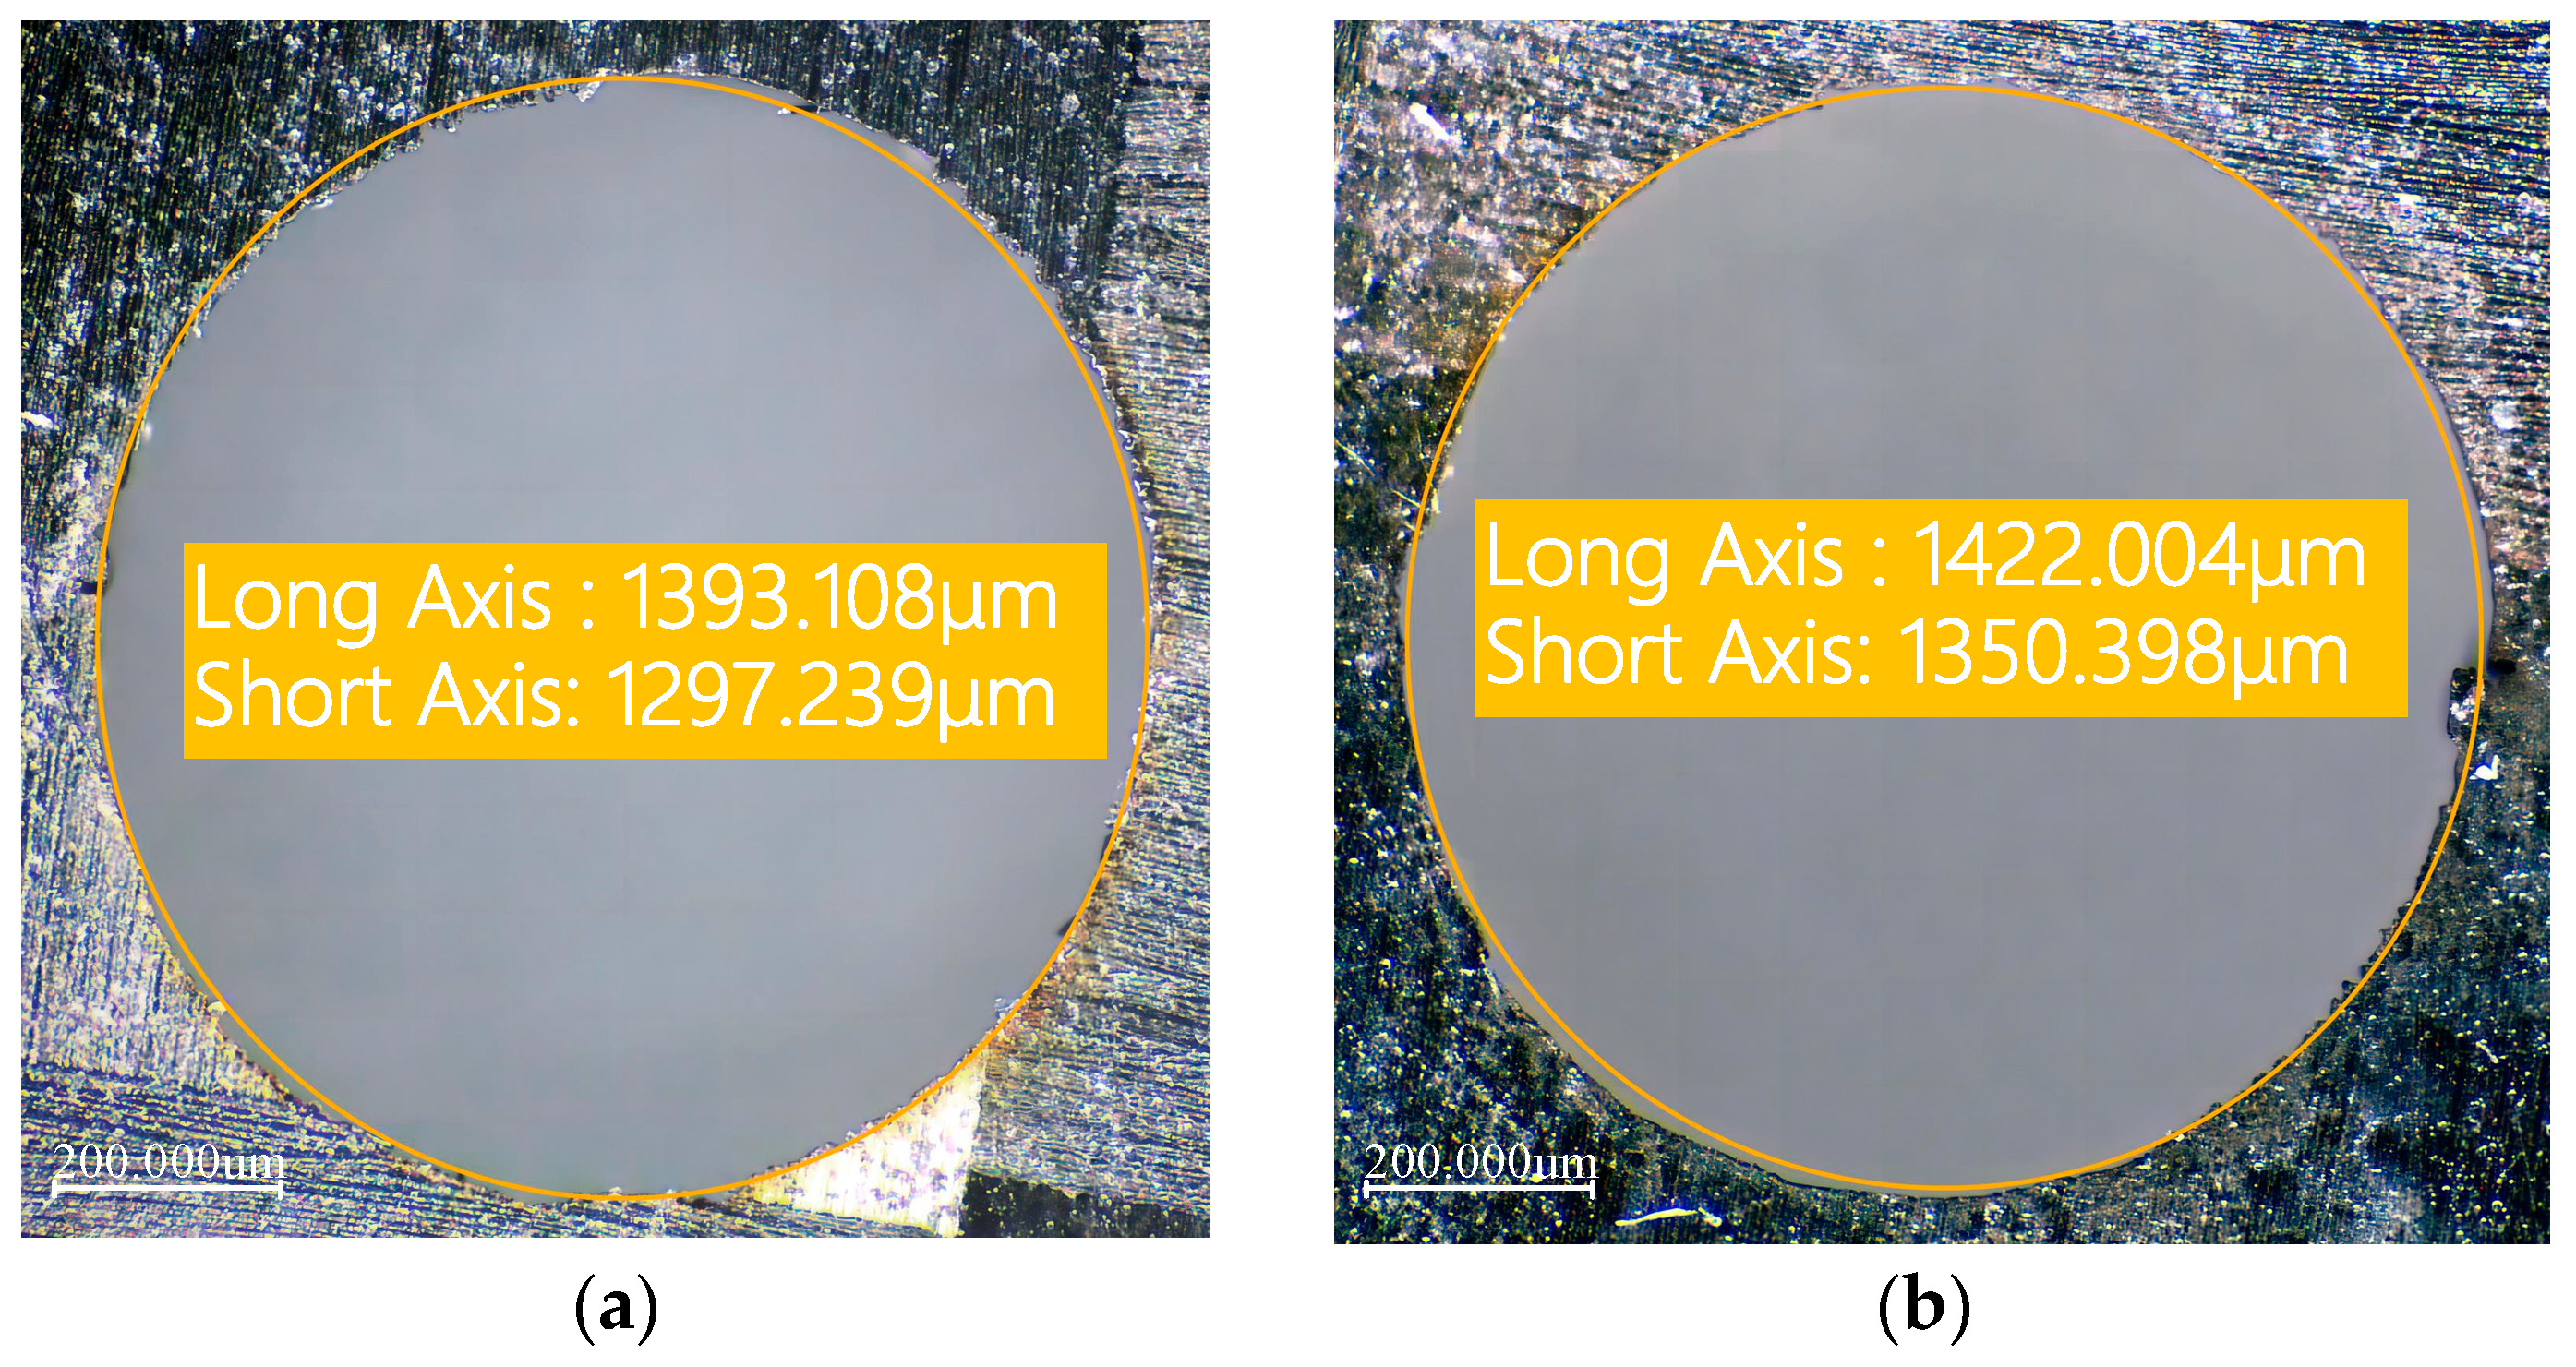
3.1. Hole Taper
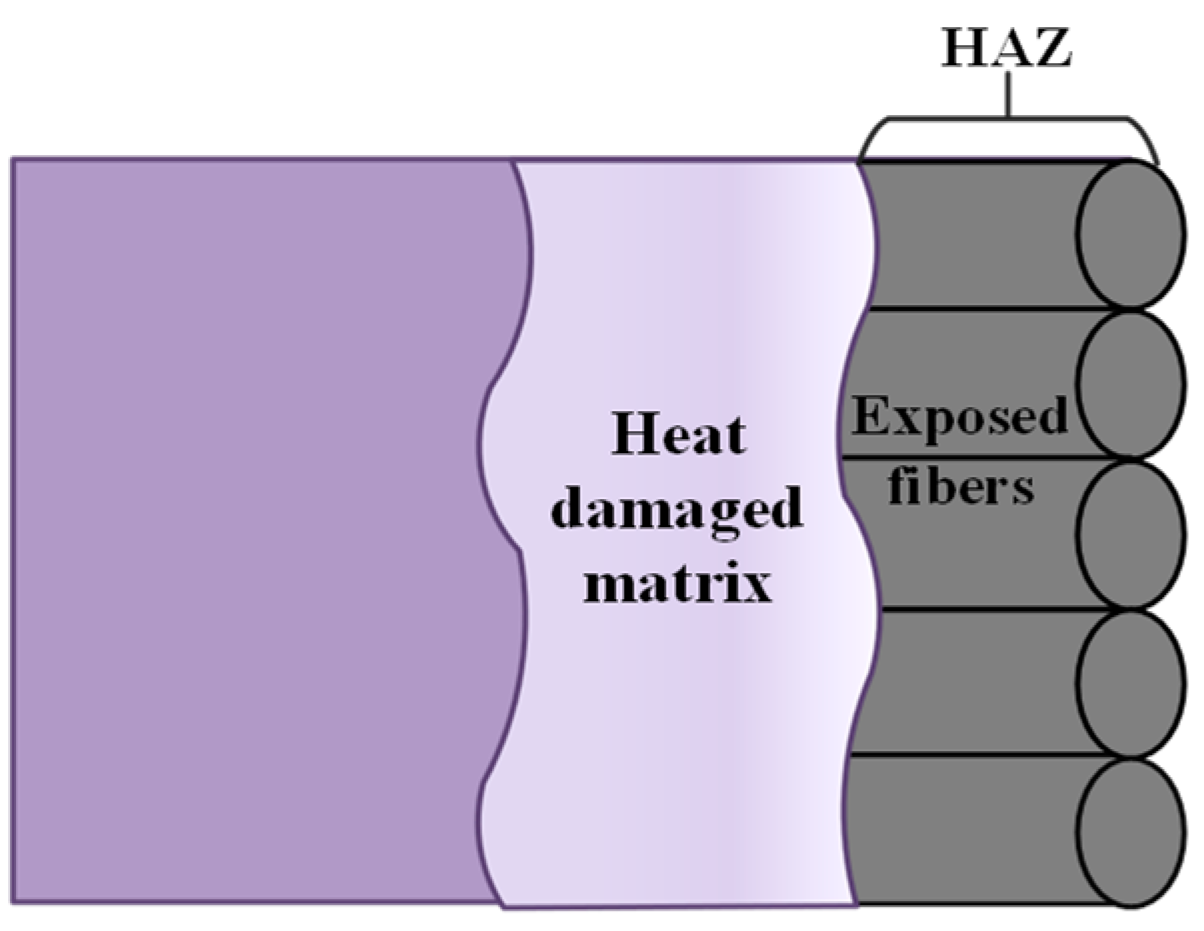
3.2. HAZ
4. Single-Factor Experimental Results and Analysis of Picosecond Laser Hole Taper
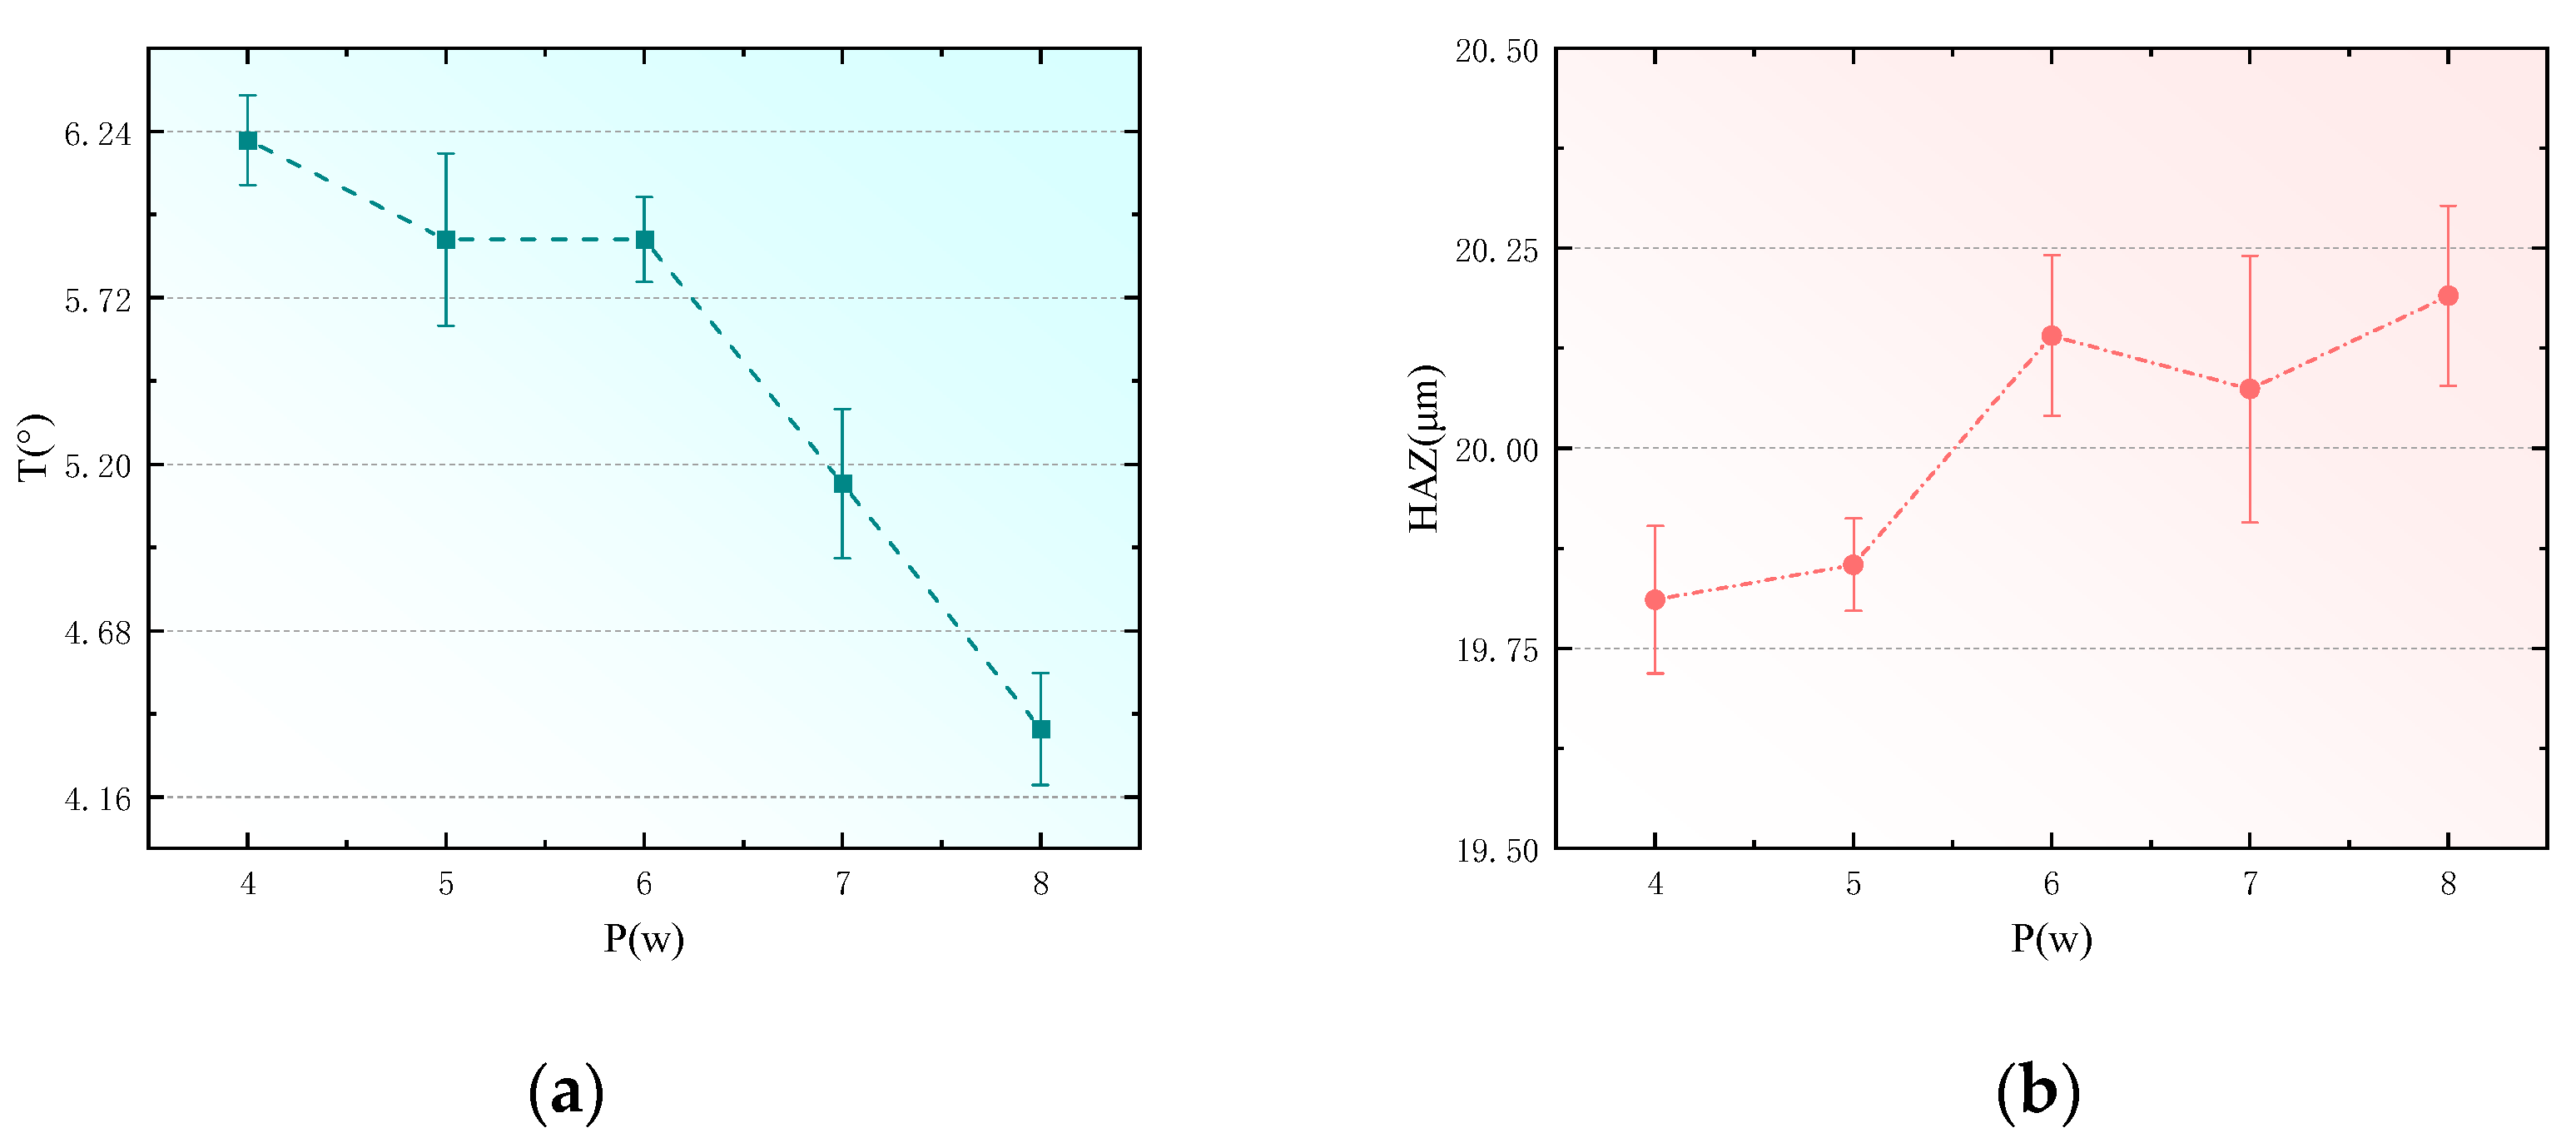
4.1. Effect of Laser Power on CFRP Hole Taper
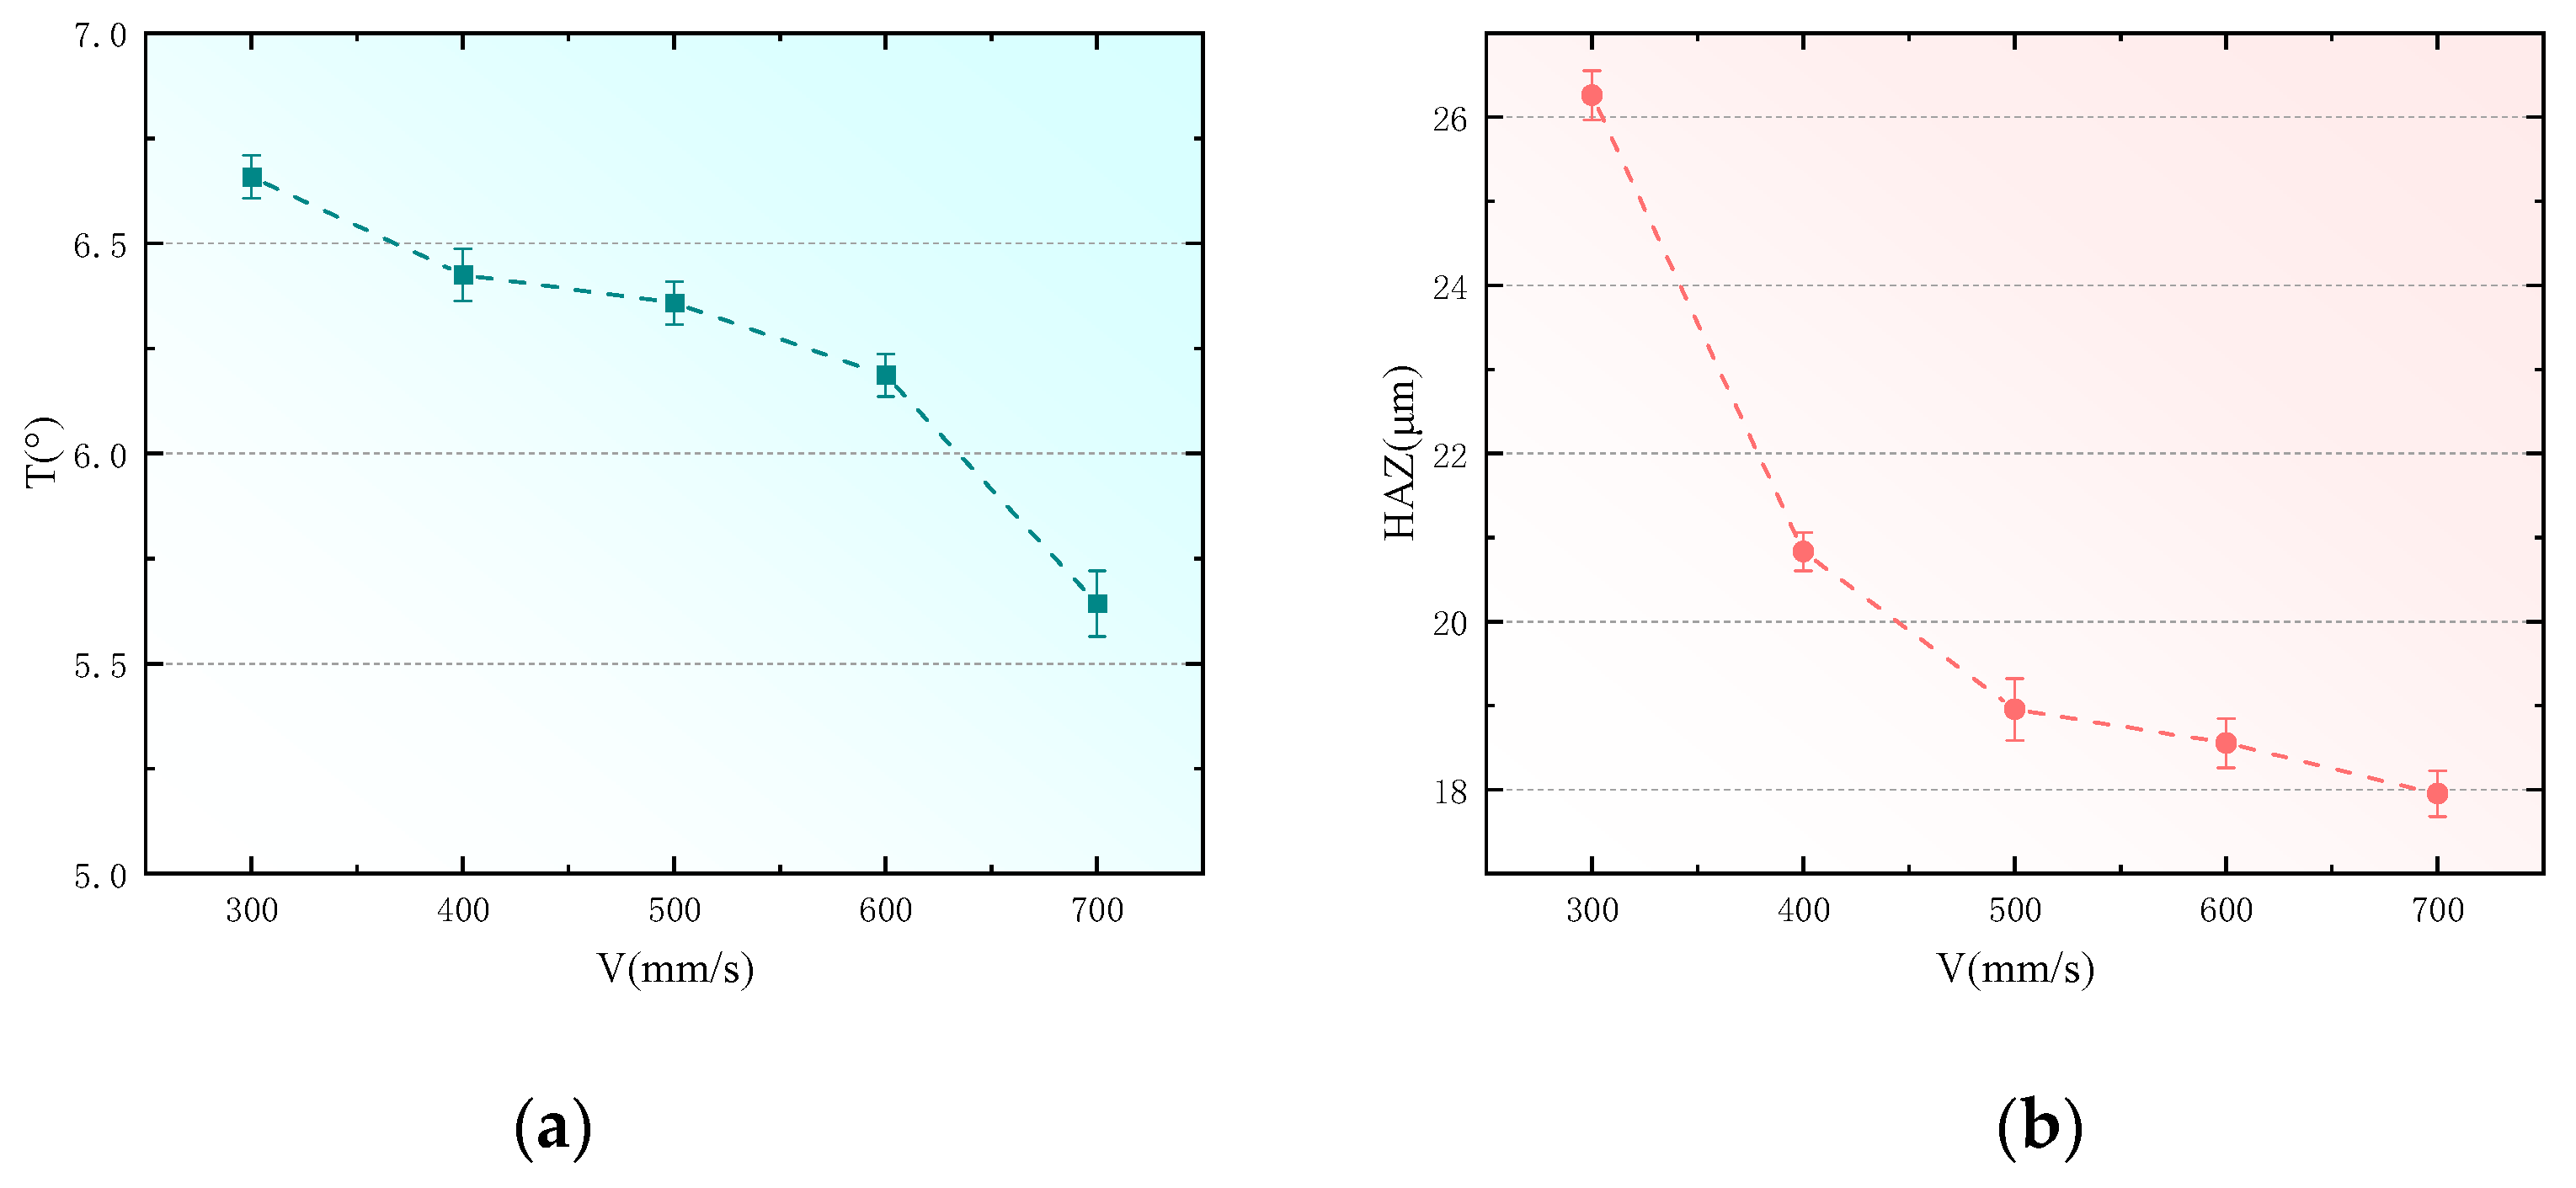
4.2. Effect of Scanning Speed on CFRP Hole Taper
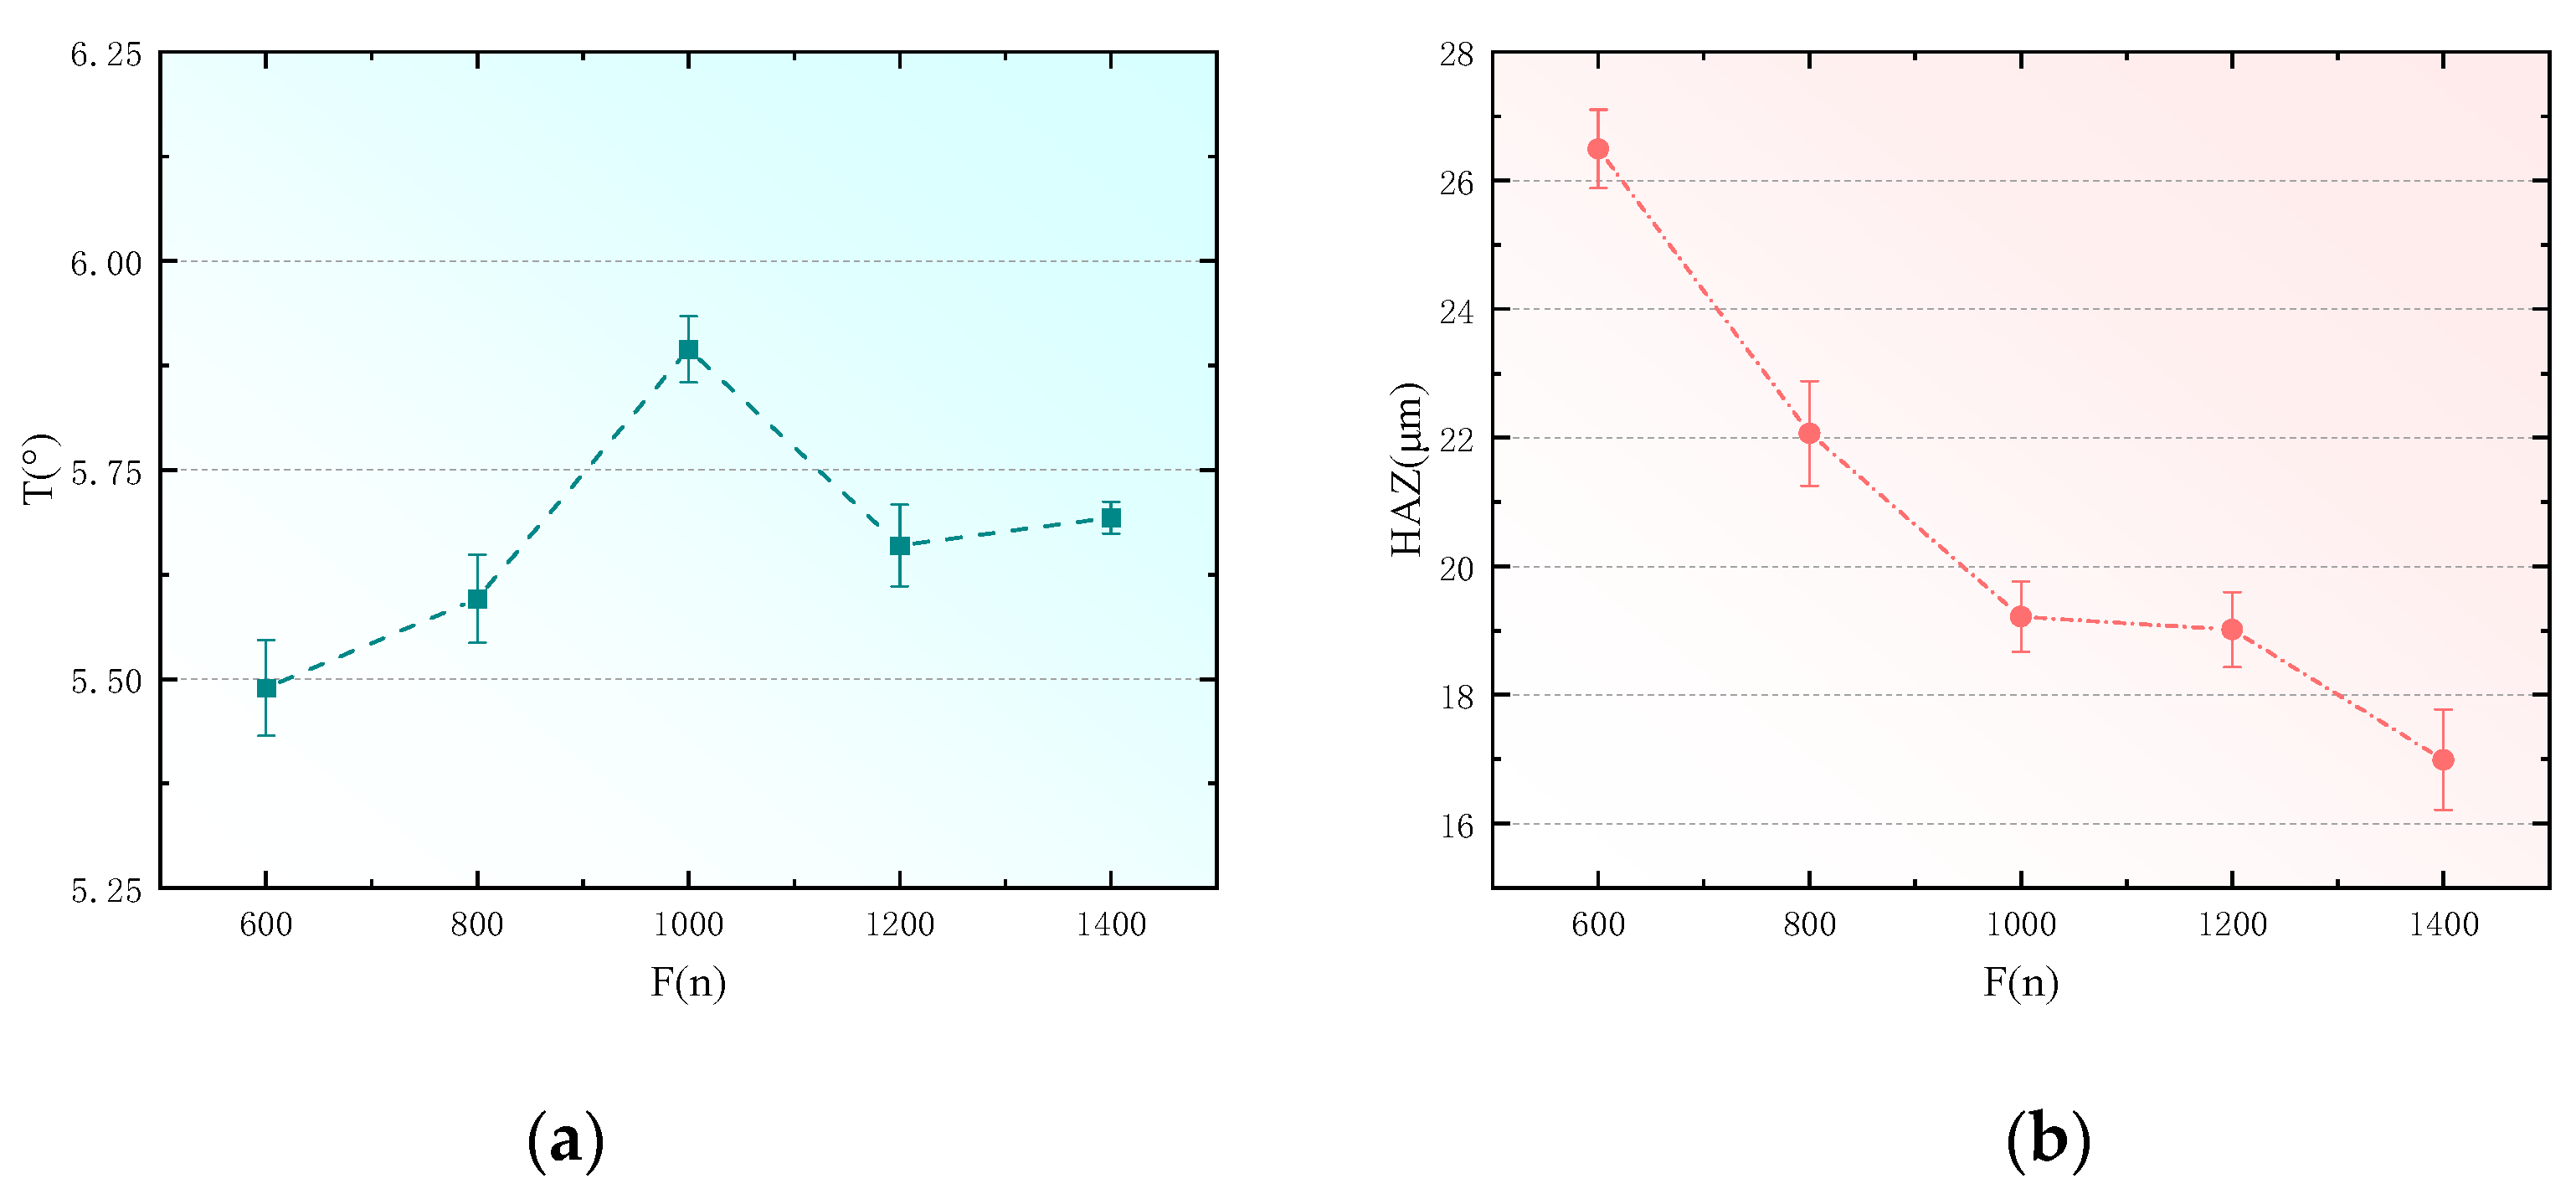
4.3. Effect of Filling Times on CFRP Hole Taper
5. Response Surface Design Verification
5.1. Response Surface Design
5.2. Optimization of Process Parameters and Experimental Validation
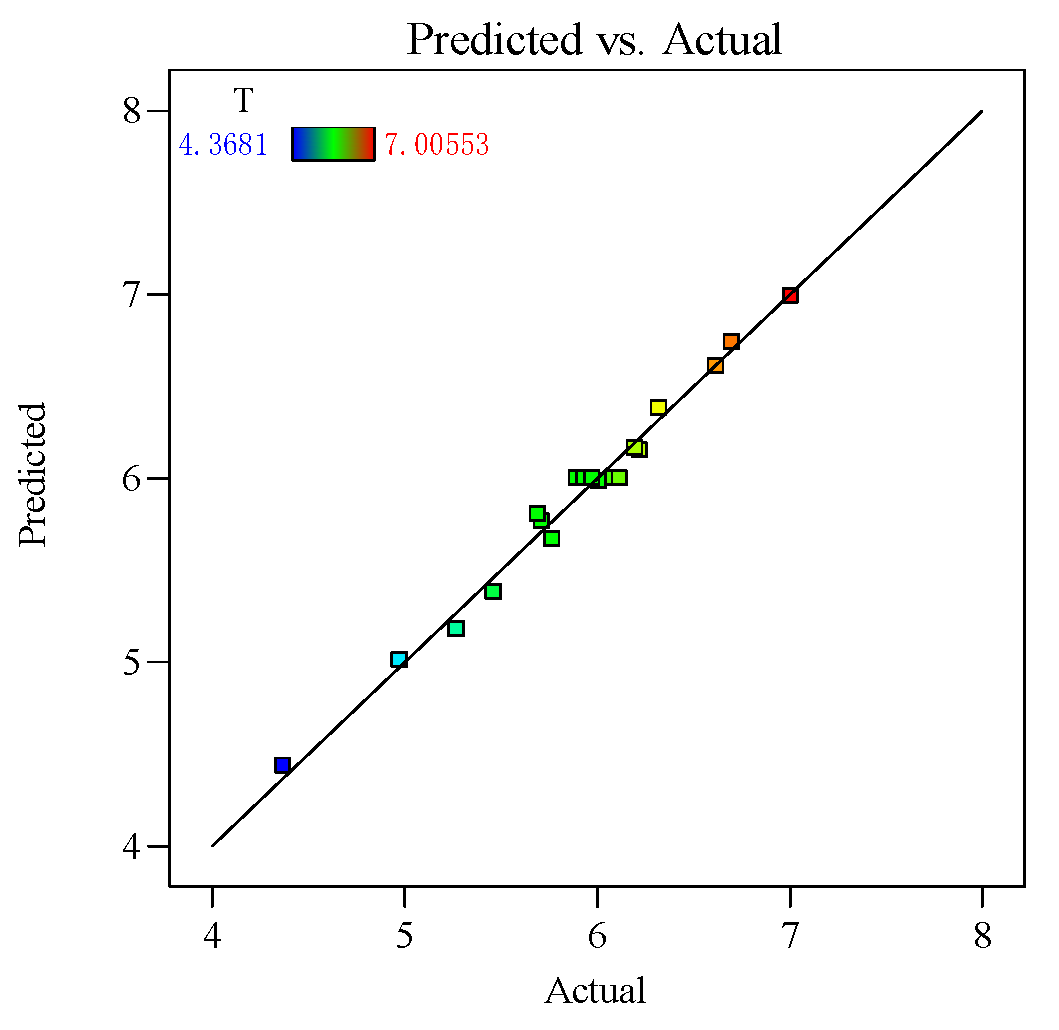
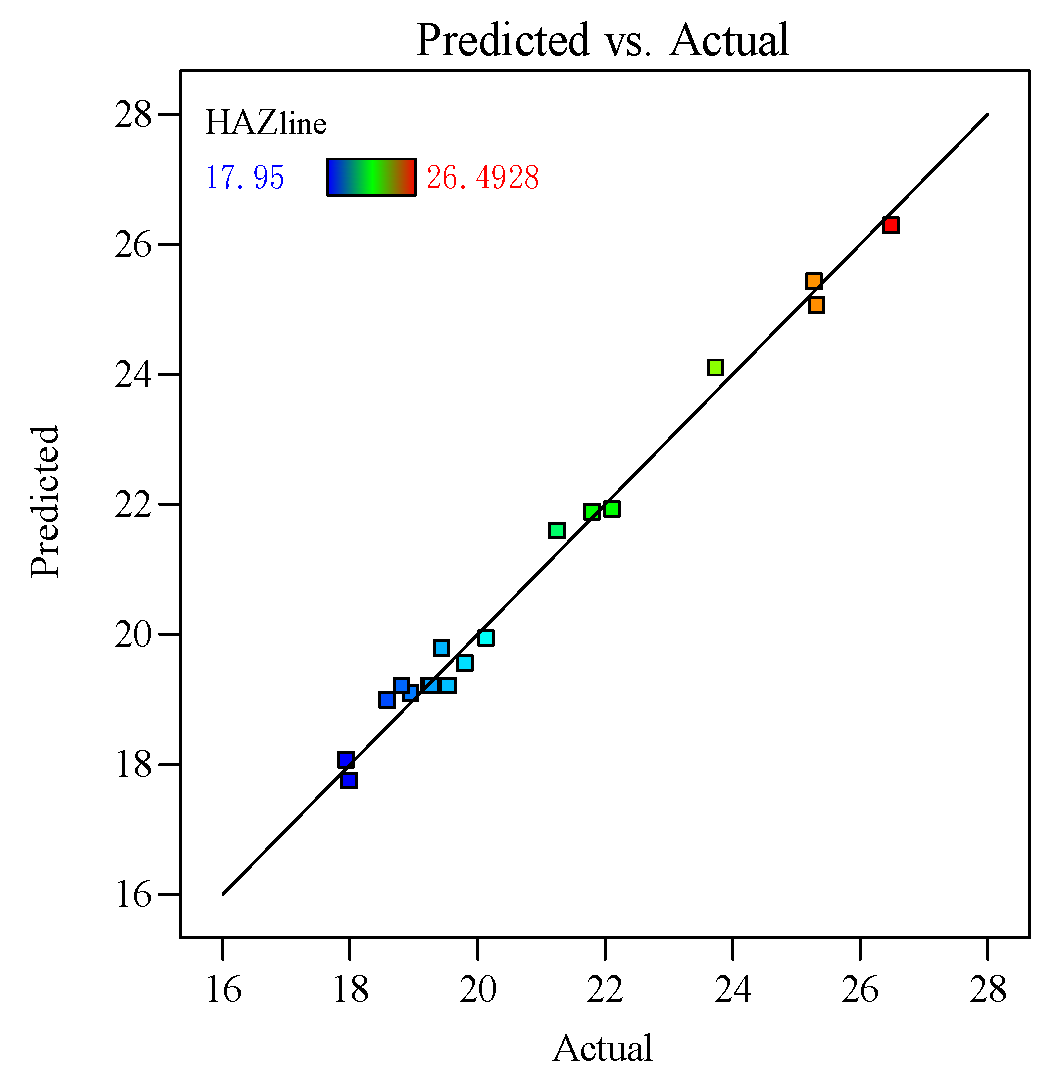
5.3. Mathematical Model and Variance Analysis
5.3.1. Mathematical Model and Variance Analysis of Hole Taper
5.3.2. Mathematical Model and Variance Analysis of the Heat-Affected Zone
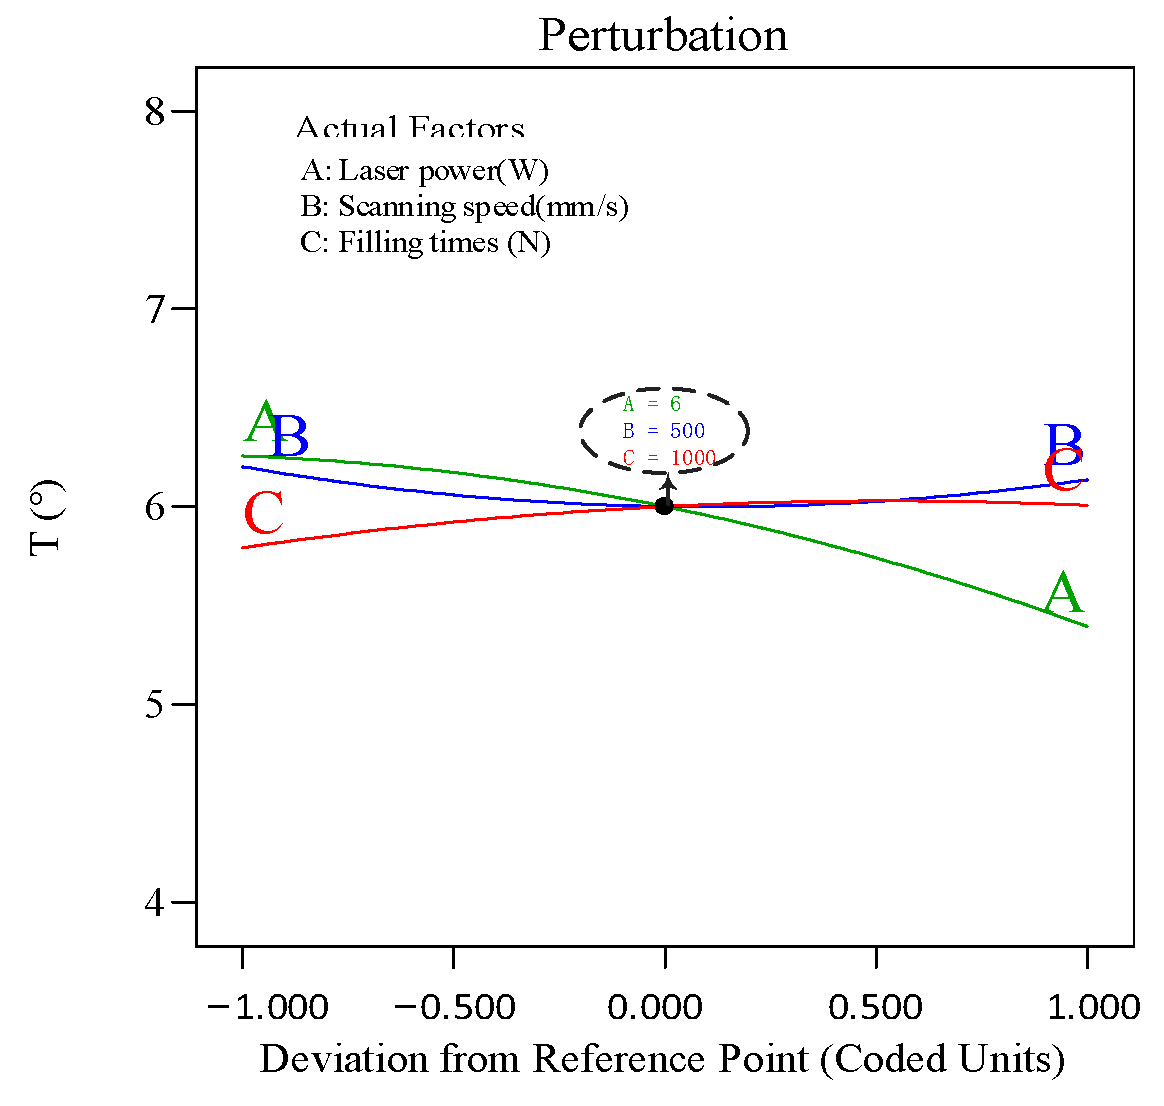
5.4. Effect of Process Parameters on Hole Quality
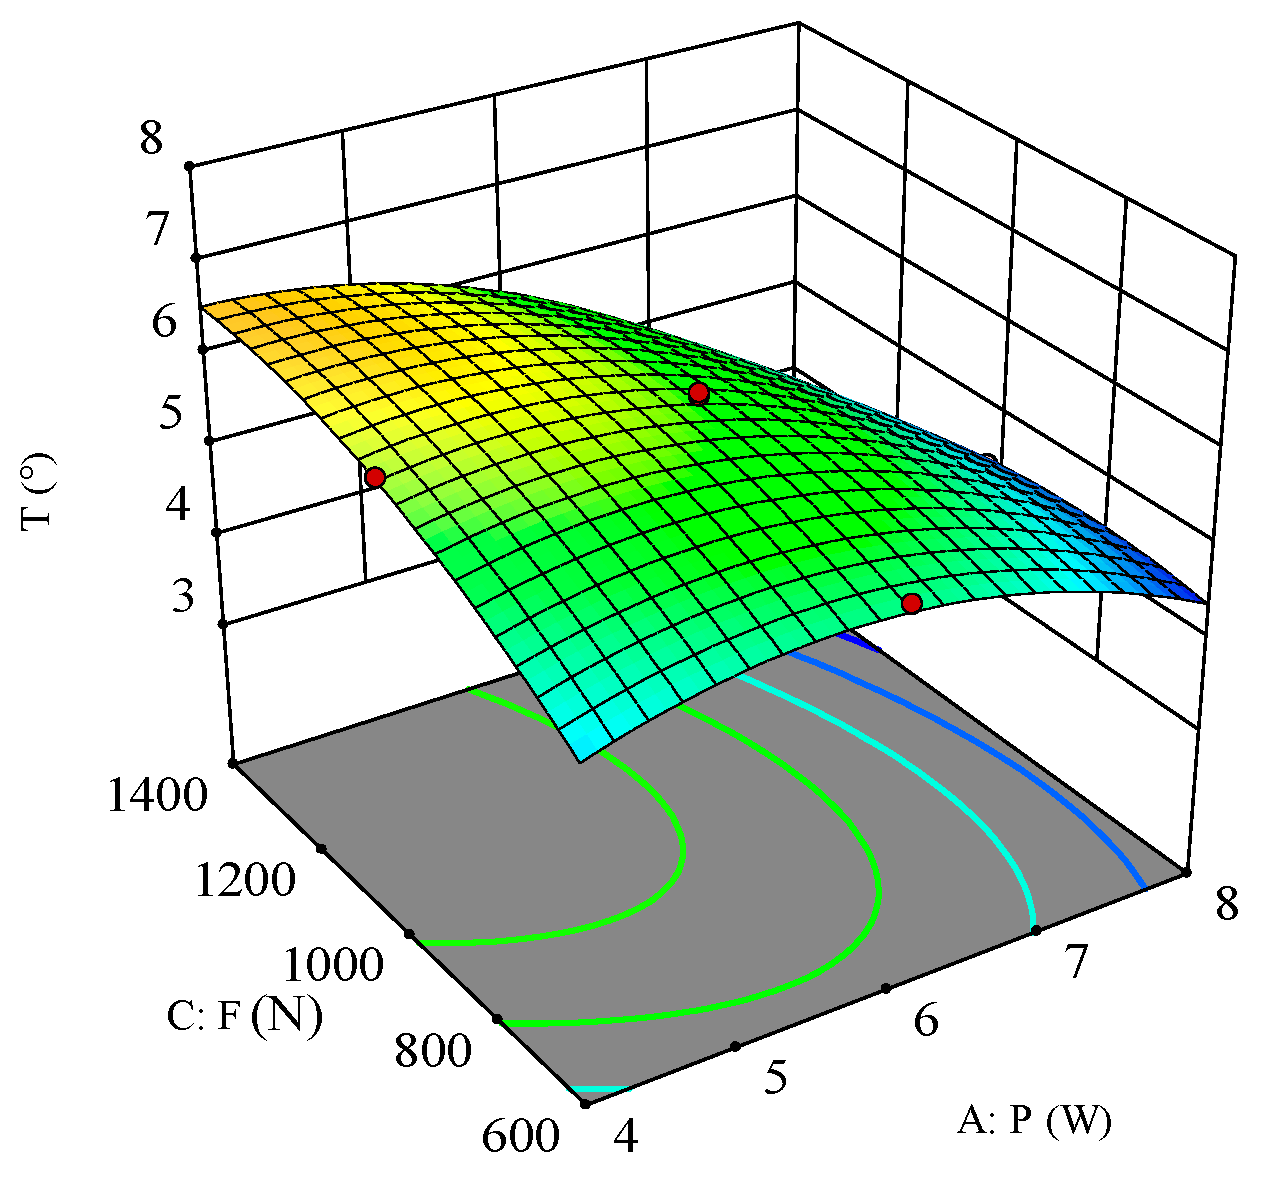
5.4.1. Effect of Process Parameters on Hole Taper
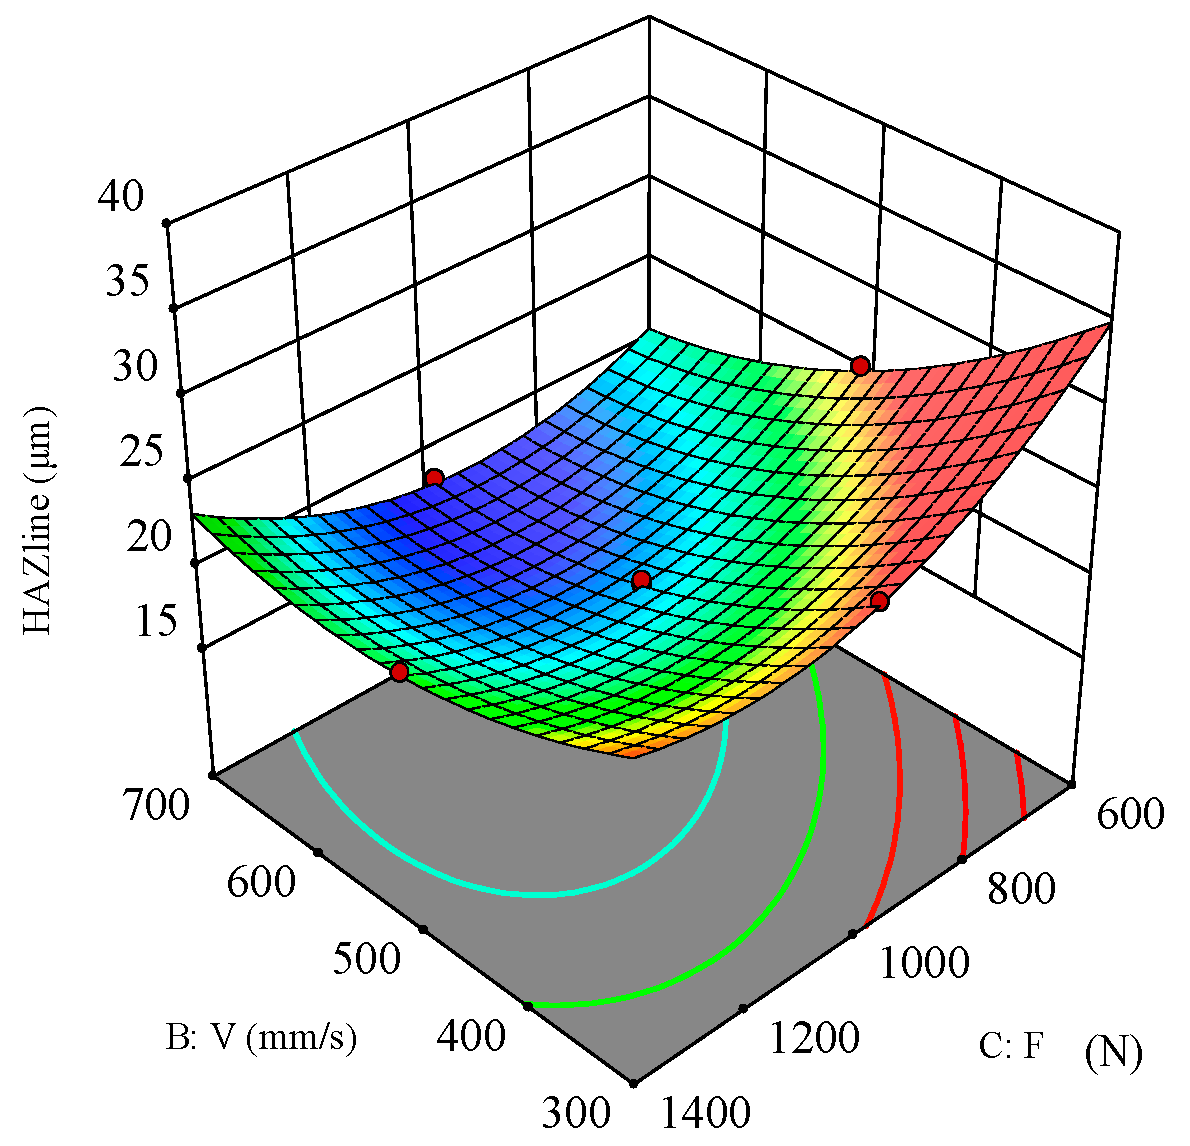
5.4.2. Effect of Process Parameters on the Heat-Affected Zone
6. Conclusions
Author Contributions
Funding
Institutional Review Board Statement
Data Availability Statement
Conflicts of Interest
References
- Vijayan, D.S.; Sivasuriyan, A.; Devarajan, P.; Stefańska, A.; Wodzyński, Ł.; Koda, E. Carbon Fibre-Reinforced Polymer (CFRP) Composites in Civil Engineering Application—A Comprehensive Review. Buildings 2023, 13, 1509. [Google Scholar] [CrossRef]
- Teti, R.; Segreto, T.; Caggiano, A.; Nele, L. Smart Multi-Sensor Monitoring in Drilling of CFRP/CFRP Composite Material Stacks for Aerospace Assembly Applications. Appl. Sci. 2020, 10, 758. [Google Scholar] [CrossRef]
- Xu, Y.; Lyu, C.; Shen, R.; Wang, Z.; Wang, Q. Comparison of thermal and fire properties of carbon/epoxy laminate composites manufactured using two forming processes. Polym. Compos. 2020, 41, 3778–3786. [Google Scholar] [CrossRef]
- Zhang, K.-H.; Yu, Y.; Zhang, X.-M.; Yang, B. Laser Cutting Induced Heat Affected Zone in Fiber Reinforced Polymer: A Comparative Analysis. Navig. Control 2019, 18, 60–66. [Google Scholar]
- Wang, F.; Bi, G.; Ning, F. Modeling of dynamic milling forces considering the interlaminar effect during milling multidirectional CFRP laminate. J. Reinf. Plast. Compos. 2021, 40, 437–449. [Google Scholar] [CrossRef]
- Gaugel, S.; Sripathy, P.; Haeger, A.; Meinhard, D.; Bernthaler, T.; Lissek, F.; Kaufeld, M.; Knoblauch, V.; Schneider, G. A comparative study on tool wear and laminate damage in drilling of carbon-fiber reinforced polymers (CFRP). Compos. Struct. 2016, 155, 173–183. [Google Scholar] [CrossRef]
- Teicher, U.; Müller, S.; Münzner, J.; Nestler, A. Micro-EDM of Carbon Fibre-Reinforced Plastics. Procedia CIRP 2013, 6, 320–325. [Google Scholar] [CrossRef]
- Wang, Y.; Zhang, Z.; Zhang, G.; Wang, B.; Zhang, W. Study on immersion waterjet assisted laser micromachining process. J. Mater. Process. Technol. 2018, 262, 290–298. [Google Scholar] [CrossRef]
- Zemann, R.; Kain, L.; Bleicher, F. Vibration Assisted Machining of Carbon Fibre Reinforced Polymers. Procedia Eng. 2014, 69, 536–543. [Google Scholar] [CrossRef]
- Li, M.; Li, S.; Yang, X.; Zhang, Y.; Liang, Z. Fiber laser cutting of CFRP laminates with single- and multi-pass strategy: A feasibility study. Opt. Laser Technol. 2018, 107, 443–453. [Google Scholar] [CrossRef]
- Yue, X.; Yang, X.; Tian, J.; He, Z.; Fan, Y. Thermal, mechanical and chemical material removal mechanism of carbon fiber reinforced polymers in electrical discharge machining. Int. J. Mach. Tools Manuf. 2018, 133, 4–17. [Google Scholar] [CrossRef]
- El-Hofy, M.; Helmy, M.O.; Escobar-Palafox, G.; Kerrigan, K.; Scaife, R.; El-Hofy, H. Abrasive Water Jet Machining of Multidirectional CFRP Laminates. Procedia CIRP 2018, 68, 535–540. [Google Scholar] [CrossRef]
- Shanmugam, D.K.; Nguyen, T.; Wang, J. A study of delamination on graphite/epoxy composites in abrasive waterjet machining. Compos. Part A Appl. Sci. Manuf. 2008, 39, 923–929. [Google Scholar] [CrossRef]
- Li, H.; Ye, Y.; Du, T.; Zhao, Y.; Ren, X.; Hua, Y. The effect of thermal damage on mechanical strengths of CFRP cut with different pulse-width lasers. Opt. Laser Technol. 2022, 153, 108219. [Google Scholar] [CrossRef]
- Weber, R.; Hafner, M.; Michalowski, A.; Graf, T. Minimum Damage in CFRP Laser Processing. Phys. Procedia 2011, 12, 302–307. [Google Scholar] [CrossRef]
- Wolynski, A.; Herrmann, T.; Mucha, P.; Haloui, H.; L’huillier, J. Laser Ablation of CFRP Using Picosecond Laser Pulses at Different Wavelengths from UV to IR. Phys. Procedia 2011, 12, 292–301. [Google Scholar] [CrossRef]
- Anzai, K.; Aoyama, M.; Fujisaki, A.; Miyato, T.; Kayahara, T.; Harada, Y.; Niino, H. Laser Trepanning of CFRP with a Scanner Head for IR and UV Lasers. In Proceedings of the Laser Applications in Microelectronic and Optoelectronic Manufacturing (LAMOM) XIX, San Francisco, CA, USA, 1–6 February 2014; p. 8967. [Google Scholar] [CrossRef]
- Li, J.Y.; Chao, J.H.; Ming, Z.; Chen, W.Q.; Wang, Y. Study on UV laser cutting carbon fibre reinforced composites. Appl. Mech. Mater. 2014, 3484, 738–742. [Google Scholar] [CrossRef]
- Bluemel, S.; Jaeschke, P.; Suttmann, O.; Overmeyer, L. Comparative Study of Achievable Quality Cutting Carbon Fibre Reinforced Thermoplastics Using Continuous Wave and Pulsed Laser Sources. Phys. Procedia 2014, 56, 1143–1152. [Google Scholar] [CrossRef]
- Li, Y.; Shen, Y.; Huang, Y.; Zhao, Q.; Lu, C. Research on UV Femtosecond Pulsed Laser Cutting Carbon Fiber Composite Materials. In Proceedings of the 24th National Laser Conference & Fifteenth National Conference on Laser Technology and Optoelectronics, Shanghai, China, 17–20 October 2020. [Google Scholar]
- Chen, M.; Guo, B.; Jiang, L.; Liu, Z.; Qian, Q. Analysis and Optimization of the Heat Affected Zone of CFRP by Femtosecond Laser Processing. Opt. Laser Technol. 2023, 167, 109756. [Google Scholar] [CrossRef]
- Freitag, C.; Wiedenmann, M.; Negel, J.P.; Loescher, A.; Onuseit, V.; Weber, R.; Ahmed, M.A.; Graf, T. High-Quality Processing of CFRP with a 1.1-kW Picosecond Laser. Appl. Phys. A 2015, 119, 1237–1243. [Google Scholar] [CrossRef]
- Salama, A.; Li, L.; Mativenga, P.; Sabli, A. High-Power Picosecond Laser Drilling/Machining of Carbon Fibre-Reinforced Polymer (CFRP) Composites. Appl. Phys. A 2016, 122, 73. [Google Scholar] [CrossRef]
- Finger, J.; Weinand, M.; Wortmann, D. Ablation and Cutting of Carbon-Fiber Reinforced Plastics Using Picosecond Pulsed Laser Radiation with High Average Power. J. Laser Appl. 2013, 25, 042007. [Google Scholar] [CrossRef]
- Leone, C.; Genna, S.; Tagliaferri, V. Fibre Laser Cutting of CFRP Thin Sheets by Multi-Passes Scan Technique. Opt. Laser Eng. 2014, 53, 43–50. [Google Scholar] [CrossRef]
- Ouyang, W.; Jiao, J.; Xu, Z.; Xia, H.; Ye, Y.; Zou, Q.; Tian, R.; Sheng, L. Experimental Study on CFRP Drilling with the Picosecond Laser “Double Rotation” Cutting Technique. Opt. Laser Technol. 2021, 142, 107238. [Google Scholar] [CrossRef]
- Wang, X.; Chen, H.; Li, Z.; Qin, Y.; Zhu, X.; Tang, X.; Wen, B. Helical Drilling of Carbon Fiber Reinforced Polymer by a Femtosecond Laser. Appl. Opt. 2021, 61, 302–307. [Google Scholar] [CrossRef] [PubMed]
- Li, W.; Huang, Y.; Chen, X.; Zhang, G.; Rong, Y.; Ya, L. Study on Laser Drilling Induced Defects of CFRP Plates with Different Scanning Modes Based on Multi-Pass Strategy. Opt. Laser Technol. 2021, 144, 107400. [Google Scholar] [CrossRef]
- Chaki, S.; Bose, D.; Bathe, R.N. Multi-Objective Optimization of Pulsed Nd: YAG Laser Cutting Process Using Entropy-Based ANN-PSO Model, Lasers Manuf. Mater. Process. 2020, 7, 88–110. [Google Scholar] [CrossRef]
- (PDF) Experimental Investigations of CO2 Laser Cut Quality: A Review, (n.d.). Available online: https://www.researchgate.net/publication/267947002_Experimental_investigations_of_CO2_laser_cut_quality_A_review (accessed on 4 June 2024).
- Meijer, J. Laser beam machining (LBM), state of the art and new opportunities. J. Mater. Process. Technol. 2004, 149, 2–17. [Google Scholar] [CrossRef]
- Mandolfino, C.; Lertora, E.; Gambaro, C.; Bruno, M. Optimization of Laser Treatment Settings for CFRP to Improve Adhesive Bonding Performance Using Response Surface Methodology (RSM). Polymers 2022, 14, 1234. [Google Scholar]
- Singh, Y.; Singh, J.; Sharma, S.; Aggarwal, V.; Pruncu, C.I. Multi-objective Optimization of Kerf-taper and Surface-roughness Quality Characteristics for Cutting-operation On Coir and Carbon Fibre Reinforced Epoxy Hybrid Polymeric Composites During CO2-Pulsed Laser-cutting Using RSM, Lasers Manuf. Mater. Process. 2021, 8, 157–182. [Google Scholar] [CrossRef]
- Joshi, P.; Sharma, A.; Kumar, Y. Modi, Optimization of process parameters during laser cutting of Ni-based superalloy thin sheet using response surface methodology. Mater. Today Proc. 2018, 5, 24231–24239. [Google Scholar] [CrossRef]
- Adalarasan, R.; Santhanakumar, M.; Rajmohan, M. Optimization of laser cutting parameters for Al6061/SiCp/Al2O3 composite using grey based response surface methodology (GRSM). Measurement 2015, 73, 596–606. [Google Scholar] [CrossRef]
- Tamilarasan, A.; Rajamani, D. Multi-response optimization of Nd: YAG laser cutting parameters of Ti-6Al-4V superalloy sheet. J. Mech. Sci. Technol. 2017, 31, 813–821. [Google Scholar] [CrossRef]
- Patel, A.; Bhavsar, S.N. Experimental investigation to optimize laser cutting process parameters for difficult to cut die alloy steel using response surface methodology. Mater. Today Proc. 2021, 43, 28–35. [Google Scholar] [CrossRef]
- Li, W.; Zhang, G.; Huang, Y.; Rong, Y. Drilling of CFRP plates with adjustable pulse duration fiber laser. Mater. Manuf. Process. 2021, 36, 1256–1263. [Google Scholar] [CrossRef]
- (PDF) Study on the Mechanism of Quasi-Continuous Wave (QCW) Fiber Laser Low-Damage Processing of Carbon Fiber-Reinforced Plastics, (n.d.). Available online: https://www.researchgate.net/publication/365698798_Study_on_the_mechanism_of_quasi-continuous_wave_QCW_fiber_laser_low-damage_processing_of_carbon_fiber-reinforced_plastics (accessed on 4 June 2024).
- Lopes, J.; Reis, L.; Stefaniak, D.; Freitas, M.; Camanho, P. Mechanical characterisation of CFRP-steel hybrid composites. Int. J. Automot. Compos. 2016, 2, 139–154. [Google Scholar] [CrossRef]
- Al-Mosawe, A.; Al-Mahaidi, R. Performance of CFRP-steel joints enhanced with bi-directional CFRP fabric. Constr. Build. Mater. 2019, 197, 72–82. [Google Scholar] [CrossRef]
- Huang, S.; Chen, R.; Zhang, H.; Ye, J.; Yang, X.; Sheng, J. A study of welding process in connecting borosilicate glass by picosecond laser pulses based on response surface methodology. Opt. Laser Technol. 2020, 131, 106427. [Google Scholar] [CrossRef]
- Acherjee, B.; Misra, D.; Bose, D.; Venkadeshwaran, K. Prediction of weld strength and seam width for laser transmission welding of thermoplastic using response surface methodology. Opt. Laser Technol. 2009, 41, 956–967. [Google Scholar] [CrossRef]
- Chen, Y.; Lu, W.; Yang, Y. Optimization of Laser Paint Removal Process for Carbon Fiber Composite Substrate Based on Response Surface Analysis. Zgjg 2023, 50, 1202208. [Google Scholar] [CrossRef]


| Material Parameters | Carbon Fiber | Epoxy Resin |
|---|---|---|
| Volume Fraction | 0.6 | 0.4 |
| Density ρ (kg/m3) | 1850 | 1200 |
| Specific Heat Capacity C (J/(kg-K)) | 710 | 1884 |
| Thermal Conductivity k (W/(m-K)) | 50 (axial), 5 (radial) | 0.1 |
| Latent Heat of Phase Change L (kJ/kg) | 43,000 | 1000 |
| Vaporization Temperature (K) | 3900 | 698 |
| Characteristics | Symbols | Values | Units |
|---|---|---|---|
| Wavelength | λ | 355 | nm |
| Average laser power | Pavg | ≥30 | w |
| Pulse energy | E | ≥30 | μJ |
| Pulse width | τ | ≤7 | ps |
| Laser power | p | 4, 5, 6, 7, 8 | W |
| Filling degree | T | 600, 800, 1000, 1200, 1400 | N |
| Scanning speed | V | 300, 400, 500, 600, 700 | mm/s |
| Experiment Factor | Level | ||||
|---|---|---|---|---|---|
| −2 | −1 | 0 | 1 | 2 | |
| A: Laser power P (W) | 4 | 5 | 6 | 7 | 8 |
| B: Scanning speed V (mm/s) | 300 | 400 | 500 | 600 | 700 |
| C: Filling times F (N) | 600 | 800 | 1000 | 1200 | 1400 |
| Run | Factors | Responses | |||||||||
|---|---|---|---|---|---|---|---|---|---|---|---|
| Laser Power P/W | Scanning Speed V/(mm/s) | Filling Times F/(N) | Plan 1 | Plan 2 | Plan 3 | Plan 4 | |||||
| Circle (°) | HAZline (μm) | Circle (°) | HAZellipse (μm) | Tellipse(°) | HAZline (μm) | Tellipse (°) | HAZellipse (μm) | ||||
| 1 | 5 | 400 | 800 | 6.25751 | 25.2857 | 6.25751 | 35.5226 | 6.32119 | 25.2857 | 6.32119 | 35.5226 |
| 2 | 7 | 400 | 800 | 5.82421 | 23.741 | 5.82421 | 44.5422 | 6.00795 | 23.741 | 6.00795 | 44.5422 |
| 3 | 5 | 600 | 800 | 6.59224 | 18.5945 | 6.59224 | 22.22 | 5.71171 | 18.5945 | 5.71171 | 22.22 |
| 4 | 7 | 600 | 800 | 4.98998 | 18.9592 | 4.98998 | 28.7538 | 4.97568 | 18.9592 | 4.97568 | 28.7538 |
| 5 | 5 | 400 | 1200 | 6.11358 | 21.253 | 6.11358 | 40.8374 | 6.22256 | 21.253 | 6.22256 | 40.8374 |
| 6 | 7 | 400 | 1200 | 5.85383 | 21.8072 | 5.85383 | 38.9754 | 5.26934 | 21.8072 | 5.26934 | 38.9754 |
| 7 | 5 | 600 | 1200 | 7.00828 | 17.95 | 7.00828 | 37.2126 | 7.00553 | 17.95 | 7.00553 | 37.2126 |
| 8 | 7 | 600 | 1200 | 5.63907 | 19.447 | 5.63907 | 25.3778 | 5.7666 | 19.447 | 5.7666 | 25.3778 |
| 9 | 4 | 500 | 1000 | 6.2891 | 19.8093 | 6.2891 | 34.911 | 6.1975 | 19.8093 | 6.1975 | 34.911 |
| 10 | 8 | 500 | 1000 | 4.83957 | 20.1445 | 4.83957 | 36.3348 | 4.3681 | 20.1445 | 4.3681 | 36.3348 |
| 11 | 6 | 300 | 1000 | 6.79193 | 26.4928 | 6.79193 | 54.773 | 6.69944 | 26.4928 | 6.69944 | 54.773 |
| 12 | 6 | 700 | 1000 | 6.65339 | 17.9952 | 6.65339 | 32.382 | 5.61787 | 17.9952 | 6.61787 | 32.382 |
| 13 | 6 | 500 | 600 | 5.59202 | 25.3275 | 5.59202 | 26.6108 | 5.46267 | 25.3275 | 5.56267 | 26.6108 |
| 14 | 6 | 500 | 1400 | 5.66963 | 22.1163 | 5.66963 | 31.5374 | 5.69169 | 22.1163 | 5.69169 | 31.5374 |
| 15 | 6 | 500 | 1000 | 5.93751 | 19.337 | 5.93751 | 25.662 | 5.96703 | 19.337 | 5.96703 | 25.662 |
| 16 | 6 | 500 | 1000 | 5.71958 | 18.8185 | 5.71958 | 27 | 5.89491 | 18.8185 | 5.89491 | 27 |
| 17 | 6 | 500 | 1000 | 6.09909 | 19.47 | 6.09909 | 27.4224 | 6.08368 | 19.47 | 6.08368 | 27.4224 |
| 18 | 6 | 500 | 1000 | 5.99373 | 19.2524 | 5.99373 | 28.5636 | 5.9322 | 19.2524 | 5.7222 | 28.5636 |
| 19 | 6 | 500 | 1000 | 6.045 | 19.28 | 6.045 | 27.1296 | 6.118 | 19.28 | 5.918 | 27.1296 |
| 20 | 6 | 500 | 1000 | 5.875 | 19.547 | 5.875 | 27.7098 | 5.975 | 19.547 | 5.975 | 27.7098 |
| Technical Parameter | Criteria | Weight | |||
|---|---|---|---|---|---|
| Goal | Lower Limit | Upper Limit | |||
| A: Laser power P(W) | In range | 4 | 8 | 1 | |
| B: Scanning speed V(mm/s) | In range | 300 | 700 | 1 | |
| C: Filling times F(N) | In range | 600 | 1400 | 1 | |
| Plan 1 | Tcircle(°) | Minimize | 4.83957 | 7.00828 | 1 |
| HAZline(μm) | Minimize | 17.95 | 26.4928 | 1 | |
| Plan 2 | Tcircle(°) | Minimize | 4.83957 | 7.00828 | 1 |
| HAZellipse(μm) | Minimize | 22.22 | 54.773 | 1 | |
| Plan 3 | Tellipse(°) | Minimize | 4.3681 | 7.00553 | 1 |
| HAZline(μm) | Minimize | 17.950 | 26.4928 | 1 | |
| Plan 4 | Tellipse(°) | Minimize | 4.3681 | 7.00553 | 1 |
| HAZellipse(μm) | Minimize | 22.22 | 54.773 | 1 | |
| Run | Parameter Combination | Predicted Value | Experimental Value | Error Rate | |||||
|---|---|---|---|---|---|---|---|---|---|
| Laser Power P/W | Scanning Speed V/(mm/s) | Filling Times F/(N) | Tmin (°) | HAZmin (μm) | Tmin (°) | HAZmin (μm) | Tmin (°) | HAZmin (μm) | |
| 1 | 7.401 | 638.686 | 898.791 | 4.840 | 18.563 | 4.369 | 17.960 | 10.8% | 3.4% |
| 2 | 7.908 | 569.414 | 1399.999 | 4.815 | 24.245 | 4.436 | 37.774 | 8.6% | 35.8% |
| 3 | 7.886 | 633.514 | 880.617 | 4.368 | 18.982 | 4.160 | 18.577 | 5.0% | 2.2% |
| 4 | 4.000 | 668.937 | 600.000 | 4.463 | 22.216 | 11.961 | 21.445 | 62.68% | 3.6% |
| Source | Sum of Squares | df | Mean Square | F-Value | p-Value | |
|---|---|---|---|---|---|---|
| Model | 6.64 | 9 | 0.7373 | 75.90 | <0.0001 | significant |
| A-P | 2.98 | 1 | 2.98 | 306.31 | <0.0001 | |
| B-V | 0.0172 | 1 | 0.0172 | 1.77 | 0.2128 | |
| C-F | 0.1818 | 1 | 0.1818 | 18.71 | 0.0015 | |
| AB | 0.0627 | 1 | 0.0627 | 6.46 | 0.0293 | |
| AC | 0.1633 | 1 | 0.1633 | 16.81 | 0.0021 | |
| BC | 1.07 | 1 | 1.07 | 109.85 | <0.0001 | |
| A2 | 0.7718 | 1 | 0.7718 | 79.45 | <0.0001 | |
| B2 | 0.7160 | 1 | 0.7160 | 73.70 | <0.0001 | |
| C2 | 0.2596 | 1 | 0.2596 | 26.72 | 0.0004 | |
| Residual | 0.0972 | 10 | 0.0097 | |||
| Lack of Fit | 0.0590 | 5 | 0.0118 | 1.55 | 0.3218 | not significant |
| Pure Error | 0.0381 | 5 | 0.0076 | |||
| Cor Total | 6.73 | 19 | ||||
| R2 = 0.9856 | Adjusted R2 = 0.9726 | |||||
| Predicted R2 = 0.9193 | Adeq Precision = 36.6883 | |||||
| Source | Sum of Squares | df | Mean Square | F-Value | p-Value | |
|---|---|---|---|---|---|---|
| Model | 124.88 | 9 | 13.88 | 111.35 | <0.0001 | significant |
| A-P | 0.1485 | 1 | 0.1485 | 1.19 | 0.3006 | |
| B-V | 72.81 | 1 | 72.81 | 584.26 | <0.0001 | |
| C-F | 9.84 | 1 | 9.84 | 78.94 | <0.0001 | |
| AB | 1.02 | 1 | 1.02 | 8.16 | 0.0171 | |
| AC | 1.31 | 1 | 1.31 | 10.47 | 0.0089 | |
| BC | 4.22 | 1 | 4.22 | 33.86 | 0.0002 | |
| A2 | 0.4539 | 1 | 0.4539 | 3.64 | 0.0854 | |
| B2 | 12.36 | 1 | 12.36 | 99.18 | <0.0001 | |
| C2 | 28.82 | 1 | 28.82 | 231.26 | <0.0001 | |
| Residual | 1.25 | 10 | 0.1246 | |||
| Lack of Fit | 0.9219 | 5 | 0.1844 | 2.84 | 0.1381 | not significant |
| Pure Error | 0.3243 | 5 | 0.0649 | |||
| Cor Total | 126.13 | 19 | ||||
| R2 = 0.9901 | Adjusted R2 = 0.9812 | |||||
| Predicted R2 = 0.9397 | Adeq Precision = 34.1836 | |||||
Disclaimer/Publisher’s Note: The statements, opinions and data contained in all publications are solely those of the individual author(s) and contributor(s) and not of MDPI and/or the editor(s). MDPI and/or the editor(s) disclaim responsibility for any injury to people or property resulting from any ideas, methods, instructions or products referred to in the content. |
© 2024 by the authors. Licensee MDPI, Basel, Switzerland. This article is an open access article distributed under the terms and conditions of the Creative Commons Attribution (CC BY) license (https://creativecommons.org/licenses/by/4.0/).
Share and Cite
Zheng, Z.; Ma, Y.; Wang, Z.; Liu, S.; Wu, C. Dual-Method Characterization and Optimization of Drilling Parameters for Picosecond Laser Drilling Quality in CFRP. Polymers 2024, 16, 2603. https://doi.org/10.3390/polym16182603
Zheng Z, Ma Y, Wang Z, Liu S, Wu C. Dual-Method Characterization and Optimization of Drilling Parameters for Picosecond Laser Drilling Quality in CFRP. Polymers. 2024; 16(18):2603. https://doi.org/10.3390/polym16182603
Chicago/Turabian StyleZheng, Zhao, Yao Ma, Zhonghe Wang, Siqi Liu, and Chunting Wu. 2024. "Dual-Method Characterization and Optimization of Drilling Parameters for Picosecond Laser Drilling Quality in CFRP" Polymers 16, no. 18: 2603. https://doi.org/10.3390/polym16182603