Article

Urchin-like WO3 Particles Form Honeycomb-like Structured PLA/WO3 Nanocomposites with Enhanced Crystallinity, Thermal Stability, Rheological, and UV-Blocking and Antifungal Activity

1
Laboratoire de Chimie Physique Moléculaire et Macromoléculaire, Faculté de Science, Université de Blida 1, Blida 09000, Algeria
2
Department of Chemistry, College of Science, King Saud University, Riyadh 11451, Saudi Arabia
3
Institut Européen des Membranes, IEM, UMR-5635, University Montpellier, ENSCM, CNRS, Place Eugene Bataillon, F-34095 Montpellier, France
4
Functional Materials Group, Gulf University for Science and Technology (GUST), Masjid Al Aqsa Street, Mubarak Al-Abdullah 32093, Kuwait
5
NanoStruc Research Group, Chemistry Department, Faculty of Science, Helwan University, Cairo 4034572, Egypt
*
Authors to whom correspondence should be addressed.
Polymers 2024, 16(19), 2702; https://doi.org/10.3390/polym16192702
Submission received: 11 August 2024 / Revised: 12 September 2024 / Accepted: 19 September 2024 / Published: 24 September 2024
(This article belongs to the Section Polymer Composites and Nanocomposites)

Abstract

:
The development of poly(lactic acid) (PLA) nanocomposites incorporating urchin-like WO3 particles through a cost-effective solution-casting method has led to significant enhancements in structural, thermal, optical, and rheological properties. The incorporation of these WO3 particles up to 7 wt% resulted in the formation of an irregular honeycomb-like morphology with broad pore sizes ranging from 14.1 to 24.7 µm, as confirmed by SEM and EDX analysis. The urchin-like WO3 particles acted as effective nucleating agents, increasing the crystallinity of PLA from 40% to 50% and achieving an impressive overall crystallinity rate of 97%. Differential scanning calorimetry (DSC) revealed an 11 K reduction in the crystalline phase transition temperature while maintaining stable melting (Tm) and glass transition (Tg) temperatures. Thermal analysis indicated a significant decrease in the onset of degradation and maximum thermal stability (Tmax), with a reduction of 21 K due to the incorporation of the WO3 particles. Optical measurements showed enhancement of UV-blocking properties from 9% to 55% with the WO3 particle loading. Rheological tests demonstrated substantial improvements in viscoelastic properties, including a remarkable 30-fold increase in storage modulus, suggesting enhanced gel formation. Although the nanocomposites showed minimal antibacterial activity against Escherichia coli and Staphylococcus aureus, they exhibited significant antifungal activity against Candida albicans. These results underscore the potential of the PLA/WO3 nanocomposites for advanced material applications, particularly where enhanced mechanical, thermal, optical, and antifungal performance is required.

1. Introduction

Technological advancements have significantly increased the demand for novel materials with enhanced properties tailored to specific applications. One of the most active and promising areas of materials research is nanocomposite-based polymer matrices [1,2]. These materials offer numerous advantages, including low cost, lightweight, excellent chemical and mechanical resistance, and enhanced electrical conductivity [3]. Nanocomposites are synthesized by incorporating nanometric particles, either organic or inorganic, into a polymer matrix, which leads to enhanced properties due to the increased surface area and good dispersion within the matrix [4,5,6]. This dispersion plays a critical role in enhancing interactions between the matrix and the nanoparticles, leading to improved material properties [5,6]. The field of nanocomposites continues to grow as researchers explore innovative ways to improve material performance for diverse applications such as packaging, electronics, and biomedical devices, using the unique characteristics provided by nanoscale inclusions [3].
Among the various nanoparticles used in enhancing polymer matrices, tungsten trioxide (WO3) stands out due to its unique properties, including high density, chemical stability, and excellent optical characteristics, making it suitable for applications in sensors, optical devices, mechanical and X-ray shielding, and UV blocking [7,8]. The ability of WO3 to generate reactive oxygen species (ROS) under UV or visible light can be harnessed for antibacterial applications, making the composite useful in medical devices and implants. The incorporation of WO3 into polymer matrices has been extensively studied to improve the matrices’ performance [9,10,11,12,13]. Several studies have reported on WO3‘s integration into different polymers such as poly(aniline) [10,11], poly(3,4-ethylenedioxythiophene) [9], and PLA [12,13]. This research indicates that WO3 not only enhances the mechanical properties of these polymers but also introduces novel functionalities that can expand their application potential. For instance, the incorporation of WO3 can improve the thermal stability and UV resistance of the host polymer, thus extending its usability in harsh environmental conditions [11,13]. As such, WO3 nanocomposites represent a promising area for developing advanced materials that meet the increasing demands for high-performance applications.
PLA is one of the most commonly used biopolymers in the research domain and has gained significant attention in industries like food packaging due to its Generally Recognized As Safe (GRAS) status by the US Food and Drug Administration (FDA) [12,13,14]. PLA’s biodegradability and ease of processing make it an attractive alternative to conventional plastics derived from fossil fuels. As an aliphatic polyester polymer, PLA is primarily composed of polyglycolic or polyadic acid and is derived from renewable resources such as corn starch or sugarcane [14,15]. This biopolymer is not only environmentally friendly but also biocompatible, which has led to its application in medical fields such as prosthetics and dentistry, where it can replace synthetic polymers like polystyrene (PS) and polyethylene terephthalate (PET) [16,17]. Despite its advantages, PLA suffers from inherent drawbacks such as low thermal decomposition temperature, brittleness, and moisture absorption, which limit its widespread use [15]. To address these issues, researchers have explored the incorporation of various nanoparticles, including cellulose, ZnO, and TiO2, to enhance their mechanical, chemical, optical, and electrical properties [18,19,20,21].
Previous studies have demonstrated that honeycomb-like structures can enhance the mechanical and thermal properties of polymers [22,23,24], as seen in Qu et al.’s work on ZIF-67/PLA aerogels [22]. They observed that the nanofillers within the honeycomb-like pores could significantly adjust pore size and specific surface area, leading to improved material performance [22]. Applications of honeycomb-like morphologies span various fields, including water/oil separation, automotive engineering, and aerospace technology [22,25]. In this study, we aim to synthesize and characterize PLA/WO3 nanocomposites with a novel honeycomb-like morphology. The nanocomposites were prepared using a solution-casting method, incorporating WO3 particles with loadings up to 7 wt%. The use of WO3 is particularly intriguing due to its inherent biocompatibility, especially in controlled forms such as nanoparticles, thin films, or coatings, which makes it a promising candidate for biomedical applications when combined with PLA. Our study systematically explores the morphological development, structural processability, transparency, thermal, rheological, and antimicrobial properties of these nanocomposites. The results highlight the enhanced antifungal activity against Candida albicans, suggesting that these PLA/WO3 nanocomposites offer a viable approach for use in a wide range of applications, potentially extending into industries such as environmental technology. The research not only showcases the potential of the honeycomb-like structure in improving polymer properties but also opens new avenues for advanced material applications.

2. Experimental

2.1. Chemicals and Reagents

For the preparation of PLA/WO3 nanocomposite films, high-purity chemicals and reagents were used. PLA, sourced from NETCO EXTRUDED PLASTICS, (Hudson, MA, USA), with a purity exceeding 98%, served as the polymer matrix. Dichloromethane (CH2Cl2, ≥99.9%, Riedel-de Haën, Buchs, Switzerland) was used as the solvent to dissolve PLA, facilitating the creation of a homogeneous solution. Tungsten oxide powder (urchin-like WO3 particles, 99% purity, Sigma Aldrich, Saint Louis, MI, USA) was employed as the nanofiller. For its dispersion, a mixture of ethanol (C2H5OH, 96.96%, GPR RECTAPUR, VWR, Radnor, PA, USA) and distilled water was used, ensuring effective nanoparticle dispersion.

2.2. Preparation of PLA/WO3 Nanocomposite

The PLA/WO3 nanocomposite films were prepared using a solution-casting method. Initially, 2 g of PLA were dissolved in 50 mL of dichloromethane (CH2Cl2). The dissolution was carried out under constant stirring at 50 °C for 15 min to ensure complete dissolution of the PLA and to achieve a viscous solution. Once the PLA was fully dissolved, 0.5 g of WO3 particles were dispersed in a mixture of 25 mL ethanol and 25 mL distilled water with sonication for 1 h to ensure complete dispersion of the WO3 particles. The dispersed WO3 particles were then added at weight percentages of 1%, 3%, 5%, and 7% relative to the weight of the PLA and mixed at 45 °C for 4 h (Table 1). FTIR spectroscopy confirmed the complete evaporation of the solvent from the films, as no residual solvent peaks were observed, ensuring the successful formation of solid nanocomposite films.

2.3. Physicochemical Characterization

A series of characterization techniques were employed to analyze the structural and morphological properties of the prepared PLA/WO3 nanocomposites. X-ray diffraction (XRD) measurements were performed using a Bruker D2 Phaser diffractometer with Cu Kα radiation at 30 kV and 10 mA. The XRD patterns were recorded over a 2θ range from 2° to 80° with a scan step size of 0.01°/s to determine the crystallinity and phase composition of the nanoparticles and nanocomposites. The average crystallite size of the WO3 nanoparticles was calculated using the Debye–Scherrer equation [26].
Scanning Electron Microscopy (Quanta 650, FEI, Hillsboro, OR, USA) operating at an acceleration voltage of 10 kV was employed to analyze the particle size and morphology of WO3 powder, pure PLA after solution casting, and PLA/WO3 nanocomposites. The WO3 powder was directly mounted on the SEM sample holder to capture its native morphology without additional treatment. For the PLA and PLA/WO3 nanocomposites, the films were spread on petri dishes, dried completely, and stored at −10 °C for 12 h to facilitate cryofracturing, ensuring clean cross-sectional surfaces, which is essential for polymer composites with irregular surfaces. Following cryofracturing, the samples were mounted for SEM analysis, with a focus on regions that best represented the material’s morphology. Elemental analysis was performed using an energy-dispersive spectrometer (EDS) attached to the SEM, providing information on the distribution of WO3 particles within the PLA matrix. Pore size distribution was determined using Image J software 1.49.
Fourier transform infrared spectroscopy (FTIR) was used to identify the functional groups within the nanocomposites. FTIR spectra were collected using a JASCO FT/IR-4100 spectrometer (Easton, MD, USA) equipped with an ATR (attenuated total reflectance) accessory, covering the frequency range of 400–4000 cm−1 at a resolution of 4 cm−1. Data were acquired at a scan rate of 2 scans per second and averaged over 64 scans to enhance signal-to-noise ratio and ensure high-quality analysis.
The UV-visible-NIR spectroscopic analysis of the polymer films was conducted using a Shimadzu UV-1201PC spectrometer (Shimadzu, Kyoto, Japan), covering the wavelength range from 200 to 800 nm. The films were prepared on quartz substrates to avoid interference. The scan speed was set to 200 nm/min, with a 1 nm interval for high-resolution data acquisition. This analysis was performed to evaluate the UV-blocking properties of the films, focusing on their absorbance in the UV region (200–400 nm) to assess their effectiveness in blocking ultraviolet light. Additionally, the bandgap energy of the films was calculated using the Tauc plot method by plotting (αhν)2 vs. photon energy (hν), where α is the absorption coefficient. The bandgap was determined by extrapolating the linear portion of the curve to the energy axis, providing insight into the electronic properties of the polymer nanocomposites. This method is crucial for understanding how the WO3 particles influence the optical characteristics and electronic interactions within the composite matrix.
The film thickness was measured using a digital micrometer with a precision of ±0.005 mm at ten random locations per film. Measurements were taken gently to avoid deformation, and the average thickness was calculated along with the standard deviation to account for variations. This ensures accurate interpretation of UV-Vis absorbance data.

2.4. Rheological Measurements

Dynamic rheological measurements were conducted using a cone-plate rheometer (MCR302, Anton Paar GmbH, Graz, Austria) to evaluate the viscoelastic properties of PLA/WO3 nanocomposite gels before solvent evaporation. The samples, prepared by mixing PLA and WO3 in solution to form a gel, were loaded onto the 60 mm diameter cone (1° angle) with a gap set at 0.125 µm to minimize edge effects. Care was taken to avoid air bubbles during loading, and a solvent trap was employed to prevent solvent evaporation. A dynamic strain sweep (0.01% to 100% strain) at 1 Hz was performed to determine the linear viscoelastic region (LVR), followed by frequency sweep tests (0.01 Hz to 100 Hz) conducted at 0.1% strain within the LVR. All measurements were performed at 37 °C using a Peltier heating system to ensure temperature control. The storage modulus (G′), loss modulus (G″), and complex viscosity (η*) were recorded, with each sample tested in triplicate for reproducibility. The method, including careful sample handling, gap setting, and solvent management, ensures the reliability and reproducibility of the rheological data.

2.5. Thermal Analysis

Thermogravimetric analysis (TGA) was performed using a Q500 instrument (TA Instruments, New Castle, DE, USA) to evaluate the thermal stability of the films. Approximately 5 mg of each sample was heated from ambient temperature to 700 °C at a rate of 10 °C/min under a nitrogen flow of 60 mL/min. Differential scanning calorimetry (DSC) was conducted with a TA Instruments DSC Q20 (New Castle, DE, USA) to analyze the thermal transitions of the PLA/WO3 nanocomposites. Samples weighing 5 mg were heated from room temperature to 200 °C at 10 °C/min, then cooled back to 20 °C at the same rate while maintaining a nitrogen flow of 40 mL/min. DSC thermograms provided data on crystallization and melting behavior. Crystallization and melting enthalpies were determined using the theoretical maximum melting enthalpy Δ H m 0 = 93.6   J / g [27]. The relative degree of crystallization rate was calculated by Equation (1) [28].
χ   % = Δ H m 1 W t f · Δ H m 0
where ΔHm represents the measured melting enthalpy and Wtf is the weight fraction of WO3 particles in the nanocomposite [28].

2.6. Antimicrobial Assays

The antimicrobial activity of WO3 particles and PLA/WO3 nanocomposites was evaluated using the agar disc diffusion method [29,30]. Testing was conducted against Staphylococcus aureus ATCC 25923 (Gram-positive bacteria), Escherichia coli ATCC 25922 (Gram-negative bacteria), and Candida albicans ATCC 10231 (fungal strain). Microbial cultures were prepared fresh: the fungus was grown on Sabouraud agar at 25 °C for 48 h, and bacterial strains on nutrient agar at 37 °C for 24 h. Bacterial cultures were adjusted to a density of 106 CFU/mL [31]. For the assay, 5 mL of brain heart infusion broth (BHIB) was mixed with 0.1 g of PLA/WO3 nanocomposites, PLA, and WO3 particles. Net PLA film (0.1 g) and 100 µL of a 100 µg/mL WO3 particle suspension were used as controls. Suspensions were spread on nutrient and Sabouraud agar plates, and sterile discs (6 mm) soaked in the solutions were placed on the agar using sterile forceps. Plates were incubated at 37 °C for 24 h for bacterial strains and at 25 °C for 48 h for the fungal strain. Antimicrobial activity was assessed by measuring the zone of inhibition around the discs, with all tests performed in duplicate for accuracy.

3. Results and Discussions

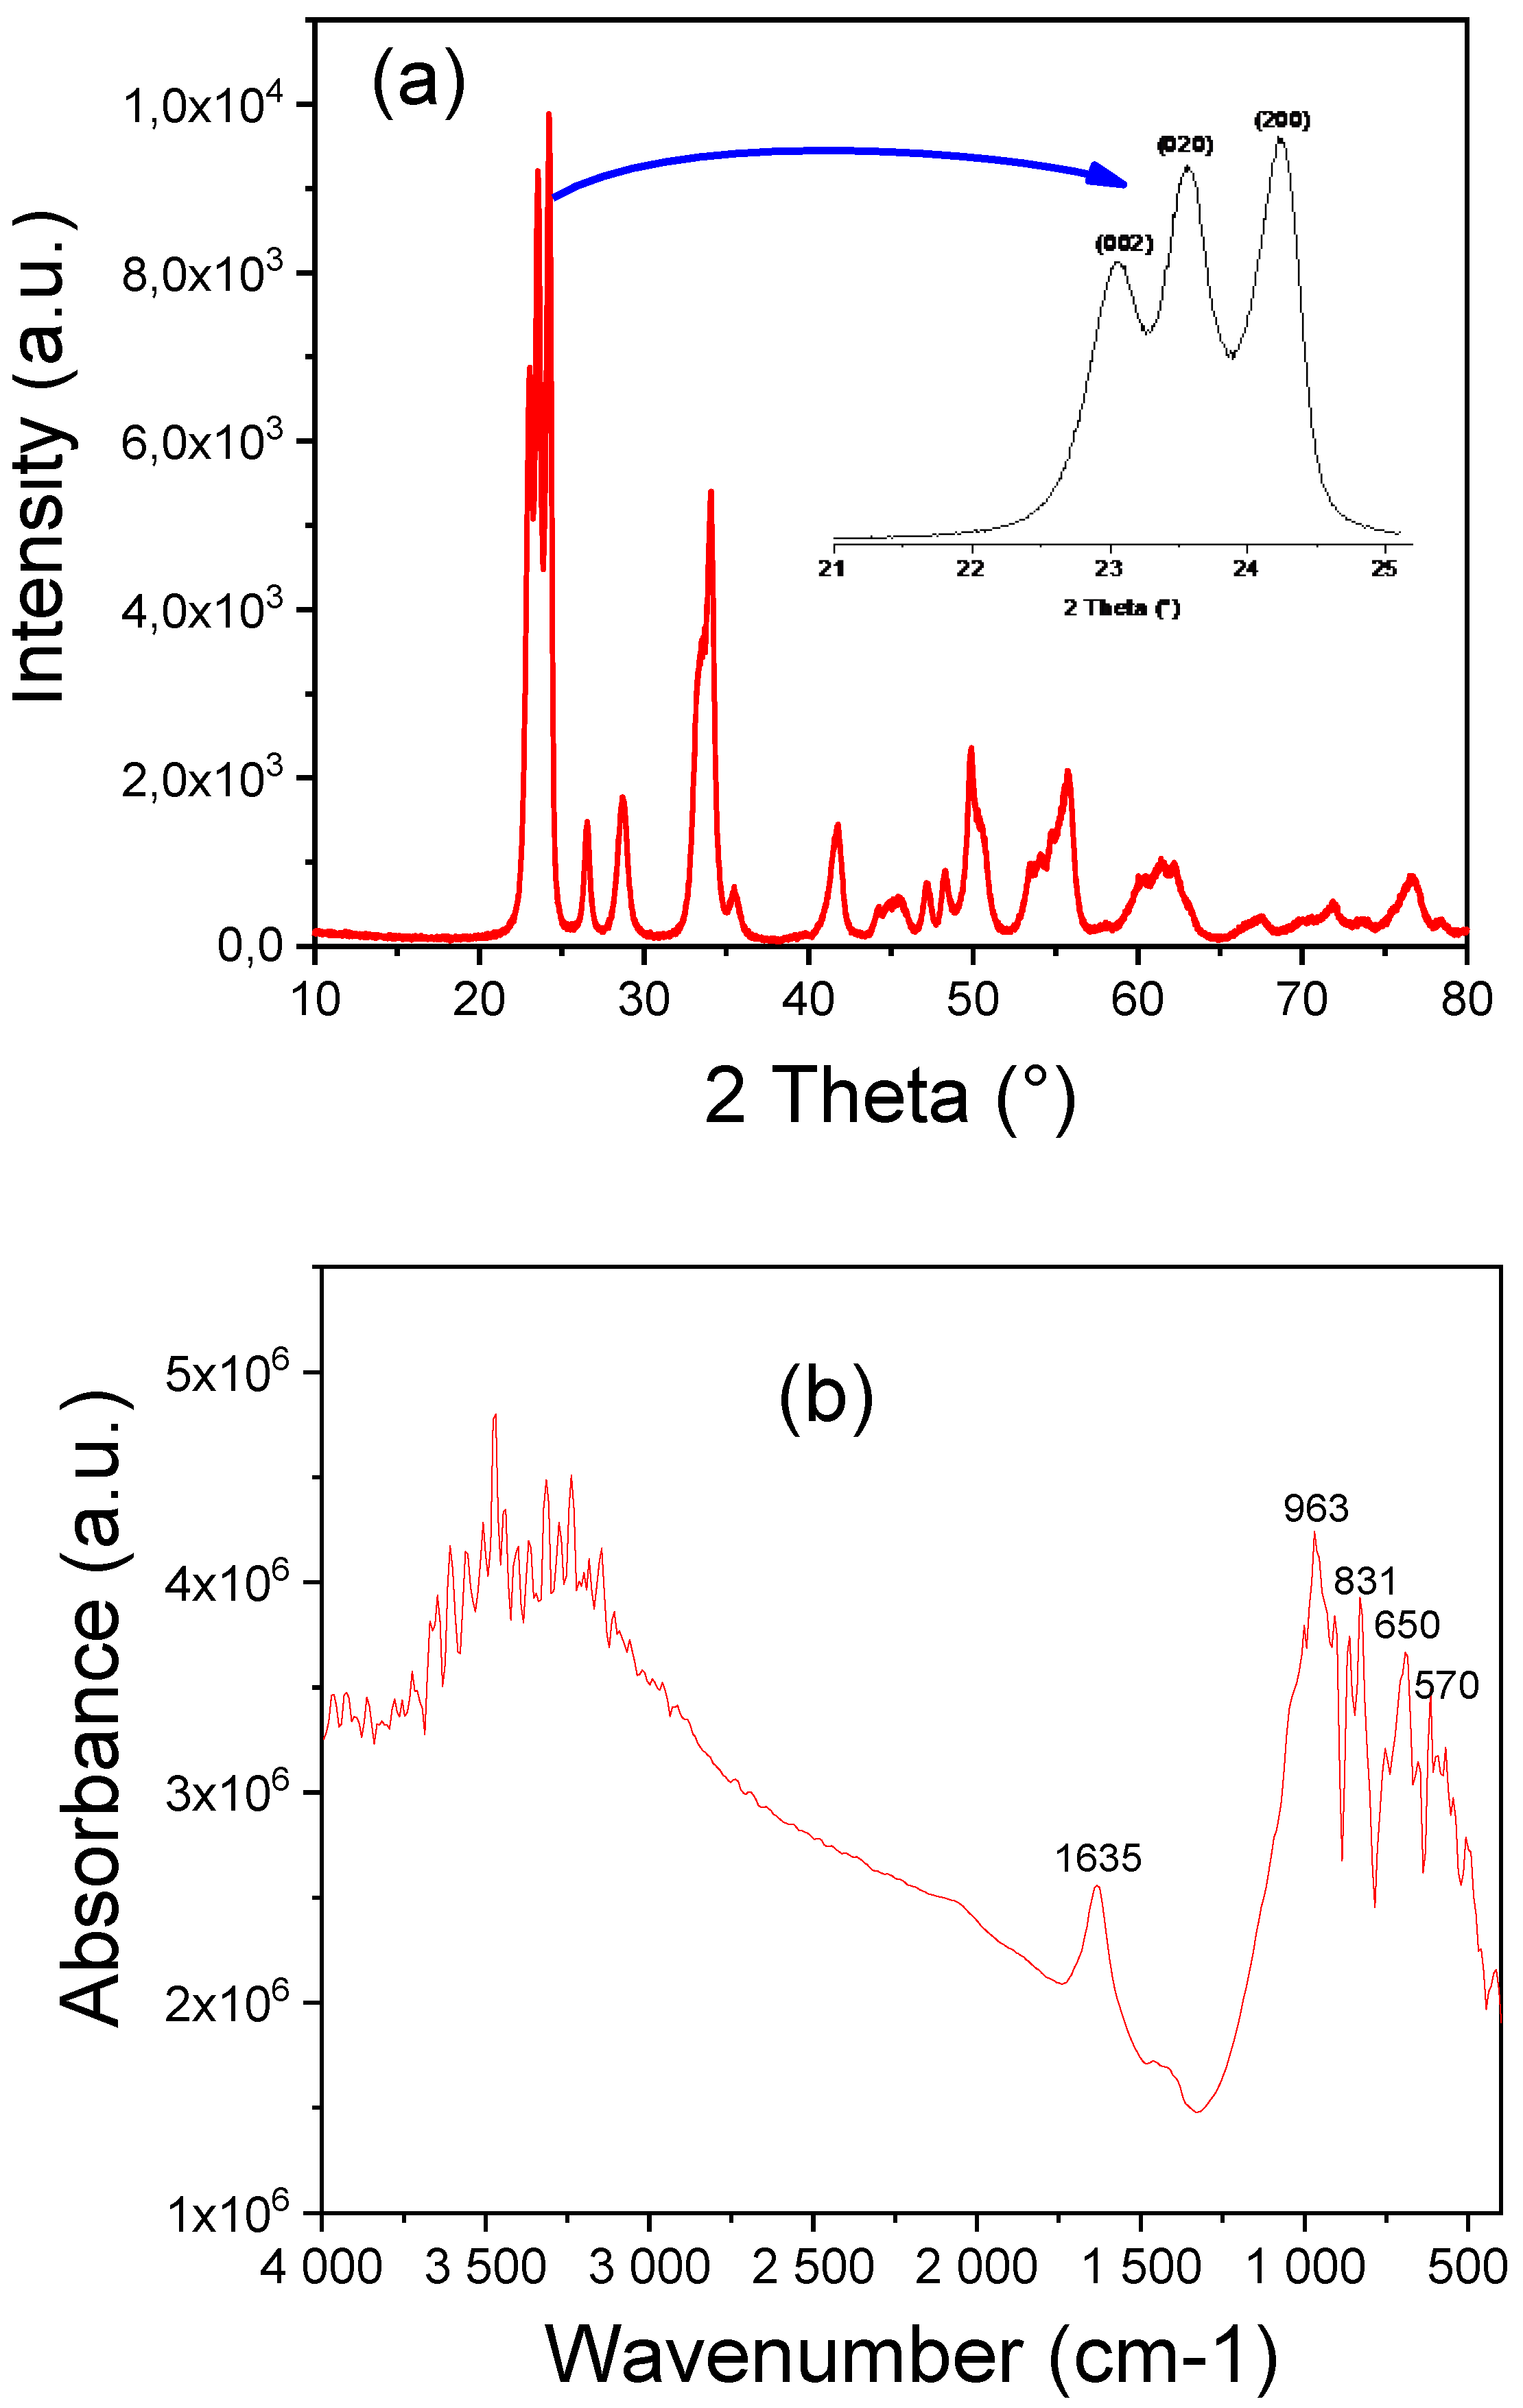
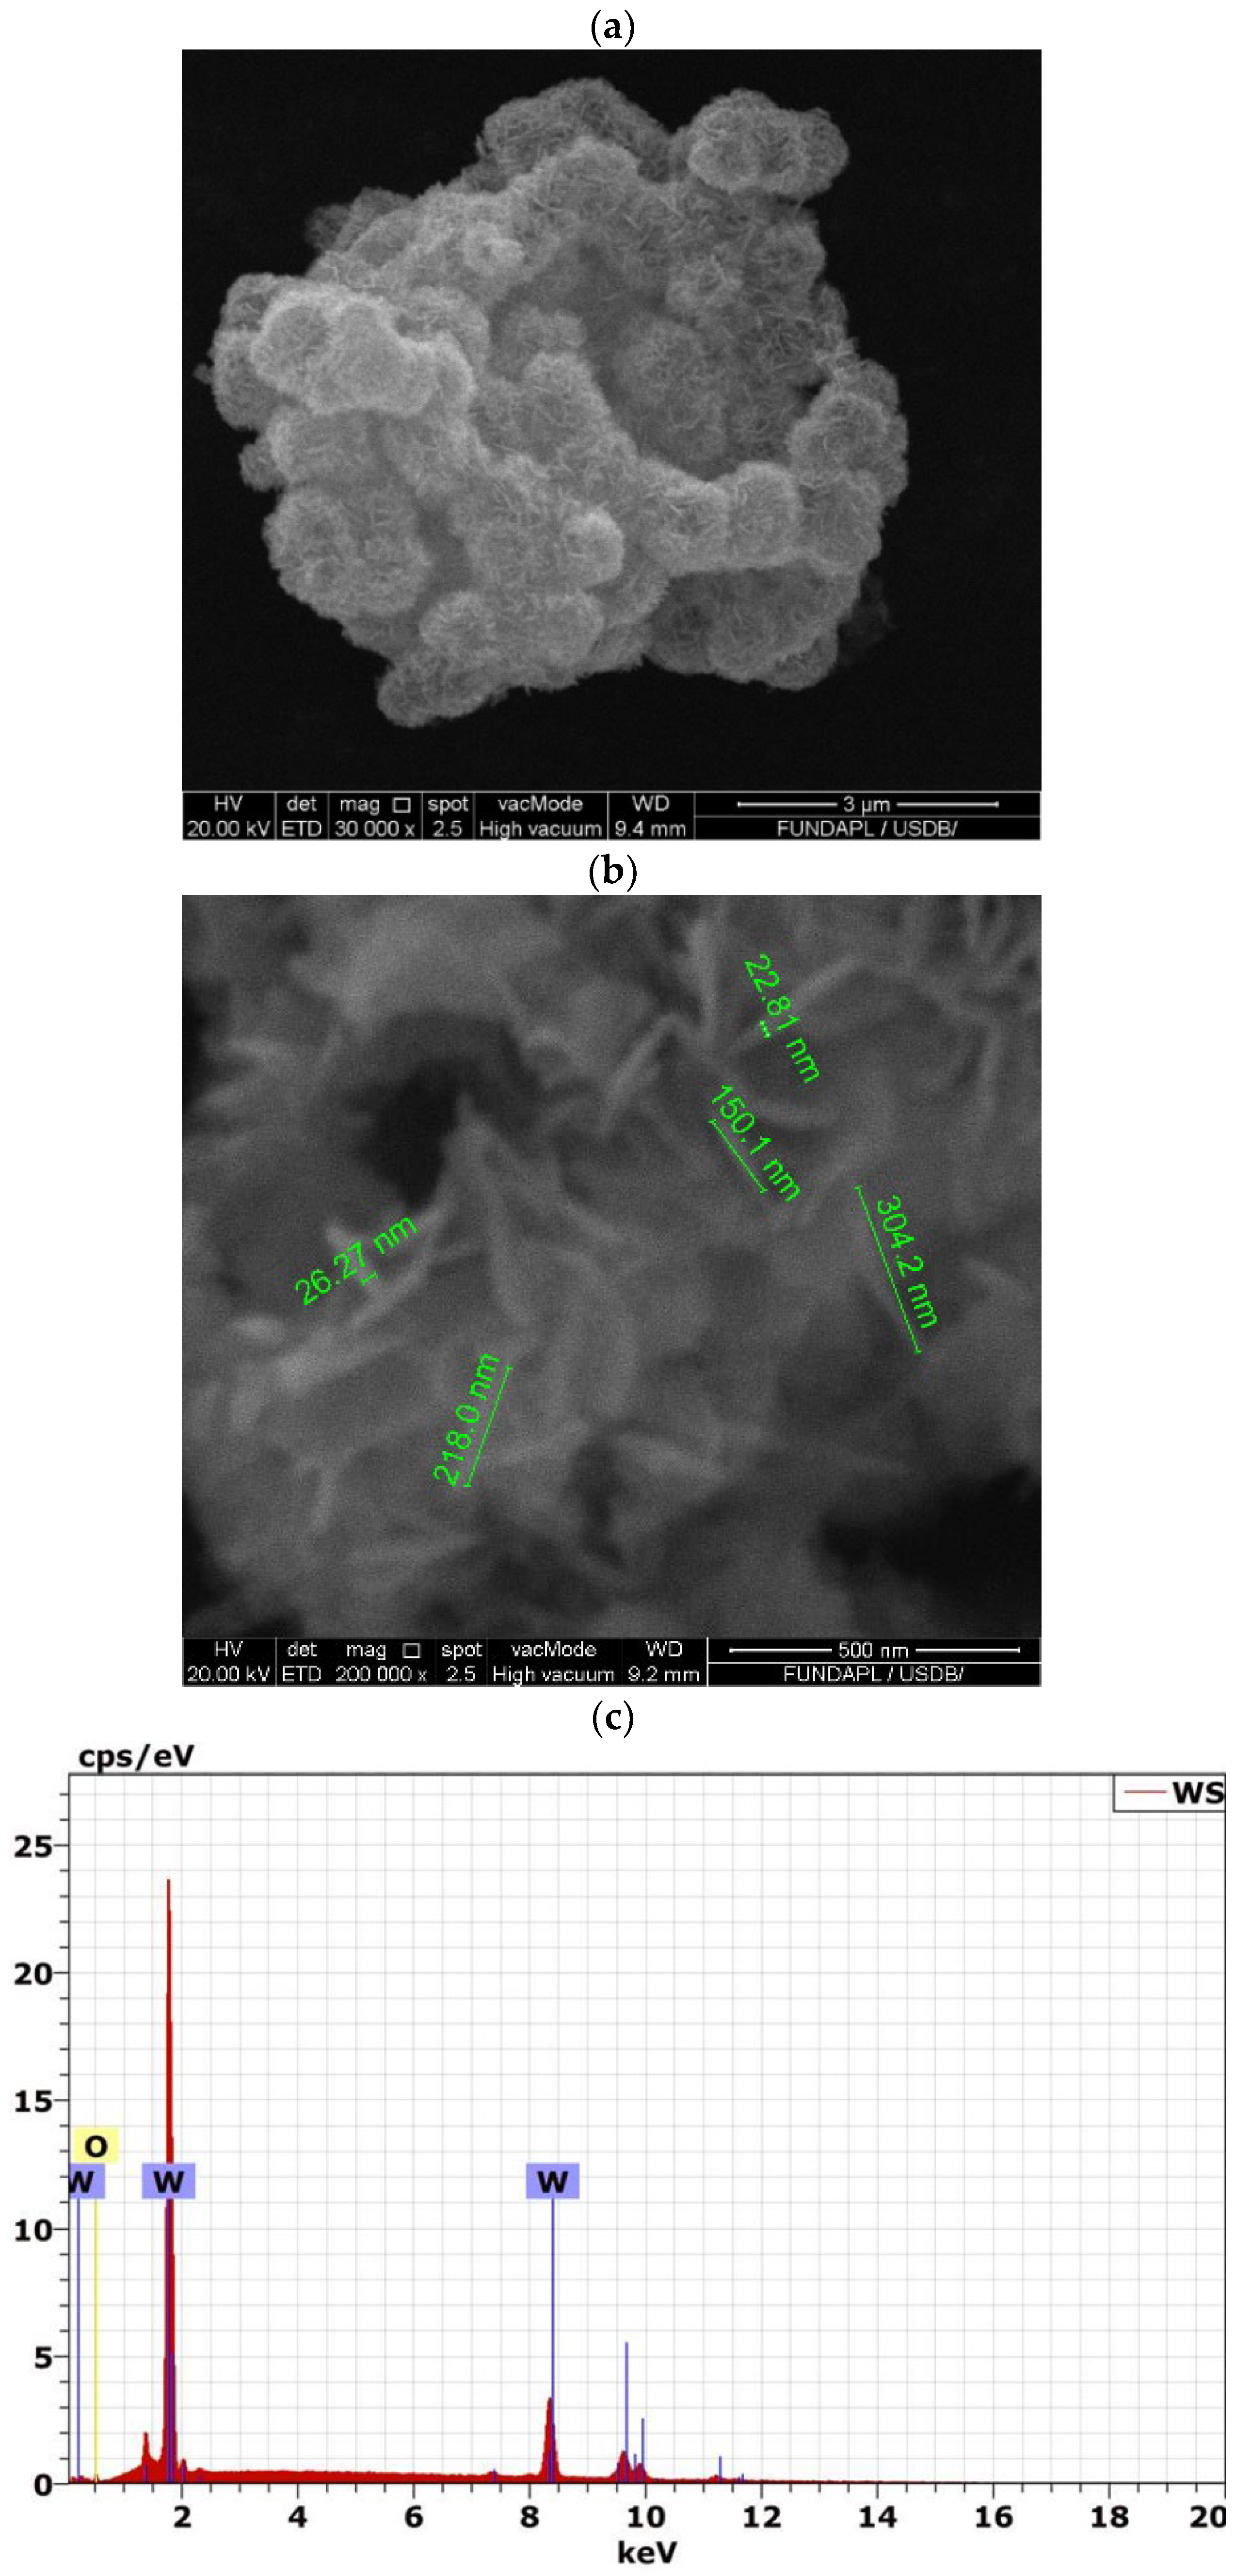
3.1. Analysis of WO3 Nanoparticles

The XRD pattern of the WO3 particles, shown in Figure 1a, reveals a series of well-defined peaks at 2θ values of 23.06°, 23.56°, 24.20°, 26.55°, 28.72°, 34.11°, 35.51°, 41.78°, 47.20°, 49.88°, and 55.70°. These peaks correspond to the (002), (020), (200), (120), (112), (022), (202), (122), (222), (320), (040), (440), and (620) planes of monoclinic WO3 [32,33], as per JCPDS No. 71-0131. The presence of these sharp peaks confirms the high crystallinity of the WO3 particles. Notably, the absence of any additional peaks in the XRD pattern indicates the formation of a pure WO3 phase, free from impurities or secondary phases. By analyzing the most intense peak at 2θ = 24.20° (the (200) plane), the average crystallite size of the WO3 particles was determined to be 20.7 nm, with a crystallinity of 96.9%.
Figure 1b presents the Fourier-transform infrared (FTIR) spectra of WO3 particles. The FTIR spectra of WO3 particles can be divided into three distinct zones: a broad band at 3200–3600 cm−1, a peak at 1635 cm−1, and a third zone comprising narrow peaks between 570 and 960 cm−1. The bands at around 3467 cm−1 are attributed to the O-H stretching mode due to adsorbed water molecules. The peak at 1635 cm−1 is associated with the H-O-H bending vibration mode [33]. The band at 963 cm−1 corresponds to the asymmetric stretching vibrations of W=O bonds [34,35]. Furthermore, the narrow peaks between 650 and 831 cm−1 are assigned to the (W-O-W) and (O-W-O) stretching vibrations of bridging oxygen and tungsten, respectively [11,35].
The morphology of the WO3 particles, as shown in Figure 2a,b, features an intriguing structure. The WO3 powder consists of compact agglomerations of urchin-like particles approximately 0.5 µm in diameter, similar to results observed in [36]. These aggregates are composed of densely packed nanorods with an average width of 24 nm and a shape factor (L/d ratio) of 8. This distinctive nanorod morphology significantly increases the surface area, enhancing interaction with the surrounding polymer matrix. This unique structure is crucial in improving the mechanical properties of polymer composites, particularly in applications where enhanced performance is required [37].
The SEM-EDX analysis of the WO3 nanoparticles, shown in Figure 2c, further substantiates the high purity of the sample. The EDX spectrum displayed prominent peaks at 1.7 keV and 8.4 keV for tungsten (W) and a peak at 0.5 keV for oxygen (O). Quantitative analysis revealed that tungsten constituted 75.3% by weight and oxygen constituted 24.7% by weight, closely matching the theoretical stoichiometry of WO3. This result confirms the purity of the WO3 particles, with no extraneous elements detected, emphasizing the absence of impurities. Such purity is crucial for ensuring the integrity and performance of PLA/WO3 nanocomposites, as it allows for optimal interaction between the nanofillers and the polymer matrix, ultimately contributing to enhanced structural and functional properties.

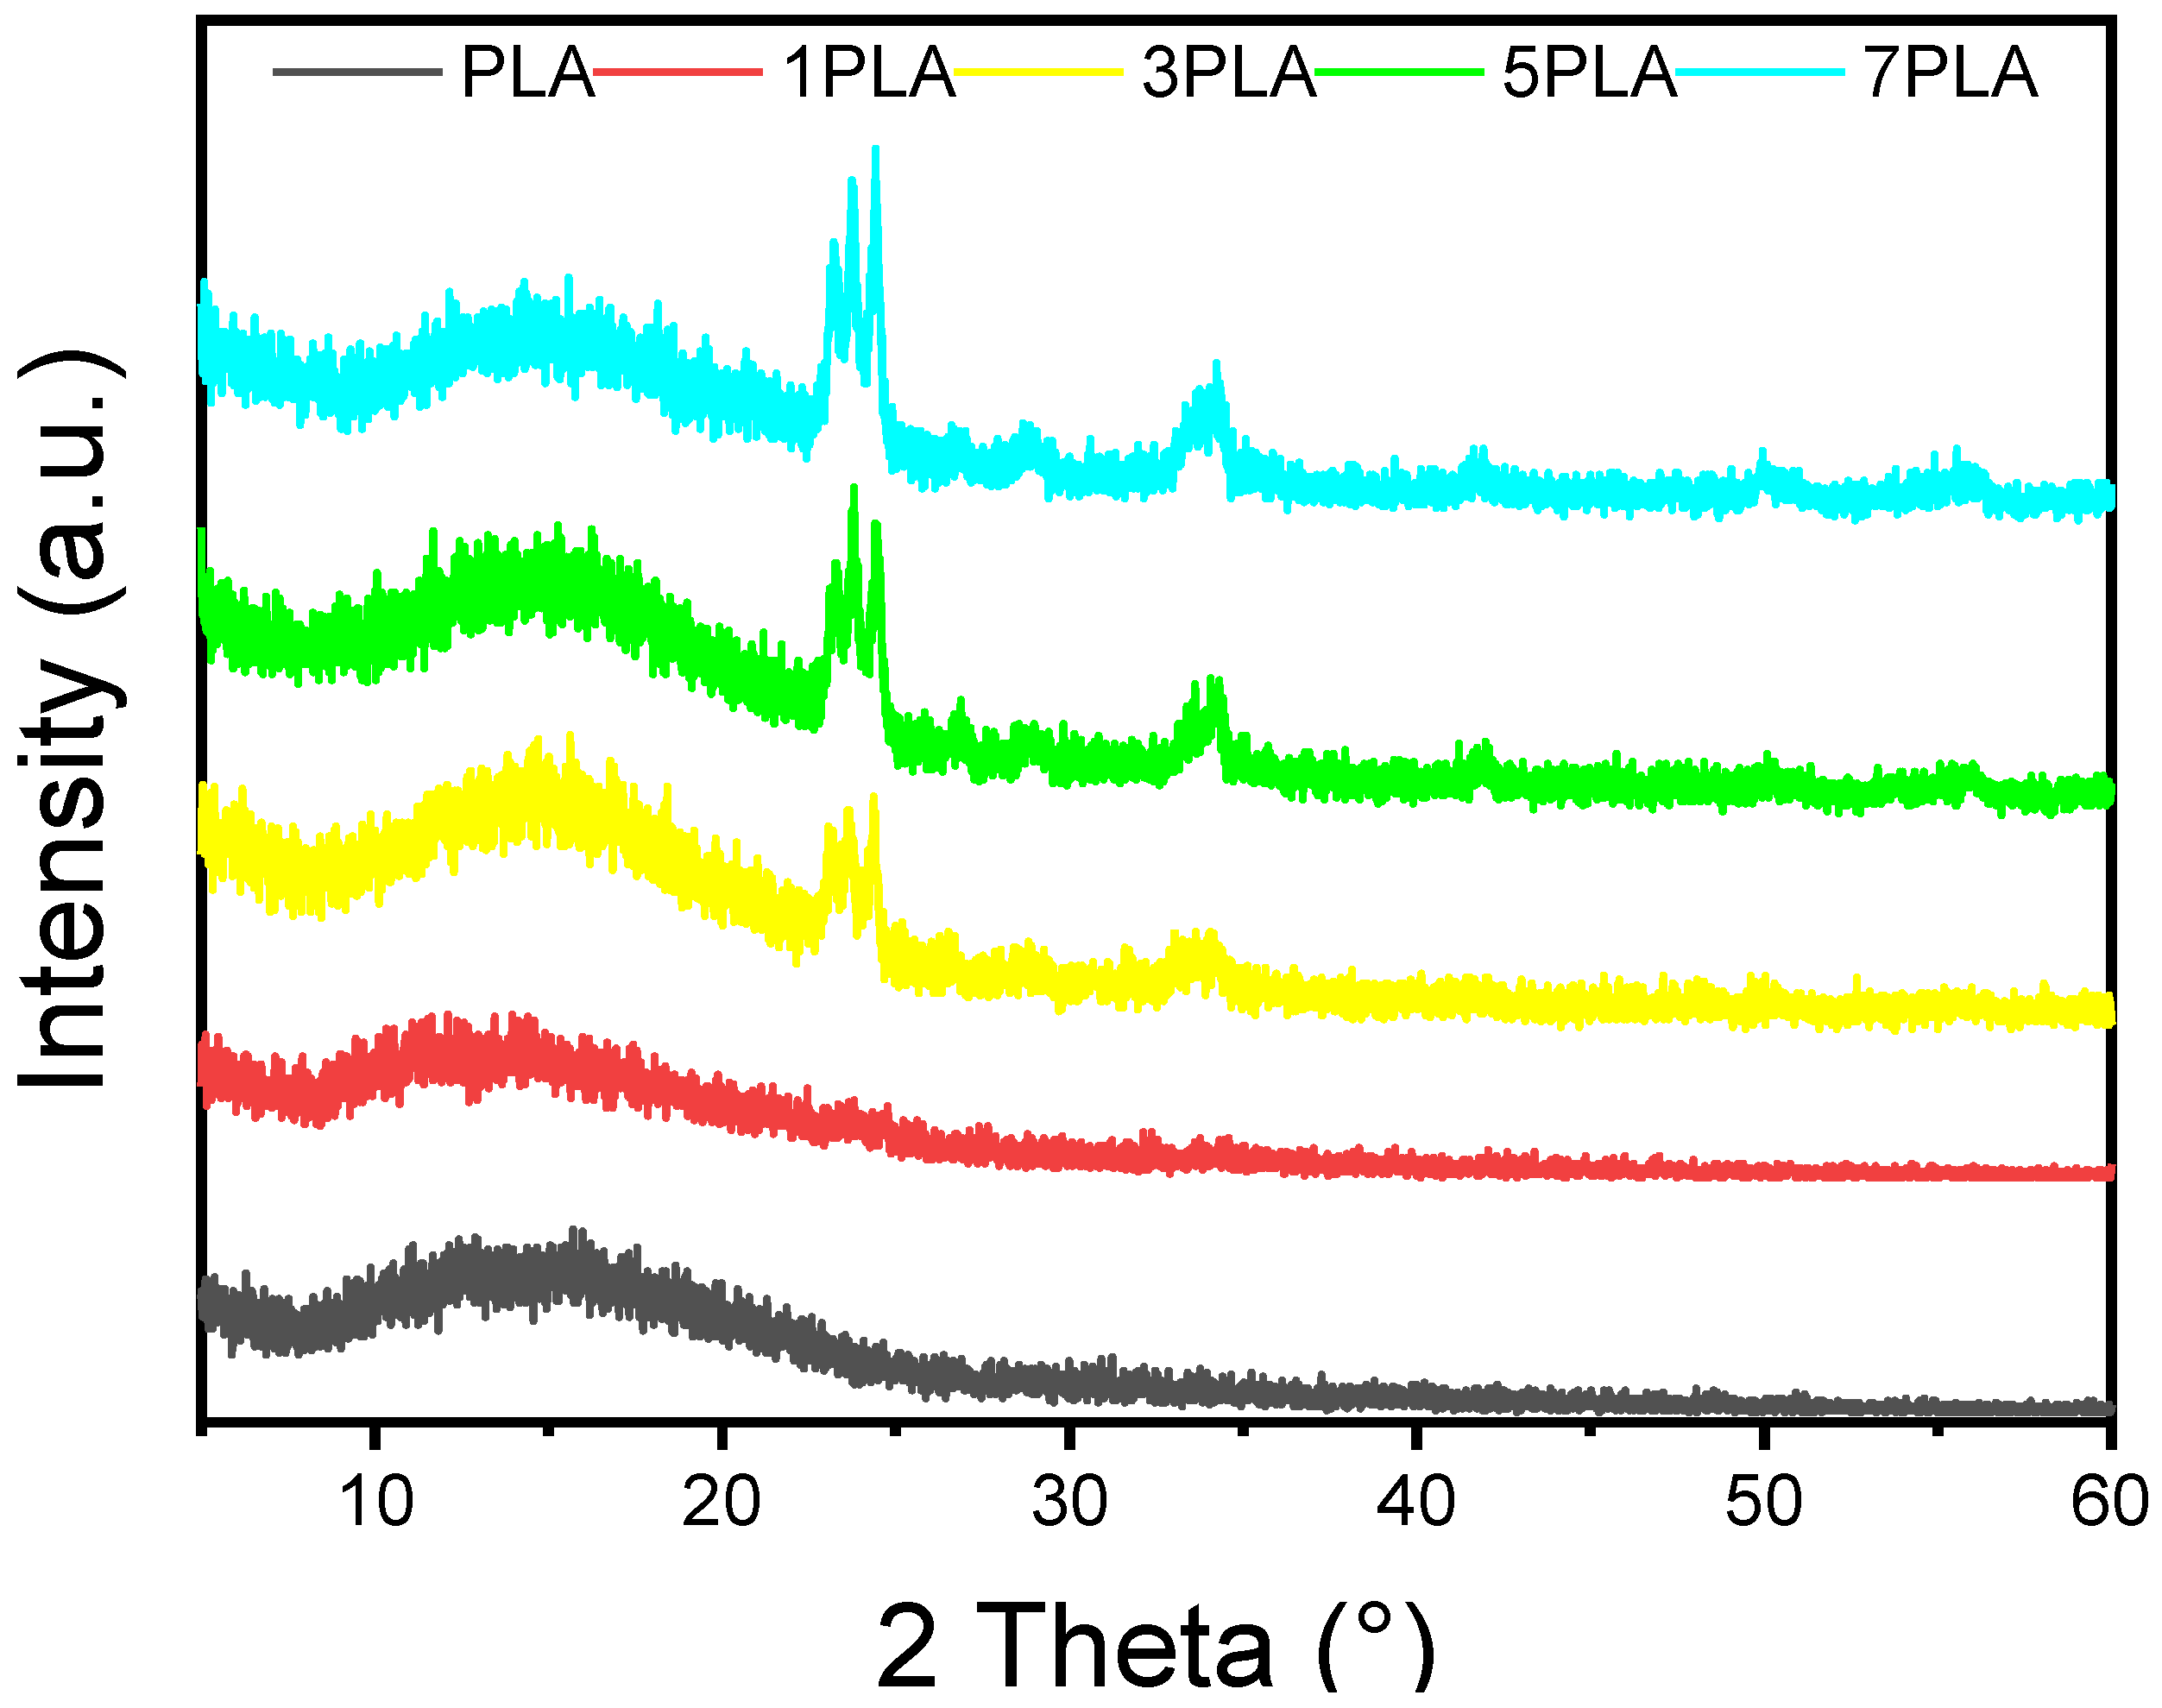
3.2. Crystallinity and Polymorph of PLA/WO3 Nanocomposites

Figure 3 displays the XRD patterns of neat PLA and PLA/WO3 nanocomposites with varying loadings of WO3 particles. The XRD pattern of pure PLA shows a broad amorphous peak centered at 2θ = 15.3°, along with a barely detectable crystalline peak at 2θ = 31.7°, underscoring the semi-crystalline nature of PLA [38,39]. The broad amorphous peak is attributed to disordered regions in the PLA polymer chains, while the crystalline peak represents ordered regions. The XRD patterns of PLA/WO3 nanocomposites exhibit PLA peaks along with the most intense peaks of WO3 particles at 2θ values of 23.06°, 23.56°, 24.20°, 26.55°, 34.11°, and 35.51° corresponding to the (002), (020), (200), (120), and (022), (202) planes of monoclinic WO3, as per JCPDS No. 71-0131. While the incorporation of nanoparticles facilitates nucleation and improves alignment of polymer chains, leading to a slight increase in the intensity of the PLA crystalline peaks, this change in crystallinity is minimal. The urchin-like WO3 particles act as nucleation sites, but their impact on overall PLA crystallinity is not significant. This finding is consistent with observations in similar polymer-filler systems [39,40].

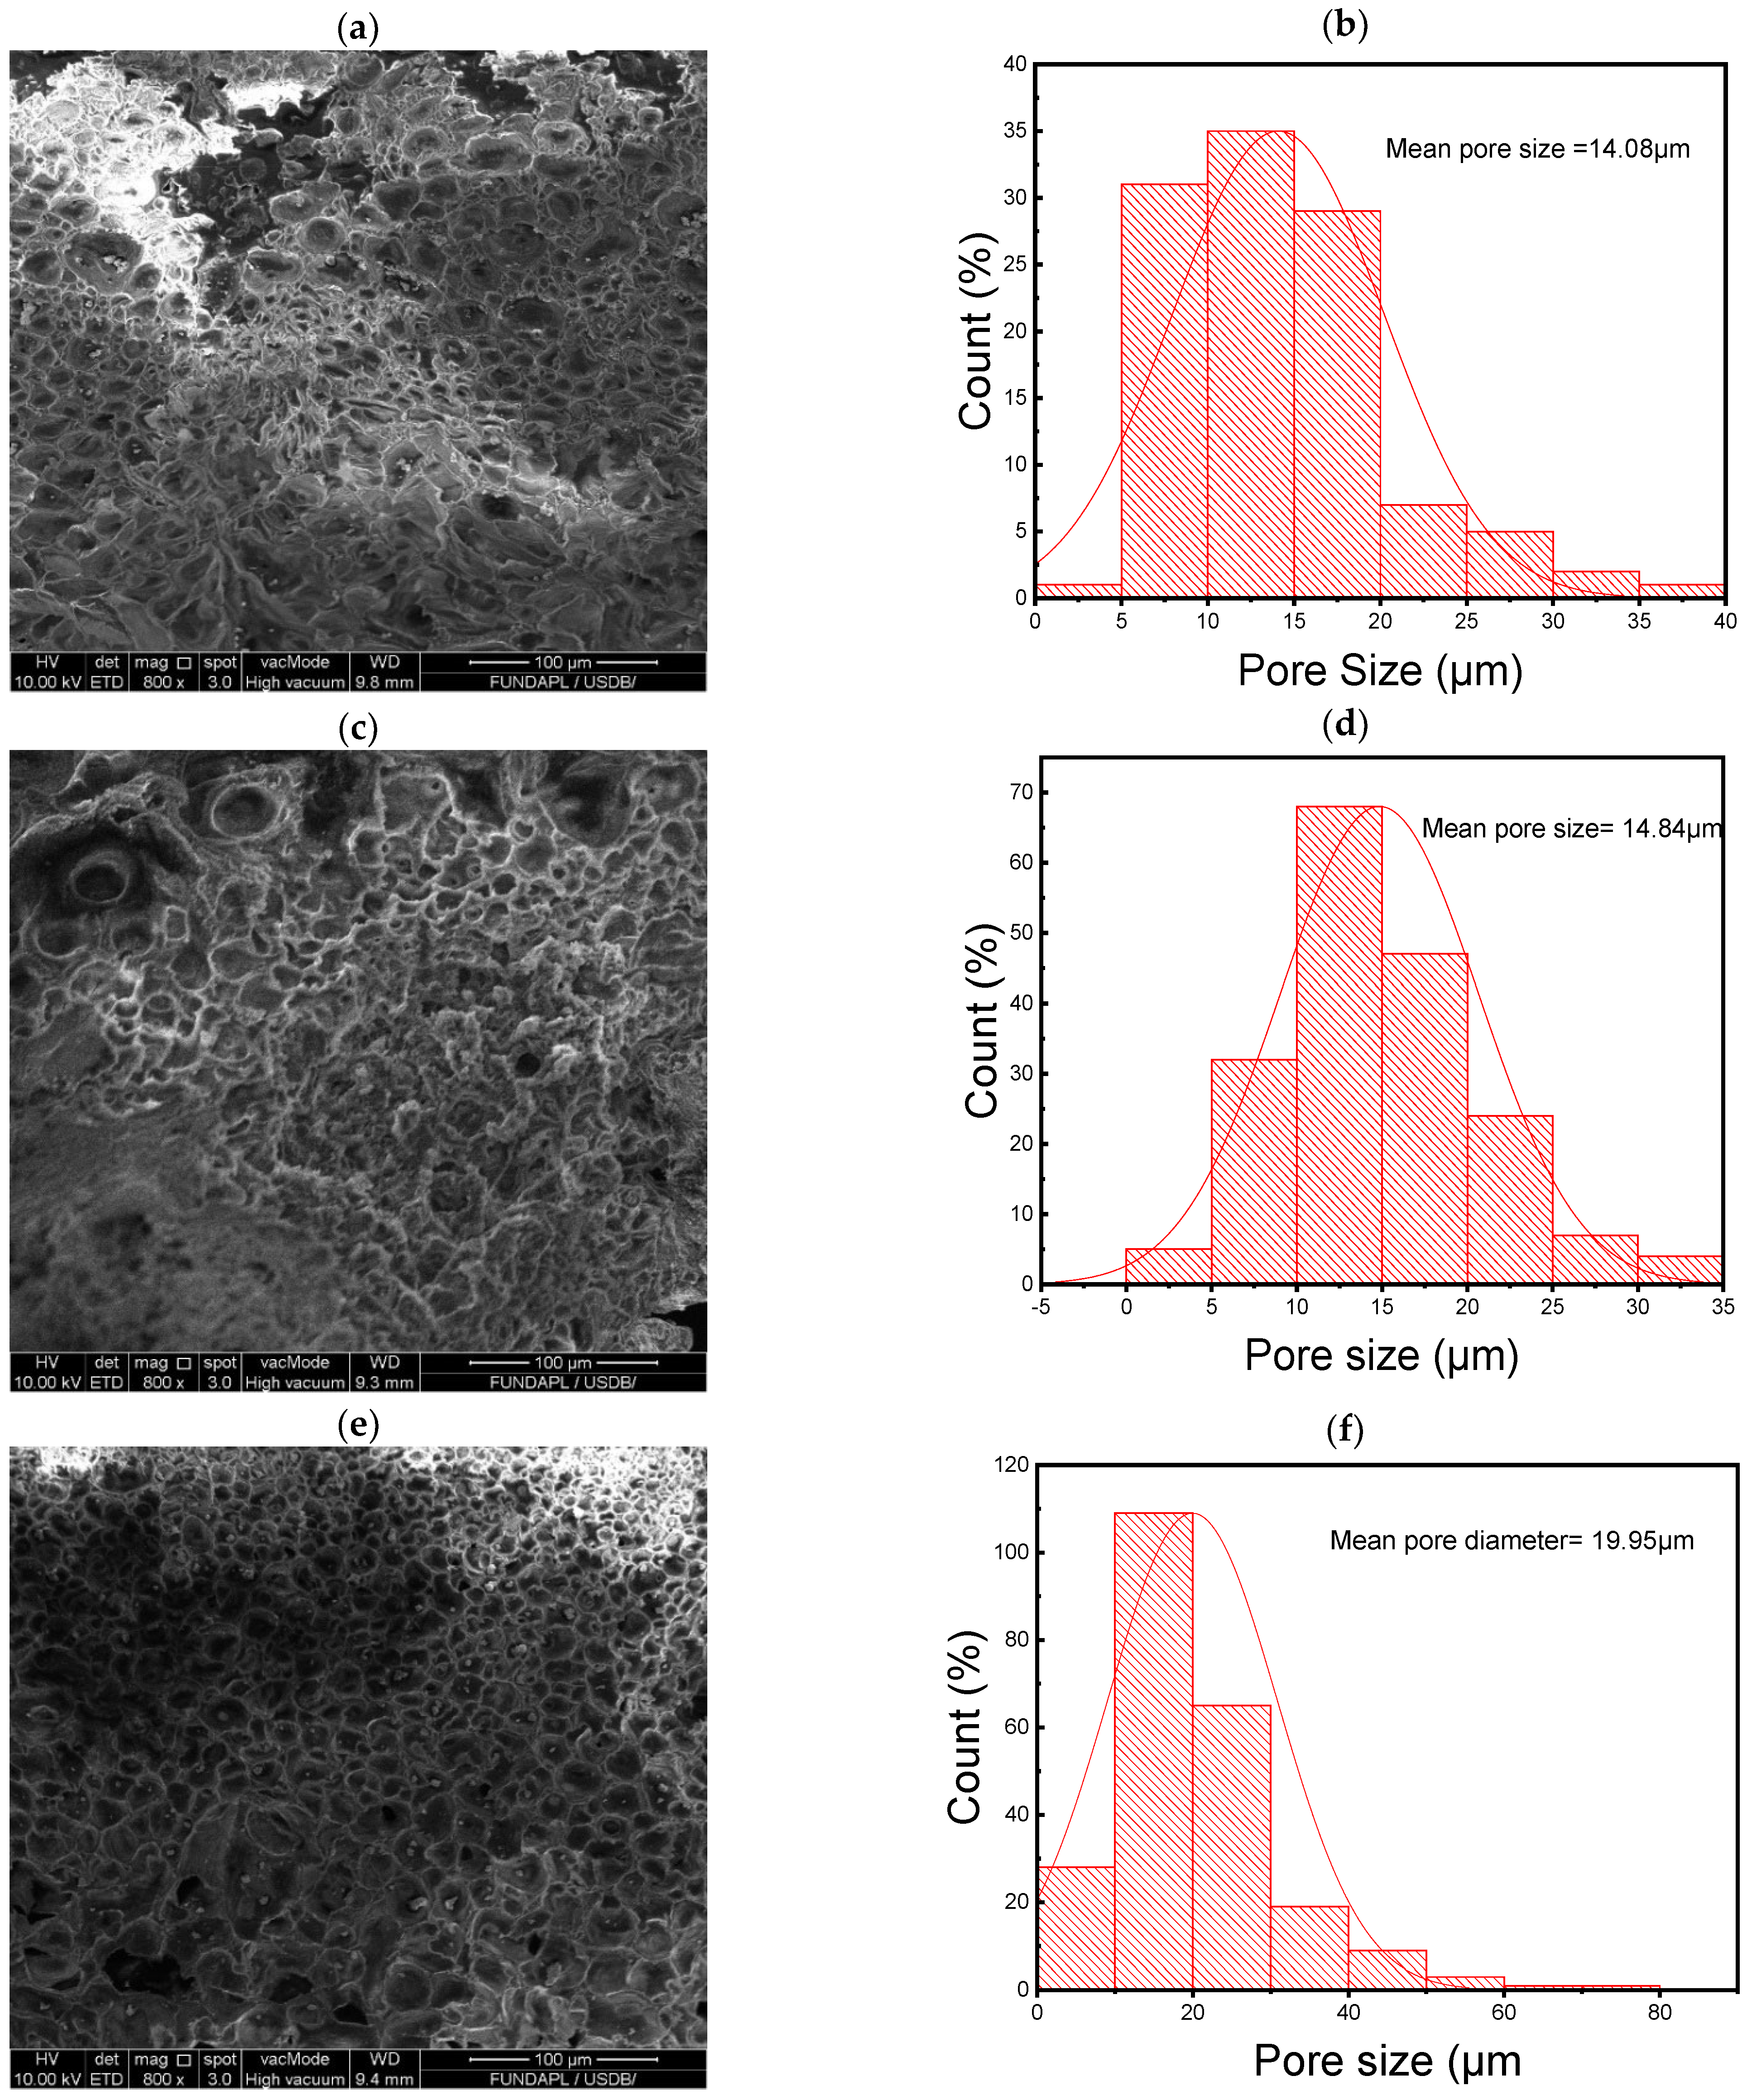
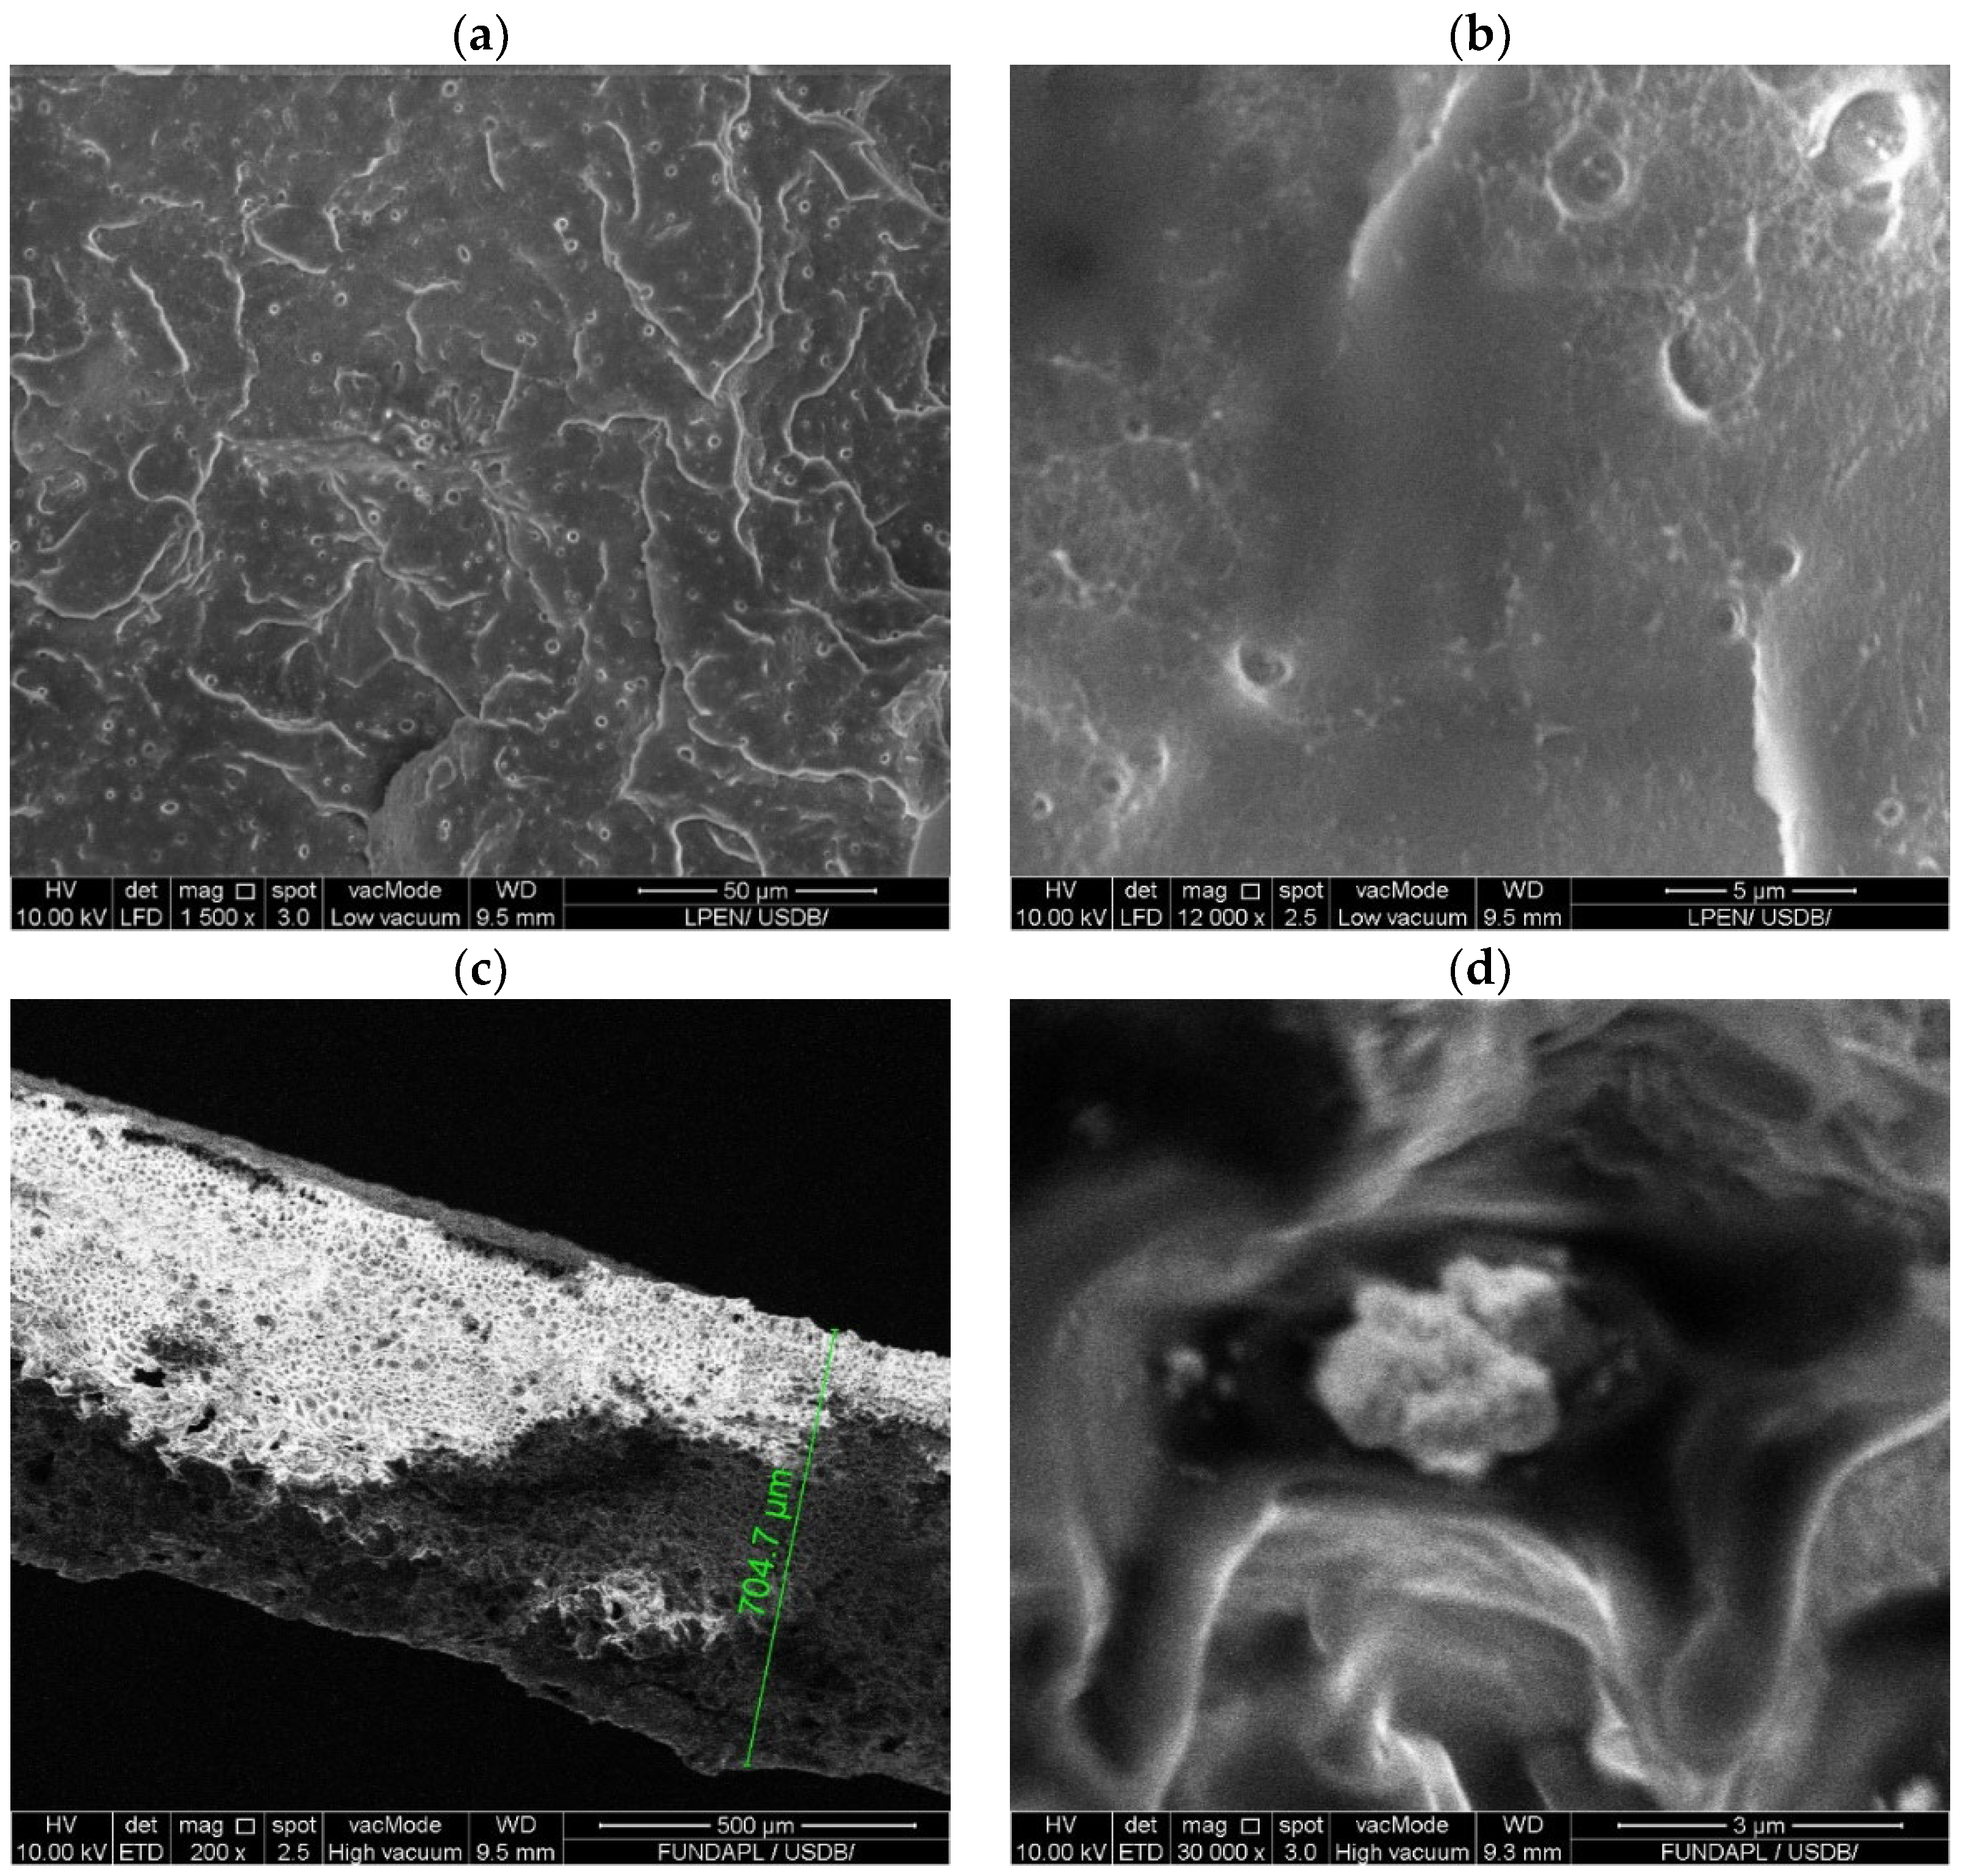
3.3. Morphological Structure of PLA/WO3 Nanocomposites

Figure 4 illustrates the structural evolution of PLA/WO3 nanocomposites with varying WO3 particle loadings. SEM cross-sectional images in Figure 4 reveal a honeycomb-like morphology across all samples, which becomes more pronounced as the WO3 content increases from 1 wt% to 7 wt%, causing the average pore size to expand from 14.8 µm to 24.92 µm and the pores to become more circular (Figure 4b,d,f,h) and (Table 1). This indicates that the WO3 particles act as structural modifiers, disrupting the polymer chains and creating larger voids within the matrix. Higher magnification images further show that the urchin-like WO3 particles tend to cluster within these pores, with more prominent agglomeration at higher concentrations. These morphological changes have significant implications for the nanocomposites’ mechanical properties, such as enhanced tensile strength and elasticity, while the increased porosity and surface area make them ideal for applications in filtration and catalysis. Figure 5 complements this by comparing Net PLA after solution casting with PLA/WO3 nanocomposites containing 3 wt% WO3 particles. The pure PLA exhibits a smooth surface, while the addition of WO3 particles introduces a honeycomb-like structure, consistent with higher WO3 loadings. The WO3 particles disrupt the polymer matrix, forming larger voids, and at higher magnifications, they are seen clustering within the pores, likely due to surface energy minimization. The uniform pore size and strong interactions between the PLA matrix and WO3 particles result in a pore network, similar to trends observed in ZIF-67 nanofillers, where increased filler concentration leads to structural modification and pore expansion [22].

3.4. Chemical Bonding in PLA/WO3 Nanocomposites

Figure 6 presents the FTIR spectra of PLA and PLA/WO3 nanocomposites, highlighting the interaction between the polymer matrix and WO3 particles. The FTIR spectrum of neat PLA shows characteristic peaks at 2939 cm−1 and 2999 cm−1, corresponding to the C-H stretching vibrations of asymmetric and symmetric modes in -CH3 and -CH groups [28]. Additional bands appear at 1454 cm−1 for CH3 stretching, 1362 cm−1 for C-H deformation, 1185 cm−1 for C-O stretching, 1089 cm−1 for O-C=O stretching, and a sharp peak at 1757 cm−1 for C=O stretching [41,42]. In the PLA/WO3 nanocomposites, no new peaks are observed, indicating that no new chemical bonds are formed between the PLA matrix and the urchin-like WO3 particles. This lack of new peaks suggests that interactions between PLA and the urchin-like WO3 particles are primarily physical rather than chemical [27,43,44]. Despite the absence of new chemical bonding, the spectra show increased intensity of existing absorption bands, indicating effective incorporation of the urchin-like WO3 particles into the PLA matrix. This incorporation enhances the matrix’s density and uniformity [45]. The slight shifts in absorption peaks may reflect interactions affecting PLA chain mobility, but the lack of stronger chemical bonding limits potential improvements in thermal and barrier properties [46].

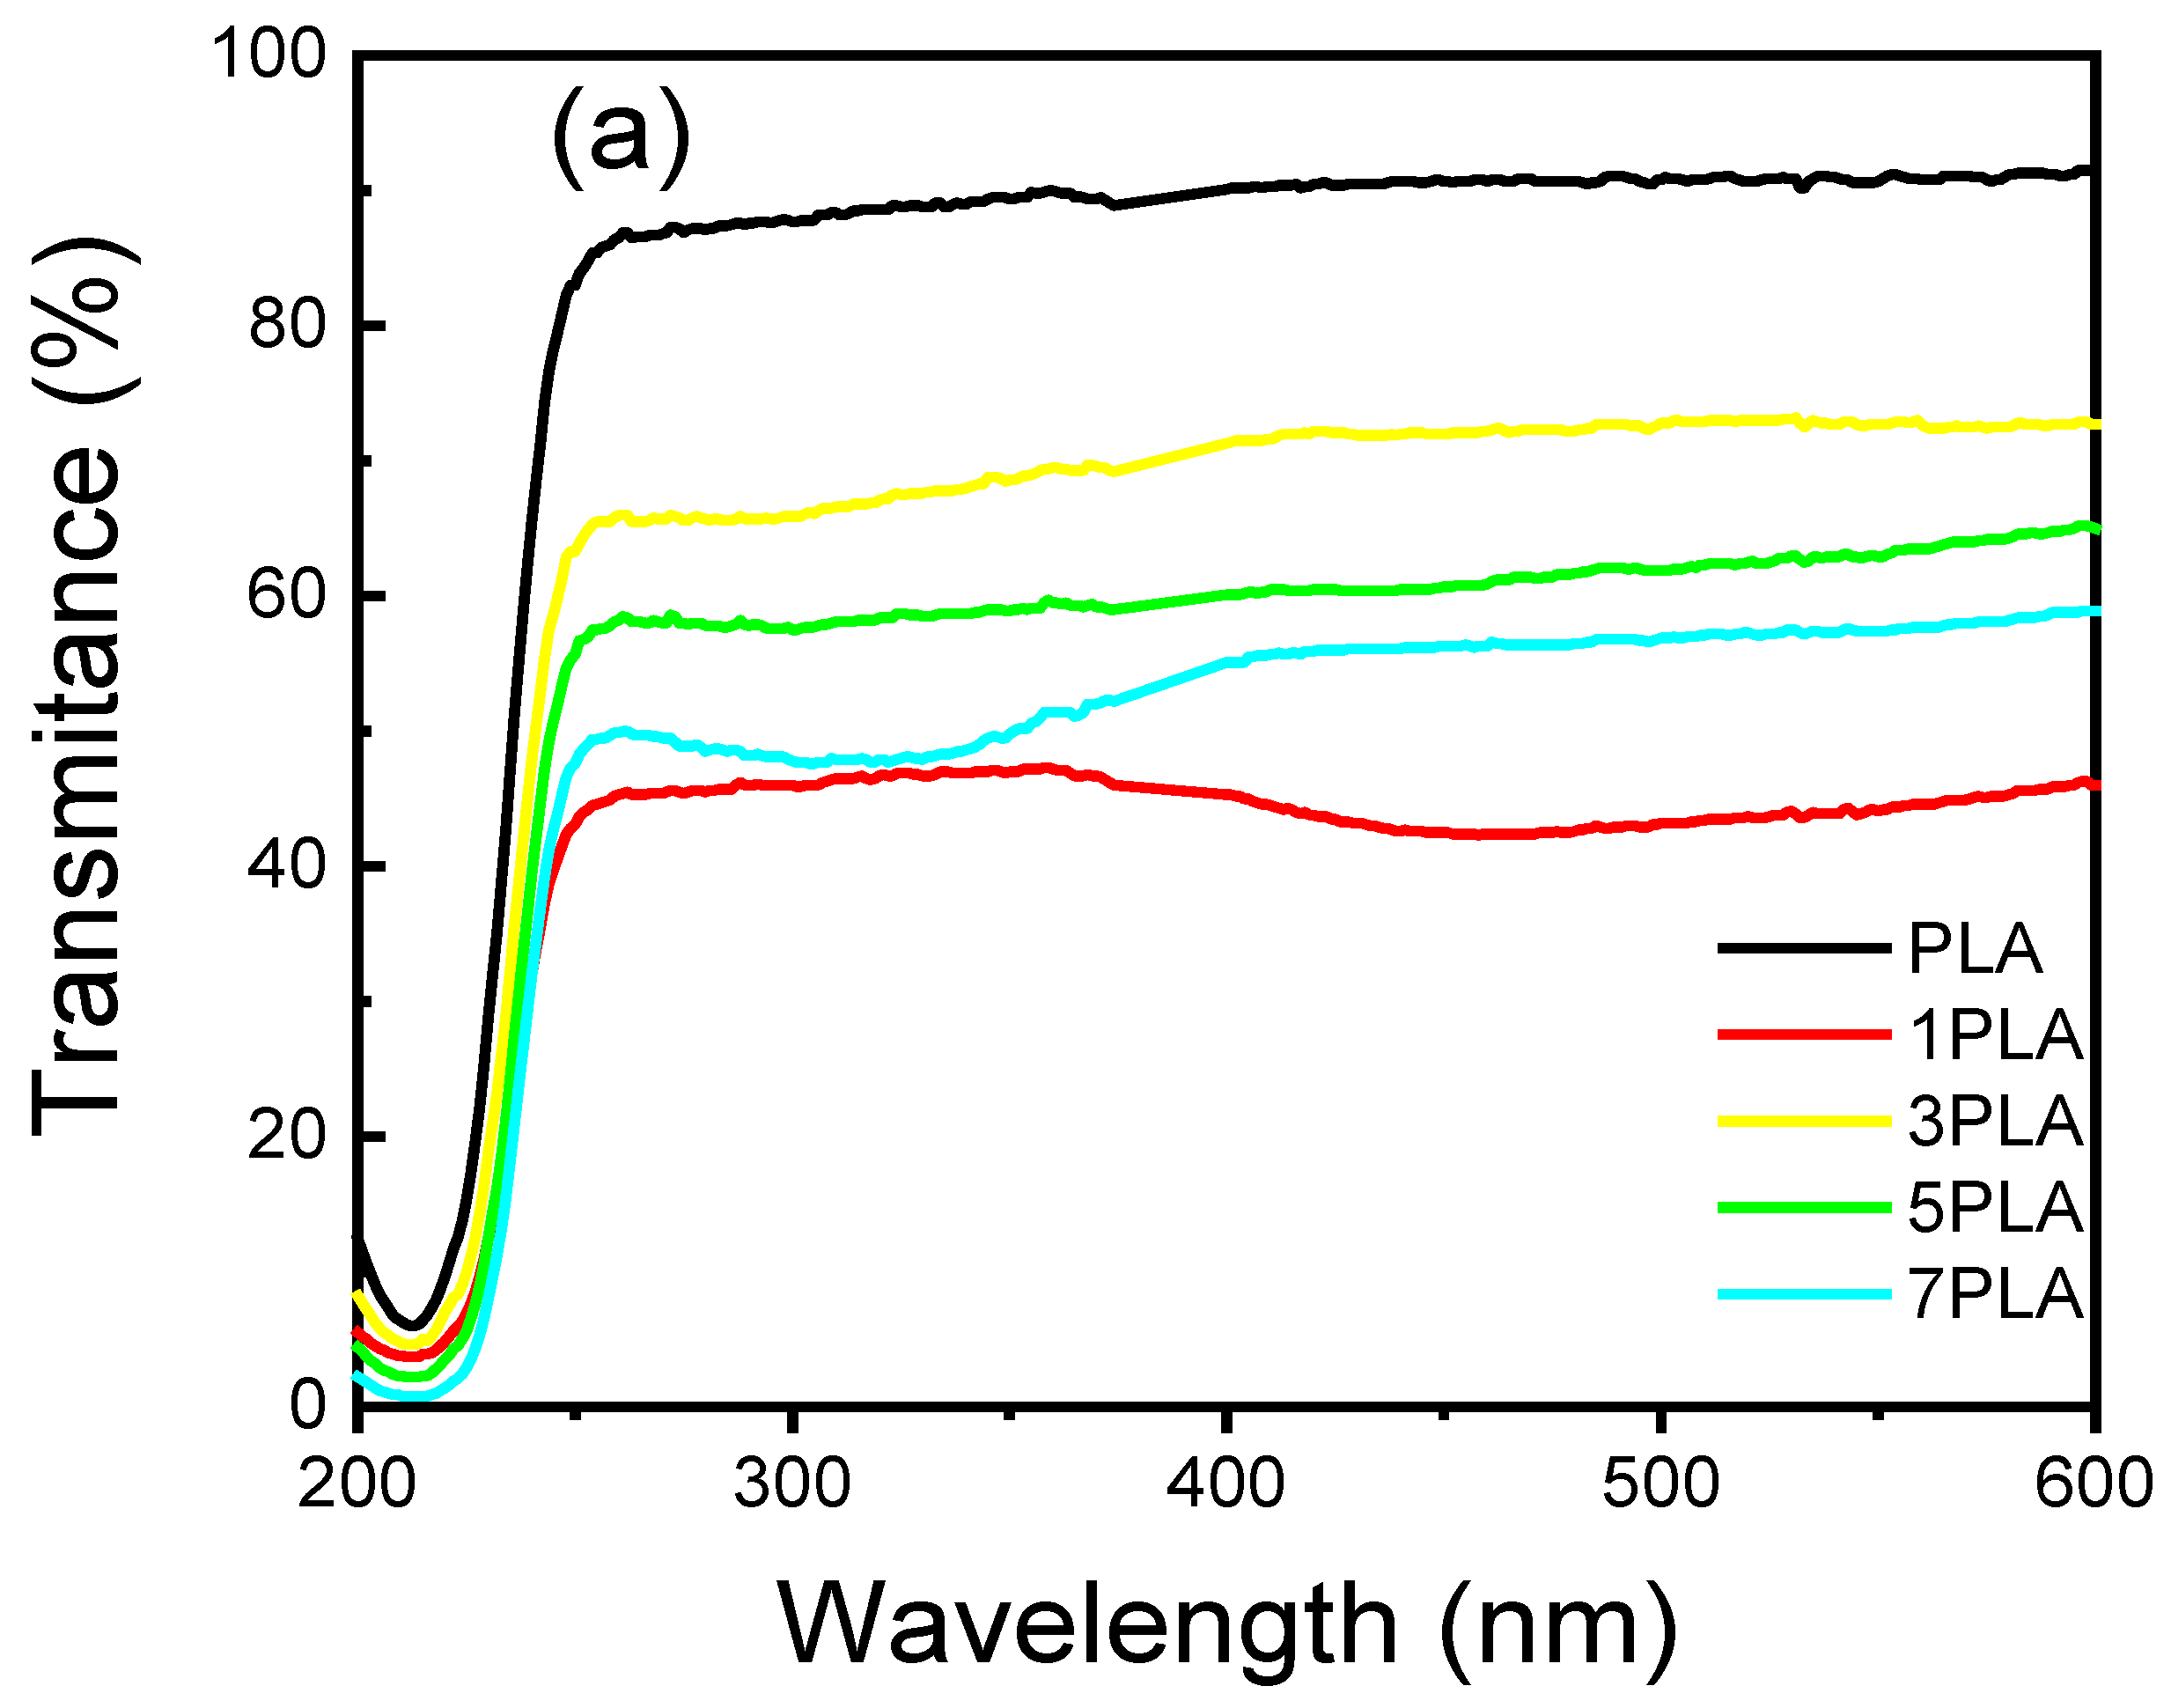
3.5. UV-Absorbance and Blocking of PLA/WO3 Nanocomposites

The UV-absorbance and UV-blocking capabilities of PLA/WO3 nanocomposites are essential for applications where light sensitivity can compromise the shelf life and quality of products [47]. The incorporation of the urchin-like WO3 particles into the PLA matrix significantly modifies the optical properties of the nanocomposites, as shown in Figure 7a. With the addition of WO3 particles, the UV-Vis transmittance of the nanocomposites decreases notably compared to neat PLA. This reduction is primarily due to the enhanced light scattering and absorption provided by the WO3 particles, which results in reduced transparency. At a wavelength of 600 nm, neat PLA exhibits a transmittance of 91%, whereas the 1 wt% PLA/WO3 nanocomposite (1PLA) shows a significantly reduced transmittance of 45%. This dramatic decrease indicates an effective distribution of the urchin-like WO3 particles within the polymer matrix, optimizing light-blocking efficiency. For the other composites, the transmittance values are 72% for 3PLA, 62% for 5PLA, and 58% for 7PLA, demonstrating an upward trend in UV-blocking capabilities with increased nanoparticle concentration (Table 1). This behavior can be attributed to the structural properties of the nanocomposites, including pore size and circularity, which influence the interaction between the matrix and incident light. The 1PLA sample, for instance, has a pore length of 14.01 µm, a pore width of 11.11 µm, and a pore circularity of 1.26, which likely contributes to its optimal light-blocking performance.
Figure 7b further illustrates that the introduction of the urchin-like WO3 particles substantially increases absorbance across the visible and UV ranges. The 1PLA sample exhibits a remarkable 45% increase in absorbance compared to neat PLA, underscoring its potential for protecting light-sensitive packaged products. The absorbance spectra reveal a significant rise in the UV region, particularly between 200 and 250 nm, which highlights the nanocomposites’ improved UV-blocking capabilities. This is likely due to the π-π* transitions in the ester groups of PLA, with the presence of WO3 particles altering electronic interactions within the matrix [48]. As shown in Figure 7c, the bandgap energies decrease with increasing the urchin-like WO3 particle loading: 5.39 eV for PLA, 5.15 eV for 1PLA, 5.21 eV for 3PLA, 5.22 eV for 5PLA, and 5.21 eV for 7PLA. The reduction of 0.2 eV observed for the 7 wt% WO3 particles suggests enhanced electronic coupling within the composite. This aligns with findings from Shanshool et al. [49], who reported similar reductions in bandgap energies in various polymer matrices with increased nanofiller concentrations. The optical characteristics of PLA/WO3 nanocomposites, particularly their UV-blocking efficiency, make them promising candidates for applications requiring improved light protection and thermal stability. The data presented in Table 1 reinforce the importance of the urchin-like WO3 particle loadings and distribution in achieving desired optical properties, offering a pathway for tailoring nanocomposites to specific industrial needs.

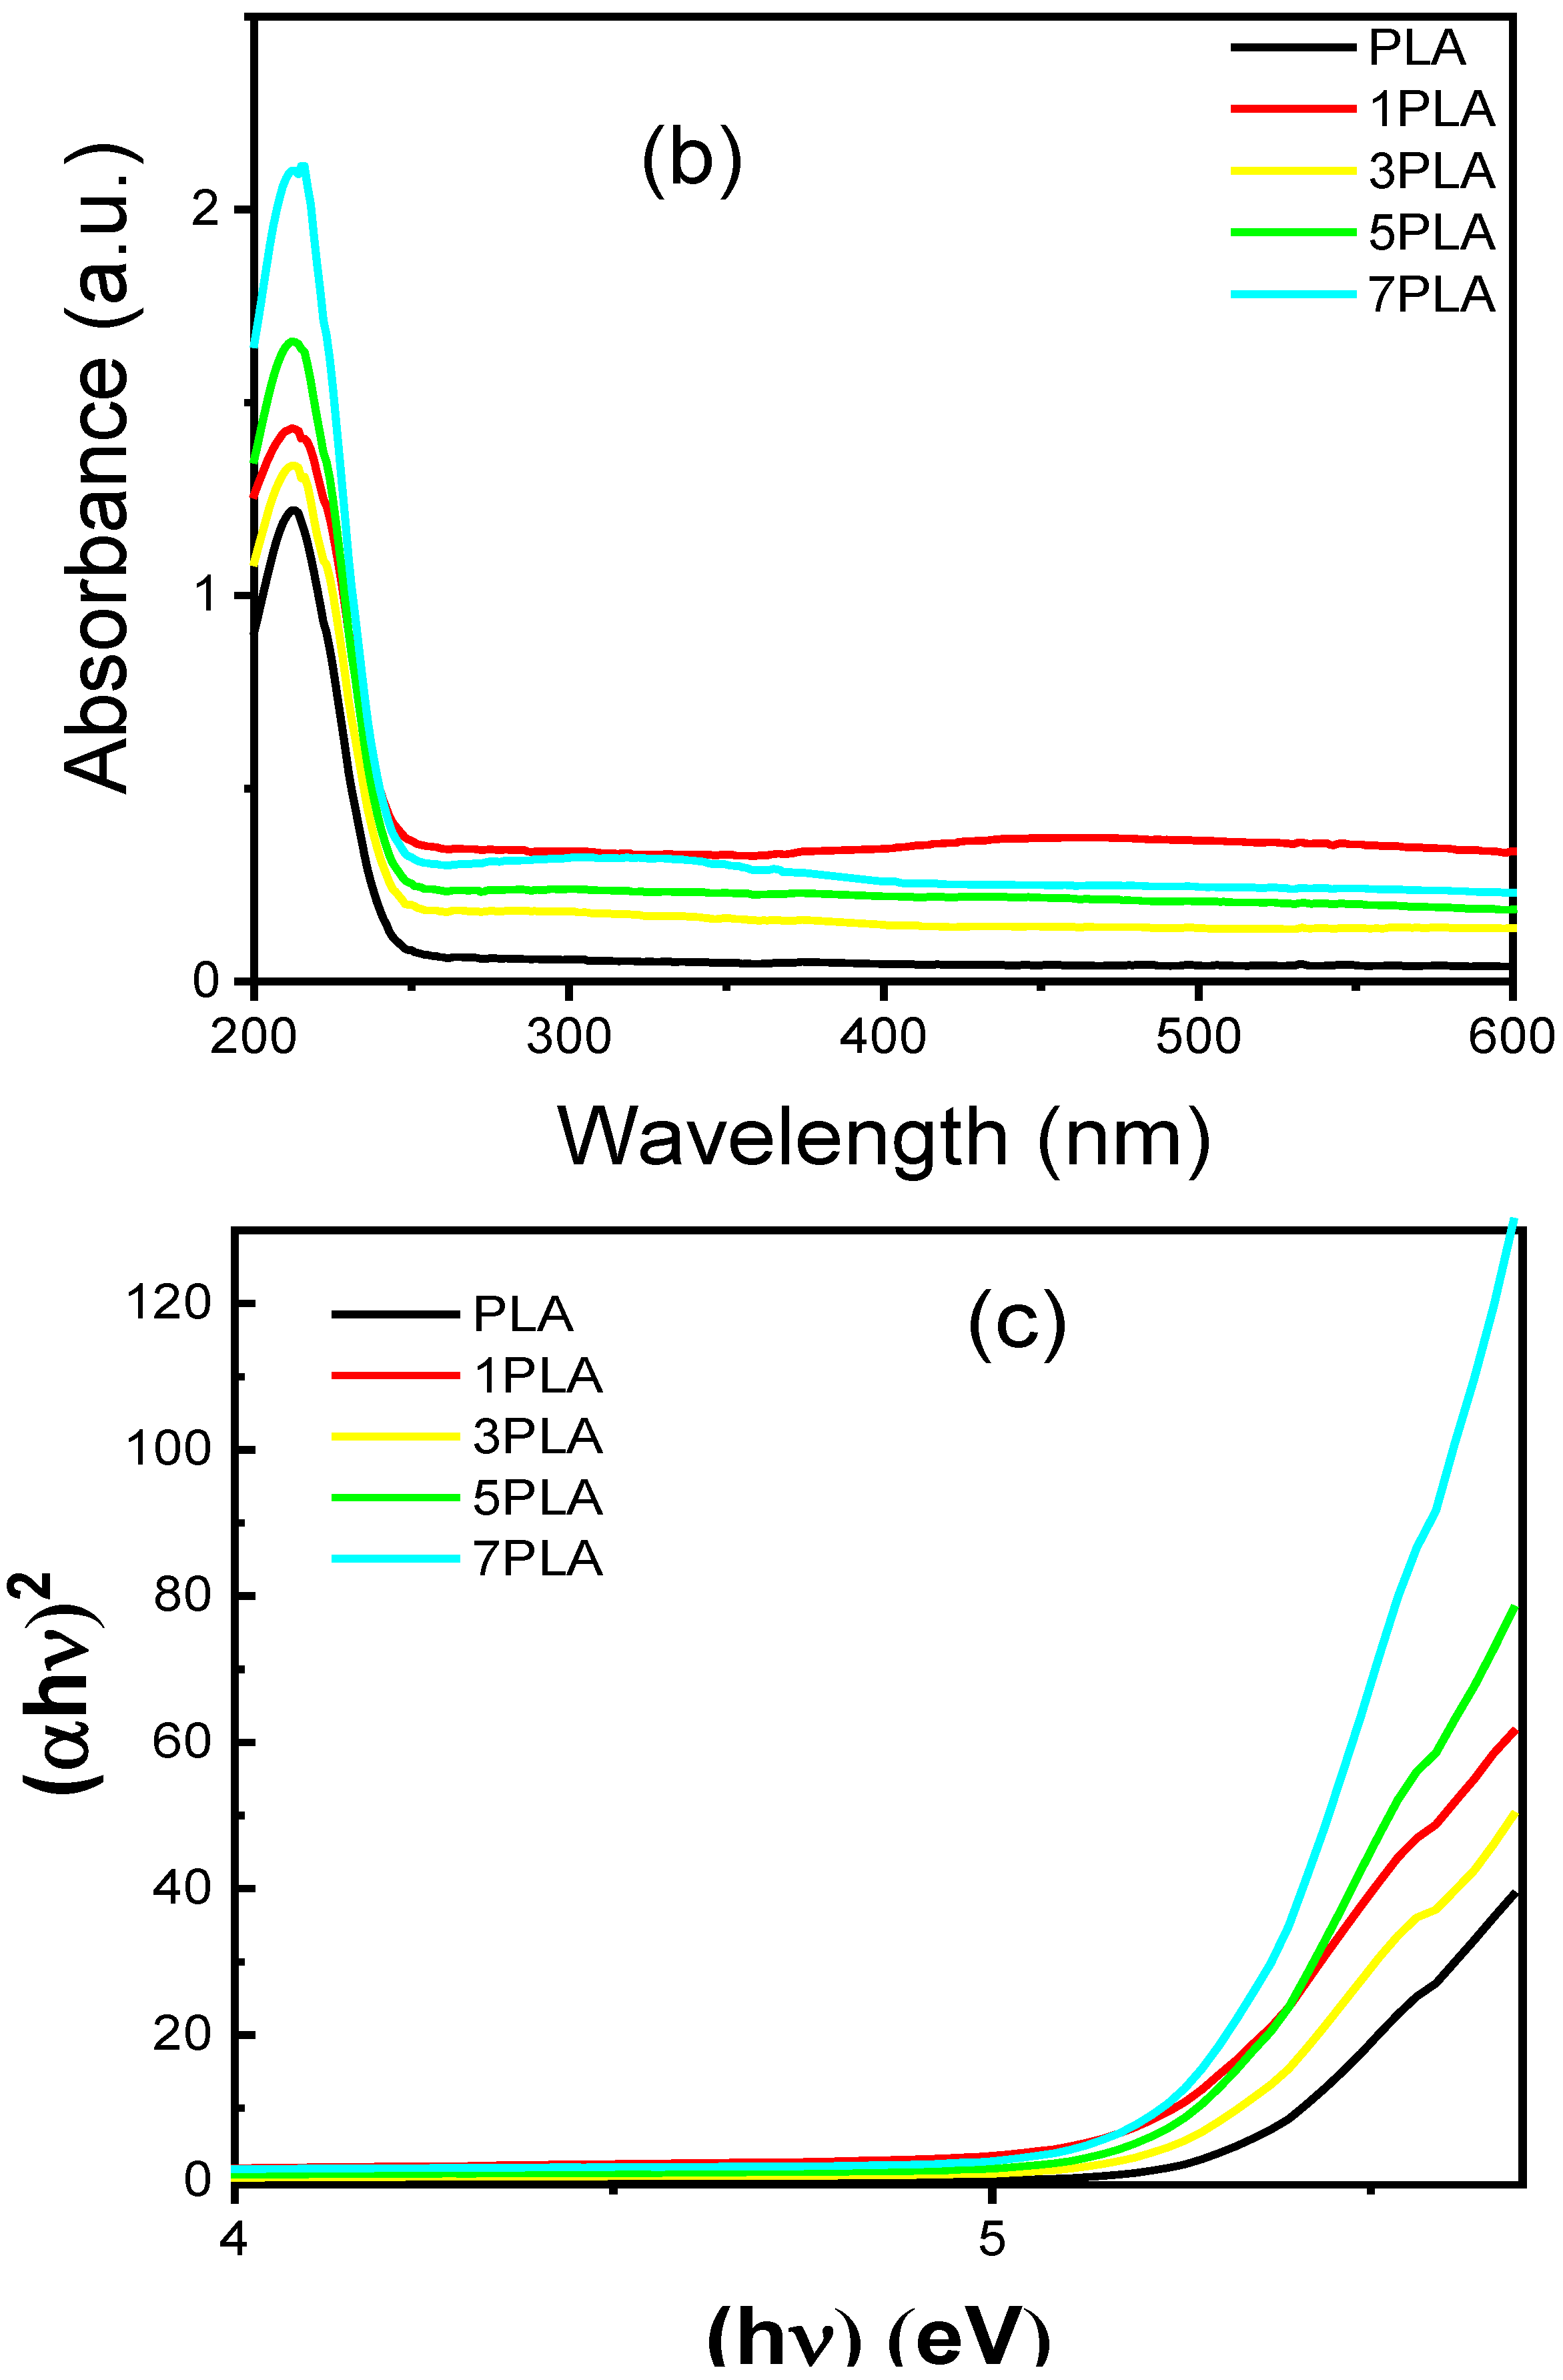
3.6. Thermal Stability of PLA/WO3 Nanocomposites

TGA analysis was used to evaluate the thermal stability of neat PLA and PLA/WO3 nanocomposites, as shown in Figure 8 and Table 2. Neat PLA exhibited an initial weight loss of 4 wt% between 40 and 120 °C, which was higher compared to PLA/WO3 nanocomposites (1.5 wt%). This reduction in early weight loss in the nanocomposites can be attributed to the porous structure facilitating more efficient solvent removal. The initial weight loss in neat PLA is likely due to residual solvents from the casting process or absorbed moisture [50]. Incorporating urchin-like WO3 particles significantly enhances the thermal stability of the PLA nanocomposites, with the WO3 particles functioning as reinforcing agents that limit polymer chain mobility and act as thermal barriers, thereby slowing heat transfer and reducing the risk of thermal degradation [27,43]. Increased WO3 particle loadings (1–5 wt%) raise the temperature at which 5%, 50%, and 95% weight loss occurs, demonstrating enhanced thermal resistance. For example, the T5% for neat PLA is 269 °C, while it rises to 281–282 °C for 1–5 wt% WO3 nanocomposites, indicating a clear improvement in thermal stability. However, at 7 wt% WO3, T5% decreases slightly to 268 °C, suggesting that excessive WO3 may compromise thermal stability. This trend is similarly reflected in the T50% values, which decrease from 322 °C for neat PLA to 304 °C for 7 wt% WO3, indicating that higher WO3 loadings may catalyze degradation by introducing defects through aggregation. The final degradation temperature (T95%) and maximum degradation rate (Tmax) also show this pattern, with T95% increasing to 389 °C for 1 wt% WO3 but dropping to 326 °C for 7 wt% WO3. Likewise, Tmax decreases from 331 °C for neat PLA to 310.4 °C for 7 wt% WO3. These findings suggest that while lower WO3 concentrations improve thermal stability, higher concentrations may initiate degradation pathways, consistent with previous findings on ZnO nanofillers in PLA by Murariu et al. [51].

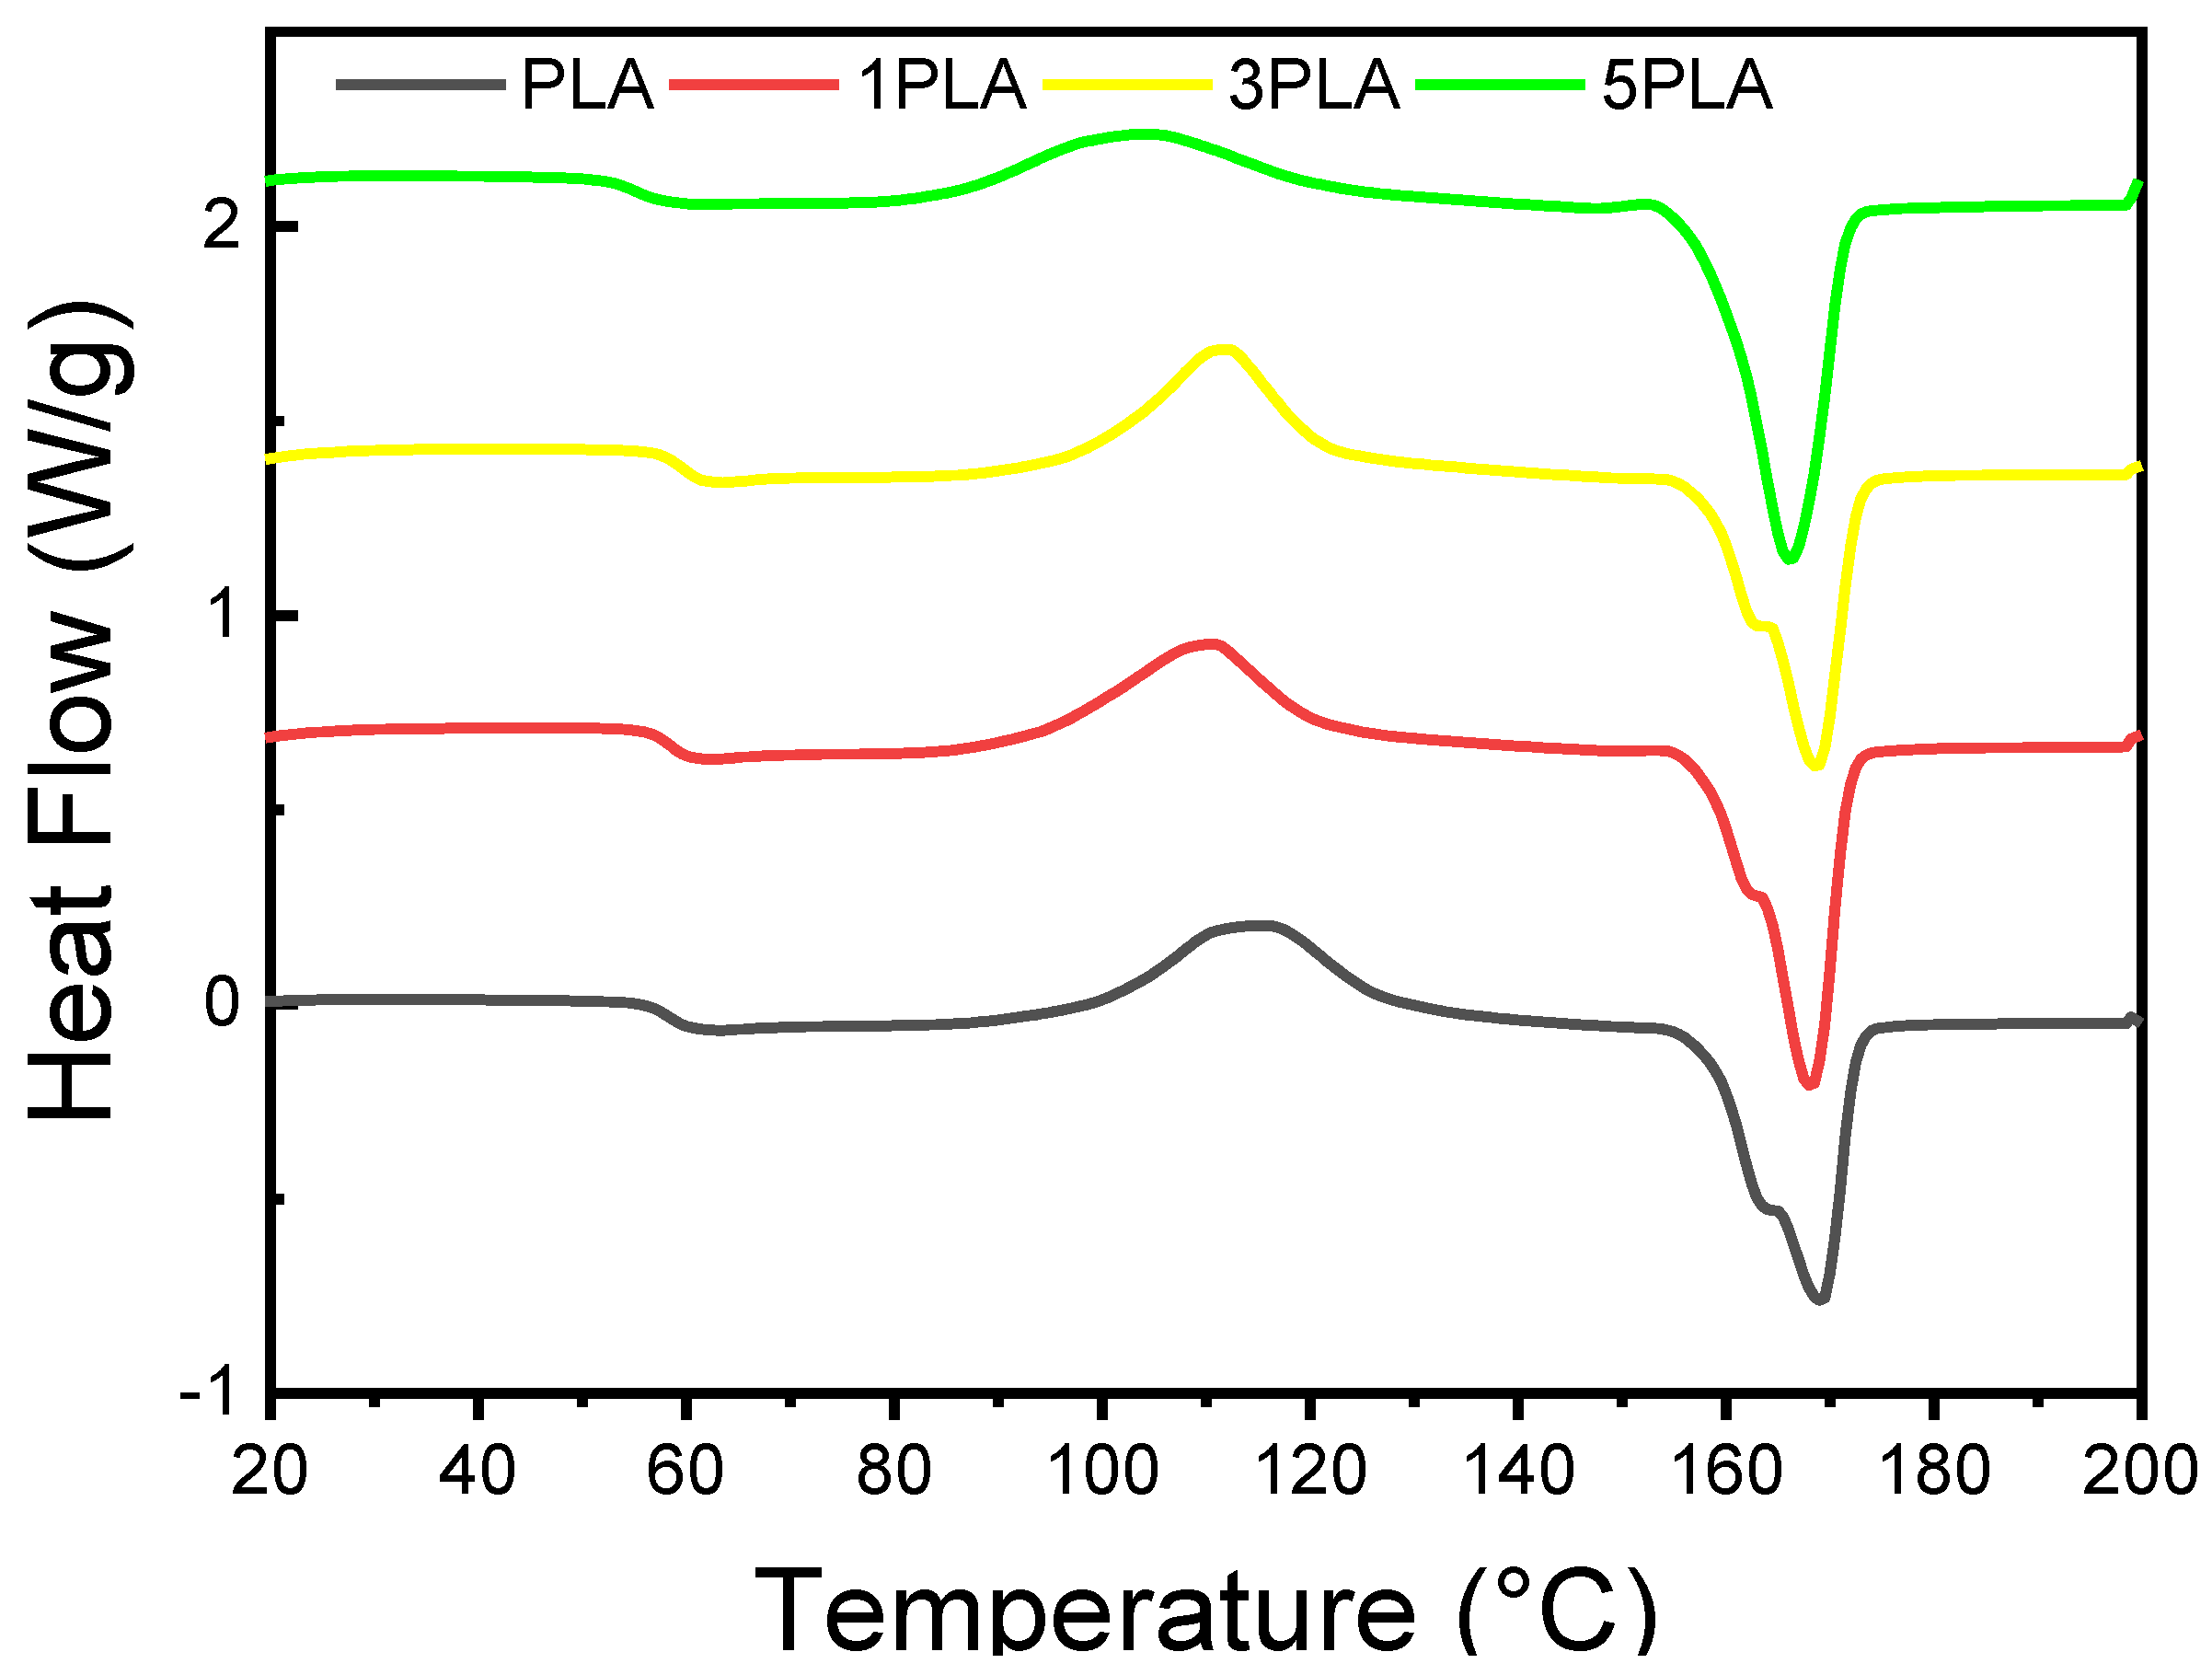
3.7. DSC Analysis of PLA/WO3 Nanocomposites

DSC was used to assess the impact of urchin-like WO3 particles on the thermal properties of PLA/WO3 nanocomposites, focusing on key parameters such as glass transition temperature (Tg), cold crystallization temperature (Tc), melting temperatures (Tm1 and Tm2), and crystallization rate (χc). The DSC thermograms, presented in Figure 9, indicate that the addition of WO3 particles leads to significant changes in these thermal properties. For neat PLA, the DSC profile and Table 3 show a Tg of 58 °C, a Tc of 115 °C, and two melting temperatures (Tm1 at 164 °C and Tm2 at 169 °C), suggesting the presence of different crystalline phases within the polymer matrix [52,53,54]. When 1 wt% WO3 (1PLA) is loaded, Tg increases slightly to 59 °C, indicating a minor plasticizing effect, and Tc shifts to 112 °C. The melting temperatures slightly decrease to 163 °C for Tm1 and 168 °C for Tm2. These changes suggest that the WO3 particles are affecting the thermal properties by promoting better nucleation and modifying the crystallization behavior.
At higher WO3 concentrations, further alterations are observed. For the 3 wt% WO3 (3PLA) sample, Tg increases to 58 °C, while Tc decreases to 110 °C, and the melting temperatures adjust to 162 °C (Tm1) and 168 °C (Tm2) (Table 3). The crystallization rate (χc) rises to 42.86%, reflecting enhanced nucleation effects due to WO3 particles. In contrast, for the 5 wt% WO3 (5PLA) nanocomposites, Tg decreases to 55 °C, and Tc further decreases to 104 °C. The melting shoulder (Tm1) disappears, indicating a more homogeneous melting process, with the remaining melting temperature (Tm2) at 166 °C [55,56]. The crystallization rate peaks at 50.53%, demonstrating effective nucleation and higher crystallinity. These results underscore the significant role of WO3 particles in altering PLA’s thermal properties, enhancing nucleation, and modifying both glass transition and melting behaviors.

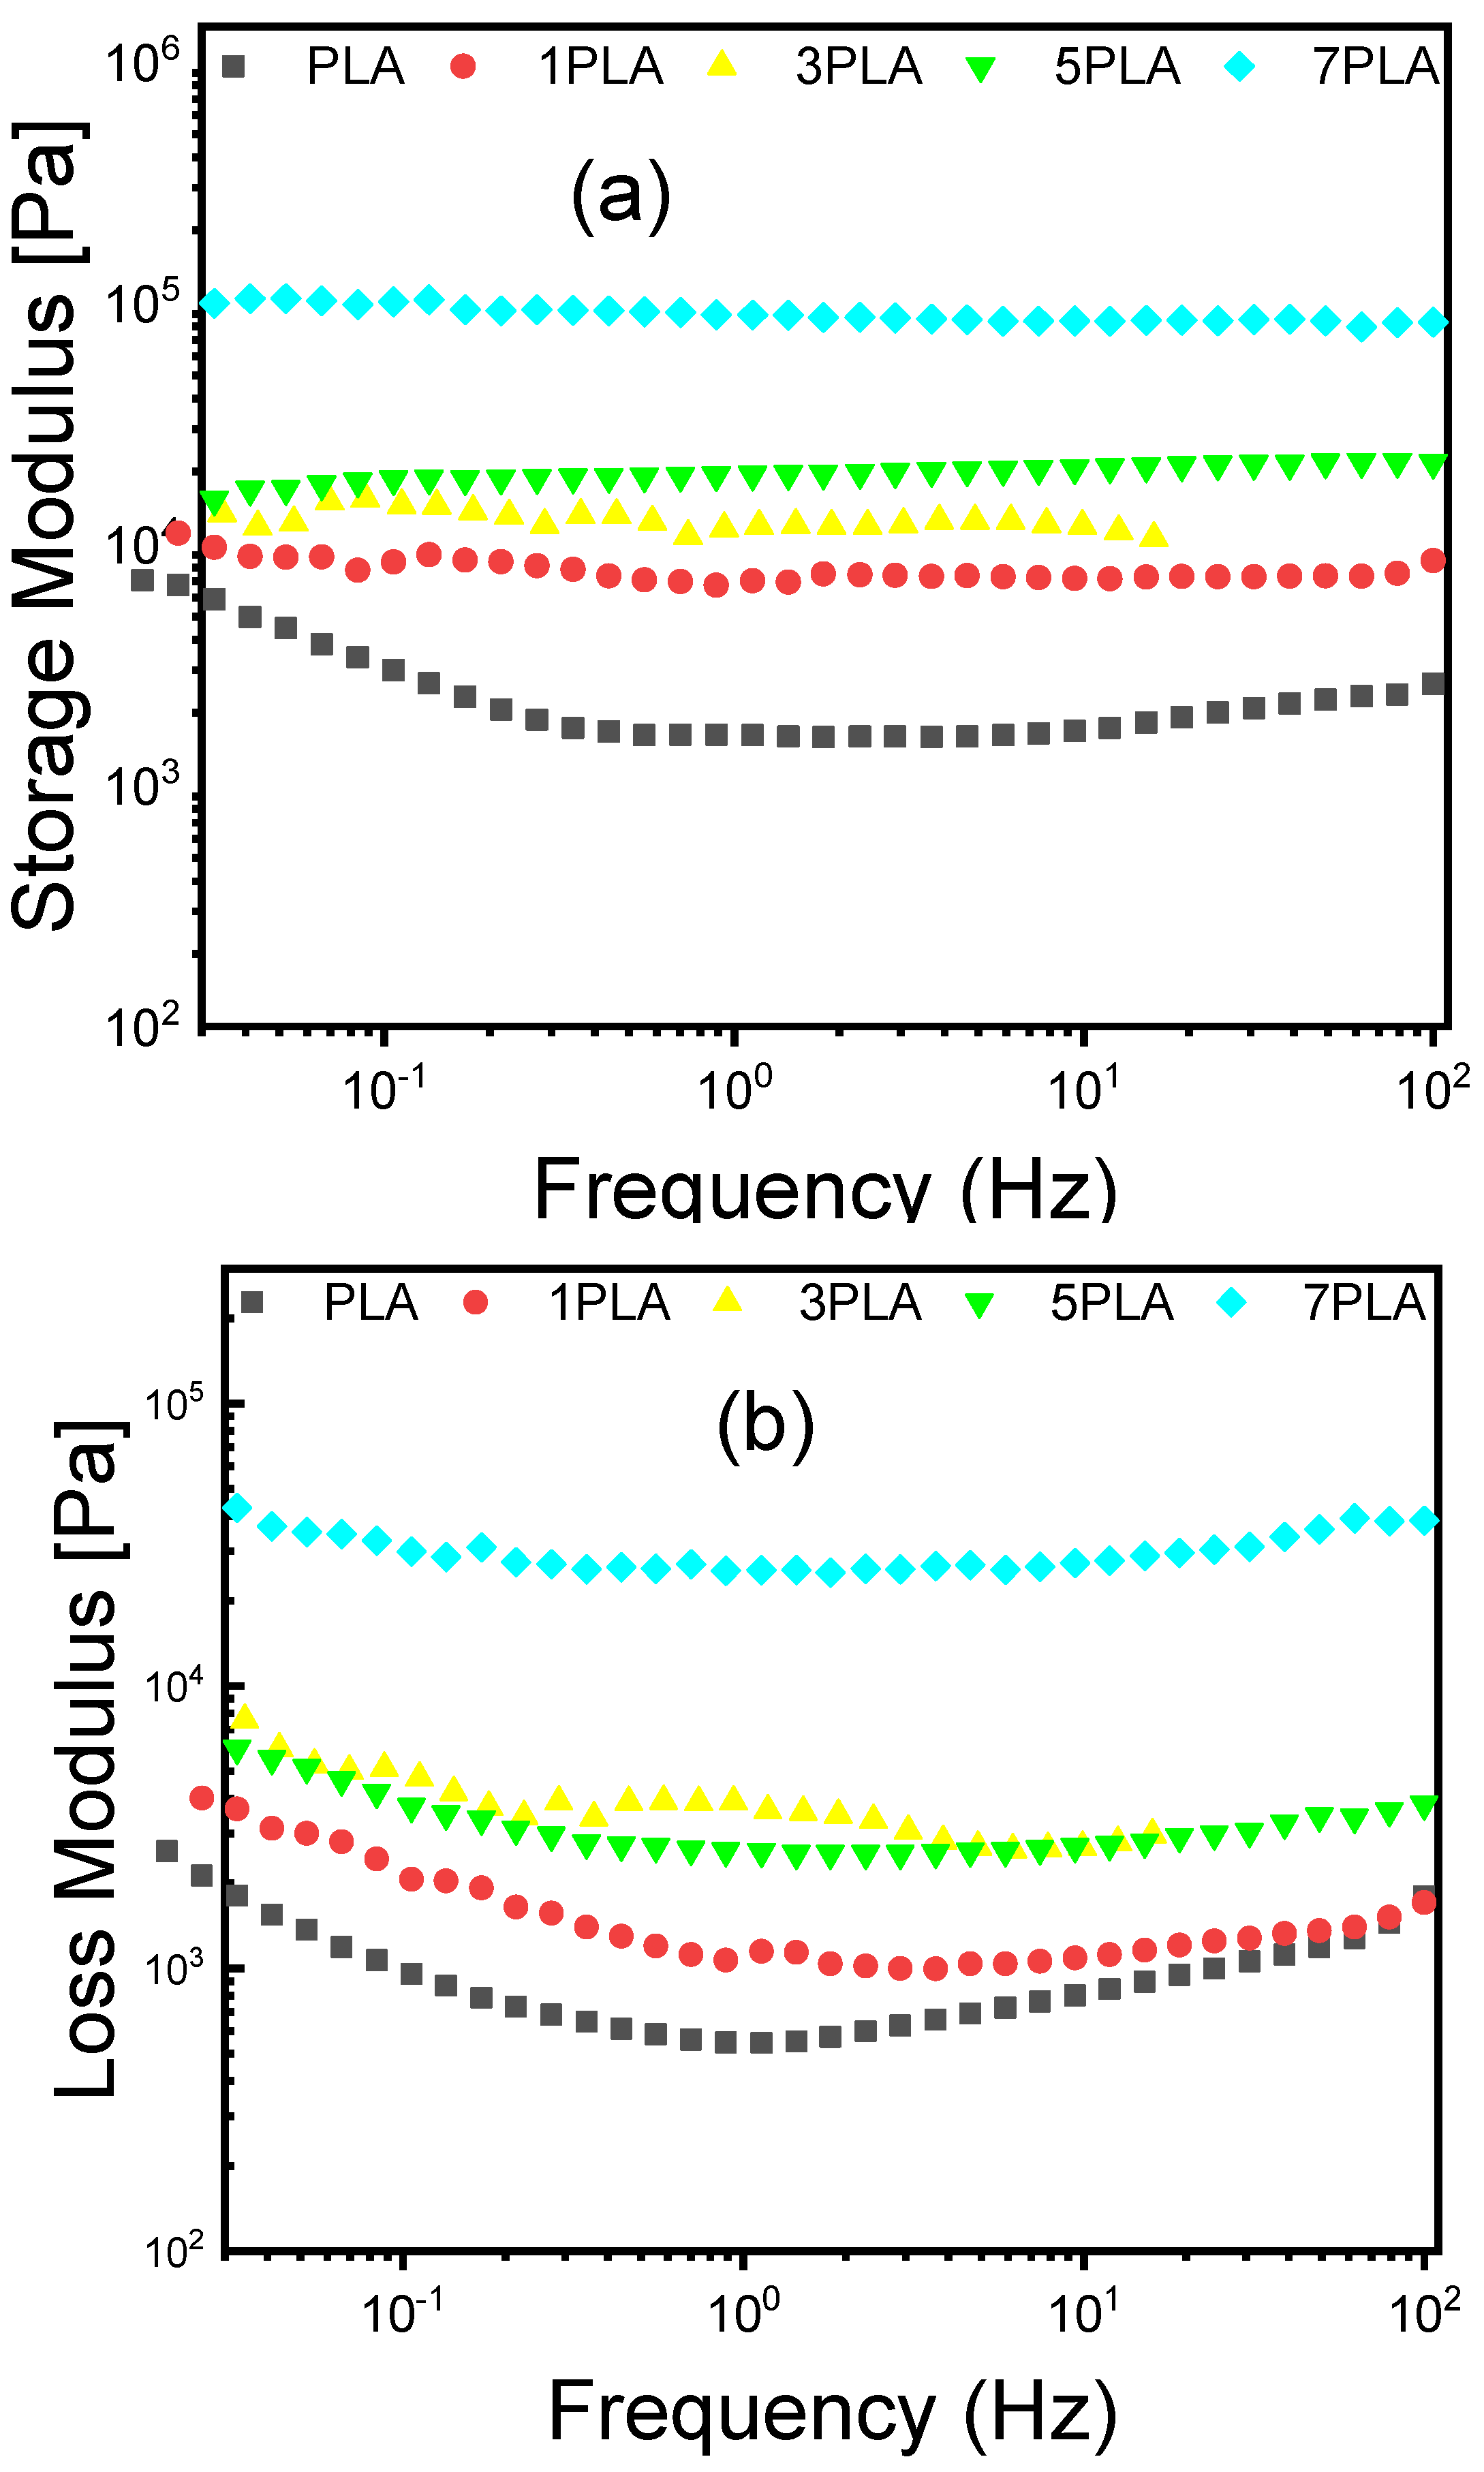
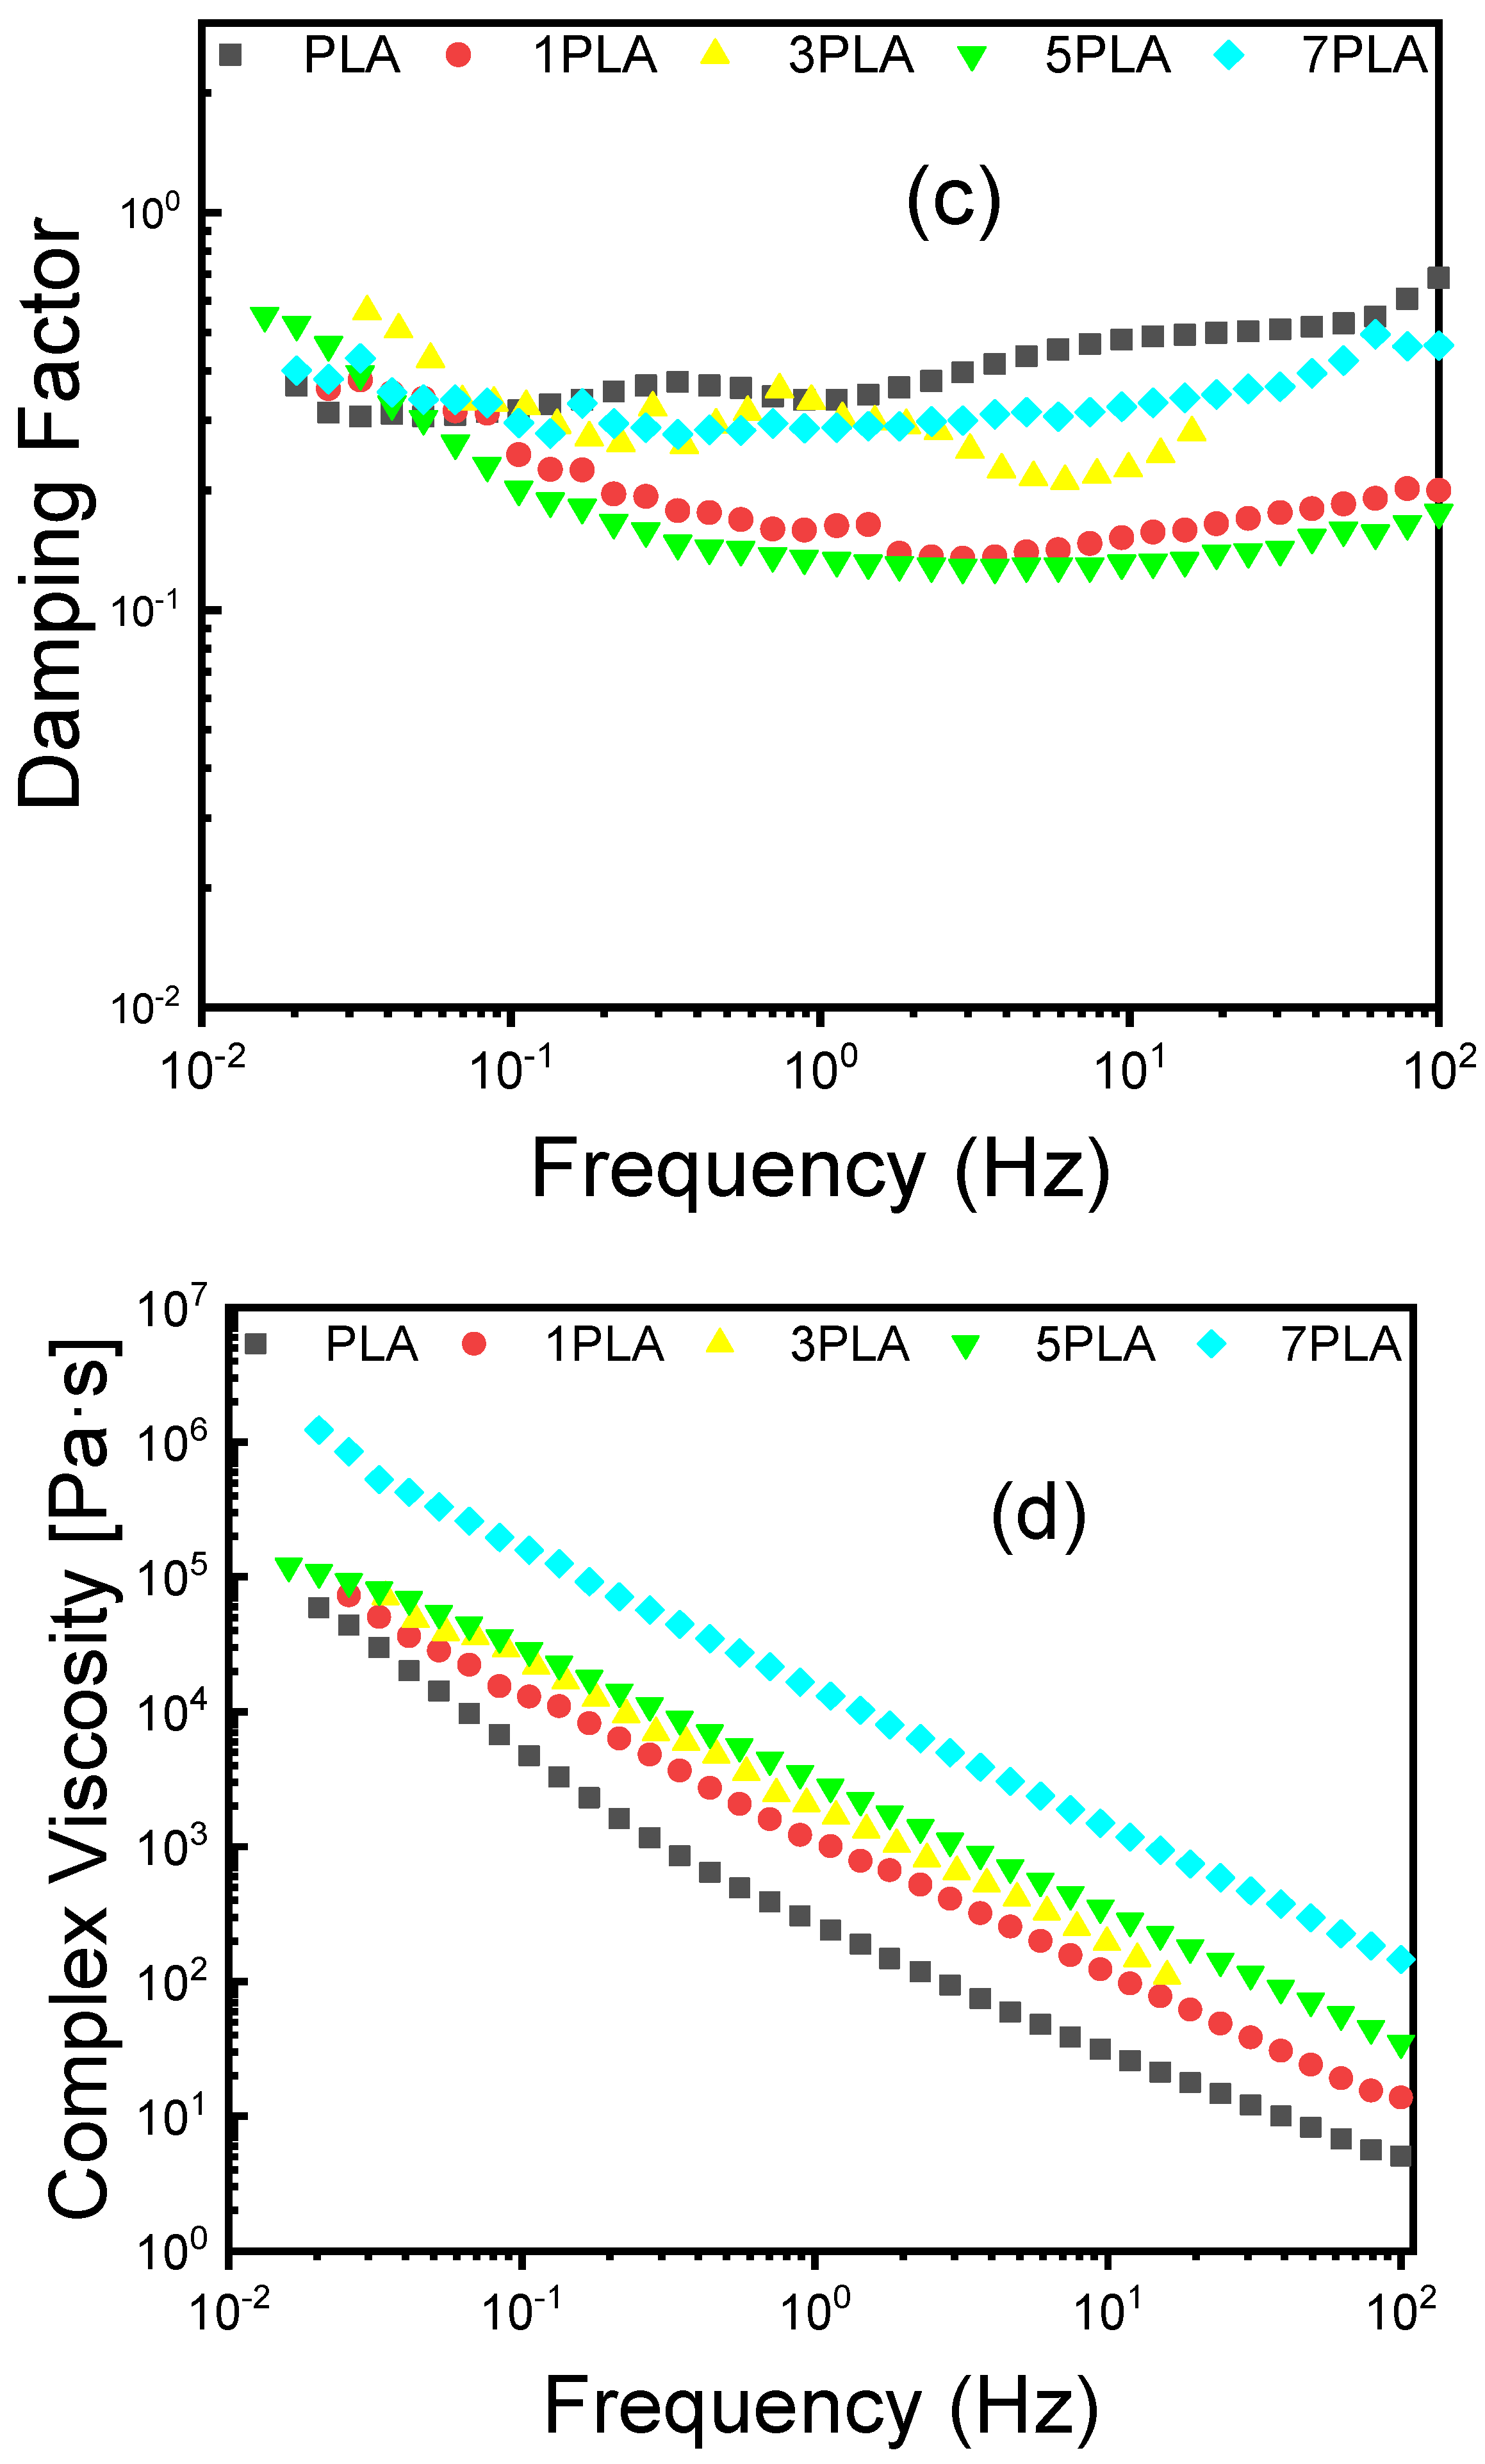
3.8. Rheological Properties of PLA/WO3 Nanocomposites

Rheological properties are crucial for understanding the processing and performance of nanocomposites. The effects of WO3 particles on PLA were assessed through frequency- and temperature-dependent rheological tests. The results, shown in Figure 10, provide insights into the storage modulus (G′), loss modulus (G″), damping factor (tan δ), and complex viscosity.
Figure 10a,b illustrate that both G′ and G″ exhibit minimal frequency dependence over a broad range of frequencies, indicating that the nanocomposites form a well-structured 3D network [57]. For neat PLA, G′ is equal to 8.42 × 10³ Pa, which increases to 1.01 × 10⁵ Pa at 7 wt% WO3. This substantial increase in G′ with higher WO3 particle loading suggests that the nanostructured particles enhance the gel network’s rigidity and strength. The higher storage modulus signifies that the PLA/WO3 nanocomposites have improved mechanical stability and resistance to deformation. This enhancement can be attributed to the effective reinforcement provided by the WO3 particles, which interact strongly with the PLA matrix and improve its structural integrity.
In contrast, the loss modulus (G″), which represents the energy dissipation due to viscous effects, also increases with the concentration of WO3 particles (Figure 10c). For 1PLA sample, G″ is 2.07 × 10³ Pa, whereas it rises to 2.99 × 10⁴ Pa for 7PLA. This increase in G″ reflects higher frictional forces and energy dissipation within the material as more WO3 particles are introduced [58,59]. Enhanced frictional effects contribute to the improved mechanical properties and toughness of the nanocomposites. The minimal frequency dependence of both G′ and G″ indicates that the nanocomposites exhibit stable rheological behavior across different frequencies, which is indicative of a robust and consistent network structure. The damping factor (tan δ) (Figure 10c) can also be used to evaluate the different viscoelastic behavior of the nanocomposites [60,61]. In the frequency range studied, the damping factor is less than 1 (Figure 10c and Table 4), which indicates that the elastic component (G′) of the pure polymer and nanocomposites was higher than the viscous modulus (G″), suggesting the gels showed solid-like behavior [62].
Figure 10d demonstrates that the complex viscosity of the nanocomposites exhibits pronounced shear-thinning behavior. The complex viscosity increases by a factor of 4 as the frequency decreases from 100 Hz to 0.01 Hz. For instance, at 0.1 Hz, the complex viscosity of the 1PLA is 1.3 × 10⁴ Pa·s, while it increases to 1.58 × 10⁵ Pa·s for the 7PLA (Table 4). This increase in complex viscosity with higher WO3 particle loading suggests enhanced network formation and consolidation within the PLA matrix. The shear-thinning behavior is characteristic of materials where the complex viscosity decreases with increasing shear rate, which is typical of gels and suspensions with a well-developed network structure. The presence of WO3 particles increases the material’s resistance to flow, contributing to a more structured and stable gel network. This effect is attributed to the interactions between the WO3 particles and polymer chains, which create a more complex internal network that affects the material’s flow behavior [63].

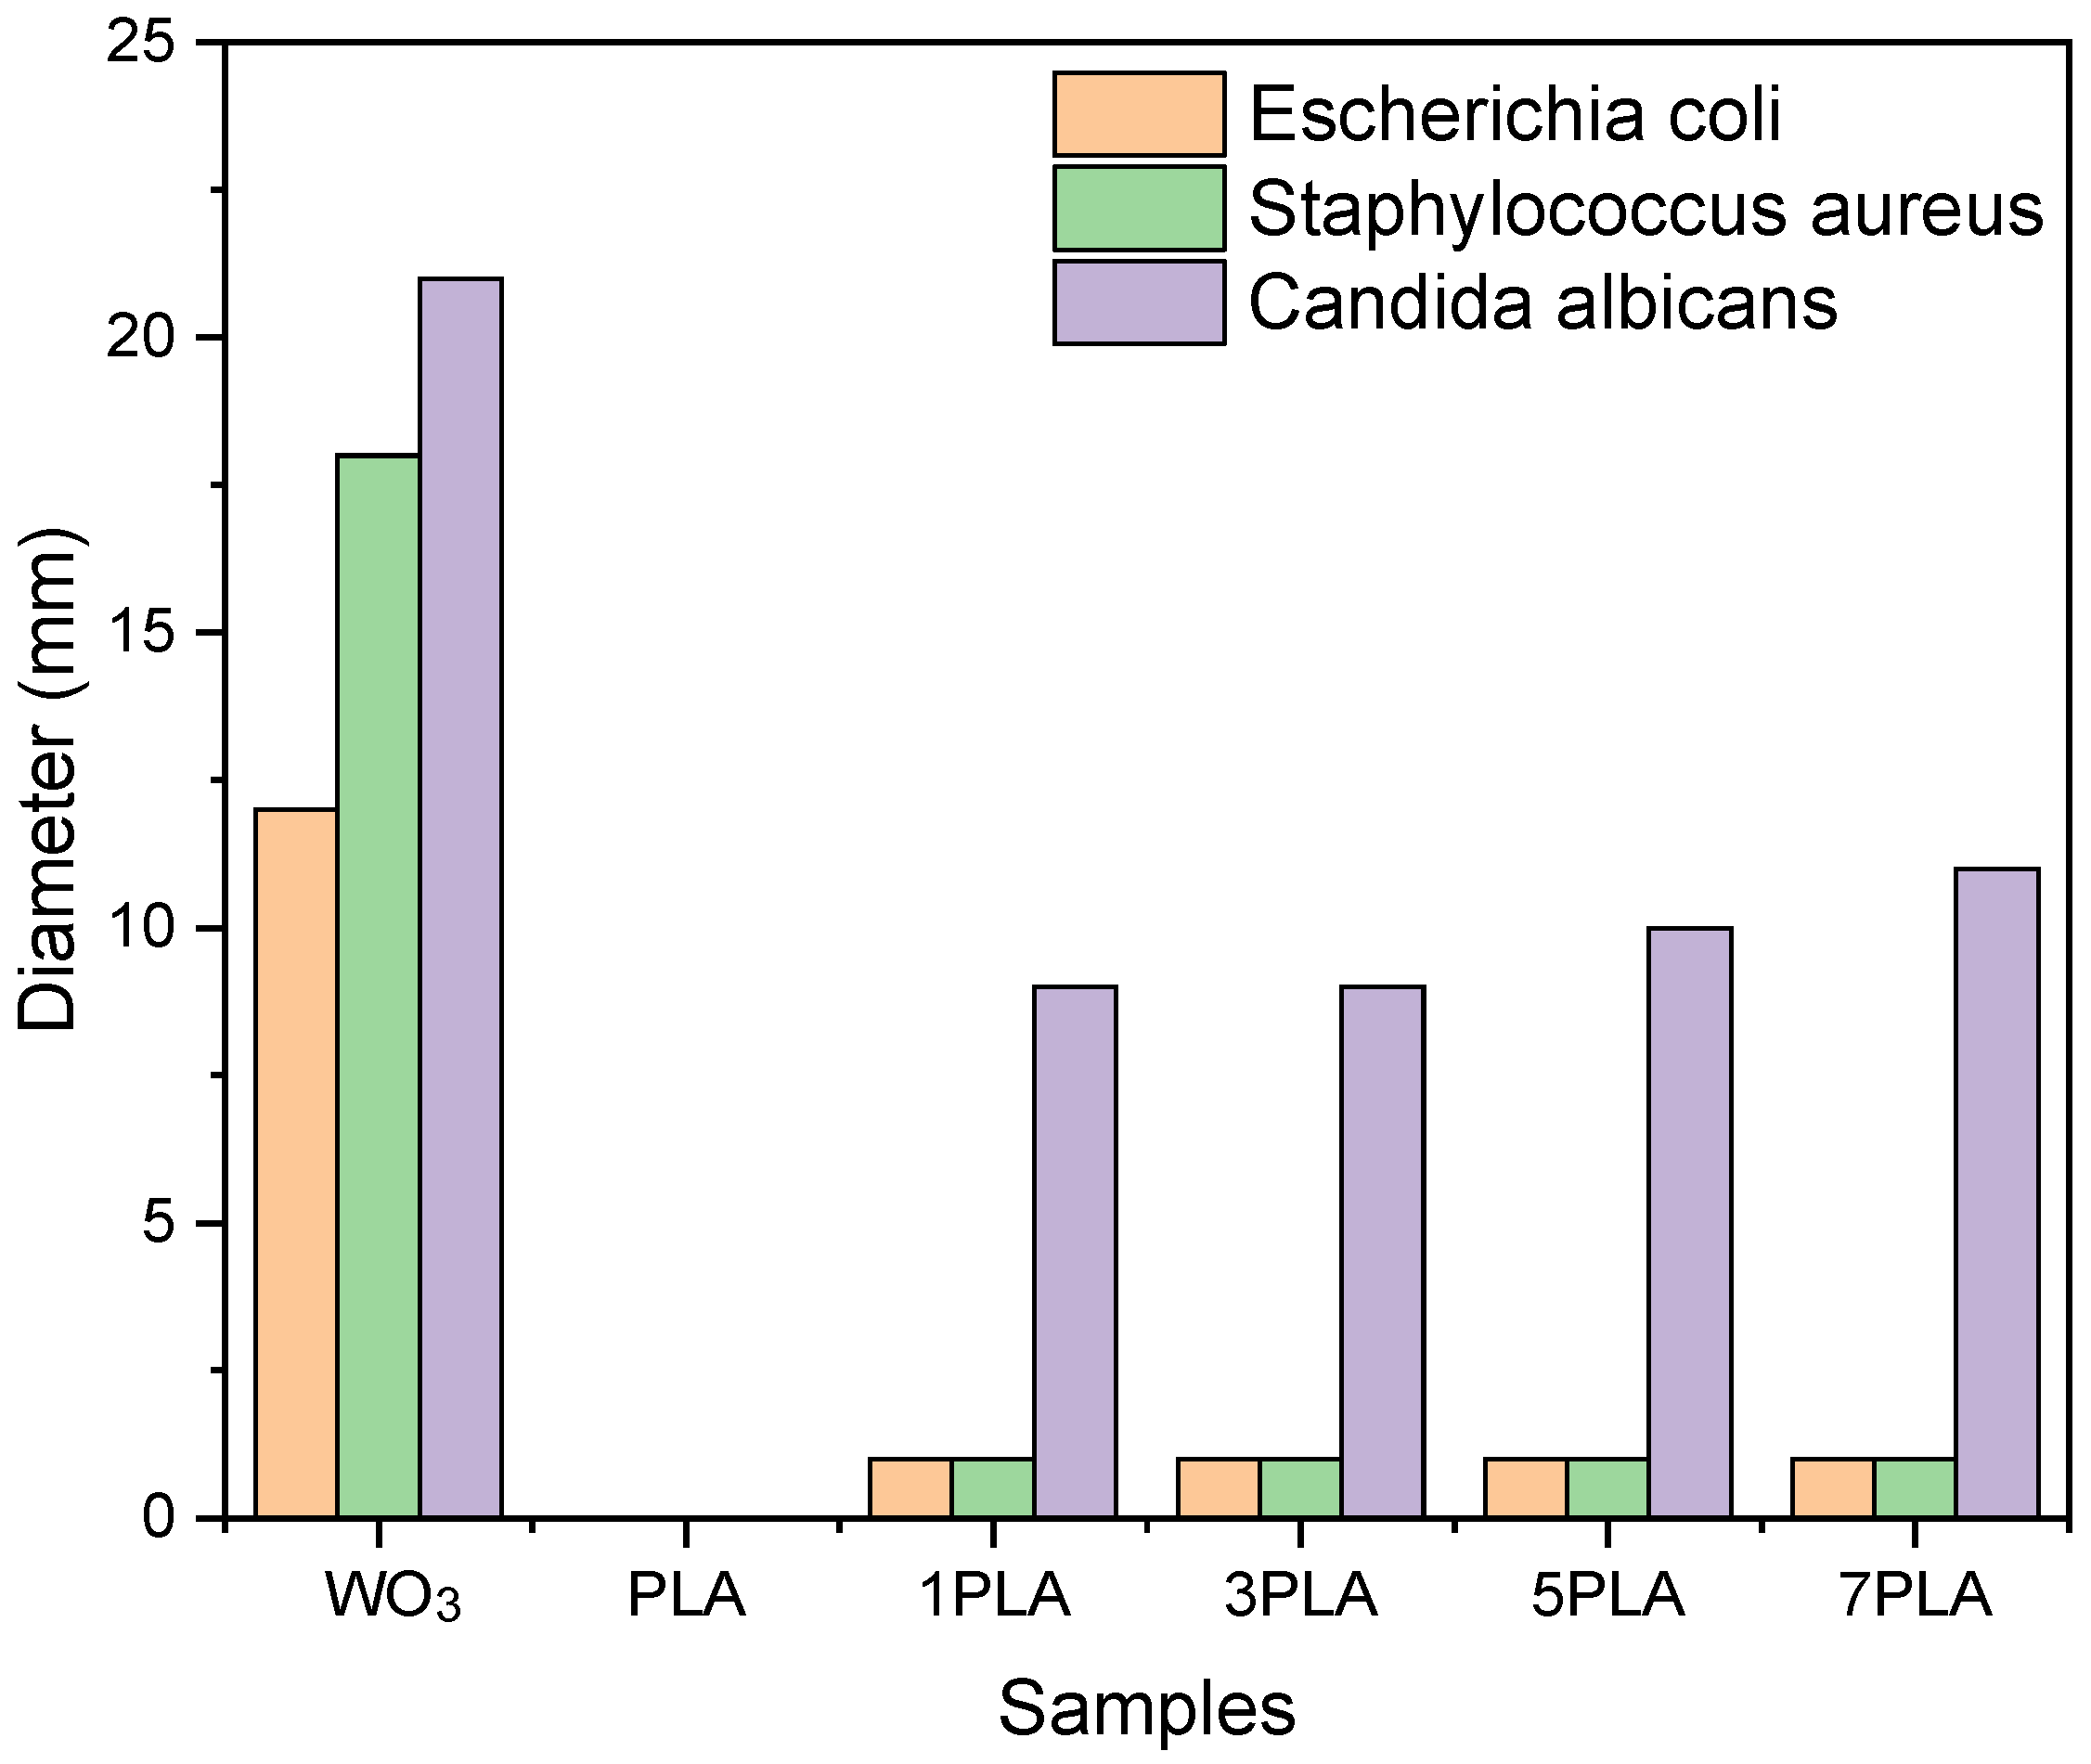
3.9. Antimicrobial Activity of PLA/WO3 Nanocomposites

The antimicrobial efficacy of PLA/WO3 nanocomposites was tested against Escherichia coli, Staphylococcus aureus, and Candida albicans. The assay mixed 5 mL of brain heart infusion broth (BHIB) with 0.1 g of each sample: PLA/WO3 nanocomposites, net PLA, and WO3 particles. PLA and WO3 served as controls to assess their individual antimicrobial effects. PLA alone showed no inhibition, confirming its lack of inherent antimicrobial properties, while the nanocomposites demonstrated enhanced activity [64,65,66]. This highlights the need for functional additives like WO3 particles to impart antimicrobial capabilities to PLA. However, the PLA/WO3 nanocomposites (1PLA, 3PLA, 5PLA, and 7PLA) did not exhibit inhibition zones against E. coli or S. aureus, suggesting resistance of these bacterial strains to the WO3 particles at the tested concentrations. This is consistent with Muzaffar et al. [67], who also observed limited antimicrobial activity of WO3/GO nanocomposites against these bacteria.
In contrast, Candida albicans demonstrated notable sensitivity to the PLA/WO3 nanocomposites, with the 7PLA sample showing an inhibition zone of 11 mm, indicating effective antifungal activity (Figure 11). This enhanced activity against fungi compared to bacteria can be attributed to structural differences between fungal and bacterial cell walls. Fungi, such as C. albicans, have cell walls primarily composed of chitin and are less negatively charged than bacterial cell walls, which may hinder the penetration of antimicrobial agents. The WO3 particles likely exert their antifungal effects through the generation of reactive oxygen species that damage the less protective fungal cell wall. This differential susceptibility highlights the potential of the WO3 particles to be used in applications requiring antifungal properties, offering a valuable addition to the antimicrobial arsenal.

4. Conclusions

This study successfully developed and characterized PLA/WO3 nanocomposites with a distinct honeycomb-like morphology by incorporating urchin-like WO3 particles into the PLA matrix. FTIR analysis indicated that the interaction between the WO3 particles and PLA is physical rather than chemical. With increasing WO3 particle loading, more intense absorption peaks were observed. SEM micrographs revealed that the WO3 particles formed agglomerates within the honeycomb-like structure of the PLA matrix. The UV-Vis spectroscopy showed a significant increase in absorbance at 600 nm, suggesting improved UV blocking properties due to the presence of WO3. DSC analysis demonstrated a 20% increase in crystallinity with higher WO3 particle concentrations, although the glass transition and melting temperatures remained largely unaffected. The elimination of the melting shoulder at higher WO3 particle loading suggests a more homogeneous melting process. Thermal stability decreased proportionally with WO3 particle concentration, as evidenced by a reduced maximum degradation temperature. Rheological tests revealed that the incorporation of WO3 particles enhanced the mechanical properties of PLA, with the storage modulus increasing by 30 times at 7 wt% WO3, and improved gel stability. Antimicrobial tests demonstrated effective antifungal activity against Candida albicans but no significant antibacterial effects against Escherichia coli and Staphylococcus aureus. These findings highlight the promising potential of PLA/WO3 nanocomposites for advanced material applications, particularly where enhanced mechanical, thermal, and UV-blocking properties are desirable. It is important to note that dichloromethane (DCM) was used to dissolve PLA, facilitating a homogeneous solution and uniform nanoparticle dispersion. However, DCM’s toxicity poses risks for biomedical and food packaging applications. Therefore, complete removal of DCM through thorough processing is essential to ensure compliance with safety standards and prevent any residual solvent migration.

Author Contributions

Conceptualization, S.D., S.H., S.G. and A.B.; methodology, S.D., S.H., S.G., S.S., M.B. and A.B.; software, S.D., S.H., S.G., S.S. and A.B.; validation, S.D., S.H., S.G., S.S., M.B. and A.B.; formal analysis, S.D., S.H., S.G., S.S., M.B. and A.B.; investigation, S.D., S.H., S.G. and A.B.; resources, S.D., S.H., S.G., S.S. and A.B.; data curation, S.D., S.H., S.G., M.B. and A.B.; writing—original draft, S.D., S.H., S.G. and A.B.; writing—review and editing, S.H., H.A., S.S., M.B. and A.B.; visualization, H.A., M.B. and A.B.; supervision, M.B. and A.B.; project administration, H.A., M.B. and A.B.; Funding acquisition, H.A. and A.B. All authors have read and agreed to the published version of the manuscript.

Funding

Thanks to the Researchers Supporting Project number (RSPD2024R604), King Saud University, Riyadh, Saudi Arabia.

Institutional Review Board Statement

Not applicable.

Informed Consent Statement

Not applicable.

Data Availability Statement

The original contributions presented in the study are included in the article, further inquiries can be directed to the corresponding author/s.

Conflicts of Interest

The authors declare that there are no financial or personal conflicts of interest that could potentially influence or bias the outcomes of this research work.

References

  1. Ates, B.; Koytepe, S.; Ulu, A.; Gurses, C.; Thakur, V.K. Chemistry, structures, and advanced applications of nanocomposites from biorenewable resources. Chem. Rev. 2020, 120, 9304–9362. [Google Scholar] [CrossRef] [PubMed]
  2. Khan, I.; Khan, I.; Saeed, K.; Ali, N.; Zada, N.; Khan, A.; Ali, F.; Bilal, M.; Akhter, M.S. Polymer nanocomposites: An overview. Smart Polym. Nanocompos. 2023, 167–184. [Google Scholar]
  3. Barhoum, A.; Van Lokeren, L.; Rahier, H.; Dufresne, A.; Van Assche, G. Roles of in situ surface modification in controlling the growth and crystallization of CaCO3 nanoparticles, and their dispersion in polymeric materials. J. Mater. Sci. 2015, 50, 7908–7918. [Google Scholar] [CrossRef]
  4. Mishra, R.; Militky, J. Nanotechnology in Textiles: Theory and Application; Woodhead Publishing: Sawston, UK, 2018; p. 387. [Google Scholar]
  5. Hammani, S.; Barhoum, A.; Nagarajan, S.; Bechelany, M. Toner Waste Powder (TWP) as a Filler for Polymer Blends (LDPE/HIPS) for Enhanced Electrical Conductivity. Materials 2019, 12, 3062. [Google Scholar] [CrossRef]
  6. Obeid, A.; Balaa, H.E.; Samad, O.E.; Awad, R.; Badawi, M.S. Attenuation parameters of HDPE filled with different nano-size and bulk WO3 for X-ray shielding applications. Eur. Phys. J. Plus 2022, 137, 1229. [Google Scholar] [CrossRef]
  7. Yang, B.; Tran, T.-T.; Milam-Guerrero, J.; To, D.T.; Stahovich, T.; Myung, N.V. Enhancing gas sensing performance of tungsten trioxide (WO3) nanofibers through diameter and crystallinity control. Sens. Actuators Rep. 2024, 7, 100182. [Google Scholar] [CrossRef]
  8. Sharmila, B.; Dwivedi, P. Optical sensing and computing memory devices using nanostructured WO3. Mater. Sci. Semicond. Process. 2024, 173, 108106. [Google Scholar]
  9. Zhuzhelskii, D.; Tolstopyatova, E.; Volkov, A.; Eliseeva, S.; Kondratiev, V. Spectroelectrochemistry of Poly (3,4-Ethylenedioxythiophene)–Tungsten Oxide Composite Films in Dilute Sulfuric Acid Solution. Russ. J. Gen. Chem. 2020, 90, 1949–1954. [Google Scholar] [CrossRef]
  10. Meng, Y.; Yin, J.; Wang, L.; Yang, X.; Li, X.; Jiang, Y. Facile WO3@ PANI composite film for applications in double-layer photoelectrochromic supercapacitors. Mater. Lett. 2023, 335, 133809. [Google Scholar] [CrossRef]
  11. Chaudhary, V.; Kaur, A. Enhanced room temperature sulfur dioxide sensing behaviour of in situ polymerized polyaniline–tungsten oxide nanocomposite possessing honeycomb morphology. RSC Adv. 2015, 5, 73535–73544. [Google Scholar] [CrossRef]
  12. Issa, S.A.; Alrowaily, A.W.; Abulyazied, D.; Ali, E.; Zakaly, H.M. Effects of WO3 reinforcement on the properties of poly (lactic acid) composites for radiation shielding. Radiat. Phys. Chem. 2023, 212, 111121. [Google Scholar] [CrossRef]
  13. Nugraha, M.W.; Wirzal, M.D.H.; Ali, F.; Roza, L.; Sambudi, N.S. Electrospun polylactic acid/tungsten oxide/amino-functionalized carbon quantum dots (PLA/WO3/N-CQDs) fibers for oil/water separation and photocatalytic decolorization. J. Environ. Chem. Eng. 2021, 9, 106033. [Google Scholar] [CrossRef]
  14. Liew, W.C.; Muhamad, I.I.; Chew, J.W.; Abd Karim, K.J. Synergistic effect of graphene oxide/zinc oxide nanocomposites on polylactic acid-based active packaging film: Properties, release kinetics and antimicrobial efficiency. Int. J. Biol. Macromol. 2023, 253, 127288. [Google Scholar] [CrossRef]
  15. Drzal, L.T. Natural Fibers, Biopolymers, and Biocomposites; CRC Press: Boca Raton, FL, USA, 2005. [Google Scholar]
  16. DeStefano, V.; Khan, S.; Tabada, A. Applications of PLA in modern medicine. Eng. Regen. 2020, 1, 76–87. [Google Scholar] [CrossRef]
  17. Nofar, M.; Salehiyan, R.; Sinha Ray, S. Rheology of poly (lactic acid)-based systems. Polym. Rev. 2019, 59, 465–509. [Google Scholar] [CrossRef]
  18. Zhou, L.; Ke, K.; Yang, M.-B.; Yang, W. Recent progress on chemical modification of cellulose for high mechanical-performance Poly (lactic acid)/Cellulose composite: A review. Compos. Commun. 2021, 23, 100548. [Google Scholar] [CrossRef]
  19. Fonseca, C.; Ochoa, A.; Ulloa, M.T.; Alvarez, E.; Canales, D.; Zapata, P.A. Poly (lactic acid)/TiO2 nanocomposites as alternative biocidal and antifungal materials. Mater. Sci. Eng. C 2015, 57, 314–320. [Google Scholar] [CrossRef]
  20. Chong, W.J.; Shen, S.; Li, Y.; Trinchi, A.; Pejak, D.; Kyratzis, I.L.; Sola, A.; Wen, C. Additive manufacturing of antibacterial PLA-ZnO nanocomposites: Benefits, limitations and open challenges. J. Mater. Sci. Technol. 2022, 111, 120–151. [Google Scholar] [CrossRef]
  21. Banerjee, R.; Ray, S.S. Role of Rheology in Morphology Development and Advanced Processing of Thermoplastic Polymer Materials: A Review. ACS Omega 2023, 8, 27969–28001. [Google Scholar] [CrossRef]
  22. Qu, W.; Wang, Z.; Wang, X.; Wang, Z.; Yu, D.; Ji, D. High-hydrophobic ZIF-67@ PLA honeycomb aerogel for efficient oil–water separation. Colloids Surf. A Physicochem. Eng. Asp. 2023, 658, 130768. [Google Scholar] [CrossRef]
  23. Zhang, Q.; Yang, X.; Li, P.; Huang, G.; Feng, S.; Shen, C.; Han, B.; Zhang, X.; Jin, F.; Xu, F. Bioinspired engineering of honeycomb structure–Using nature to inspire human innovation. Prog. Mater. Sci. 2015, 74, 332–400. [Google Scholar] [CrossRef]
  24. Slepička, P.; Siegel, J.; Šlouf, M.; Fajstavr, D.; Fajstavrová, K.; Kolská, Z.; Švorčík, V. The Functionalization of a Honeycomb Polystyrene Pattern by Excimer Treatment in Liquid. Polymers 2022, 14, 4944. [Google Scholar] [CrossRef] [PubMed]
  25. Korde, J.M.; Shaikh, M.; Kandasubramanian, B. Bionic prototyping of honeycomb patterned polymer composite and its engineering application. Polym.-Plast. Technol. Eng. 2018, 57, 1828–1844. [Google Scholar] [CrossRef]
  26. Loued, W.; Wéry, J.; Dorlando, A.; Alimi, K. A combined study based on experimental analyses and theoretical calculations on properties of poly (lactic acid) under annealing treatment. J. Mol. Struct. 2015, 1081, 486–493. [Google Scholar] [CrossRef]
  27. Ahmed, J.; Arfat, Y.A.; Castro-Aguirre, E.; Auras, R. Mechanical, structural and thermal properties of Ag–Cu and ZnO reinforced polylactide nanocomposite films. Int. J. Biol. Macromol. 2016, 86, 885–892. [Google Scholar] [CrossRef]
  28. Yakdoumi, F.Z.; Hadj-Hamou, A.S.; Rahoui, N.; Rahman, M.M.; Abetz, V. Polylactic acid nanocomposites containing functionalized multiwalled carbon nanotubes as antimicrobial packaging materials. Int. J. Biol. Macromol. 2022, 213, 55–69. [Google Scholar] [CrossRef]
  29. Shafiee Nasab, M.; Tabari, M.; Bidarigh, S. Antifungal activity of nano-composite films based on Poly Lactic Acid. Nanomed. Res. J. 2019, 4, 186–192. [Google Scholar]
  30. Arshad, M.; Ehtisham-ul-Haque, S.; Bilal, M.; Ahmad, N.; Ahmad, A.; Abbas, M.; Nisar, J.; Khan, M.; Nazir, A.; Ghaffar, A. Synthesis and characterization of Zn doped WO3 nanoparticles: Photocatalytic, antifungal and antibacterial activities evaluation. Mater. Res. Express 2020, 7, 015407. [Google Scholar] [CrossRef]
  31. Ying, Y.; Pung, S.; Sreekantan, S.; Yee, Y.; Ong, M.; Pung, Y. Structural and antibacterial properties of WO3/ZnO hybrid particles against pathogenic bacteria. Mater. Today Proc. 2019, 17, 1008–1017. [Google Scholar] [CrossRef]
  32. Vijaykumar, B.; Bharati, B.; Priyanka, K.; Manjunatha, B.; Sannakki, B. Investigations on dislocation density and strain of polyaniline with WO3 nanocomposites. IOP Conf. Ser. Mater. Sci. Eng. 2022, 1221, 012017. [Google Scholar] [CrossRef]
  33. Mane, A.; Navale, S.T.; Pawar, R.C.; Lee, C.; Patil, V.B. Microstructural, optical and electrical transport properties of WO3 nanoparticles coated polypyrrole hybrid nanocomposites. Synth. Met. 2015, 199, 187–195. [Google Scholar] [CrossRef]
  34. Pang, H.F.; Xiang, X.; Li, Z.J.; Fu, Y.Q.; Zu, X.T. Hydrothermal synthesis and optical properties of hexagonal tungsten oxide nanocrystals assisted by ammonium tartrate. Phys. Status Solidi A 2012, 209, 537–544. [Google Scholar] [CrossRef]
  35. Najafi-Ashtiani, H.; Bahari, A.; Gholipour, S.; Hoseinzadeh, S. Structural, optical and electrical properties of WO3–Ag nanocomposites for the electro-optical devices. Appl. Phys. A 2018, 124, 1–9. [Google Scholar] [CrossRef]
  36. Cai, G.; Tu, J.; Zhou, D.; Zhang, J.; Wang, X.; Gu, C. Dual electrochromic film based on WO3/polyaniline core/shell nanowire array. Sol. Energy Mater. Sol. Cells 2014, 122, 51–58. [Google Scholar] [CrossRef]
  37. Cao, S.; Chen, H. Nanorods assembled hierarchical urchin-like WO3 nanostructures: Hydrothermal synthesis, characterization, and their gas sensing properties. J. Alloys Compd. 2017, 702, 644–648. [Google Scholar] [CrossRef]
  38. Ahmad, N.D.; Wildan, M.W. Preparation and properties of cellulose nanocrystals-reinforced Poly (lactic acid) composite filaments for 3D printing applications. Results Eng. 2023, 17, 100842. [Google Scholar] [CrossRef]
  39. Mathew, A.P.; Oksman, K.; Sain, M. Mechanical properties of biodegradable composites from poly lactic acid (PLA) and microcrystalline cellulose (MCC). J. Appl. Polym. Sci. 2005, 97, 2014–2025. [Google Scholar] [CrossRef]
  40. Crasta, V.; Praveen, B. Enhancement of optical, mechanical and micro structural properties in nanocomposite films of PVA doped with WO3 nanoparticles. Int. J. Struct. Integr. 2015, 6, 338–354. [Google Scholar]
  41. Akshaykranth, A.; Jayarambabu, N.; Venkatappa Rao, T.; Rakesh Kumar, R.; Srinivasa Rao, L. Antibacterial activity study of ZnO incorporated biodegradable poly (lactic acid) films for food packaging applications. Polym. Bull. 2023, 80, 1369–1384. [Google Scholar] [CrossRef]
  42. Feng, S.; Zhang, F.; Ahmed, S.; Liu, Y. Physico-mechanical and antibacterial properties of PLA/TiO2 composite materials synthesized via electrospinning and solution casting processes. Coatings 2019, 9, 525. [Google Scholar] [CrossRef]
  43. Ghozali, M.; Fahmiati, S.; Triwulandari, E.; Restu, W.K.; Farhan, D.; Wulansari, M.; Fatriasari, W. PLA/metal oxide bio-composites for antimicrobial packaging application. Polym.-Plast. Technol. Mater. 2020, 59, 1332–1342. [Google Scholar]
  44. Swaroop, C.; Shukla, M. Nano-magnesium oxide reinforced polylactic acid biofilms for food packaging applications. Int. J. Biol. Macromol. 2018, 113, 729–736. [Google Scholar] [CrossRef] [PubMed]
  45. Mohamad, N.; Mazlan, M.M.; Tawakkal, I.S.M.A.; Talib, R.A.; Kian, L.K.; Fouad, H.; Jawaid, M. Development of active agents filled polylactic acid films for food packaging application. Int. J. Biol. Macromol. 2020, 163, 1451–1457. [Google Scholar] [CrossRef] [PubMed]
  46. Kim, I.; Viswanathan, K.; Kasi, G.; Sadeghi, K.; Thanakkasaranee, S.; Seo, J. Poly (lactic acid)/ZnO bionanocomposite films with positively charged ZnO as potential antimicrobial food packaging materials. Polymers 2019, 11, 1427. [Google Scholar] [CrossRef]
  47. Bocchini, S.; Fukushima, K.; Blasio, A.D.; Fina, A.; Frache, A.; Geobaldo, F. Polylactic acid and polylactic acid-based nanocomposite photooxidation. Biomacromolecules 2010, 11, 2919–2926. [Google Scholar] [CrossRef]
  48. Auras, R.A.; Lim, L.-T.; Selke, S.E.; Tsuji, H. Poly (Lactic Acid): Synthesis, Structures, Properties, Processing, Applications, and End of Life; John Wiley & Sons: Hoboken, NJ, USA, 2022. [Google Scholar]
  49. Shanshool, H.M.; Yahaya, M.; Yunus, W.M.M.; Abdullah, I.Y. Investigation of energy band gap in polymer/ZnO nanocomposites. J. Mater. Sci. Mater. Electron. 2016, 27, 9804–9811. [Google Scholar] [CrossRef]
  50. Yang, W.; Fortunati, E.; Dominici, F.; Kenny, J.M.; Puglia, D. Effect of processing conditions and lignin content on thermal, mechanical and degradative behavior of lignin nanoparticles/polylactic (acid) bionanocomposites prepared by melt extrusion and solvent casting. Eur. Polym. J. 2015, 71, 126–139. [Google Scholar] [CrossRef]
  51. Murariu, M.; Benali, S.; Paint, Y.; Dechief, A.-L.; Murariu, O.; Raquez, J.-M.; Dubois, P. Adding value in production of multifunctional polylactide (PLA)–ZnO nanocomposite films through alternative manufacturing methods. Molecules 2021, 26, 2043. [Google Scholar] [CrossRef]
  52. Clarkson, C.M.; Azrak, S.M.E.A.; Schueneman, G.T.; Snyder, J.F.; Youngblood, J.P. Crystallization kinetics and morphology of small concentrations of cellulose nanofibrils (CNFs) and cellulose nanocrystals (CNCs) melt-compounded into poly (lactic acid) (PLA) with plasticizer. Polymers 2020, 187, 122101. [Google Scholar] [CrossRef]
  53. Kang, H.; Kim, D.S. A study on the crystallization and melting of PLA nanocomposites with cellulose nanocrystals by DSC. Polym. Compos. 2023, 44, 7727–7736. [Google Scholar] [CrossRef]
  54. Vasile, C.; Râpă, M.; Ştefan, M.; Stan, M.; Macavei, S.; Darie-Niţă, R.; Barbu-Tudoran, L.; Vodnar, D.; Popa, E.; Ştefan, R. New PLA/ZnO: Cu/Ag bionanocomposites for food packaging. Express Polym. Lett. 2017, 11, 1555–1569. [Google Scholar] [CrossRef]
  55. Pan, P.; Kai, W.; Zhu, B.; Dong, T.; Inoue, Y. Polymorphous crystallization and multiple melting behavior of poly (L-lactide): Molecular weight dependence. Macromolecules 2007, 40, 6898–6905. [Google Scholar] [CrossRef]
  56. Supaphol, P. Crystallization and melting behavior in syndiotactic polypropylene: Origin of multiple melting phenomenon. J. Appl. Polym. Sci. 2001, 82, 1083–1097. [Google Scholar] [CrossRef]
  57. Benyaya, M.; Bolzinger, M.-A.; Chevalier, Y.; Bordes, C. Rheological properties and stability of Pickering emulsions stabilized with differently charged particles. Colloids Surf. A Physicochem. Eng. Asp. 2024, 687, 133514. [Google Scholar] [CrossRef]
  58. Bek, M.; Gonzalez-Gutierrez, J.; Kukla, C.; Pušnik Črešnar, K.; Maroh, B.; Slemenik Perše, L. Rheological behaviour of highly filled materials for injection moulding and additive manufacturing: Effect of particle material and loading. Appl. Sci. 2020, 10, 7993. [Google Scholar] [CrossRef]
  59. Rueda, M.M.; Auscher, M.-C.; Fulchiron, R.; Périé, T.; Martin, G.; Sonntag, P.; Cassagnau, P. Rheology and applications of highly filled polymers: A review of current understanding. Prog. Polym. Sci. 2017, 66, 22–53. [Google Scholar] [CrossRef]
  60. Liu, L.; Ciftci, O.N. Effects of high oil compositions and printing parameters on food paste properties and printability in a 3D printing food processing model. J. Food Eng. 2021, 288, 110135. [Google Scholar] [CrossRef]
  61. Yiu, C.; Liang, S.; Mukhtar, K.; Kim, W.; Wang, Y.; Selomulya, C. Food emulsion gels from plant-based ingredients: Formulation, processing, and potential applications. Gels 2023, 9, 366. [Google Scholar] [CrossRef]
  62. Li, Y.; Wang, J.; Ying, R.; Huang, M.; Hayat, K. Protein-stabilized Pickering emulsion interacting with inulin, xanthan gum, and chitosan: Rheological behavior and 3D printing. Carbohydr. Polym. 2024, 326, 121658. [Google Scholar] [CrossRef]
  63. Ahmed, J.; Varshney, S.K.; Auras, R. Rheological and thermal properties of polylactide/silicate nanocomposites films. J. Food Sci. 2010, 75, N17–N24. [Google Scholar] [CrossRef]
  64. Ahi, Z.B.; Renkler, N.Z.; Gul Seker, M.; Tuzlakoglu, K. Biodegradable polymer films with a natural antibacterial extract as novel periodontal barrier membranes. Int. J. Biomater. 2019, 2019, 7932470. [Google Scholar] [CrossRef] [PubMed]
  65. Tajdari, A.; Babaei, A.; Goudarzi, A.; Partovi, R. Preparation and study on the optical, mechanical, and antibacterial properties of polylactic acid/ZnO/TiO2 shared nanocomposites. J. Plast. Film Sheeting 2020, 36, 285–311. [Google Scholar] [CrossRef]
  66. Restrepo, I.; Flores, P.; Rodríguez-Llamazares, S. Antibacterial nanocomposite of poly (lactic acid) and ZnO nanoparticles stabilized with poly (vinyl alcohol): Thermal and morphological characterization. Polym.-Plast. Technol. Mater. 2019, 58, 105–112. [Google Scholar] [CrossRef]
  67. Muzaffar, T.; Khosa, R.Y.; Iftikhar, U.; Obodo, R.M.; Sajjad, S.; Usman, M. Synthesis and characterization of WO3/GO nanocomposites for antimicrobial properties. J. Clust. Sci. 2022, 33, 1987–1996. [Google Scholar] [CrossRef]
Figure 1. Characteristics of the urchin-like WO3 particles: (a) XRD patterns; (b) FTIR spectra.
Polymers 16 02702 g001
Figure 2. SEM analysis of the urchin-like WO3 particles: (a,b) SEM images; (c) EDX-SEM analysis.
Polymers 16 02702 g002
Figure 3. XRD spectra of neat PLA and PLA/WO3 nanocomposites loaded with different loadings of the urchin-like WO3 particles (1 wt%, 3 wt%, 5 wt%, and 7 wt%).
Polymers 16 02702 g003
Figure 4. SEM cross-section images illustrating the irregular honeycomb-like morphology of PLA/WO3 nanocomposites with different urchin-like WO3 particle loading with pore size distribution: (a,b) 1 wt%, (c,d) 3 wt%, (e,f) 5 wt%, and (g,h) 7 wt%.
Polymers 16 02702 g004aPolymers 16 02702 g004b
Figure 5. SEM cross-section images illustrating: (a,b) the smooth surface of pure PLA; (c,d) the irregular honeycomb-like morphology of PLA/WO3 nanocomposites with 3 wt% urchin-like WO3 particle loading.
Polymers 16 02702 g005
Figure 6. FTIR spectrum of PLA/WO3 nanocomposites with varying urchin-like WO3 particle loading (0 wt%, 1 wt%, 3 wt%, 5 wt%, and 7 wt%).
Polymers 16 02702 g006
Figure 7. UV-Vis spectra of PLA and PLA/WO3 nanocomposites. (a) Transmittance, (b) absorbance, and (c) energy band gap.
Polymers 16 02702 g007aPolymers 16 02702 g007b
Figure 8. TGA curves of the neat PLA and PLA/WO3 nanocomposites: (a) Weight loss curves illustrating the thermal degradation profiles, and (b) derivative TGA (d-TGA) graphs showing the rate of weight loss as a function of temperature.
Polymers 16 02702 g008aPolymers 16 02702 g008b
Figure 9. DSC scan of neat PLA and PLA/WO3 composites with different amounts of WO3 (1, 3, and 5 wt%).
Polymers 16 02702 g009
Figure 10. Variation of storage, loss moduli, damping factor, and complex viscosity in function of the frequency of neat PLA and PLA/WO3 nanocomposites: (a) storage modulus; (b) loss modulus; (c) damping factor; (d) complex viscosity.
Polymers 16 02702 g010aPolymers 16 02702 g010b
Figure 11. Antimicrobial activity of urchin-like WO3 particles, net PLA, and PLA/WO3 nanocomposites. PLA and WO3 served as controls to assess their individual antimicrobial effects.
Polymers 16 02702 g011
Table 1. Composition and characteristics of the Neat PLA and PLA/WO3 nanocomposites. Mean pore diameter (µm) and mean pore area (µm). UV-blocking (%) was estimated using UV-Vis transmittance mode.
SamplesWO3 Conc.Mean Pore Length (µm)Mean Pore Area (µm)UV-Blocking (%)
PLA0 wt%No poreNo pore9 ± 1
1PLA1 wt%14.1 ± 1.04.17 ± 0.555 ± 2
3PLA3 wt%14.8 ± 1.25.59 ± 0.628 ± 3
5PLA5 wt%19.9 ± 1.57.40 ± 0.738 ± 2
7PLA7 wt%24.9 ± 1.89.22 ± 0.842 ± 2
Table 2. Thermal stability of neat PLA and PLA/WO3 nanocomposites, showing temperatures at 5%, 50%, and 95% weight loss, and the temperature of maximum weight loss rate.
SamplesWO3 Conc.T5% (°C)T50% (°C)T95% (°C)Tmax (°C)
PLA0269 ± 1.5322 ± 1.2339 ± 1.8331.0 ± 1.0
1PLA1281 ± 1.3318 ± 1.4389 ± 1.7330.2 ± 1.1
3PLA3281 ± 1.4315 ± 1.3331 ± 1.6320.9 ± 1.2
5PLA5282 ± 1.2310 ± 1.5347 ± 1.8317.4 ± 1.3
7PLA7268 ± 1.6304 ± 1.7326 ± 1.5310.4 ± 1.2
Table 3. DSC results of the neat polymer and PLA/WO3 nanocomposites based on the second scan.
SamplesTg (°C)Tc (°C)Tm1 (°C)Tm2 (°C)ΔHc (J/g)ΔHm (J/g)Crystallization Rate (%)
PLA58.0 ± 1.2115.0 ± 1.5164.0 ± 1.3169.0 ± 1.433.9 ± 1.337.1 ± 1.239.9 ± 1.5
1PLA59.0 ± 0.8112.0 ± 1.5163.0 ± 1.0168.0 ± 1.035.6 ± 1.736.2 ± 1.142.3 ± 1.0
3PLA58.0 ± 1.1110.0 ± 1.8162.0 ± 1.2168.0 ± 1.235.9 ± 1.538.7 ± 1.542.9 ± 1.8
5PLA55.0 ± 1.4104.0 ± 1.8--166.0 ± 1.528.5 ± 1.844.5 ± 1.750.5 ± 1.8
Abbreviations: glass transition temperature (Tg), cold crystallization temperature (Tc), melting temperature (Tm1 and Tm2), enthalpy of cold crystallization (ΔHc), melting enthalpy (ΔHm), crystallization rate (χc).
Table 4. Rheological parameters of neat PLA and PLA/WO3 at 0.1 Hz.
SampleG′ (Pa)G″ (Pa)tan(δ) η * P a · s Gel Temperature (°C)
PLA3000 ± 150956 ± 500.318 ± 0.0154730 ± 22074.3 ± 1.0
1PLA8420 ± 2502070 ± 750.246 ± 0.02013,000 ± 46068.9 ± 1.2
3PLA14,500 ± 3004730 ± 1000.326 ± 0.02521,800 ± 68072.3 ± 1.3
5PLA18,600 ± 4003740 ± 1250.201 ± 0.03028,400 ± 74076.0 ± 1.0
7PLA101,000 ± 50029,900 ± 1500.296 ± 0.035158,000 ± 79078.5 ± 1.5
Disclaimer/Publisher’s Note: The statements, opinions and data contained in all publications are solely those of the individual author(s) and contributor(s) and not of MDPI and/or the editor(s). MDPI and/or the editor(s) disclaim responsibility for any injury to people or property resulting from any ideas, methods, instructions or products referred to in the content.

