
Induction Heating of Laminated Composite Structures with Magnetically Responsive Nanocomposite Interlayers for Debonding-on-Demand Applications

 , , , , , ,
Abstract

1. Introduction
2. Materials and Methods
2.1. FFF Nanocomposite Feedstock Preparation
2.2. Additive Manufacturing of Sandwich Composite Specimens
2.3. Characterization Methods
2.3.1. Thermal Analysis
2.3.2. Scanning Electron Microscopy (SEM)
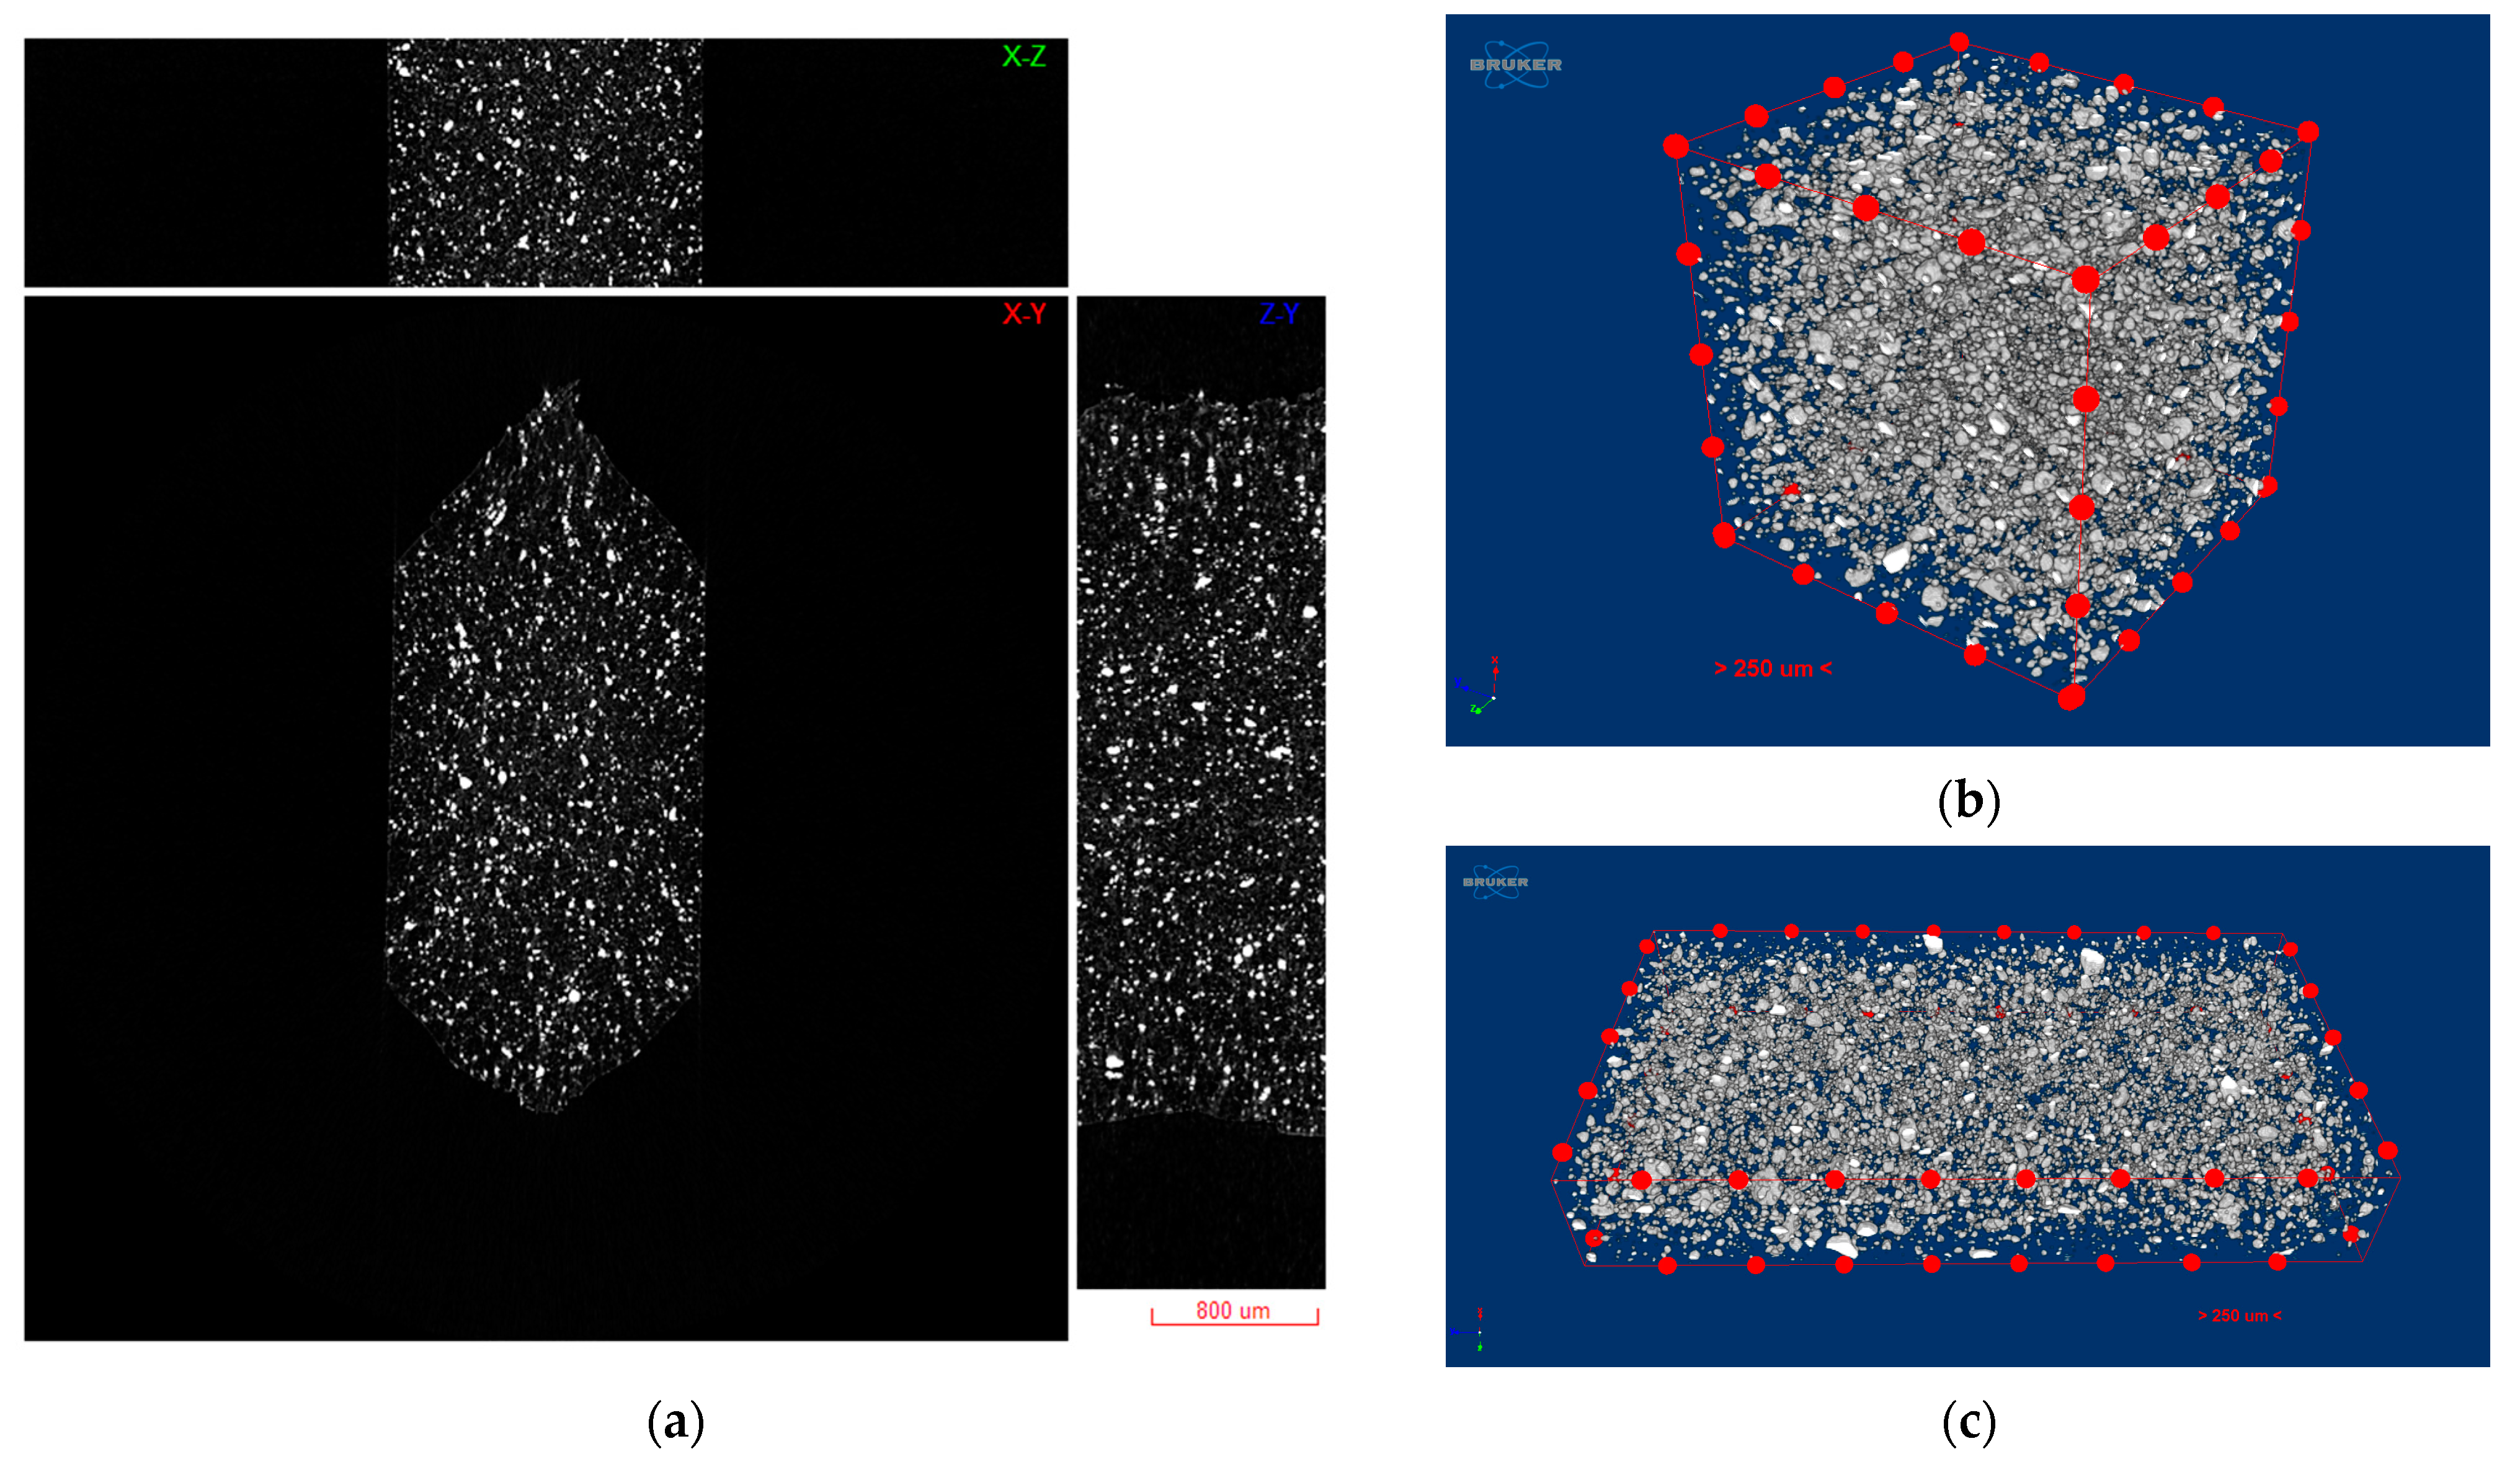
2.3.3. Micro-Computed Tomography (mCT)
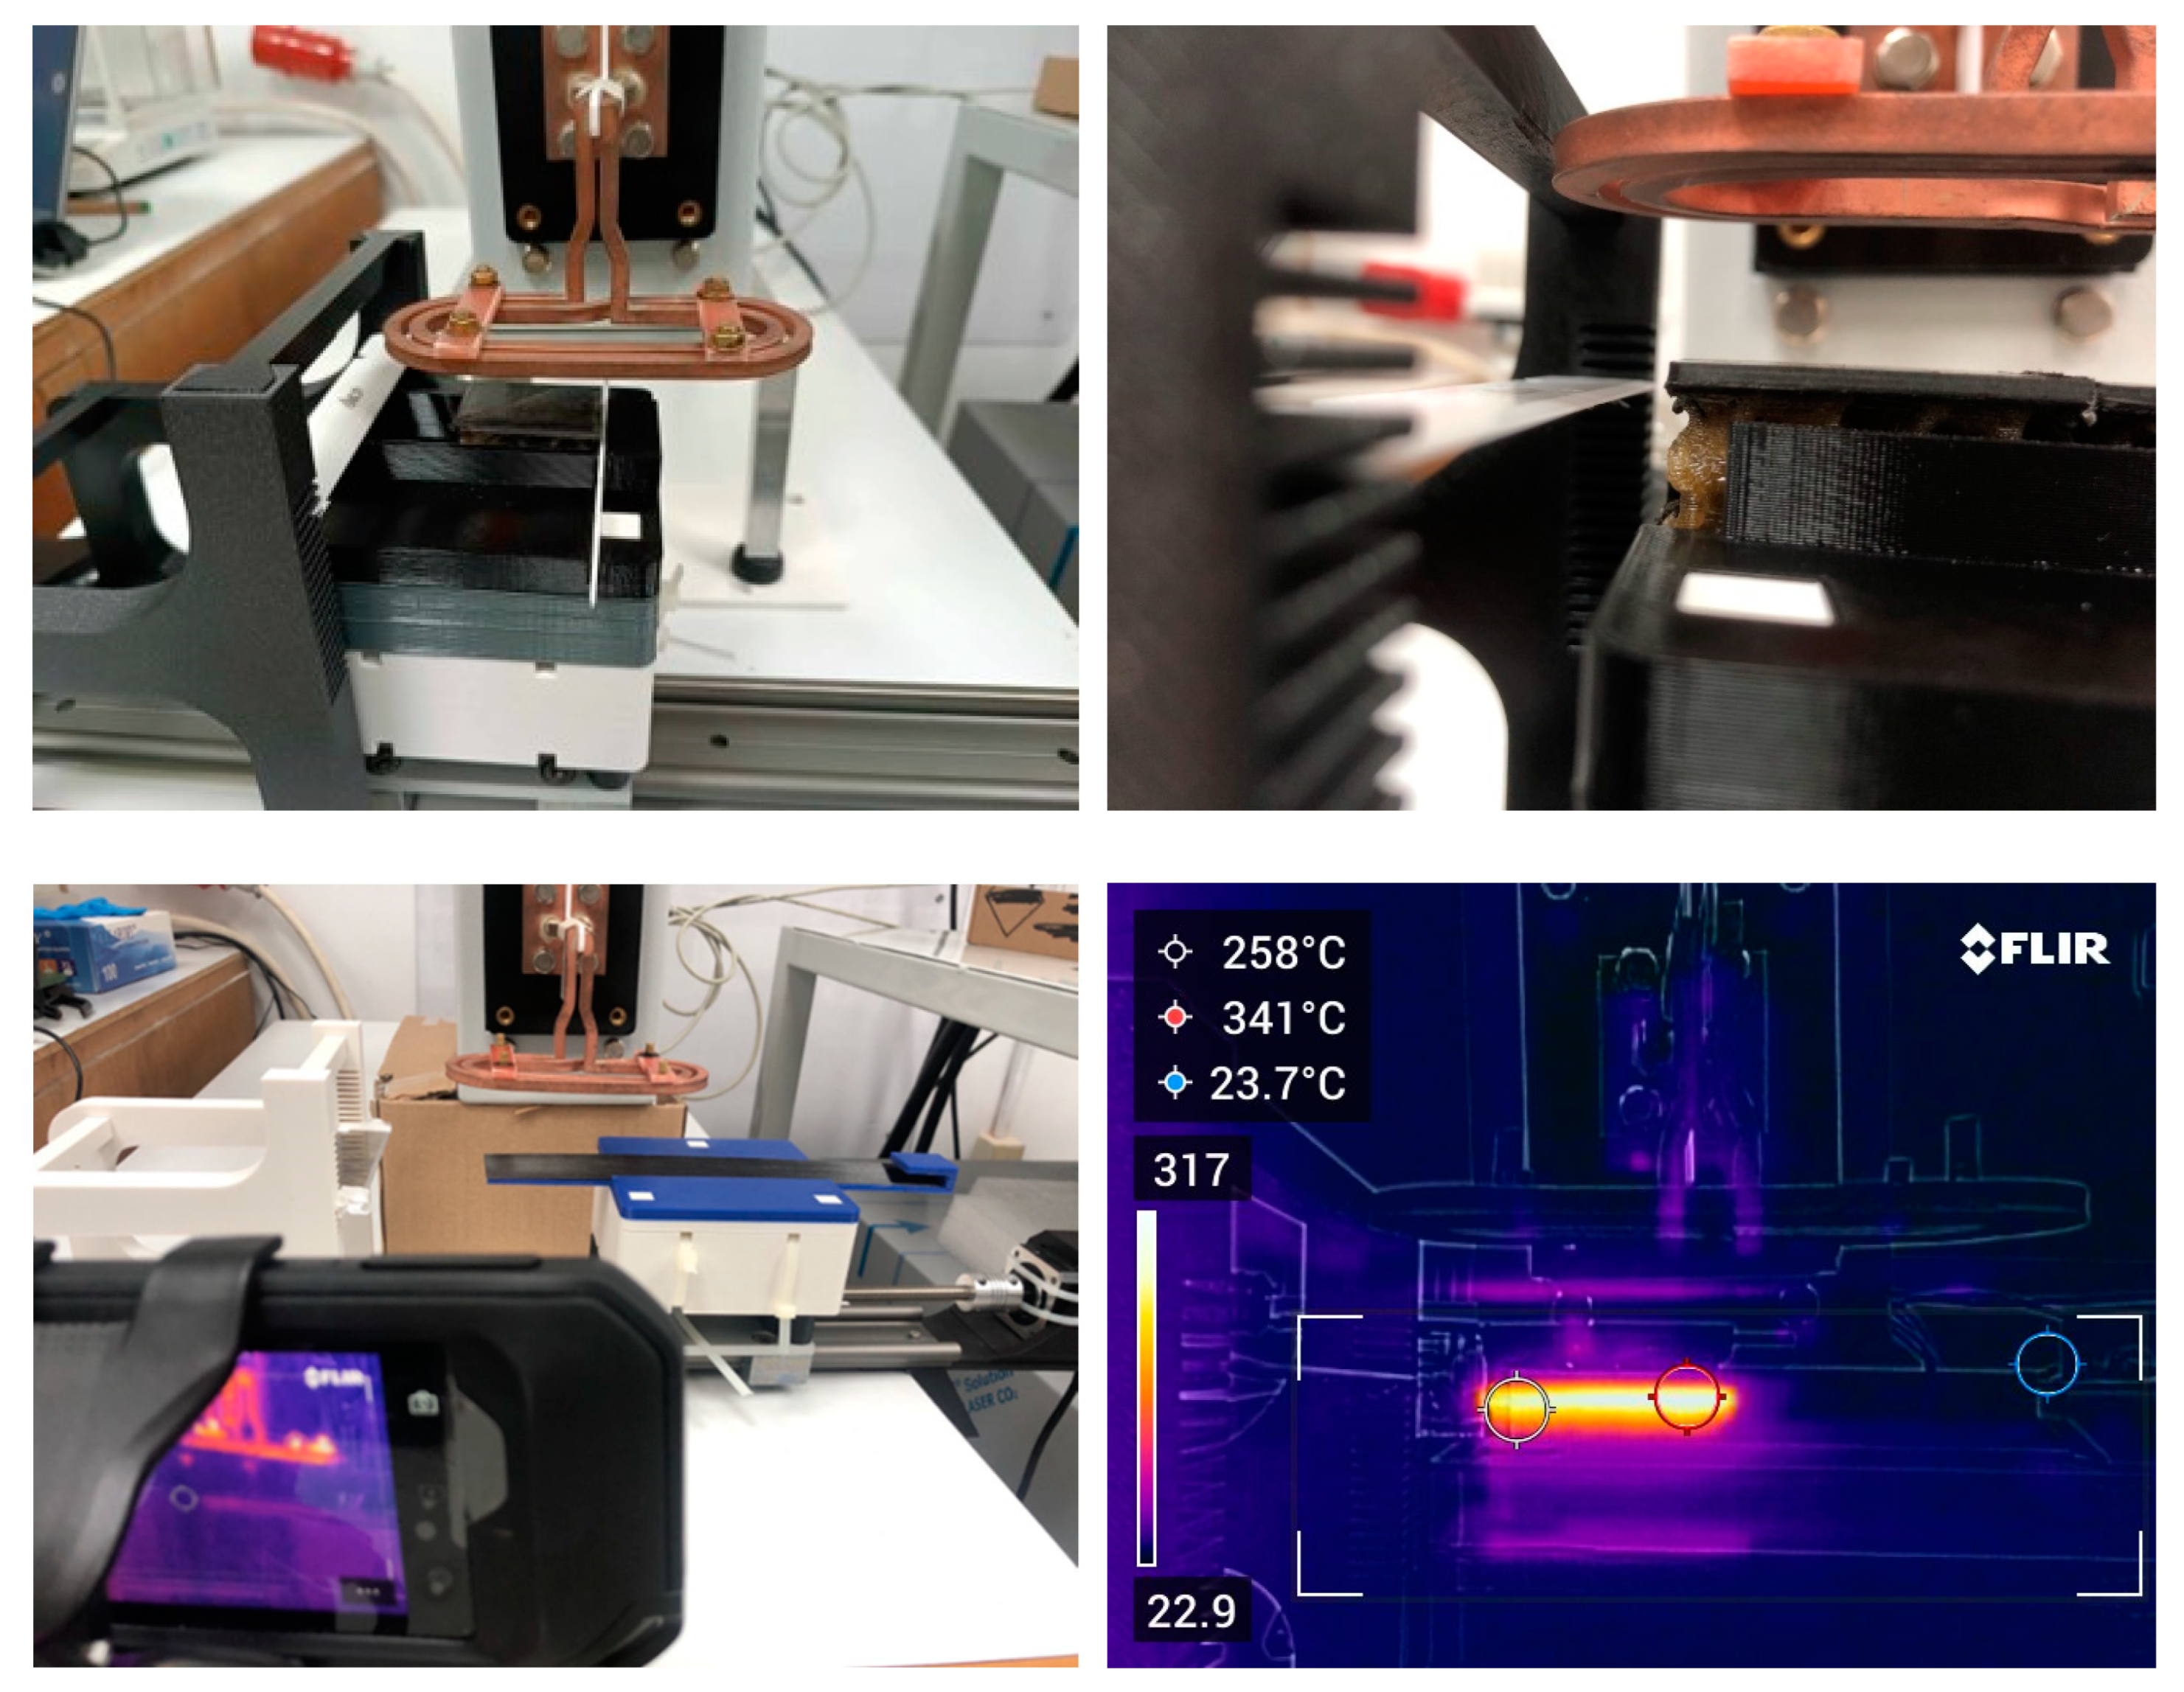
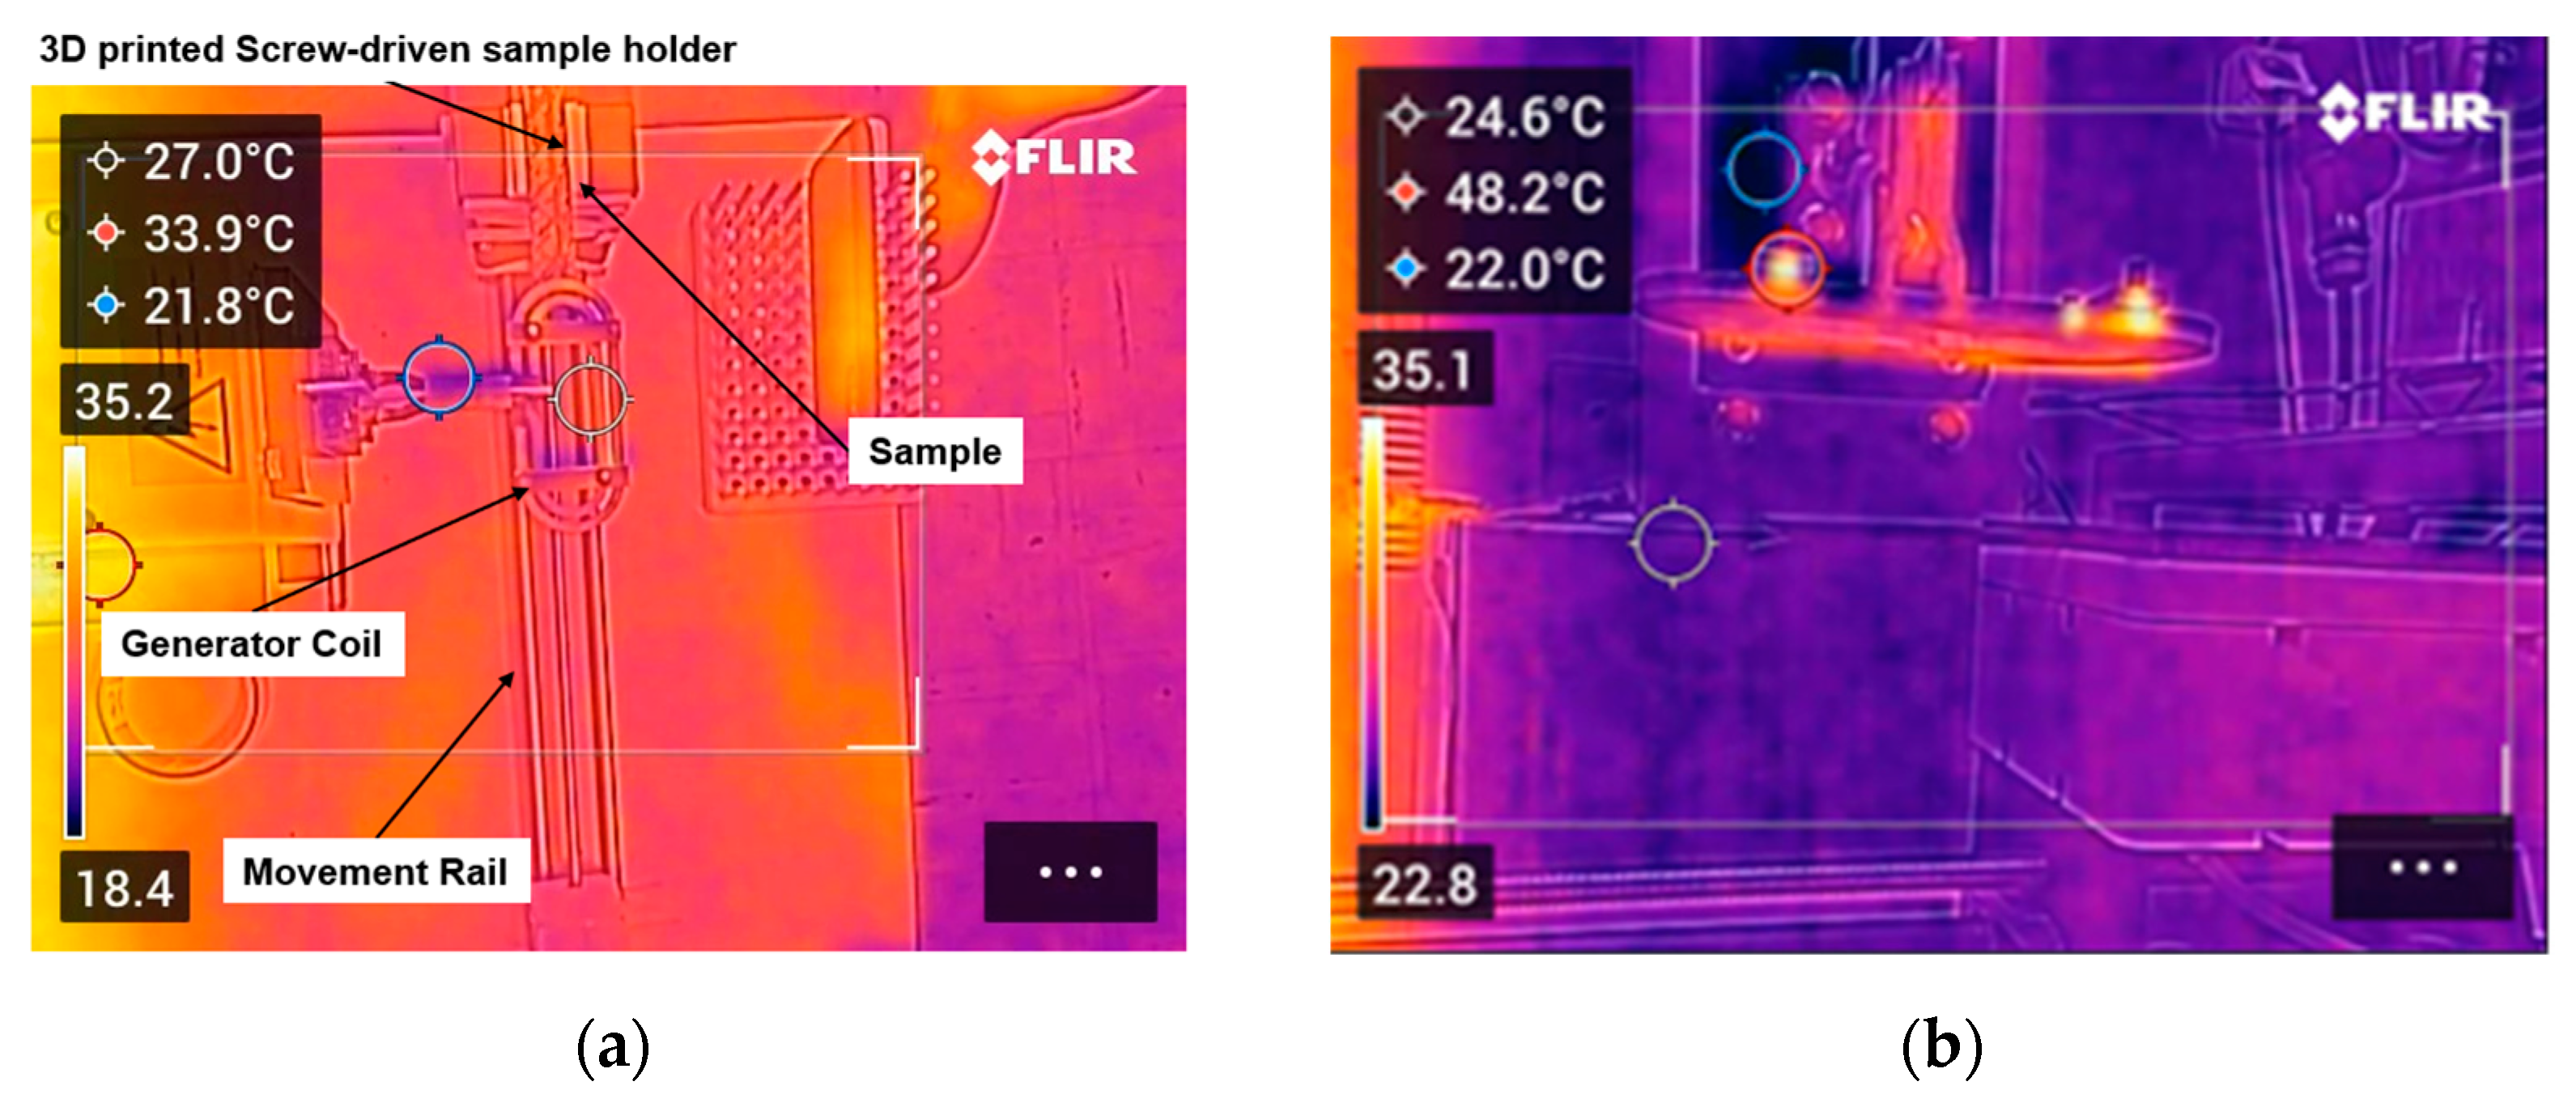
2.4. Induction Heating and Thermal Imaging
2.4.1. Induction Heating Setup
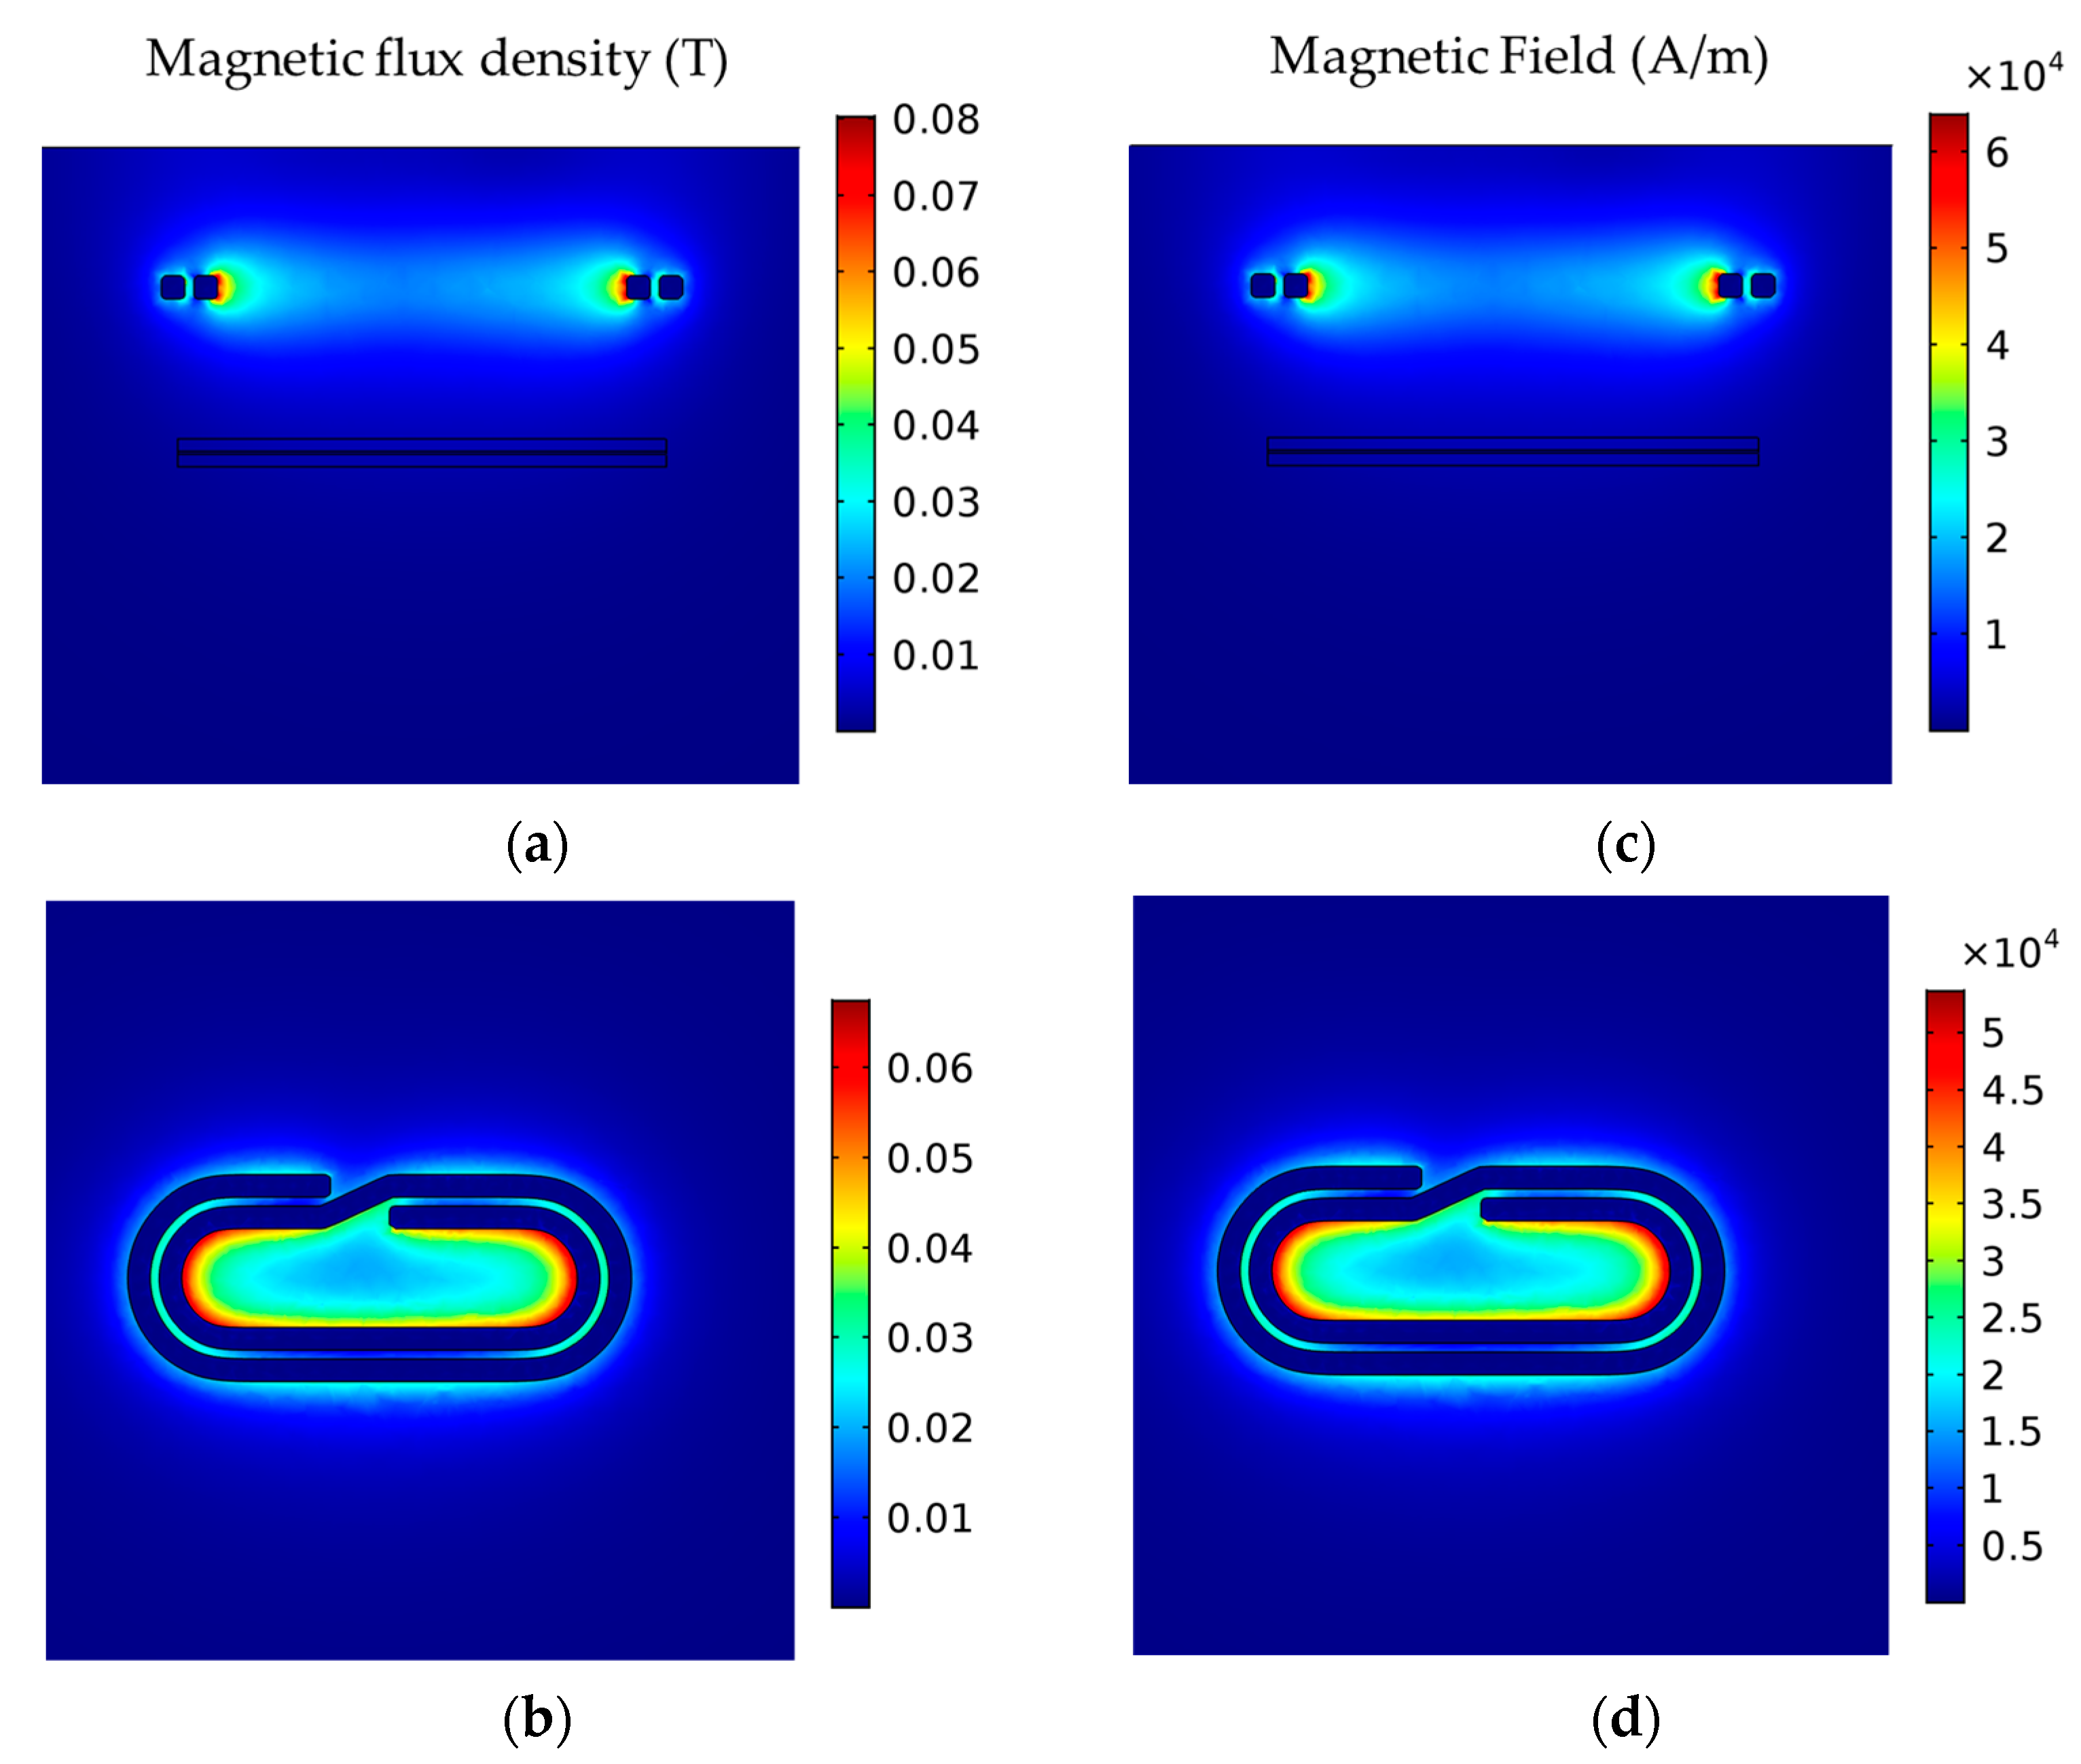
2.4.2. Induction Heating Simulation
3. Results and Discussion
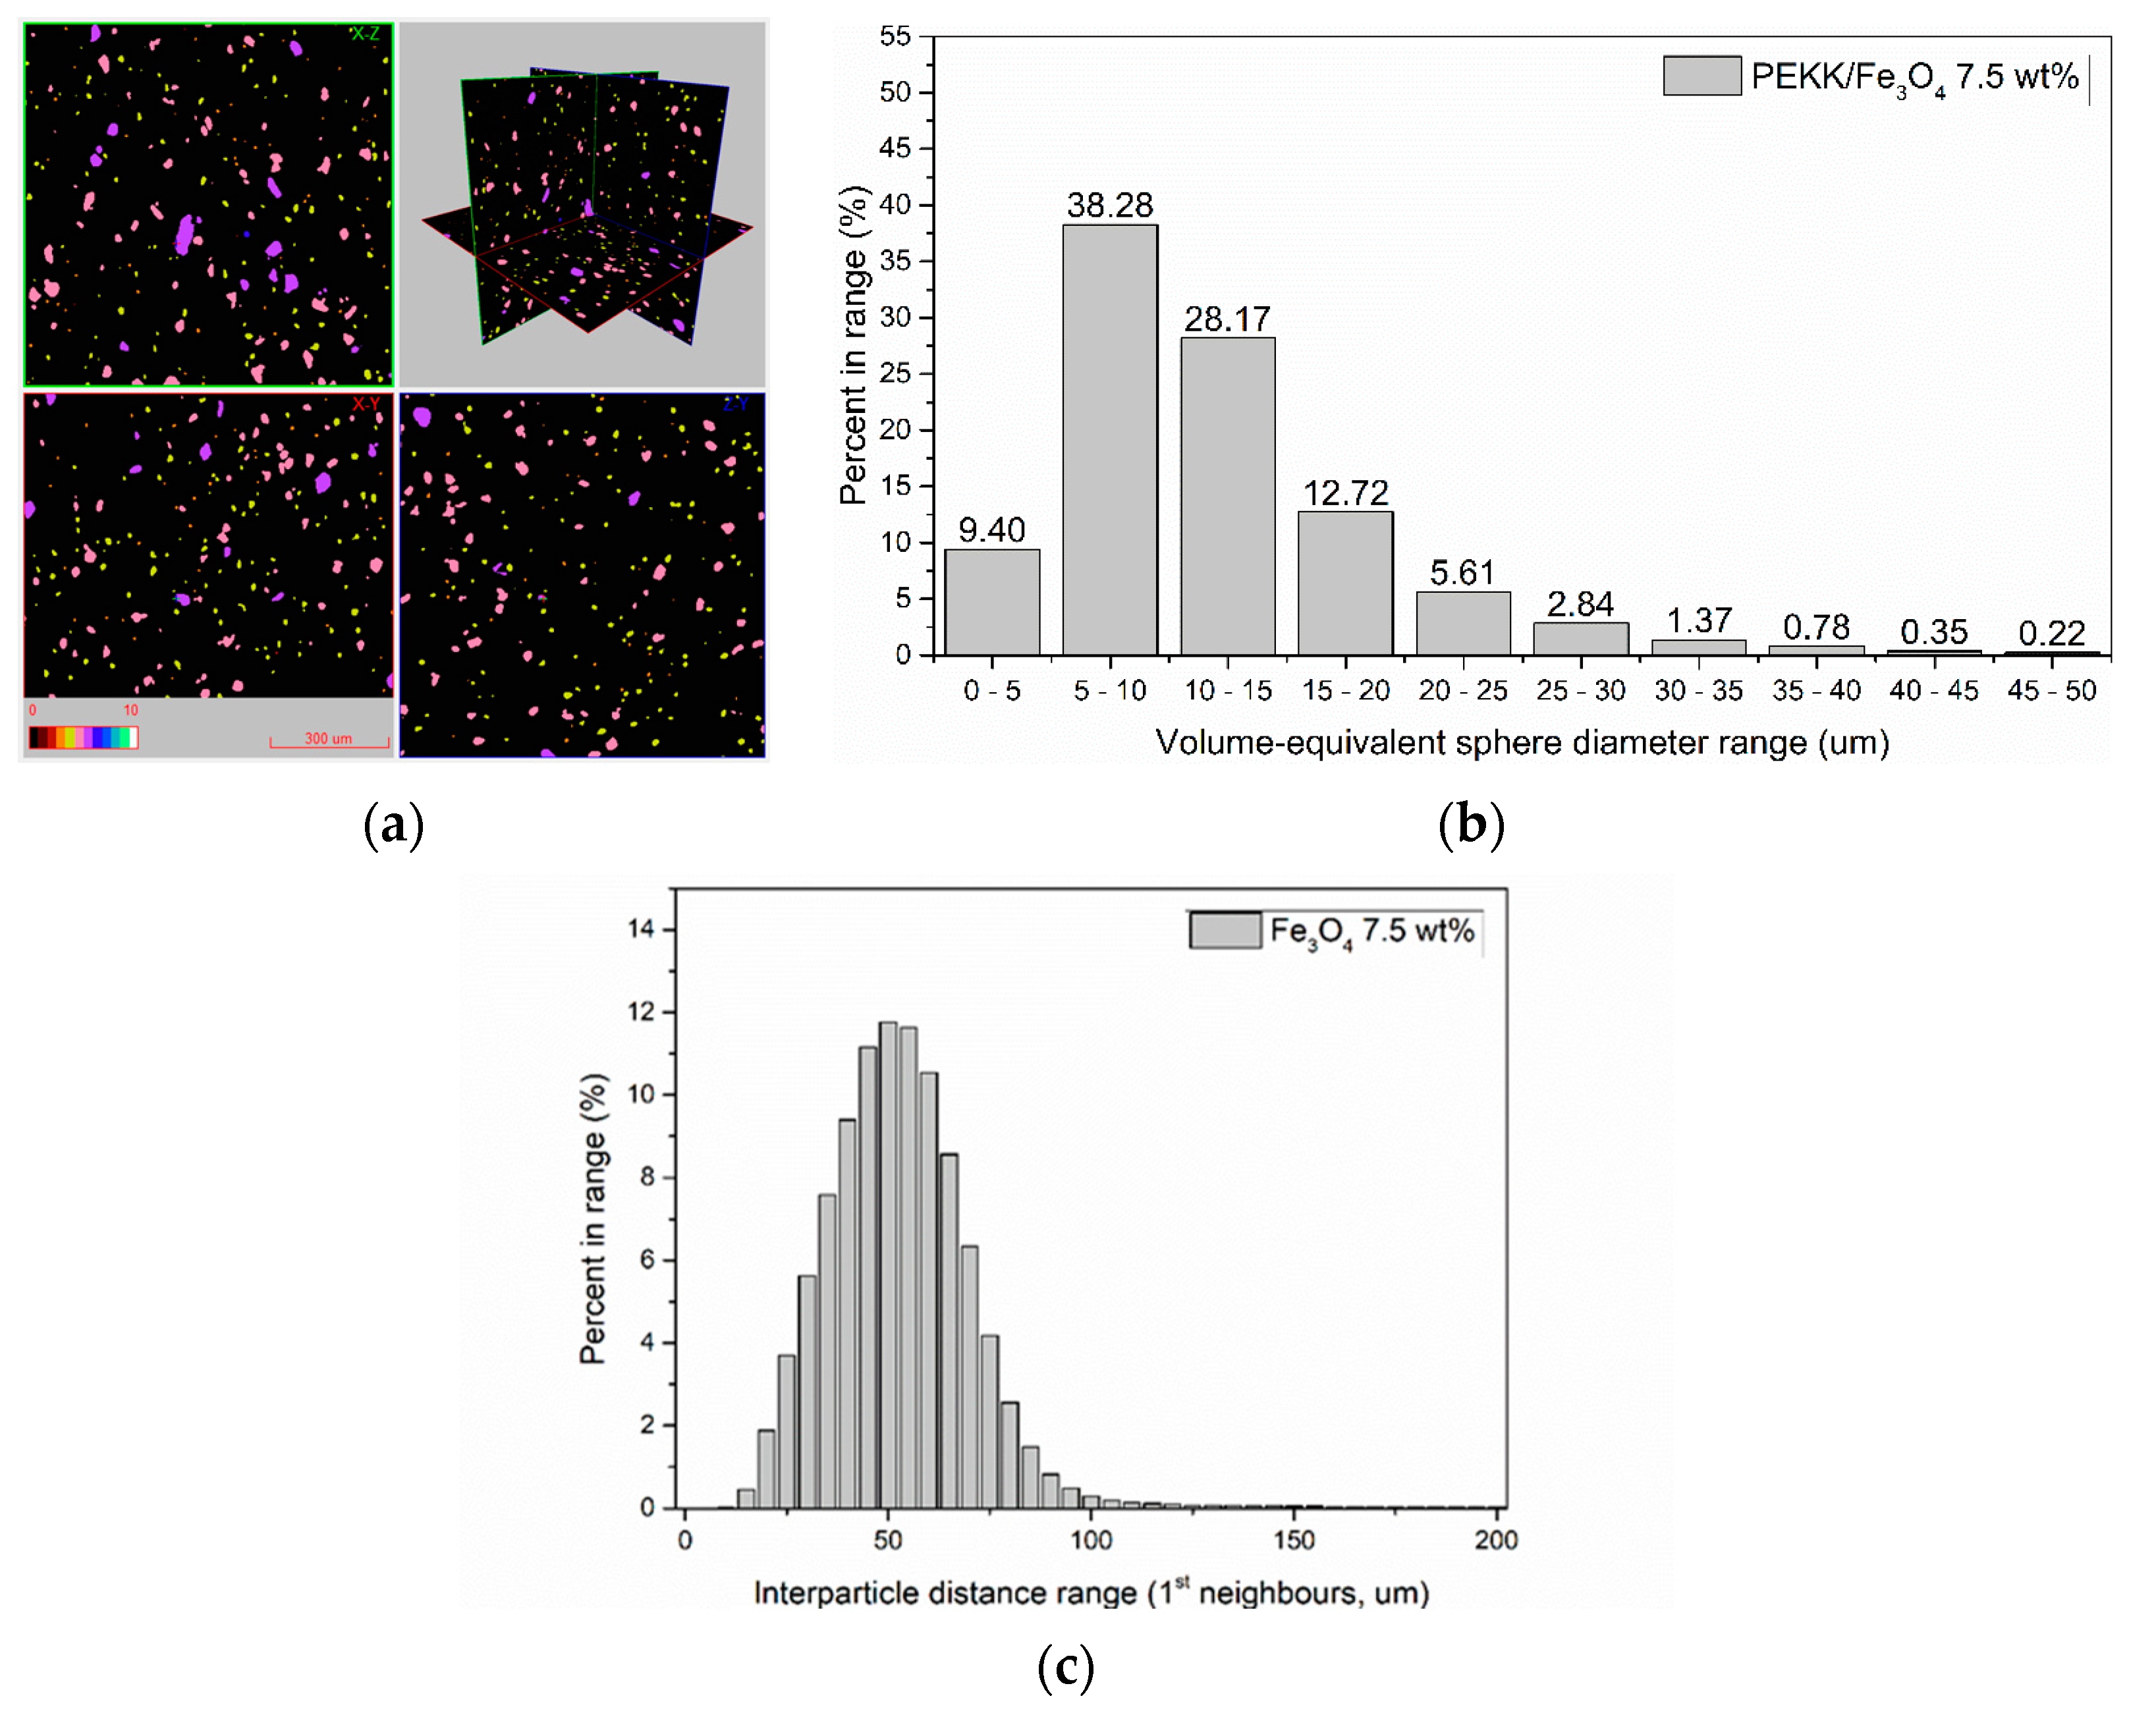
3.1. Filler Dispersion Analysis
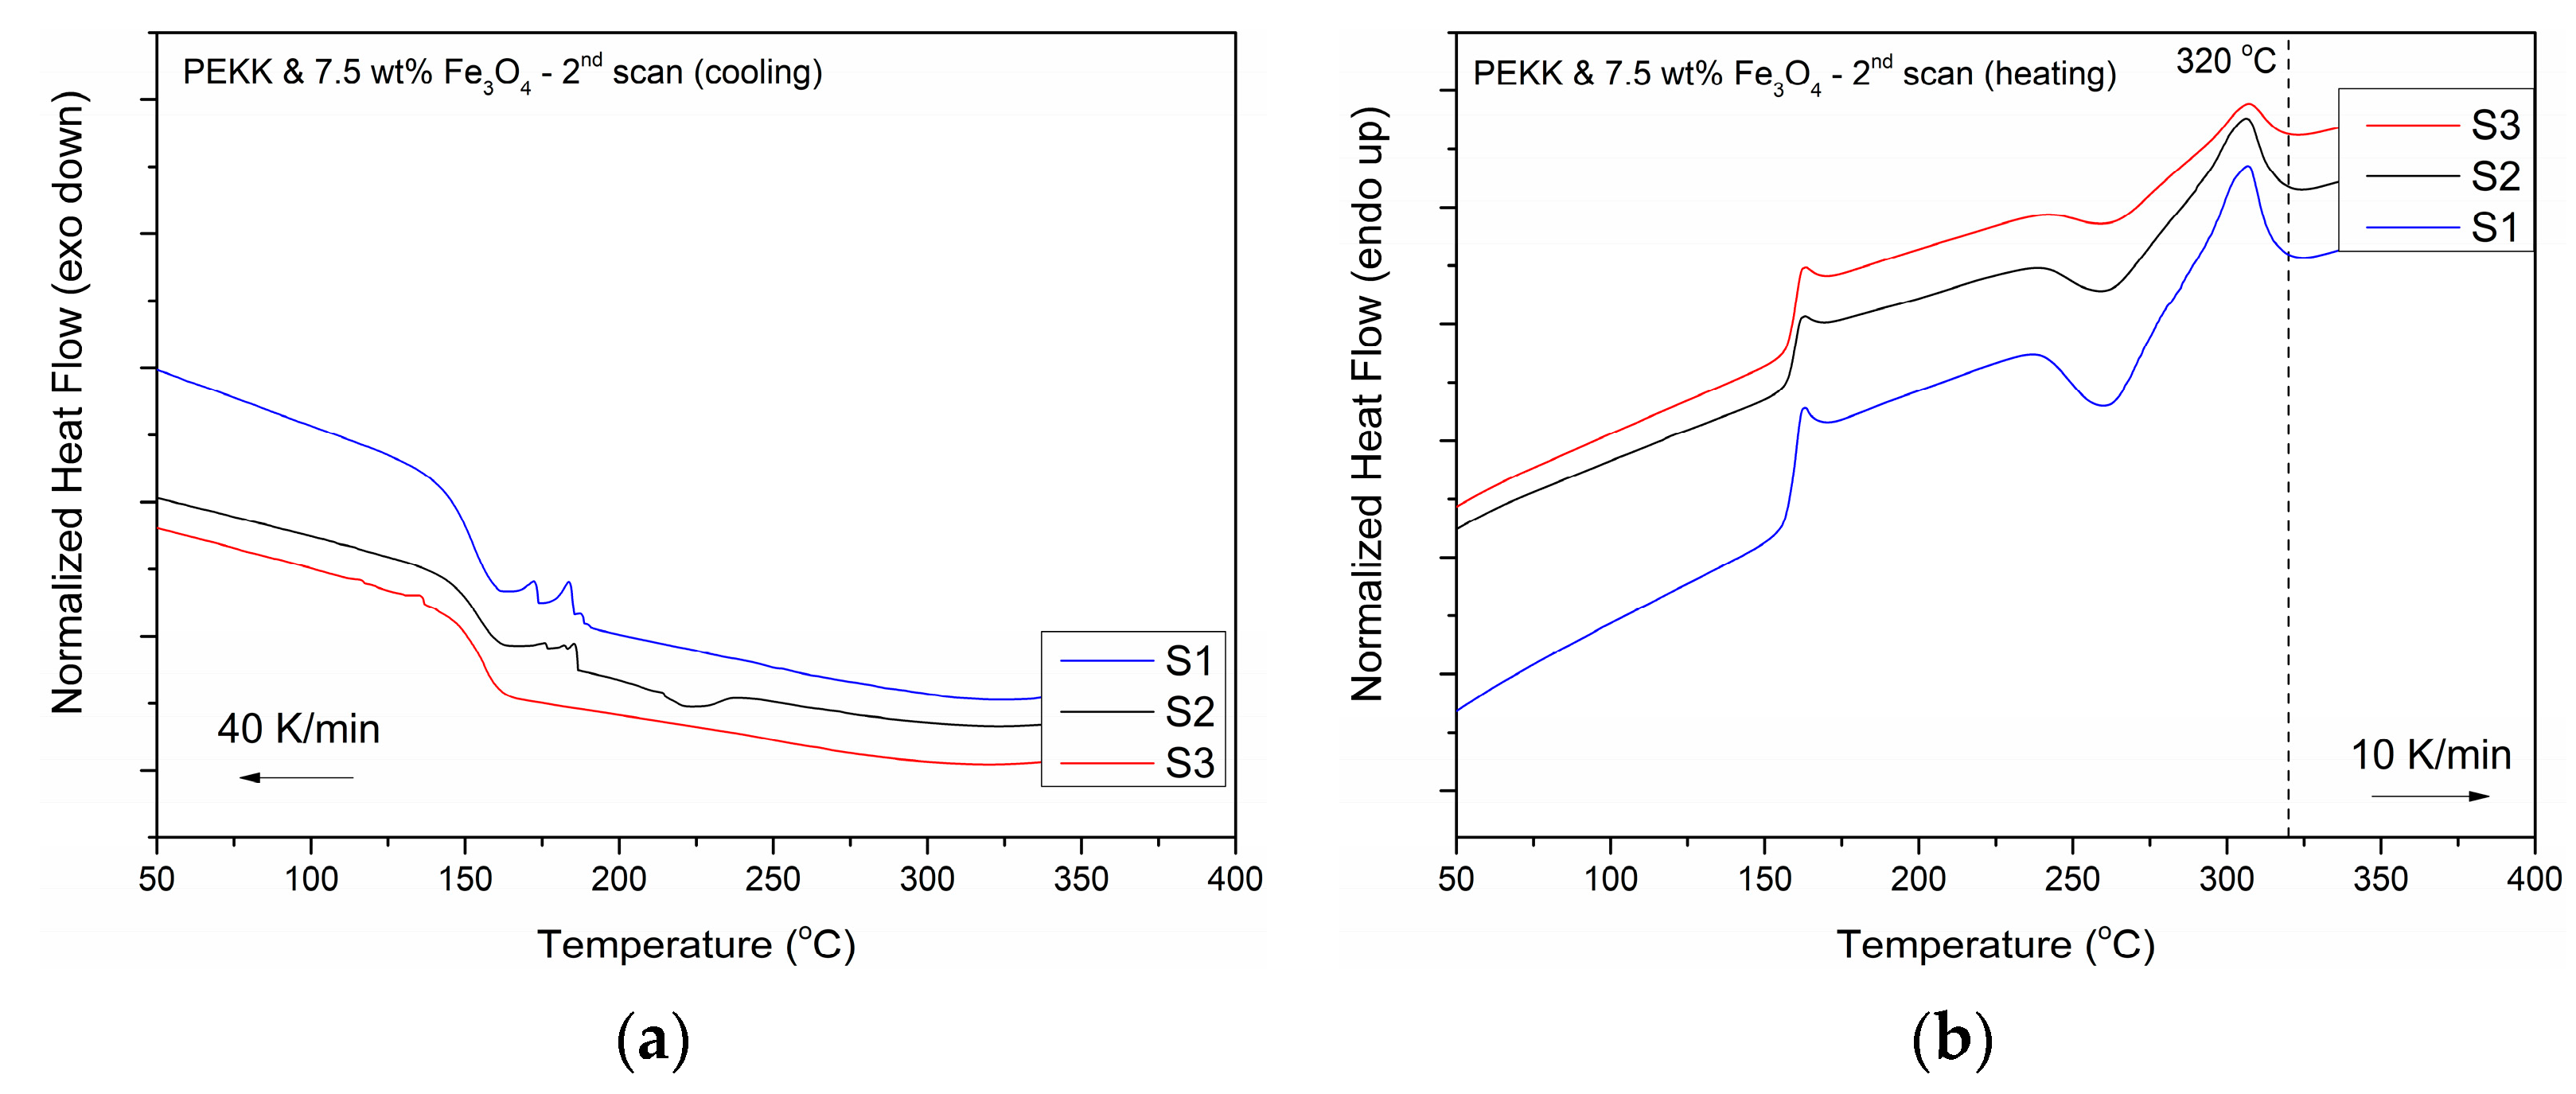
3.2. Thermal Properties
3.3. Coupon-Level mCT Inspection
3.4. Induction Heating Capacity Assessment
3.4.1. Induction Simulation
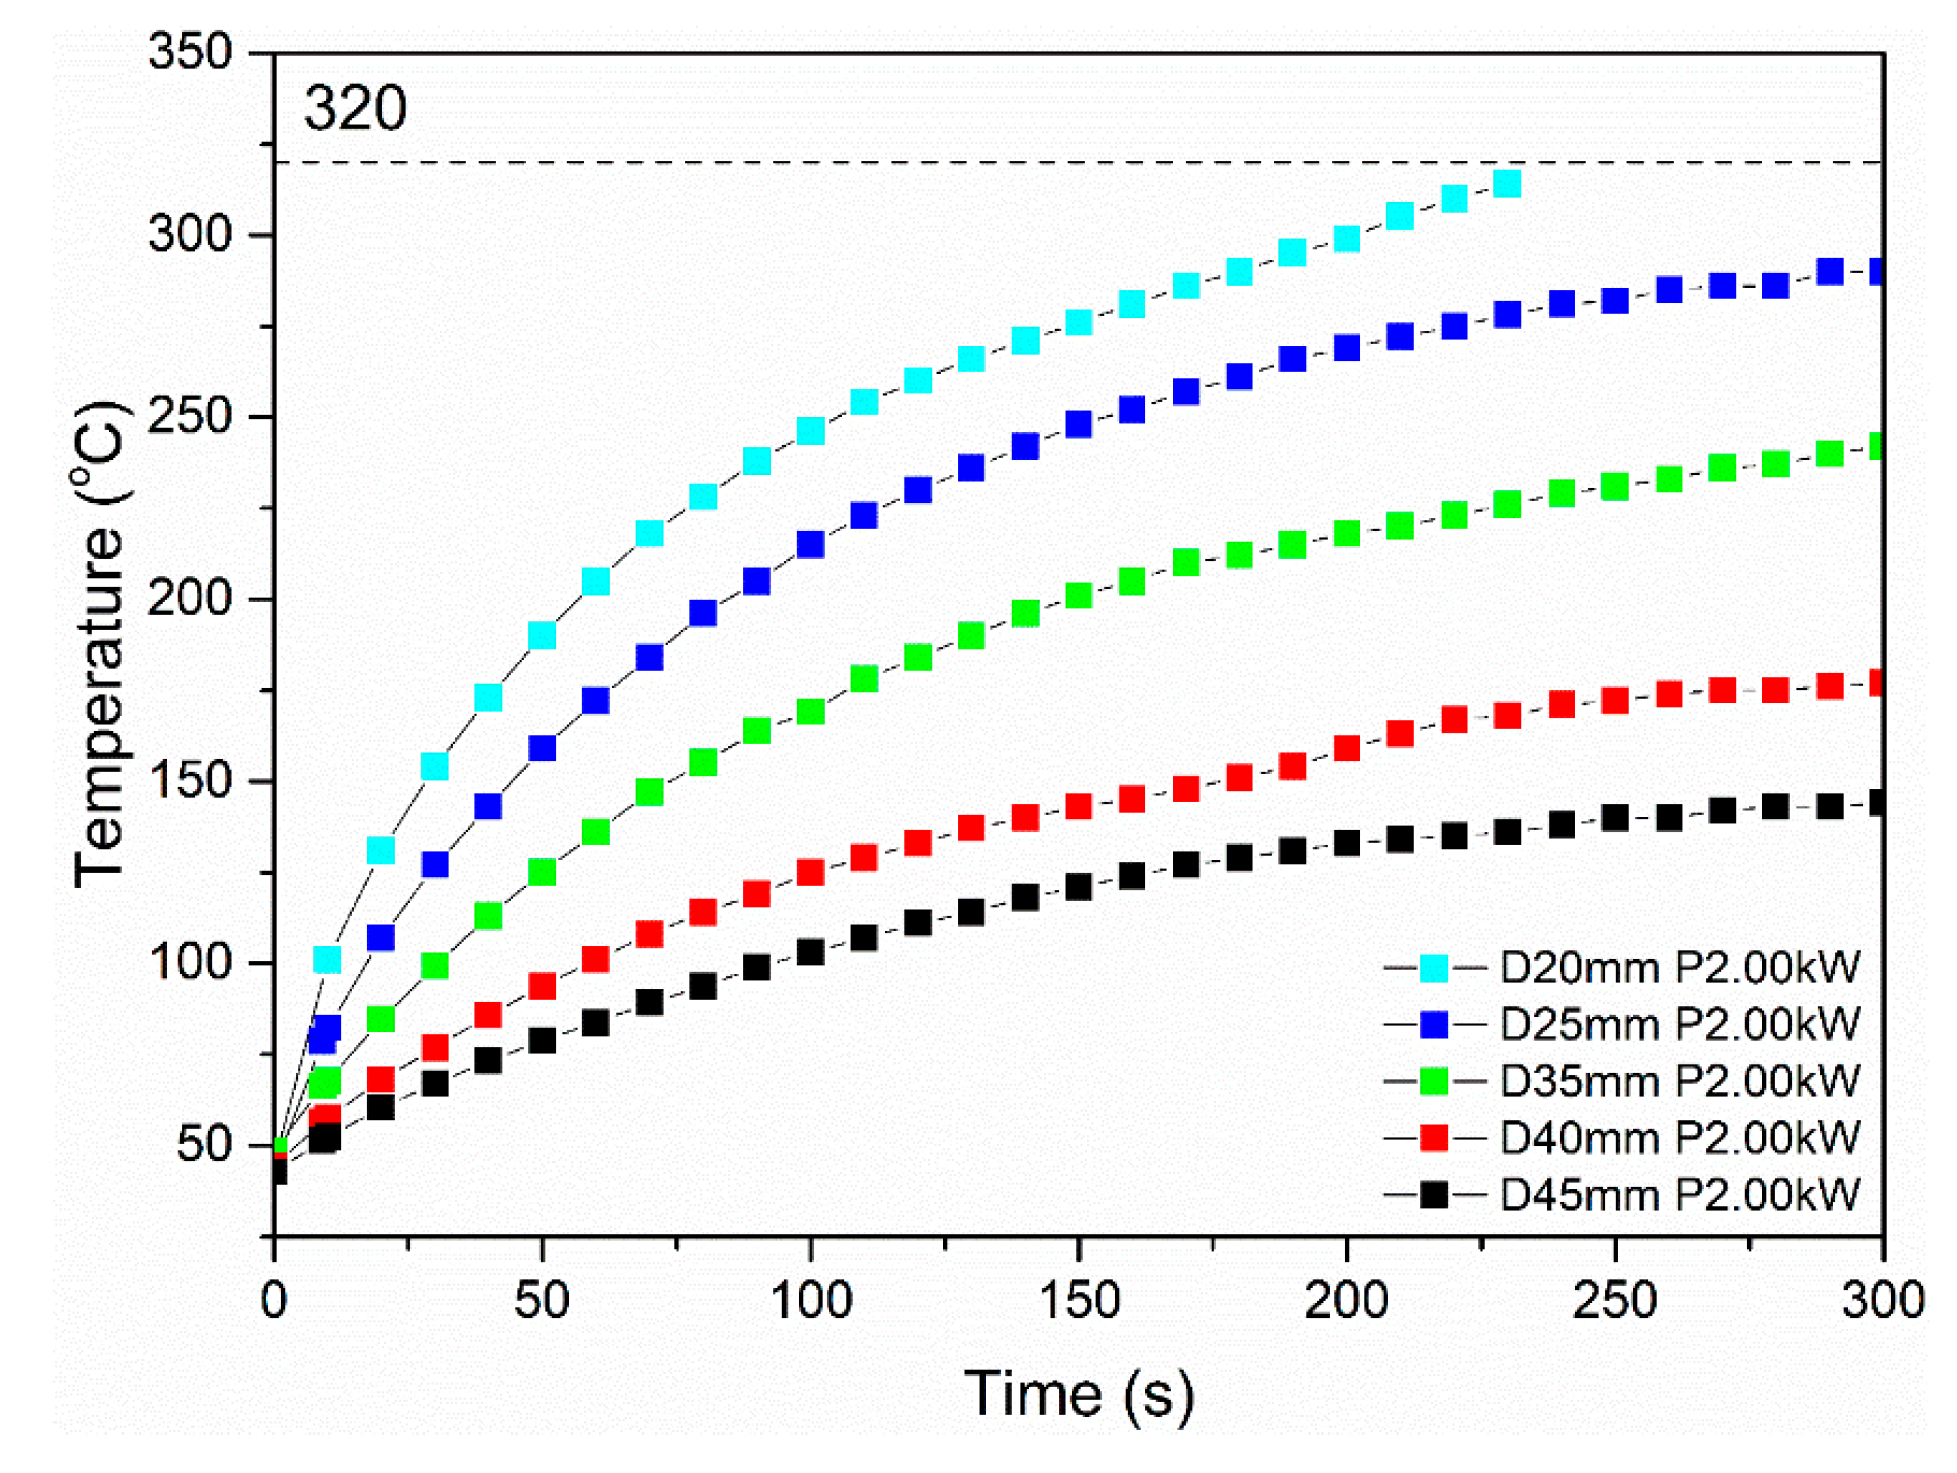
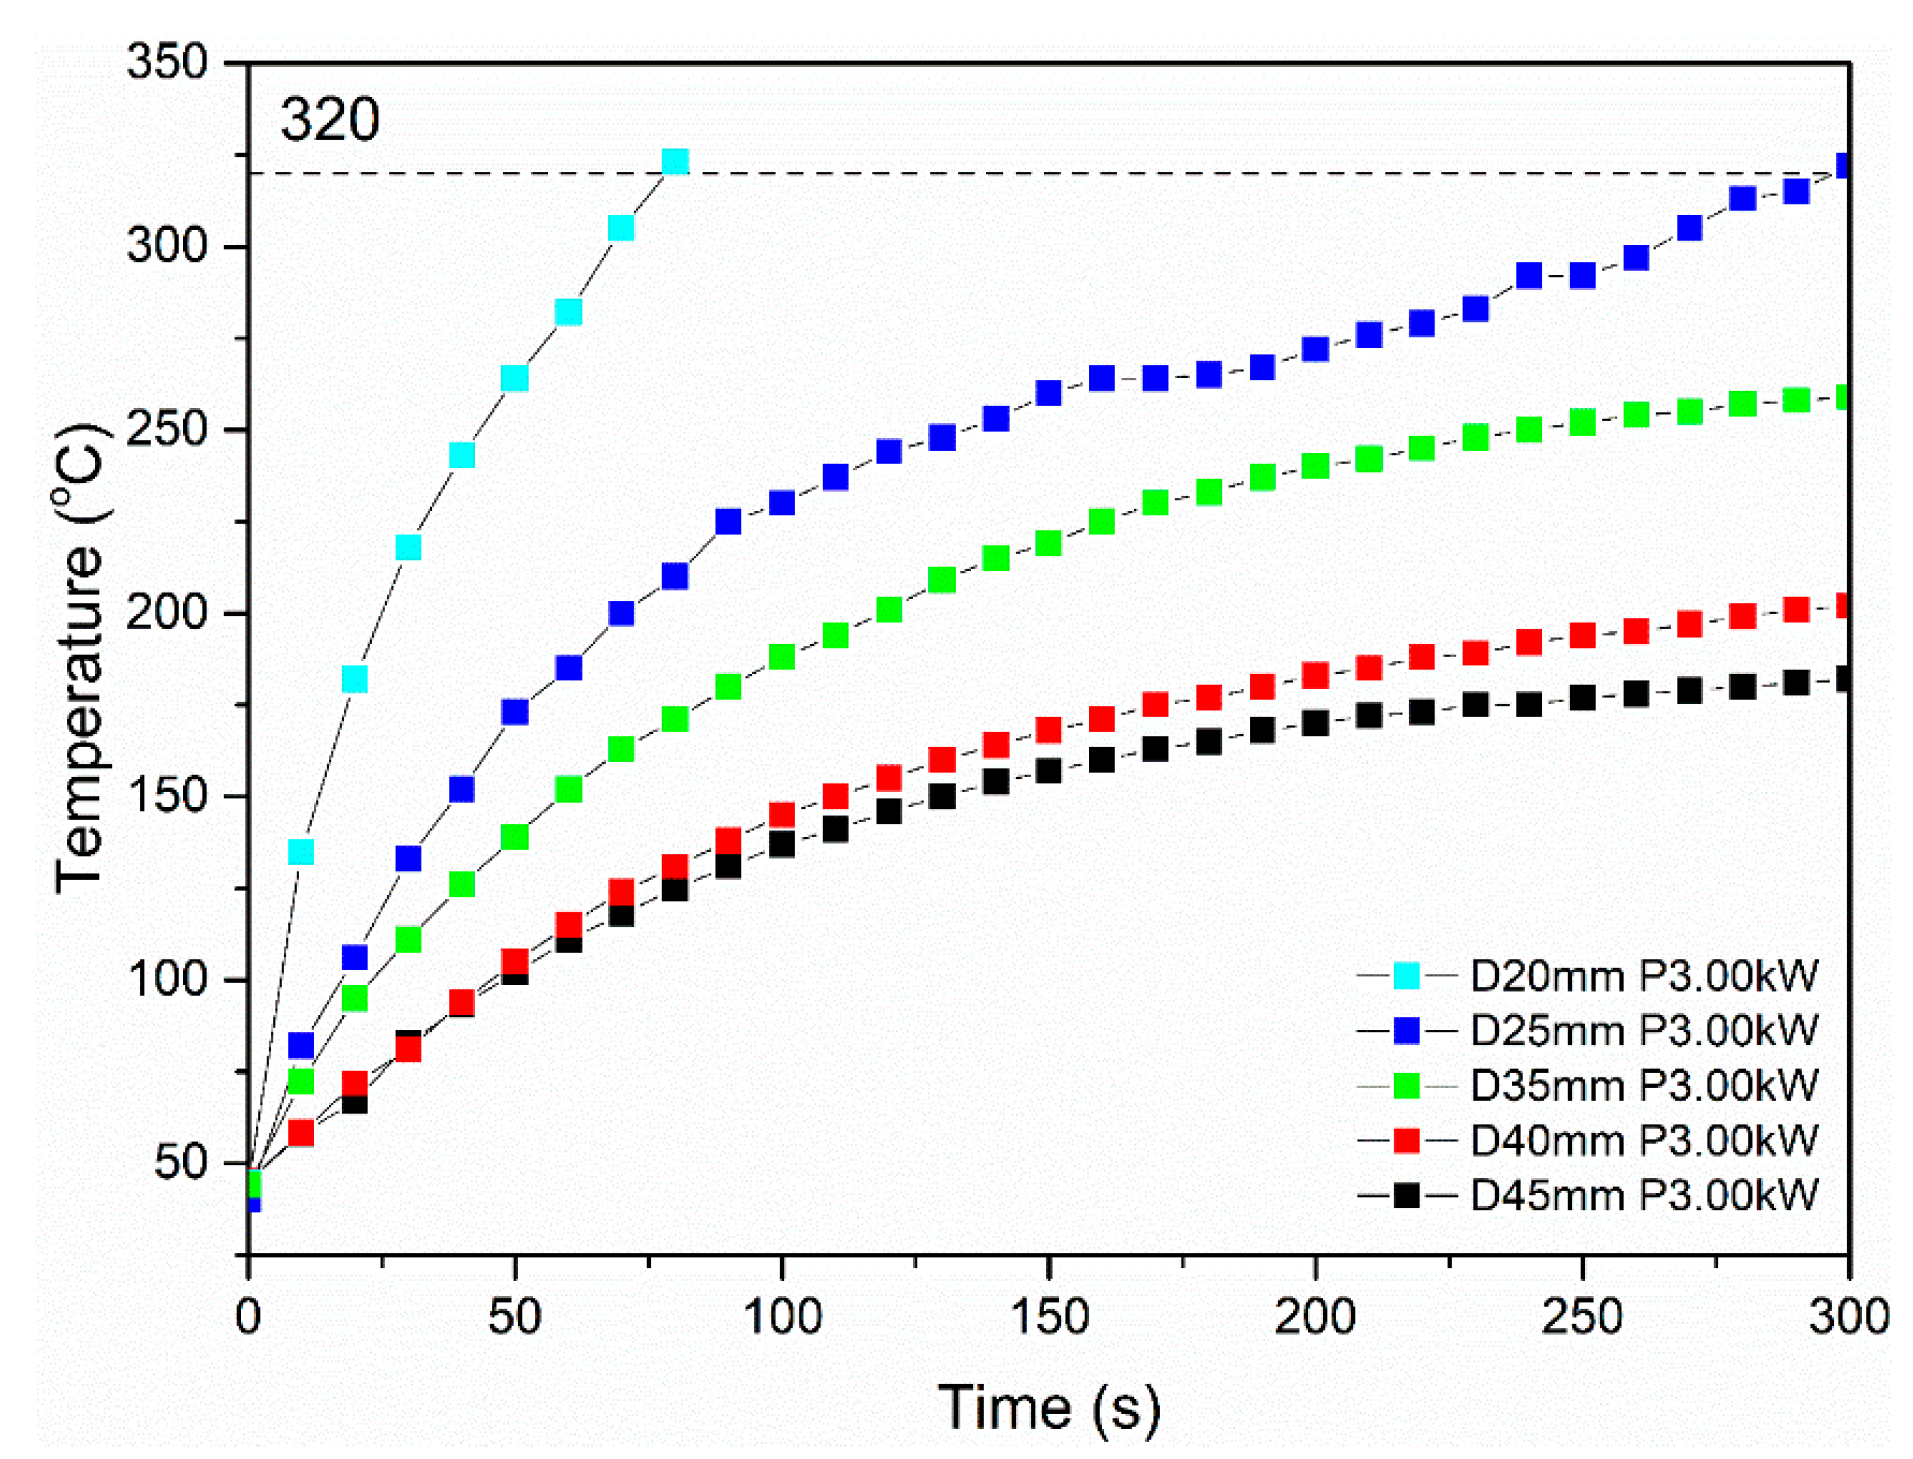
3.4.2. Induction Heating Assessment
Reference Laminate Testing
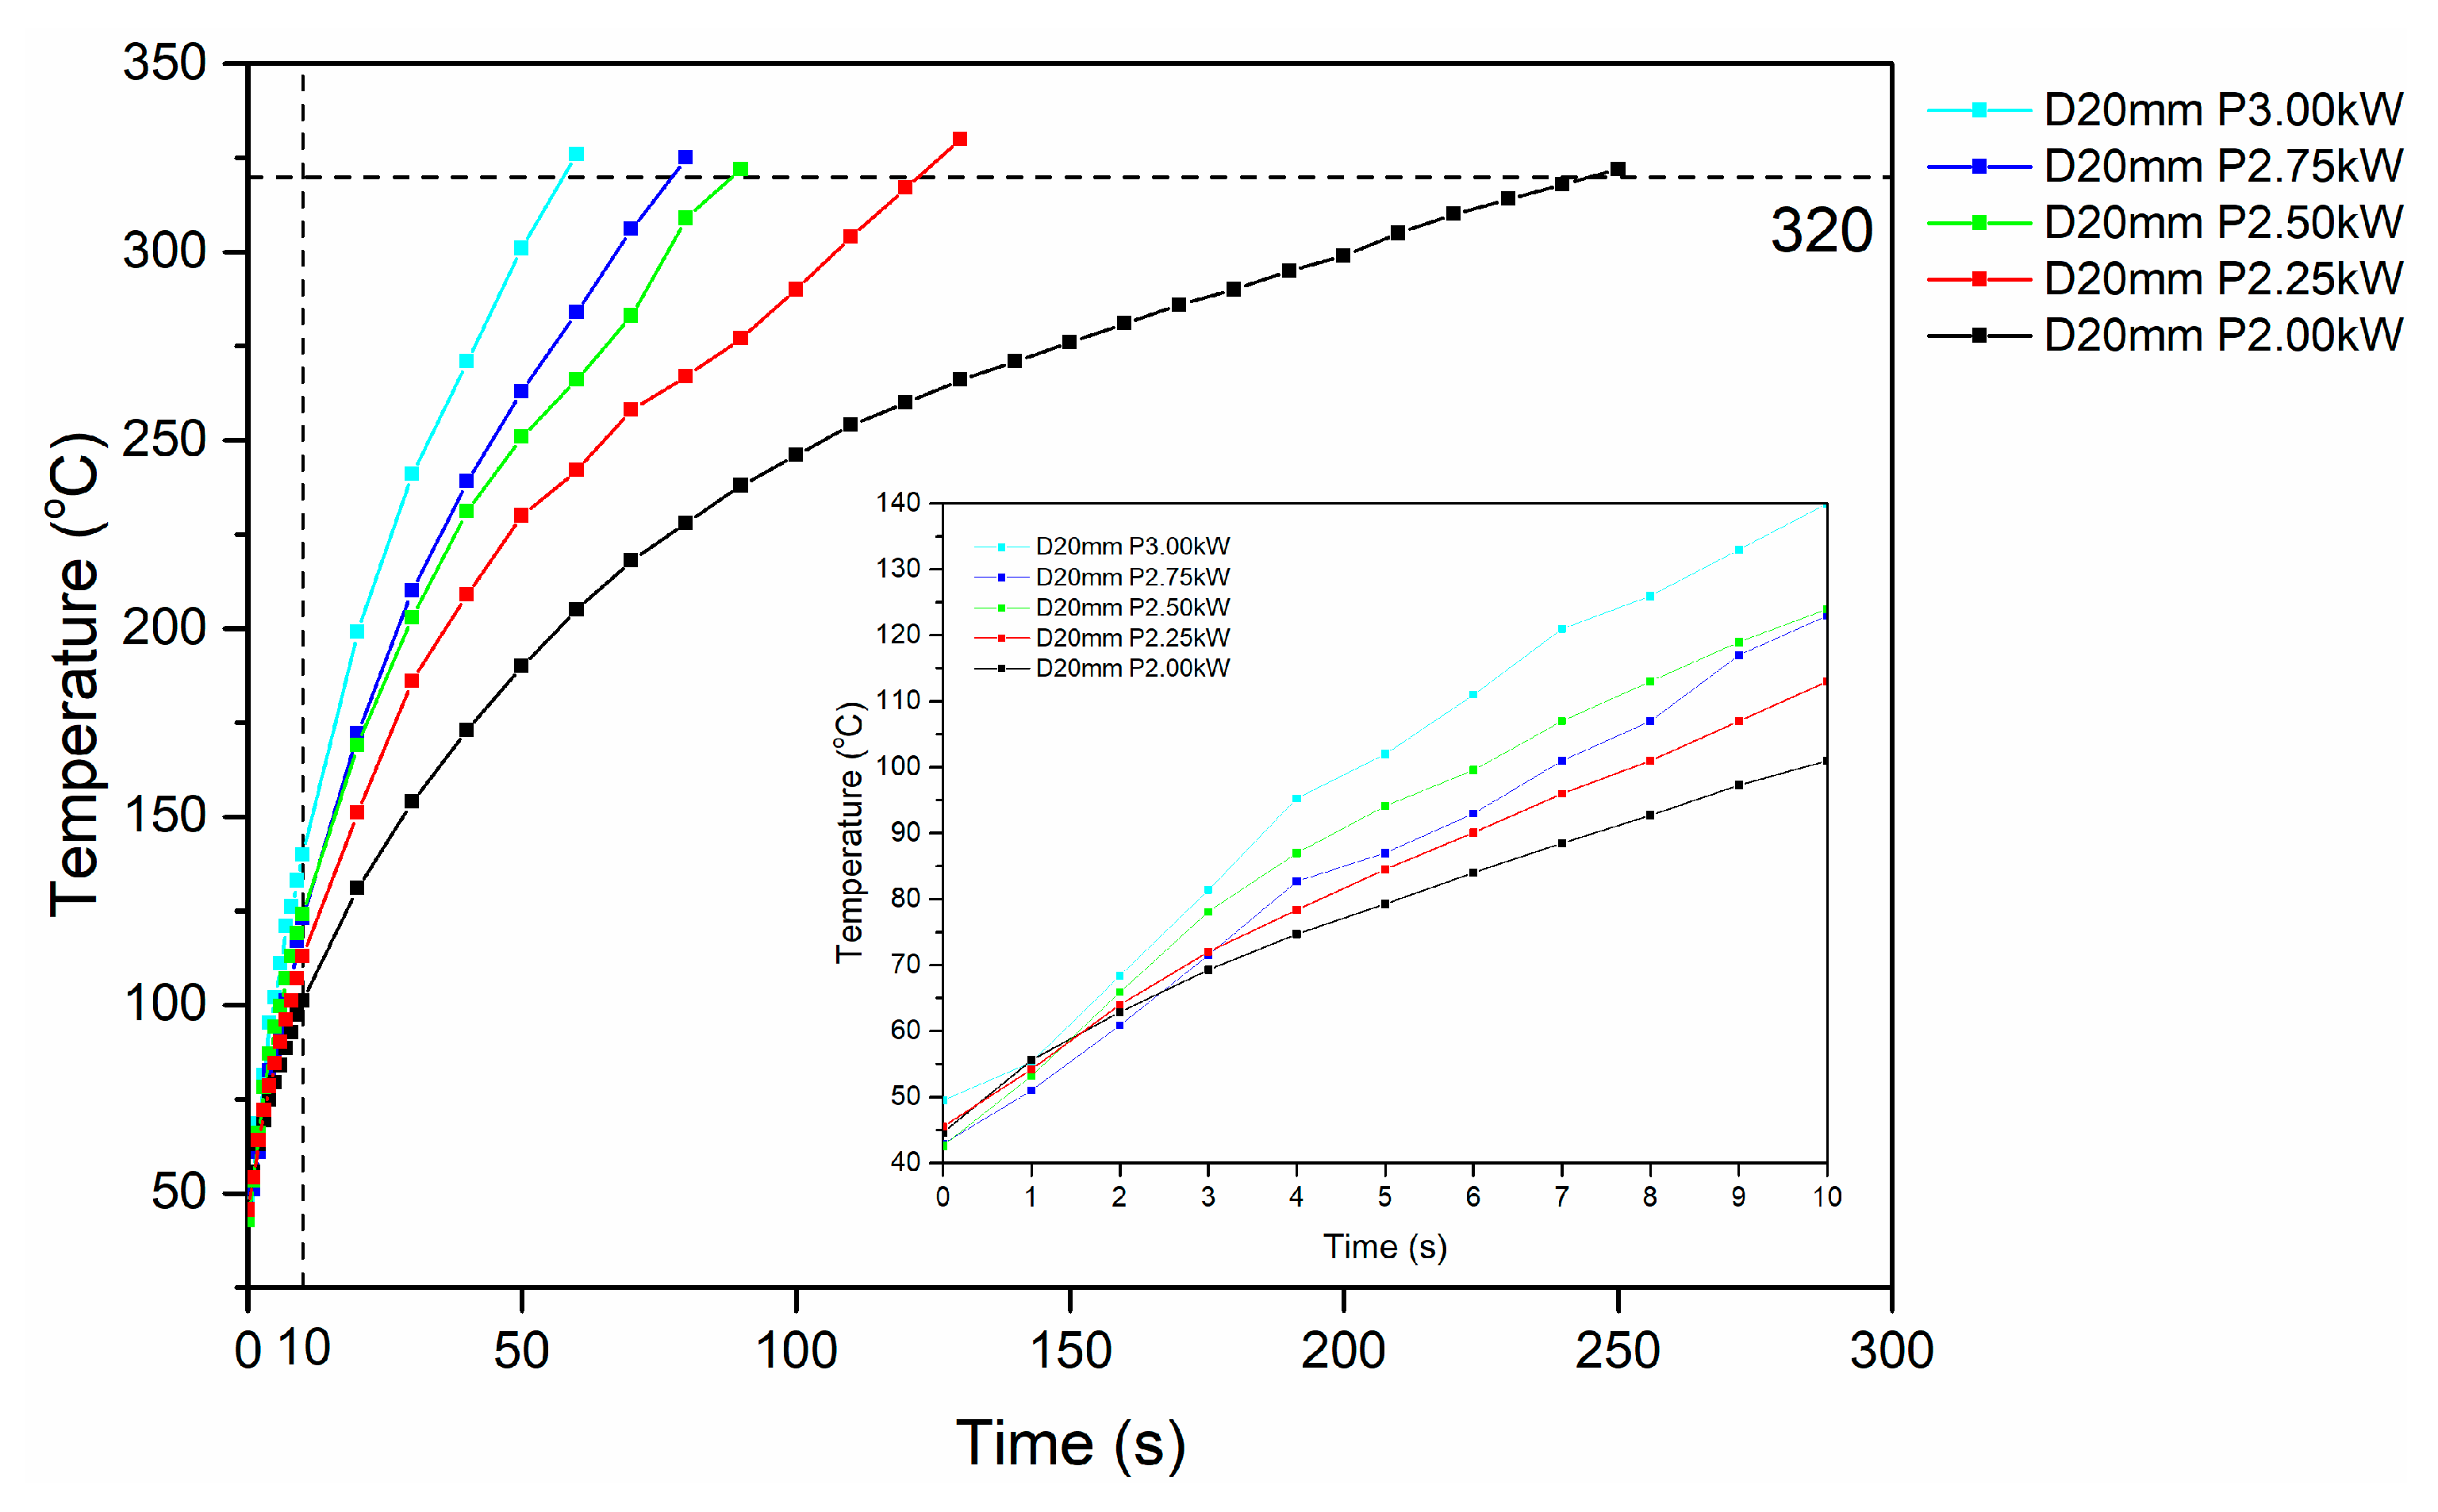
Type I Specimens
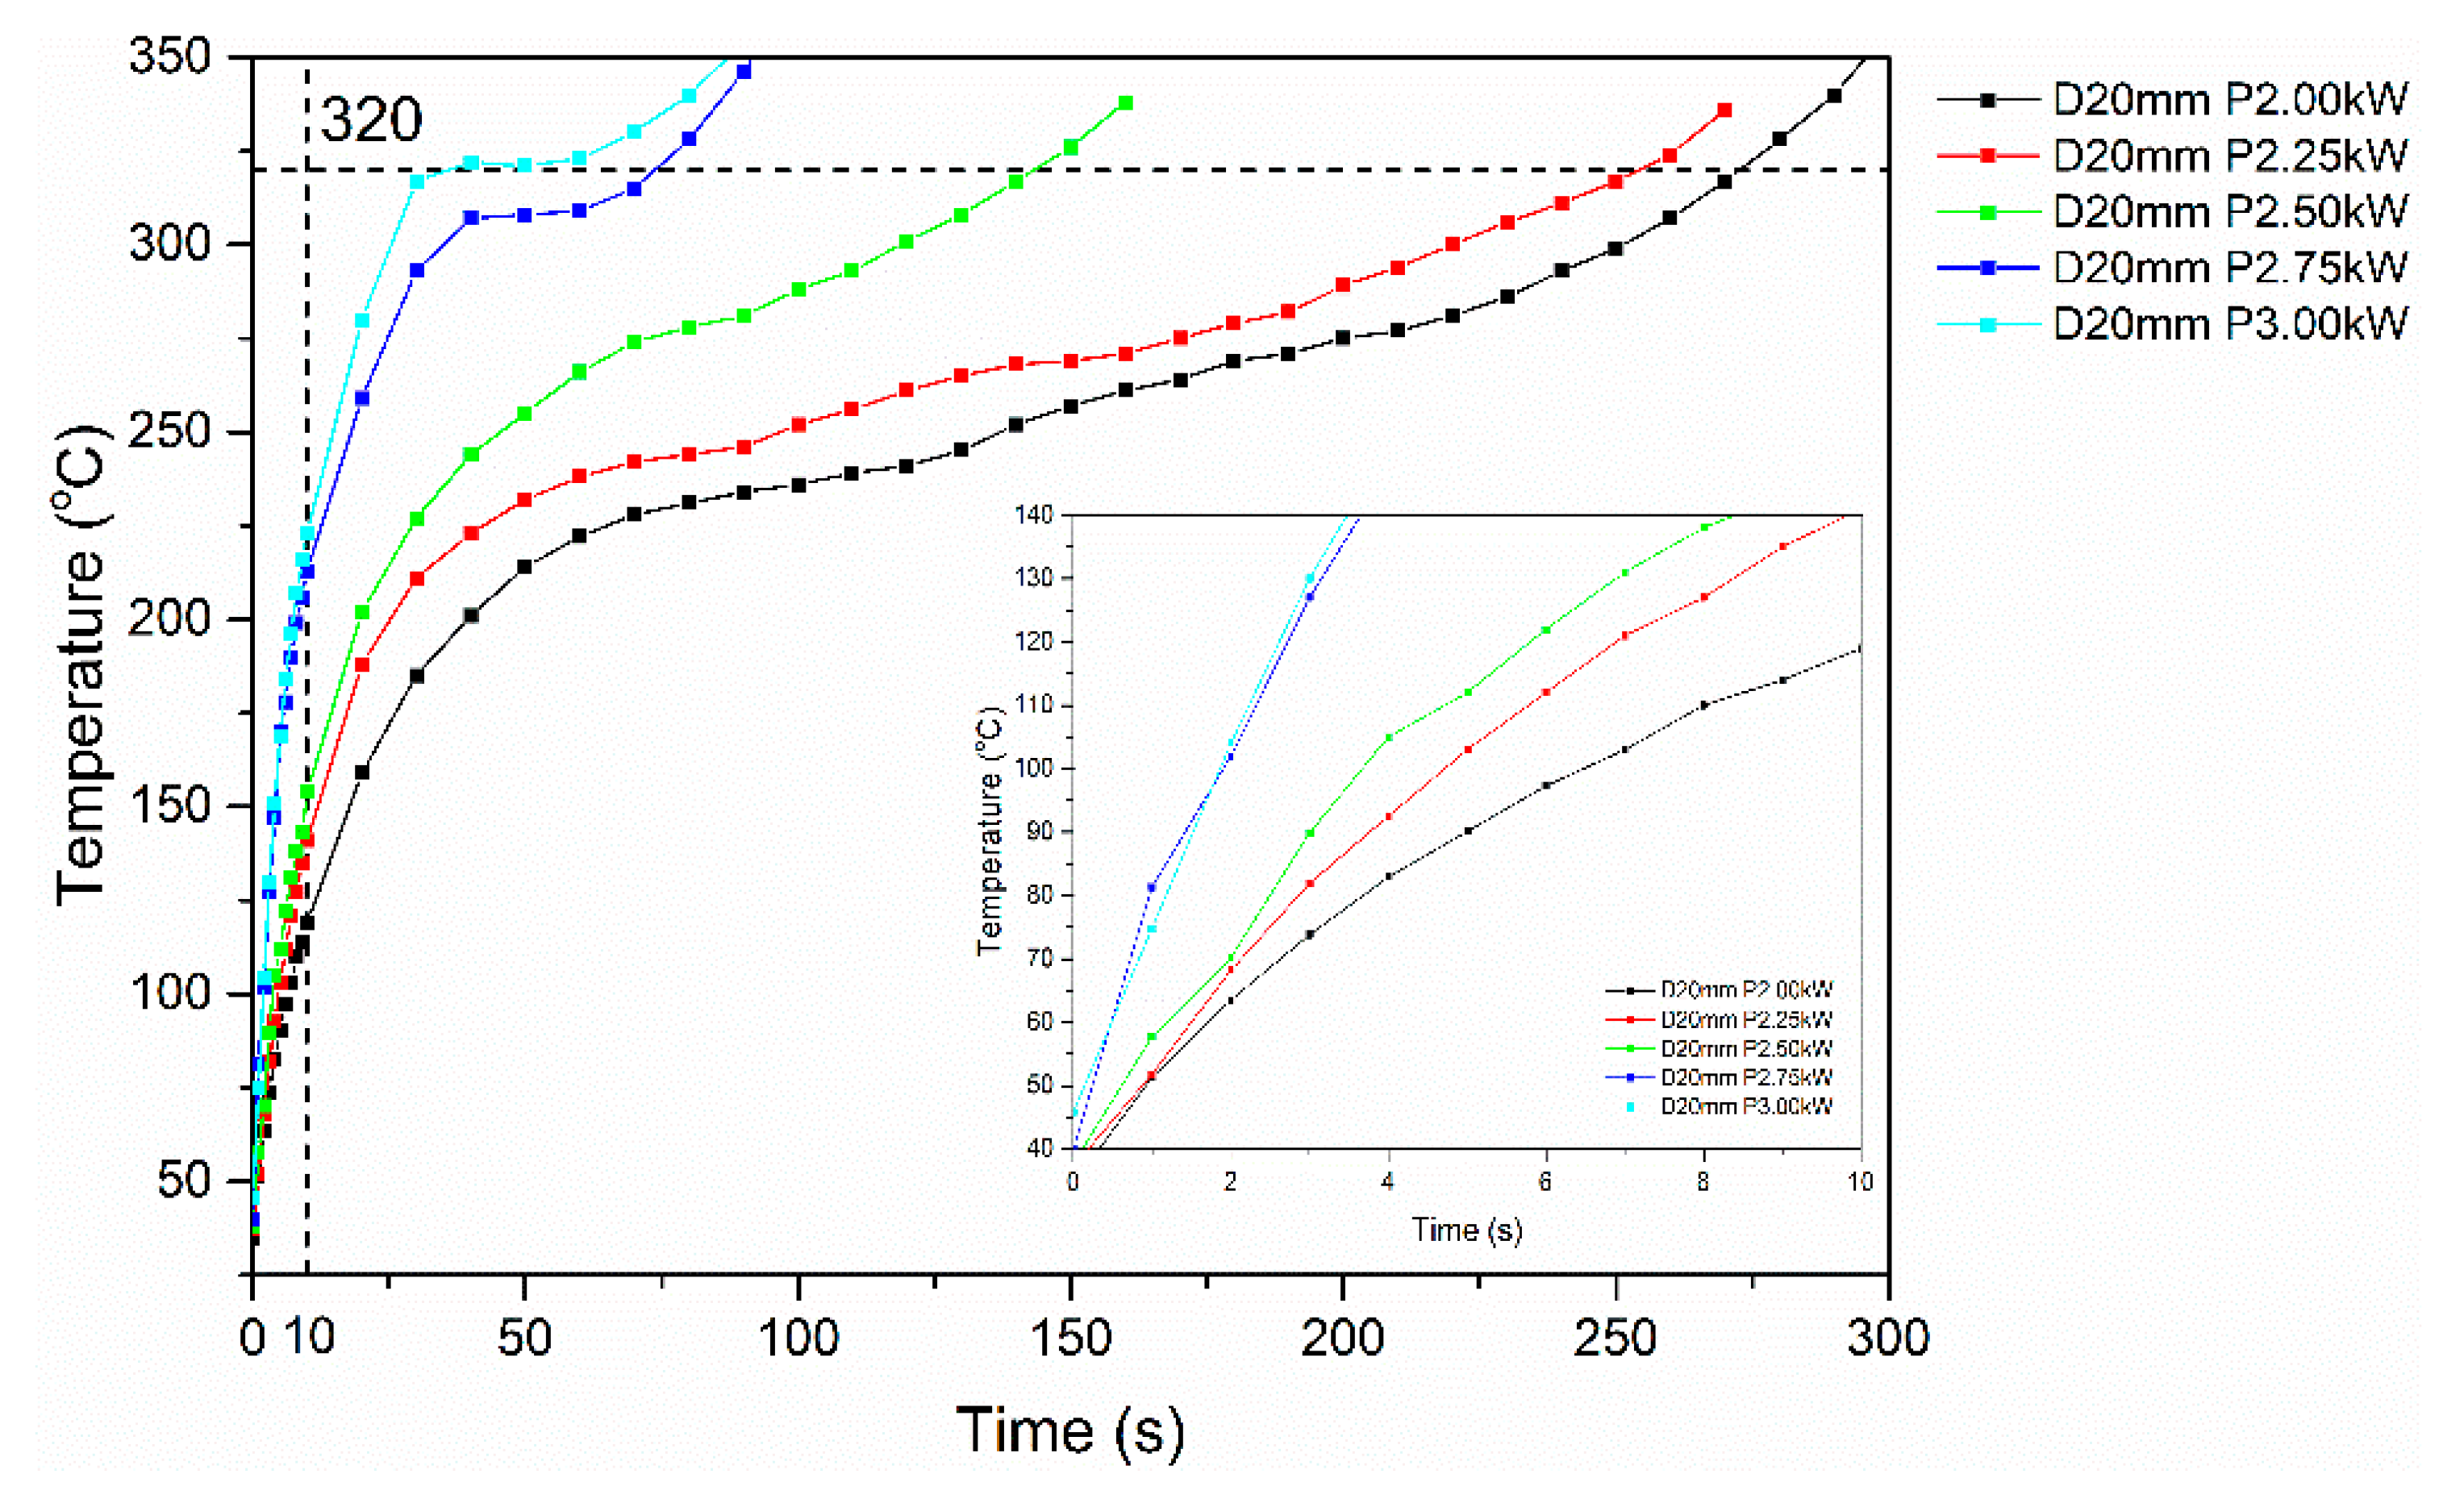
Type II Specimens
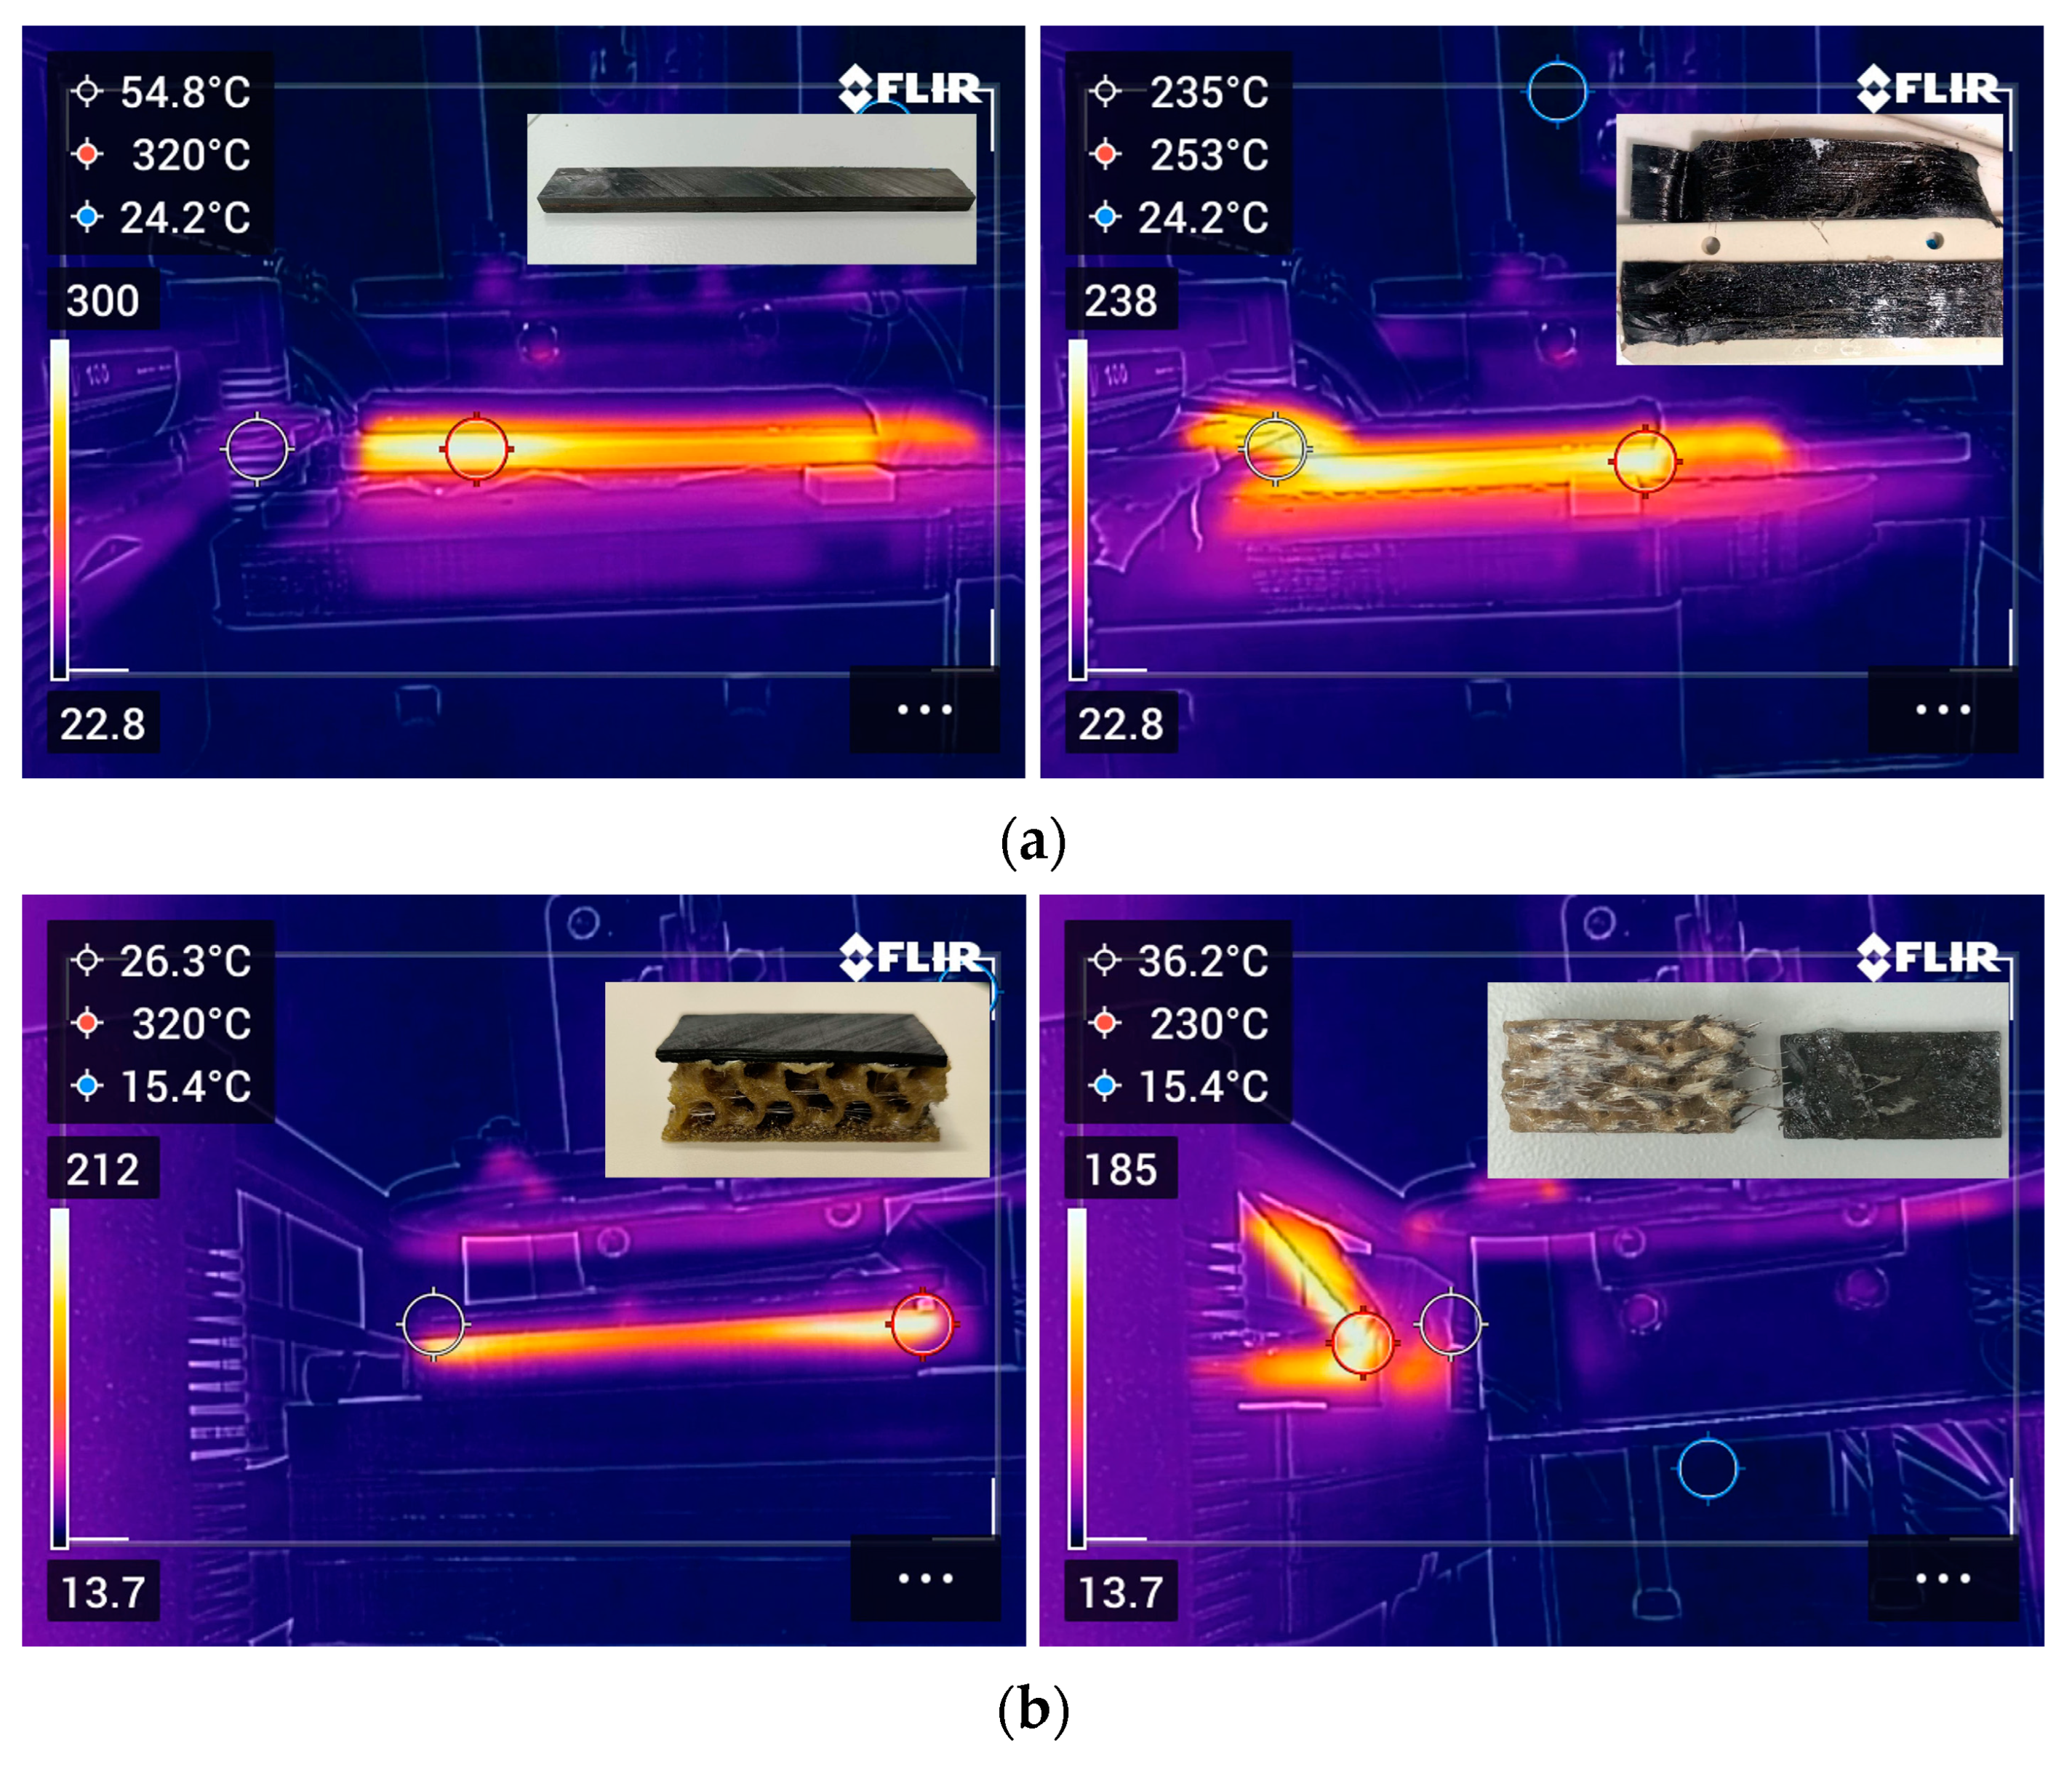
Debonding of Type I and II Specimens and Inspection
4. Conclusions
Author Contributions
Funding
Institutional Review Board Statement
Data Availability Statement
Acknowledgments
Conflicts of Interest
Appendix A

References
- Ozturk, F.; Cobanoglu, M.; Ece, R.E. Recent advancements in thermoplastic composite materials in aerospace industry. J. Thermoplast. Compos. Mater. 2024, 37, 3084–3116. [Google Scholar] [CrossRef]
- Heathman, N.; Koirala, P.; Yap, T.; Emami, A.; Tehrani, M. In situ consolidation of carbon fiber PAEK via laser-assisted automated fiber placement. Compos. Part B Eng. 2023, 249, 110405. [Google Scholar] [CrossRef]
- Yousefpour, A.; Hojjati, M.; Immarigeon, J.-P. Fusion Bonding/Welding of Thermoplastic Composites. J. Thermoplast. Compos. Mater. 2004, 17, 303–341. [Google Scholar] [CrossRef]
- Lambiase, F.; Grossi, V.; Paoletti, A. High-speed joining of hybrid metal-polymer joints during the friction-assisted joining process. Compos. Struct. 2022, 280, 114890. [Google Scholar] [CrossRef]
- Reis, J.P.; de Moura, M.; Samborski, S. Thermoplastic Composites and Their Promising Applications in Joining and Repair Composites Structures: A Review. Materials 2020, 13, 5832. [Google Scholar] [CrossRef]
- O’Shaughnessey, P.G.; Dubé, M.; Villegas, I.F. Modeling and experimental investigation of induction welding of thermoplastic composites and comparison with other welding processes. J. Compos. Mater. 2016, 50, 2895–2910. [Google Scholar] [CrossRef]
- Banea, M.D. Debonding on Demand of Adhesively Bonded Joints. In Progress in Adhesion and Adhesives; Mittal, K.L., Ed.; John Wiley & Sons: Hoboken, NJ, USA, 2020. [Google Scholar] [CrossRef]
- Farahani, R.D.; Dubé, M. Novel Heating Elements for Induction Welding of Carbon Fiber/Polyphenylene Sulfide Thermoplastic Composites. Adv. Eng. Mater. 2017, 19, 1700294. [Google Scholar] [CrossRef]
- Li, M.; Wen, L.; Wang, S.; Liang, J.; Hou, X. Multifactor optimization for induction welding of carbon fiber reinforced thermoplastic composites based on response surface methodology. Polym. Compos. 2024, 45, 4307–4318. [Google Scholar] [CrossRef]
- Tavakoli, M.H.; Karbaschi, H.; Samavat, F. Influence of workpiece height on the induction heating process. Math. Comput. Model. 2011, 54, 50–58. [Google Scholar] [CrossRef]
- Mariani, A.; Malucelli, G. Insights into Induction Heating Processes for Polymeric Materials: An Overview of the Mechanisms and Current Applications. Energies 2023, 16, 4535. [Google Scholar] [CrossRef]
- Yu, X.; Yang, R.; Wu, C.; Liu, B.; Zhang, W. The heating efficiency of magnetic nanoparticles under an alternating magnetic field. Sci. Rep. 2022, 12, 16055. [Google Scholar] [CrossRef]
- Dutz, S.; Hergt, R. Magnetic nanoparticle heating and heat transfer on a microscale: Basic principles, realities and physical limitations of hyperthermia for tumour therapy. Int. J. Hyperth. 2013, 29, 790–800. [Google Scholar] [CrossRef] [PubMed]
- Raczka, T.; Wolf, A.; Reichstein, J.; Stauch, C.; Schug, B.; Müssig, S.; Mandel, K. Influence of magnetic interactions in iron oxide nanoparticle polymer composites on magnetism and induction heating. J. Magn. Magn. Mater. 2024, 598, 172042. [Google Scholar] [CrossRef]
- Eggeman, A.S.; Majetich, S.A.; Farrell, D.; Pankhurst, Q.A. Size and Concentration Effects on High Frequency Hysteresis of Iron Oxide Nanoparticles. IEEE Trans. Magn. 2007, 43, 2451–2453. [Google Scholar] [CrossRef]
- Malik, S.; Muhammad, K.; Waheed, Y. Nanotechnology: A Revolution in Modern Industry. Molecules 2023, 28, 661. [Google Scholar] [CrossRef]
- Nasrollahzadeh, M.; Sajadi, S.M.; Sajjadi, M.; Issaabadi, Z. Chapter 4—Applications of Nanotechnology in Daily Life. Interface Sci. Technol. 2019, 28, 113–143. [Google Scholar] [CrossRef]
- Sadeghzade, S.; Hooshiar, M.H.; Akbari, H.; Tajer, M.H.M.; Sahneh, K.K.; Ziaei, S.Y.; Jalali, F.; Akouchakian, E. Recent advances in Organ-on-a-Chip models: How precision engineering integrates cutting edge technologies in fabrication and characterization. Appl. Mater. Today 2024, 38, 102231. [Google Scholar] [CrossRef]
- Martin, R.G.; Johansson, C.; Tavares, J.R.; Dubé, M. Manufacturing of thermoplastic composite sandwich panels using induction welding under vacuum. Compos. Part A Appl. Sci. Manuf. 2024, 182, 108211. [Google Scholar] [CrossRef]
- Garaio, E.; Collantes, J.M.; Garcia, J.A.; Plazaola, F.; Mornet, S.; Couillaud, F.; Sandre, O. A wide-frequency range AC magnetometer to measure the specific absorption rate in nanoparticles for magnetic hyperthermia. J. Magn. Magn. Mater. 2014, 368, 432–437. [Google Scholar] [CrossRef]
- Díez, A.G.; Rincón-Iglesias, M.; Lanceros-Méndez, S.; Reguera, J.; Lizundia, E. Multicomponent magnetic nanoparticle engineering: The role of structure-property relationship in advanced applications. Mater. Today Chem. 2022, 26, 101220. [Google Scholar] [CrossRef]
- Bayerl, T.; Duhovic, M.; Mitschang, P.; Bhattacharyya, D. The heating of polymer composites by electromagnetic induction—A review. Compos. Part A Appl. Sci. Manuf. 2014, 57, 27–40. [Google Scholar] [CrossRef]
- Obaidat, I.M.; Issa, B.; Haik, Y. Magnetic Properties of Magnetic Nanoparticles for Efficient Hyperthermia. Nanomaterials 2015, 5, 63–89. [Google Scholar] [CrossRef]
- Mohapatra, J.; Xing, M.; Liu, J.P. Inductive Thermal Effect of Ferrite Magnetic Nanoparticles. Materials 2019, 12, 3208. [Google Scholar] [CrossRef] [PubMed]
- Almind, M.R.; Vinum, M.G.; Wismann, S.T.; Hansen, M.F.; Vendelbo, S.B.; Engbæk, J.S.; Mortensen, P.M.; Chorkendorff, I.; Frandsen, C. Optimized CoNi Nanoparticle Composition for Curie-Temperature-Controlled Induction-Heated Catalysis. ACS Appl. Nano Mater. 2021, 4, 11537–11544. [Google Scholar] [CrossRef]
- Fantechi, E.; Innocenti, C.; Albino, M.; Lottini, E.; Sangregorio, C. Influence of cobalt doping on the hyperthermic efficiency of magnetite nanoparticles. J. Magn. Magn. Mater. 2015, 380, 365–371. [Google Scholar] [CrossRef]
- Bae, D.H.; Shon, M.Y.; Oh, S.T.; Kim, G.N. Study on the Heating Behavior of Fe3O4-Embedded Thermoplastic Polyurethane Adhesive Film via Induction heating. Bull. Korean Chem. Soc. 2016, 37, 1211–1218. [Google Scholar] [CrossRef]
- Bae, D.; Shin, P.; Kwak, S.; Moon, M.; Shon, M.; Oh, S.; Kim, G. Heating behavior of ferromagnetic Fe particle-embedded thermoplastic polyurethane adhesive film by induction heating. J. Ind. Eng. Chem. 2015, 30, 92–97. [Google Scholar] [CrossRef]
- Baek, I.; Lee, S. A Study of Films Incorporating Magnetite Nanoparticles as Susceptors for Induction Welding of Carbon Fiber Reinforced Thermoplastic. Materials 2020, 13, 318. [Google Scholar] [CrossRef]
- Cheng, X.; Zhou, Y.; Charles, A.D.M.; Yu, Y.; Islam, M.S.; Peng, S.; Wang, J.; Rider, A.N.; Lim, M.; Timchenko, V.; et al. Enabling contactless rapid on-demand debonding and rebonding using hysteresis heating of ferrimagnetic nanoparticles. Mater. Des. 2021, 210, 10076. [Google Scholar] [CrossRef]
- Alvarez, E.M.; Quintana González, S.A.; Lopez Taborda, L.L.; Niebles Nuñez, E.E. Experimental study of adhesive joints with mechanical interlocking of acrylonitrile butadiene styrene (ABS) parts fabricated for fused filament (FFF). Rapid Prototyp. J. 2023, 29, 1984–2000. [Google Scholar] [CrossRef]
- Frascio, M.; Moroni, F.; Marques, E.; Carbas, R.; Reis, M.; Monti, M.; Avalle, M.; da Silva, L.F.M. Feasibility study on hybrid weld-bonded joints using additive manufacturing and conductive thermoplastic filament. J. Adv. Join. Process. 2021, 3, 100046. [Google Scholar] [CrossRef]
- Marques, J.; Barbosa, A.; da Silva, C.; Carbas, R.; da Silva, L. An overview of manufacturing functionally graded adhesives—Challenges and prospects. J. Adhes. 2019, 97, 172–206. [Google Scholar] [CrossRef]
- Ecker, J.; Liska, R.; Stampfl, J. Design for disassembly: Using a multi-material approach in 3D printing for easier recycling strategies. Addit. Manuf. 2024, 92, 104394. [Google Scholar] [CrossRef]
- Galarreta-Rodriguez, I.; Lopez-Ortega, A.; Garayo, E.; Beato-López, J.J.; La Roca, P.; Sanchez-Alarcos, V.; Recarte, V.; Gómez-Polo, C.; Pérez-Landazábal, J.I. Magnetically activated 3D printable polylactic acid/polycaprolactone/magnetite composites for magnetic induction heating generation. Adv. Compos. Hybrid Mater. 2023, 6, 102. [Google Scholar] [CrossRef]
- Kanidi, M.; Loura, N.; Frengkou, A.; Milickovic, T.K.; Trompeta, A.-F.; Charitidis, C. Inductive Thermal Effect on Thermoplastic Nanocomposites with Magnetic Nanoparticles for Induced-Healing, Bonding and Debonding On-Demand Applications. J. Compos. Sci. 2023, 7, 74. [Google Scholar] [CrossRef]
- Digital Method for Improved Manufacturing of Next-Generation MultIfuNctIOnal Airframe Parts H2020 DOMMINIO Project, (.G.A. No. 101007022). Available online: https://cordis.europa.eu/project/id/101007022 (accessed on 6 September 2024). [CrossRef]
- Lundström, F.; Frogner, K.; Andersson, M. Numerical modelling of CFRP induction heating using temperature-dependent material properties. Compos. Part B Eng. 2021, 220, 108982. [Google Scholar] [CrossRef]
- Griffiths, P.; Coativy, G.; Dalmas, F.; Falco, G.; Jiang, L.; Xiang, Z.; Le, M.-Q.; Ducharne, B.; Le Roy, D.; Méchin, F.; et al. Ultrafast Remote Healing of Magneto-Responsive Thermoplastic Elastomer-Based Nanocomposites. Macromolecules 2022, 55, 831–843. [Google Scholar] [CrossRef]
- Bermúdez, A.; Gómez, D.; Muñiz, M.C.; Salgado, P. Transient numerical simulation of a thermoelectrical problem in cylindrical induction heating furnaces. Adv. Comput. Math. 2007, 26, 39–62. [Google Scholar] [CrossRef]
- Amirjani, A.; Sadrnezhaad, S.K. Computational electromagnetics in plasmonic nanostructures. J. Mater. Chem. C 2021, 9, 9791–9819. [Google Scholar] [CrossRef]
- Díaz-García, Á.; Law, J.Y.; Cota, A.; Bellido-Correa, A.; Ramírez-Rico, J.; Schäfer, V.; Franco, R. Novel procedure for laboratory scale production of composite functional filaments for additive manufacturing. Mater. Today Commun. 2020, 24, 101049. [Google Scholar] [CrossRef]
- Choupin, T.; Fayolle, B.; Régnier, G.; Paris, C.; Cinquin, J.; Brulé, B. Macromolecular modifications of poly(etherketoneketone) (PEKK) copolymer at the melting state. Polym. Degrad. Stab. 2018, 155, 103–110. [Google Scholar] [CrossRef]
- Kunc, V.; Kishore, V.; Chen, X.; Ajinjeru, C.; Duty, C.; Hassen, A.A. High Performance Poly(Etherketoneketone) (PEKK) Composite Parts Fabricated Using Big Area Additive Manufacturing (BAAM) Processes; U.S. Department of Energy Office of Scientific and Technical Information Technical Report, 2016 United States; Oak Ridge National Lab.: Oak Ridge, TN, USA, 2016. [Google Scholar] [CrossRef]
- Martin, R.G.; Johansson, C.; Tavares, J.R.; Dubé, M. Material Selection Methodology for an Induction Welding Magnetic Susceptor Based on Hysteresis Losses. Adv. Eng. Mater. 2022, 24, 2100877. [Google Scholar] [CrossRef]


| Zone | 2 | 3 | 4 | 5 | 6 | 7 | 8 | Die | Melt Pump |
| Temp. (°C) | 290 | 320 | 325 | 330 | 335 | 335 | 340 | 340 | 335 |
| Screw Speed (rpm) | 340 | Melt Pump Speed (rpm) | 15 | Gravimetric Feeder Speed (rpm) | 10 | ||||
| Type I Specimens | Type II Specimens | |
|---|---|---|
| Process sequence | AFP → FFF → AFP | AFP → FFF → FFF |
| Cross section schematic | 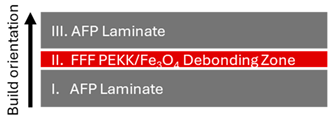 |  |
| Cross section image (scale bar: 2.5 mm) |  | 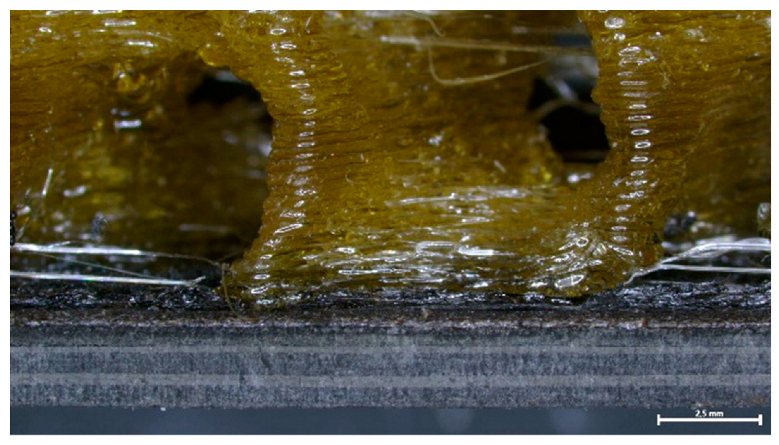 |
| Design | AFP laminate stacking sequence: [45/0/135/0/0/135/90/45/0]s Consolidated AFP laminate thickness: 2.7 mm FFF debonding zone thickness: 0.6 mm | AFP laminate stacking sequence: [−45/45/0/0/90/90/45/−45]s Consolidated AFP laminate thickness: 2.45 mm FFF debonding zone thickness: 0.6 mm FFF gyroid lattice unit size: 15 mm |
| W × D × H | 100 mm × 20 mm × 6 mm | 80 mm × 25 mm × 18 mm |
| Control Factor | Units | Levels | Response Variables | ||||
|---|---|---|---|---|---|---|---|
| Generator power (P) | kW | 2 | 2.25 | 2.5 | 2.75 | 3 |
|
| Frequency | kHz | 415 | 414 | 414 | 413 | 412 | |
| Current (rms) | A | 302 | 322 | 341 | 350 | 376 | |
| Voltage | V | 354 | 377 | 400 | 413 | 442 | |
| Standoff distance (D) | mm | 20 | 25 | 35 | 40 | 45 | |
| Sample | DSC Scan 2 | TGA | ||||||
|---|---|---|---|---|---|---|---|---|
| Cooling | Heating | |||||||
| Tc (°C) | ΔHc (J/g) | Tg (°C) | Tcc (°C) | ΔHcc (J/g) | Tm (°C) | ΔHm (J/g) | To/95% (°C) | |
| S1 | - | 0 | 159 | 262 | 5 | 307 | 6 | 520.5 |
| S2 | 221 | 1 | 159 | 261 | 4 | 306 | 7 | 529.6 |
| S3 | - | 0 | 159 | 263 | 3 | 307 | 4 | 523.2 |
| Type I/D = 20 mm | P = 2.00 kW | P = 2.25 kW | P = 2.50 kW | P = 2.75 kW | P = 3.00 kW |
| Initial heating rate [t = 0–10 s] (°C/s) | 5.3 ± 0.3 | 6.5 ± 0.2 | 8.0 ± 0.4 | 7.9 ± 0.3 | 9.4 ± 0.4 |
| Time to reach debonding T > 320 °C (s) | 250 | 130 | 90 | 80 | 60 |
| Type II/D = 20 mm | P = 2.00 kW | P = 2.25 kW | P = 2.50 kW | P = 2.75 kW | P = 3.00 kW |
| Initial heating rate [t = 0–10 s] (°C/s) | 8.0 ± 0.5 | 10.2 ± 0.5 | 11.1 ± 0.7 | 16.5 ± 1.5 | 17.5 ± 1.3 |
| Time to reach debonding T > 320 °C (s) | 270 | 250 | 140 | 70 | 40 |
Disclaimer/Publisher’s Note: The statements, opinions and data contained in all publications are solely those of the individual author(s) and contributor(s) and not of MDPI and/or the editor(s). MDPI and/or the editor(s) disclaim responsibility for any injury to people or property resulting from any ideas, methods, instructions or products referred to in the content. |
© 2024 by the authors. Licensee MDPI, Basel, Switzerland. This article is an open access article distributed under the terms and conditions of the Creative Commons Attribution (CC BY) license (https://creativecommons.org/licenses/by/4.0/).
Share and Cite
Gkartzou, E.; Zafeiris, K.; Tsirogiannis, C.; Pedreira, A.; Rodríguez, A.; Romero-Rodriguez, P.; Gakis, G.P.; Kosanovic-Milickovic, T.; Kyritsis, A.; Charitidis, C.A. Induction Heating of Laminated Composite Structures with Magnetically Responsive Nanocomposite Interlayers for Debonding-on-Demand Applications. Polymers 2024, 16, 2760. https://doi.org/10.3390/polym16192760
Gkartzou E, Zafeiris K, Tsirogiannis C, Pedreira A, Rodríguez A, Romero-Rodriguez P, Gakis GP, Kosanovic-Milickovic T, Kyritsis A, Charitidis CA. Induction Heating of Laminated Composite Structures with Magnetically Responsive Nanocomposite Interlayers for Debonding-on-Demand Applications. Polymers. 2024; 16(19):2760. https://doi.org/10.3390/polym16192760
Chicago/Turabian StyleGkartzou, Eleni, Konstantinos Zafeiris, Christos Tsirogiannis, Alberto Pedreira, Adrián Rodríguez, Pablo Romero-Rodriguez, Giorgos P. Gakis, Tatjana Kosanovic-Milickovic, Apostolos Kyritsis, and Costas A. Charitidis. 2024. "Induction Heating of Laminated Composite Structures with Magnetically Responsive Nanocomposite Interlayers for Debonding-on-Demand Applications" Polymers 16, no. 19: 2760. https://doi.org/10.3390/polym16192760
APA StyleGkartzou, E., Zafeiris, K., Tsirogiannis, C., Pedreira, A., Rodríguez, A., Romero-Rodriguez, P., Gakis, G. P., Kosanovic-Milickovic, T., Kyritsis, A., & Charitidis, C. A. (2024). Induction Heating of Laminated Composite Structures with Magnetically Responsive Nanocomposite Interlayers for Debonding-on-Demand Applications. Polymers, 16(19), 2760. https://doi.org/10.3390/polym16192760