


The Preparation of Acryloxyl Group Functionalized Siloxane Polymers and the Study of Their Ultra Violet Curing Properties

 ,
,
Abstract

1. Introduction
2. Materials and Methods
2.1. Raw Materials
2.2. Characterization and Instruments
2.3. Preparation of DAEP-PDMS, MAEP-PDMS, and DBABP-PDMS Oligomers
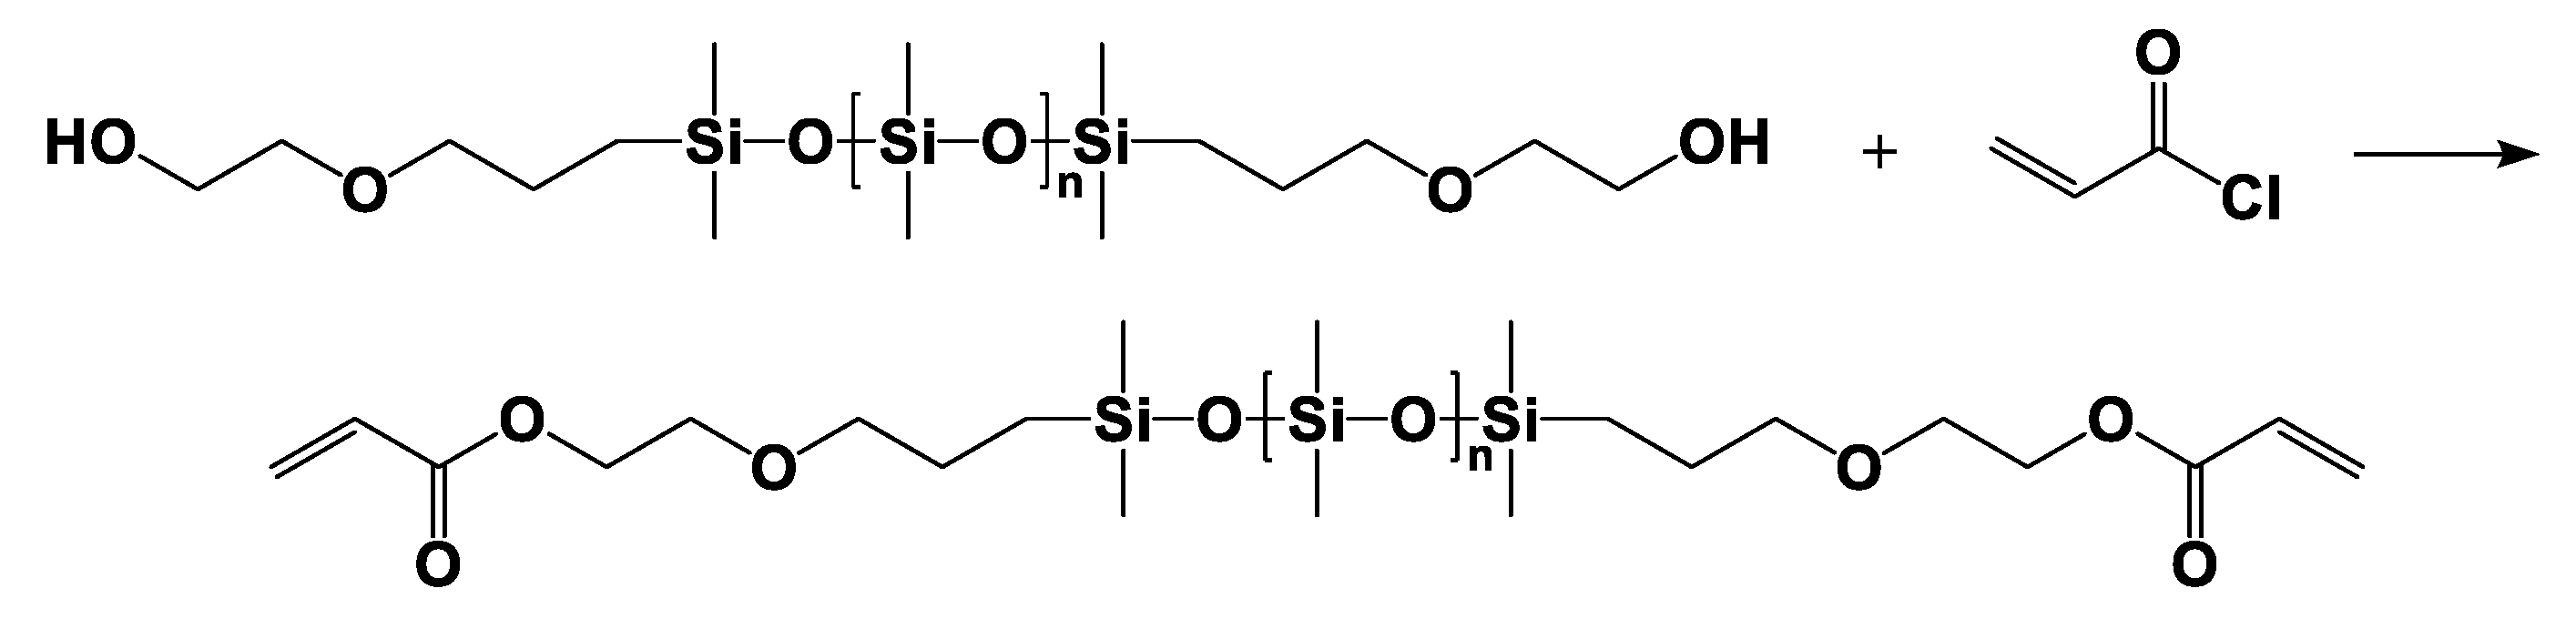
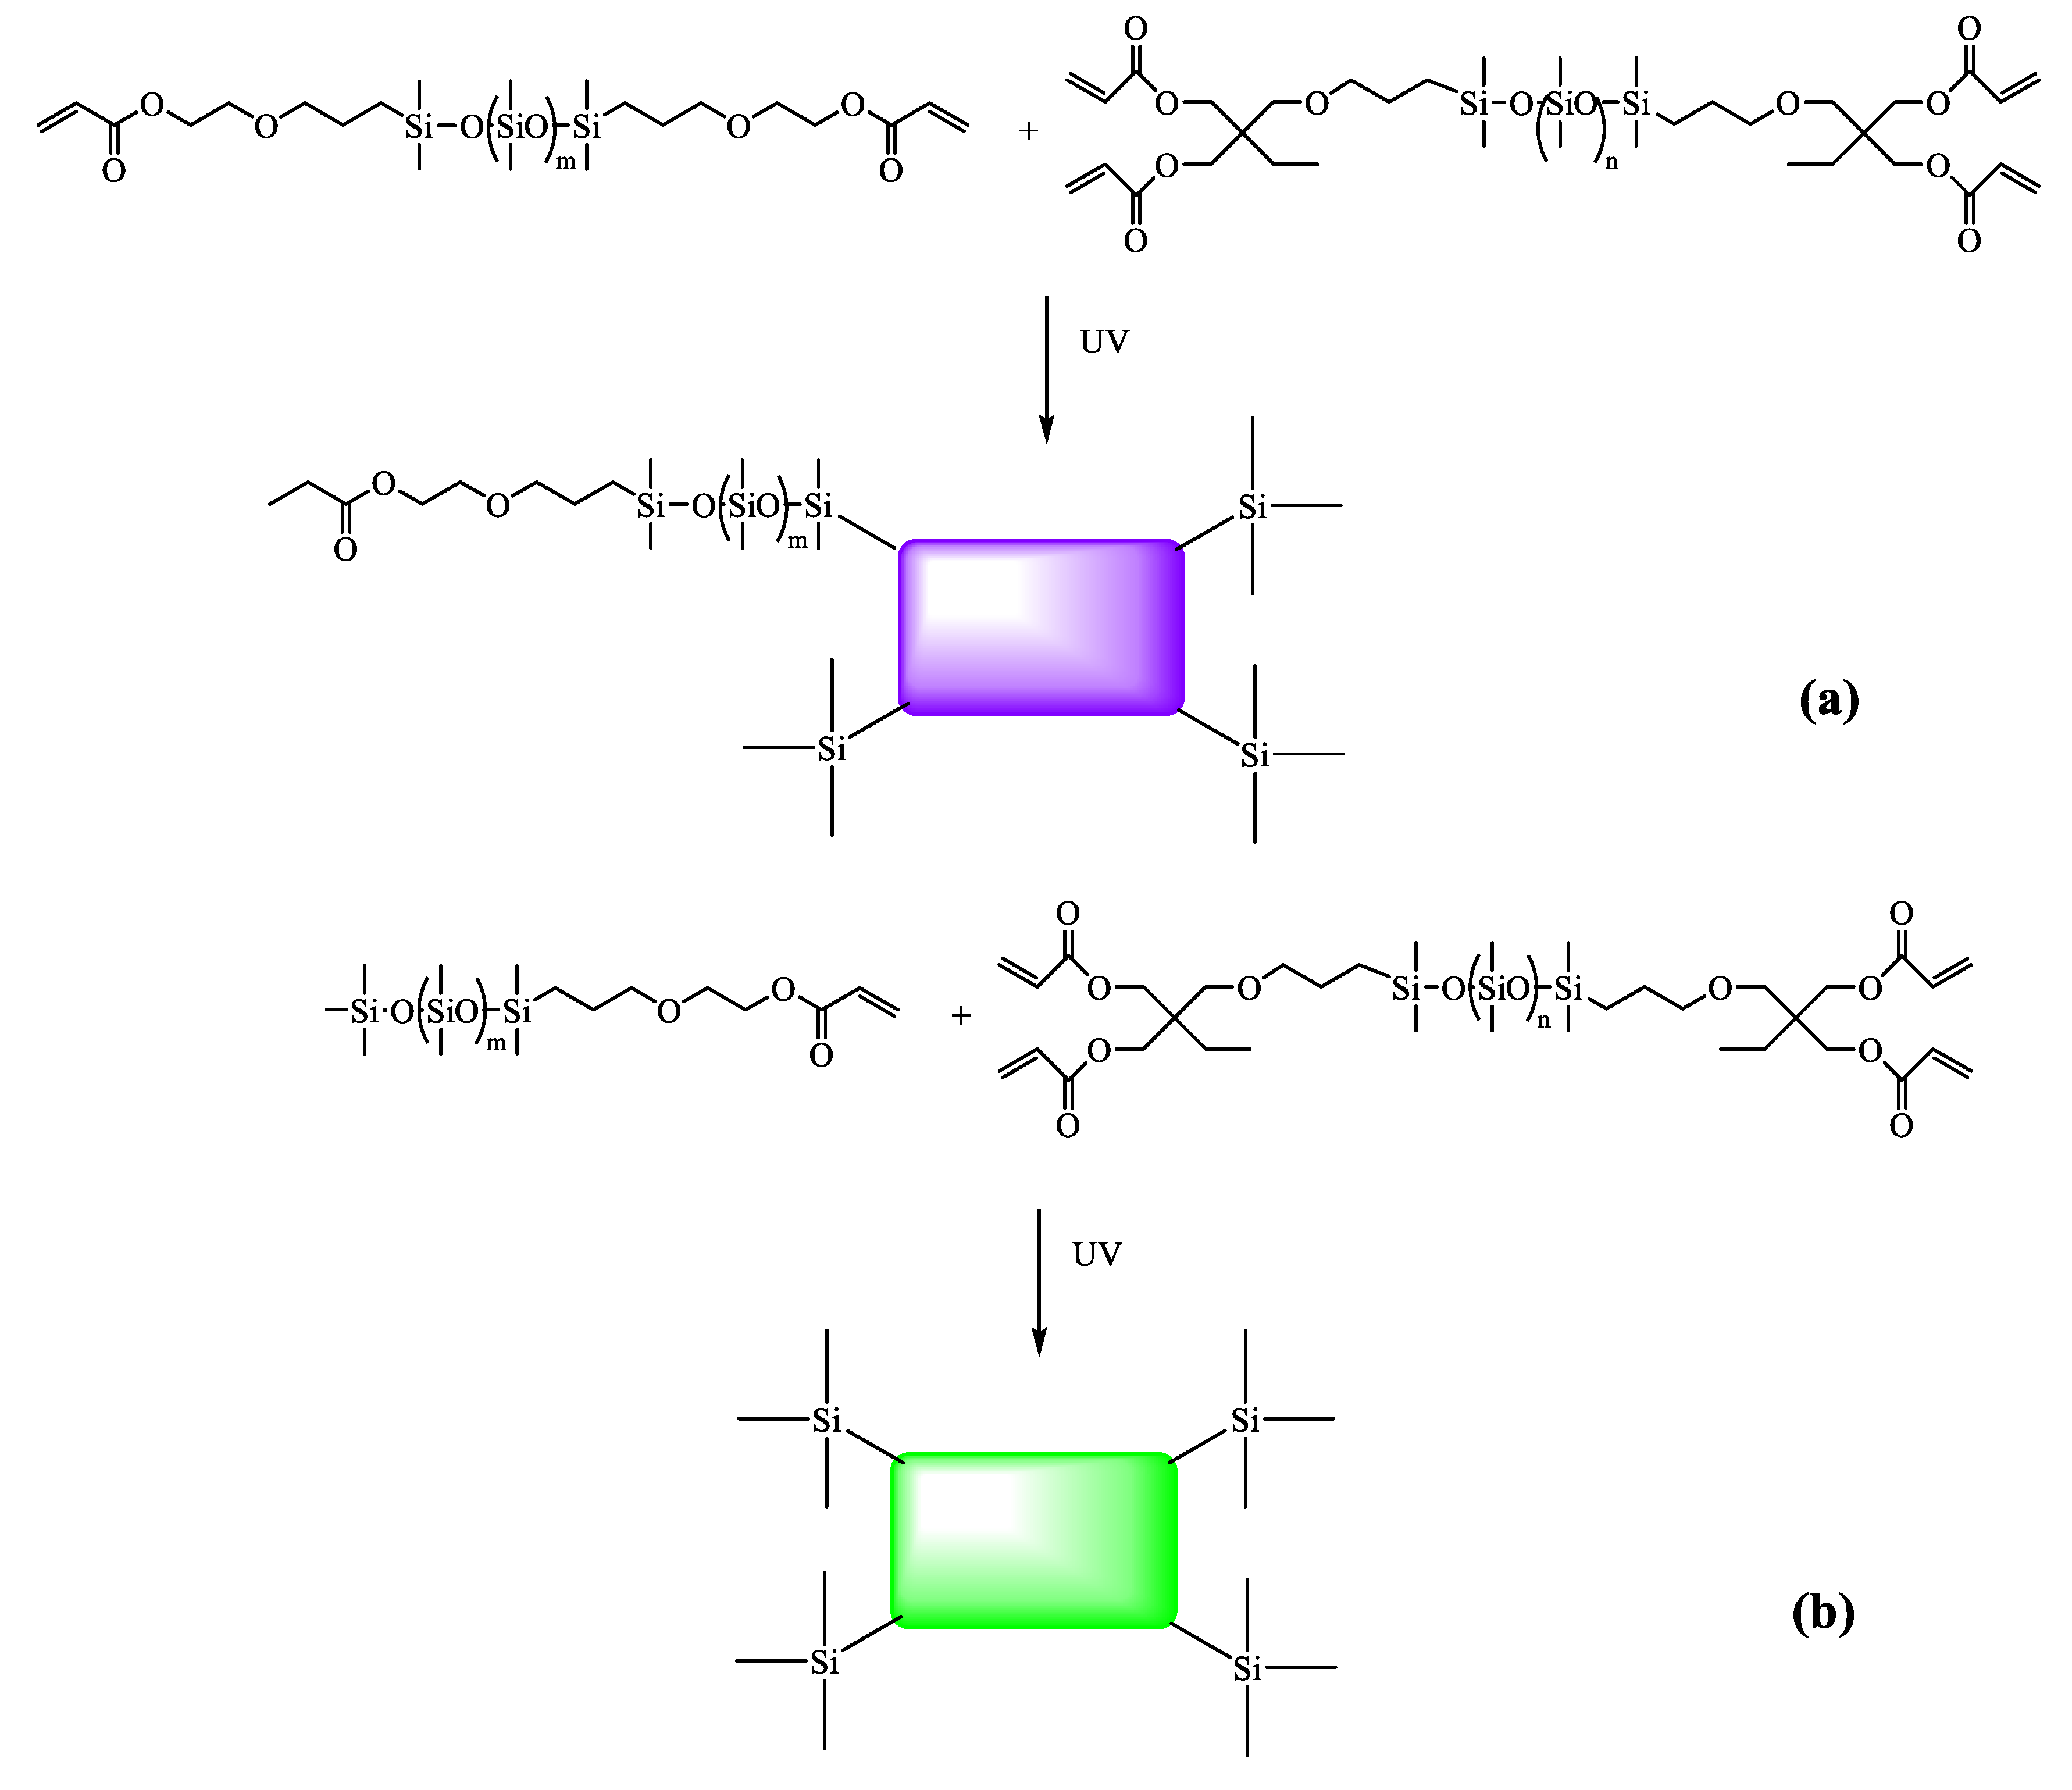
2.3.1. α,ω-Bis(dimethyl-(γ-acryloyloxyethyloxypropyl))-terminated Polydimethylsiloxane (DAEP-PDMS)
2.3.2. α-Trimethylsilyl-ω-dimethyl(γ-acryloyloxyethyloxypropyl)siloxy-terminated Polydimethylsiloxane (MAEP-PDMS)
α-Trimethylsilyl-ω-dimethyl(γ-hydroxyethyloxypropyl)siloxy-terminated Polydimethylsiloxane (MAMP-PDMS)
MAEP-PDMS
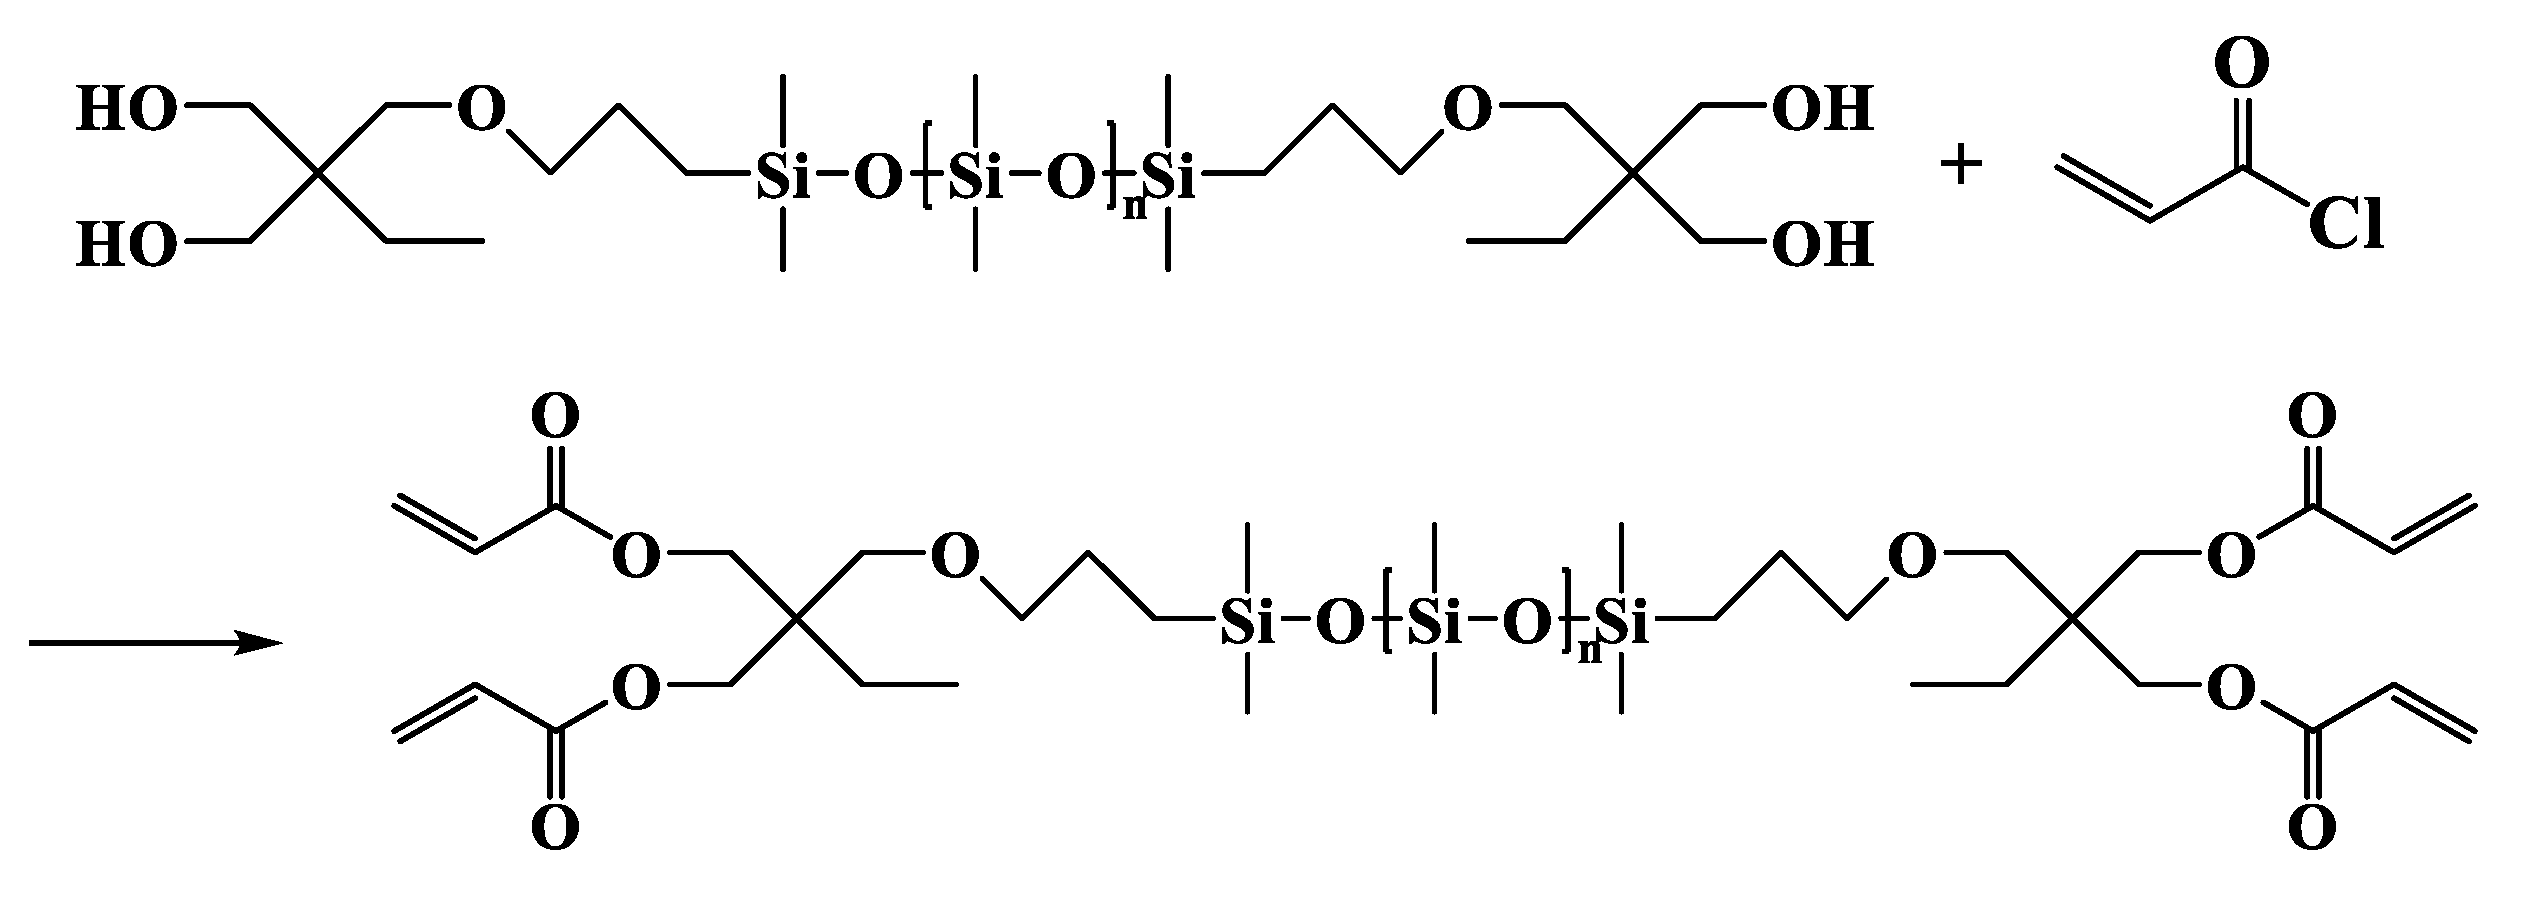
2.3.3. α,ω-Bis[dimethyl-[3-[2,2-bis(acryloyloxy)butoxy]propyl]silyl]-terminated Polydimethylsiloxane (DBABP-PDMS)
α,ω-Bis[dimethyl-[3-[2,2-bis(hydroxymethyl)butoxy]propyl]silyl]-terminated Polydimethylsiloxane (DBHBP-PDMS)
DBABP-PDMS
2.4. Preparation of UV-Cured Films
3. Results and Discussion
3.1. Characterization of the Polymer Structure
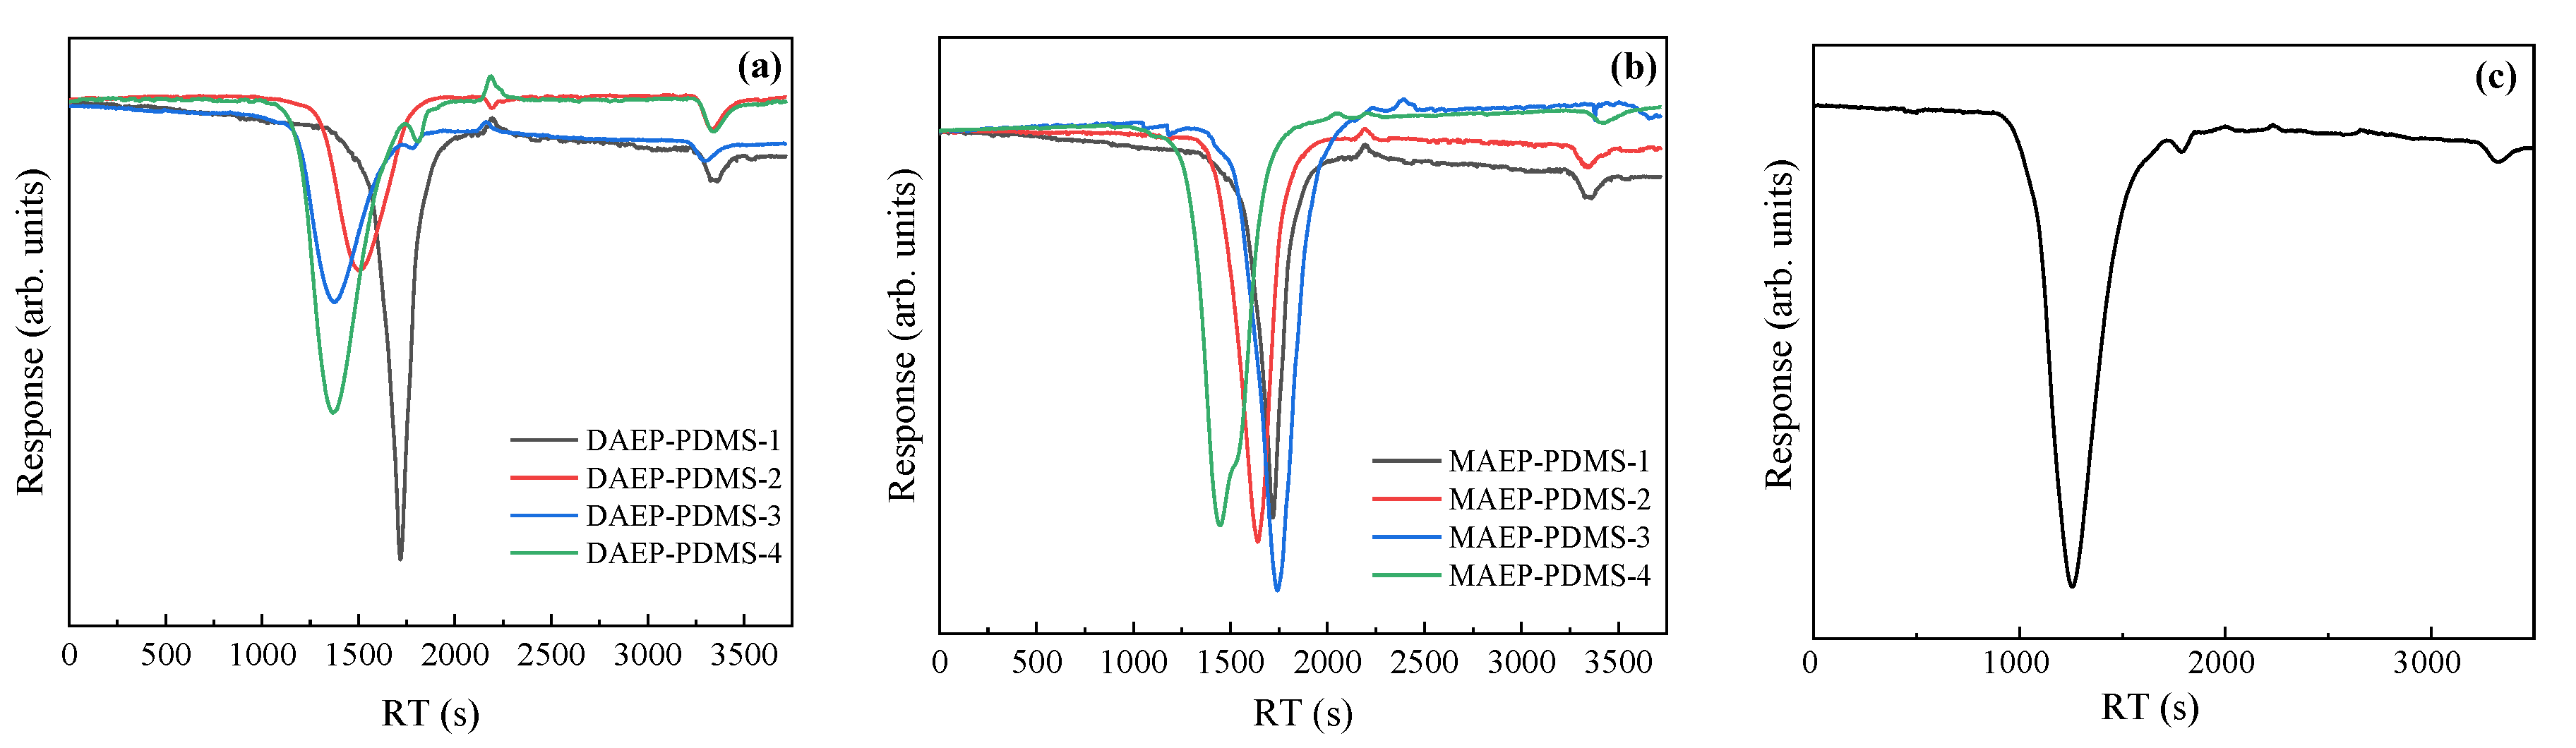
3.1.1. GPC Curves
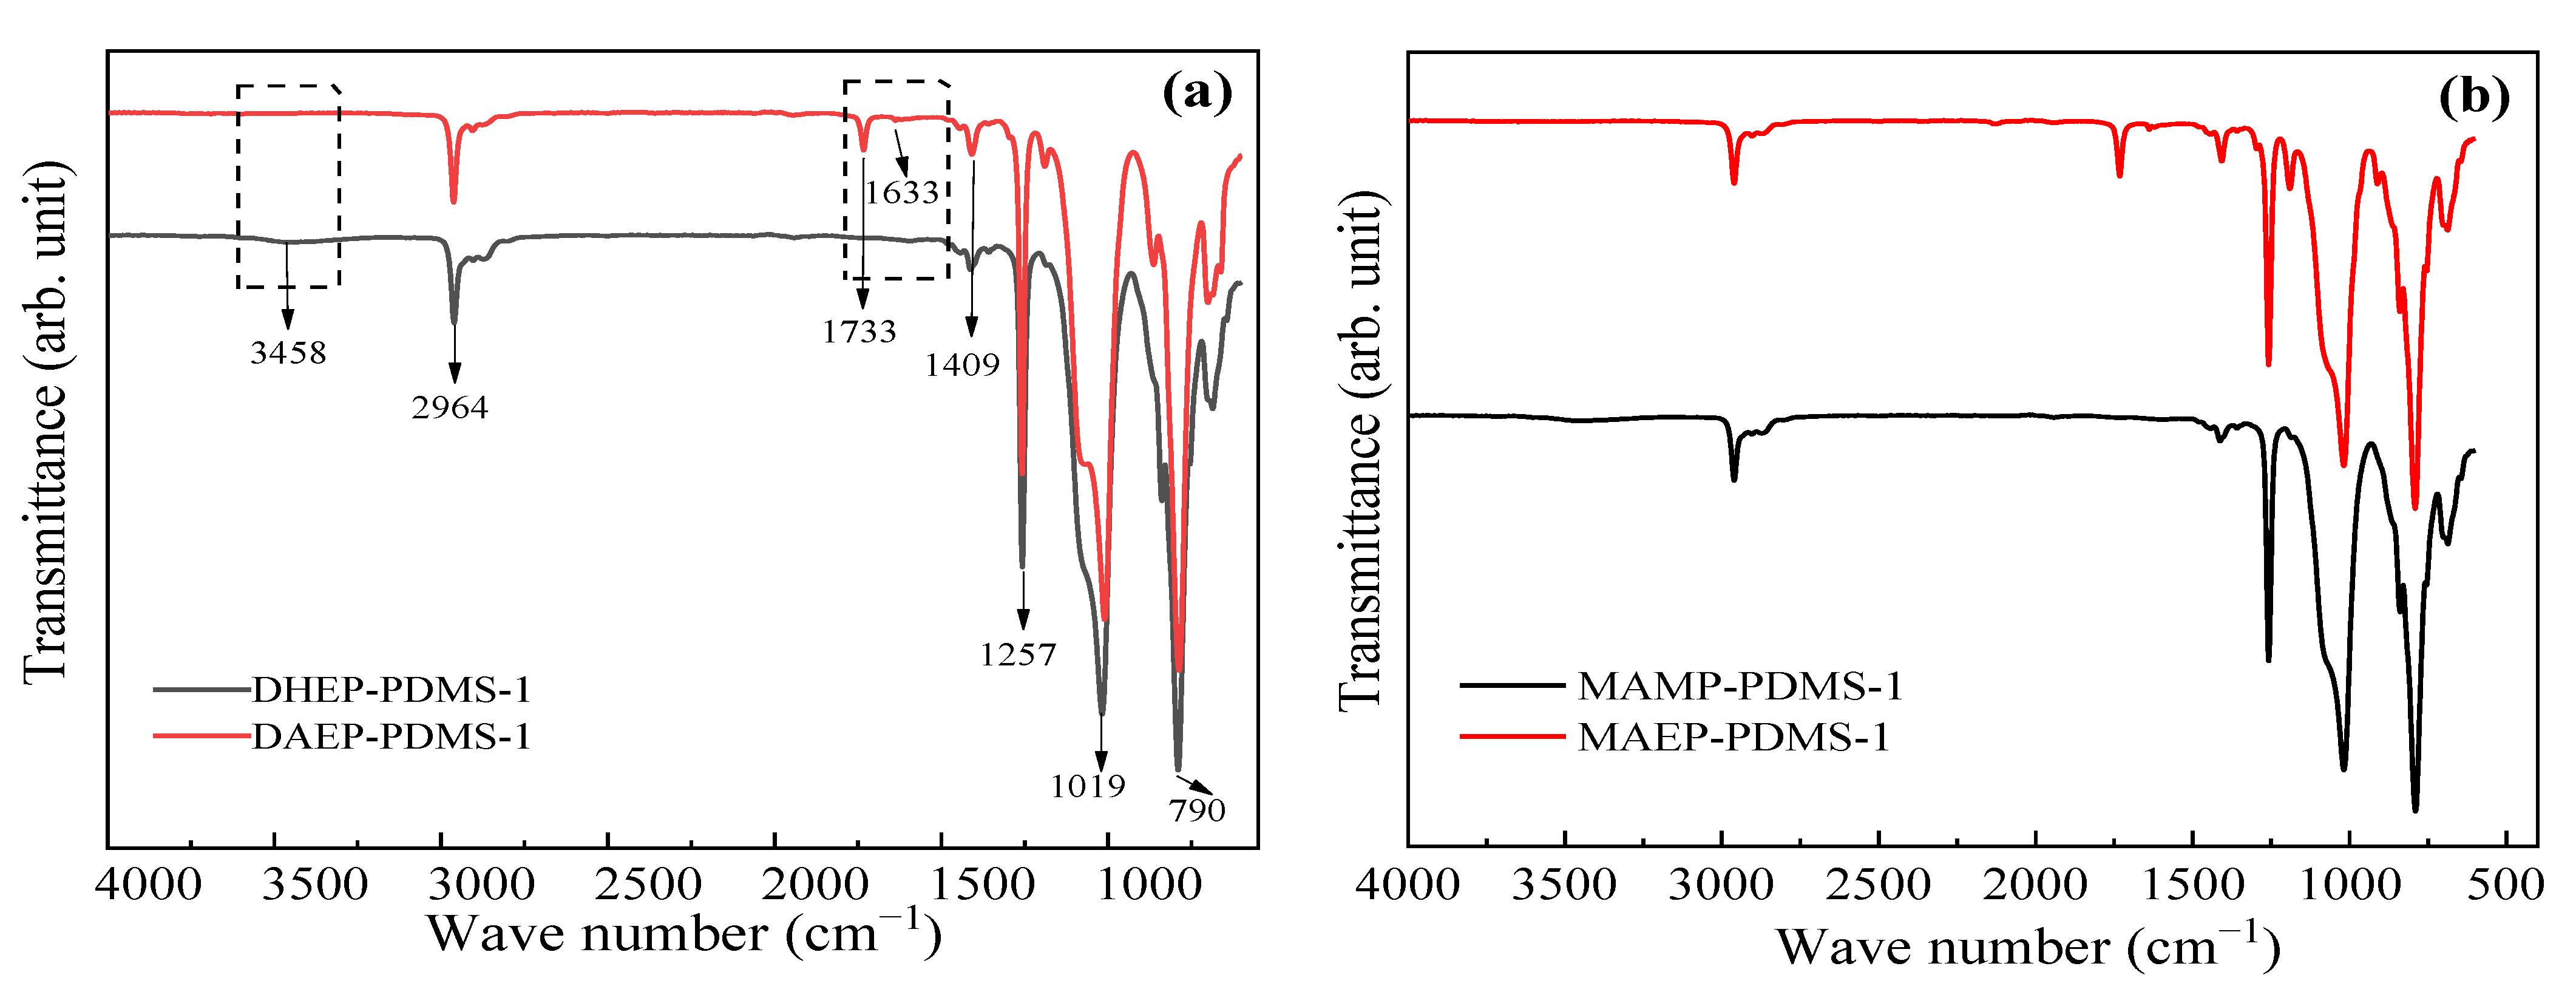
3.1.2. FT-IR Spectra
DAEP-PDMS Oligomer
MAEP-PDMS Oligomer
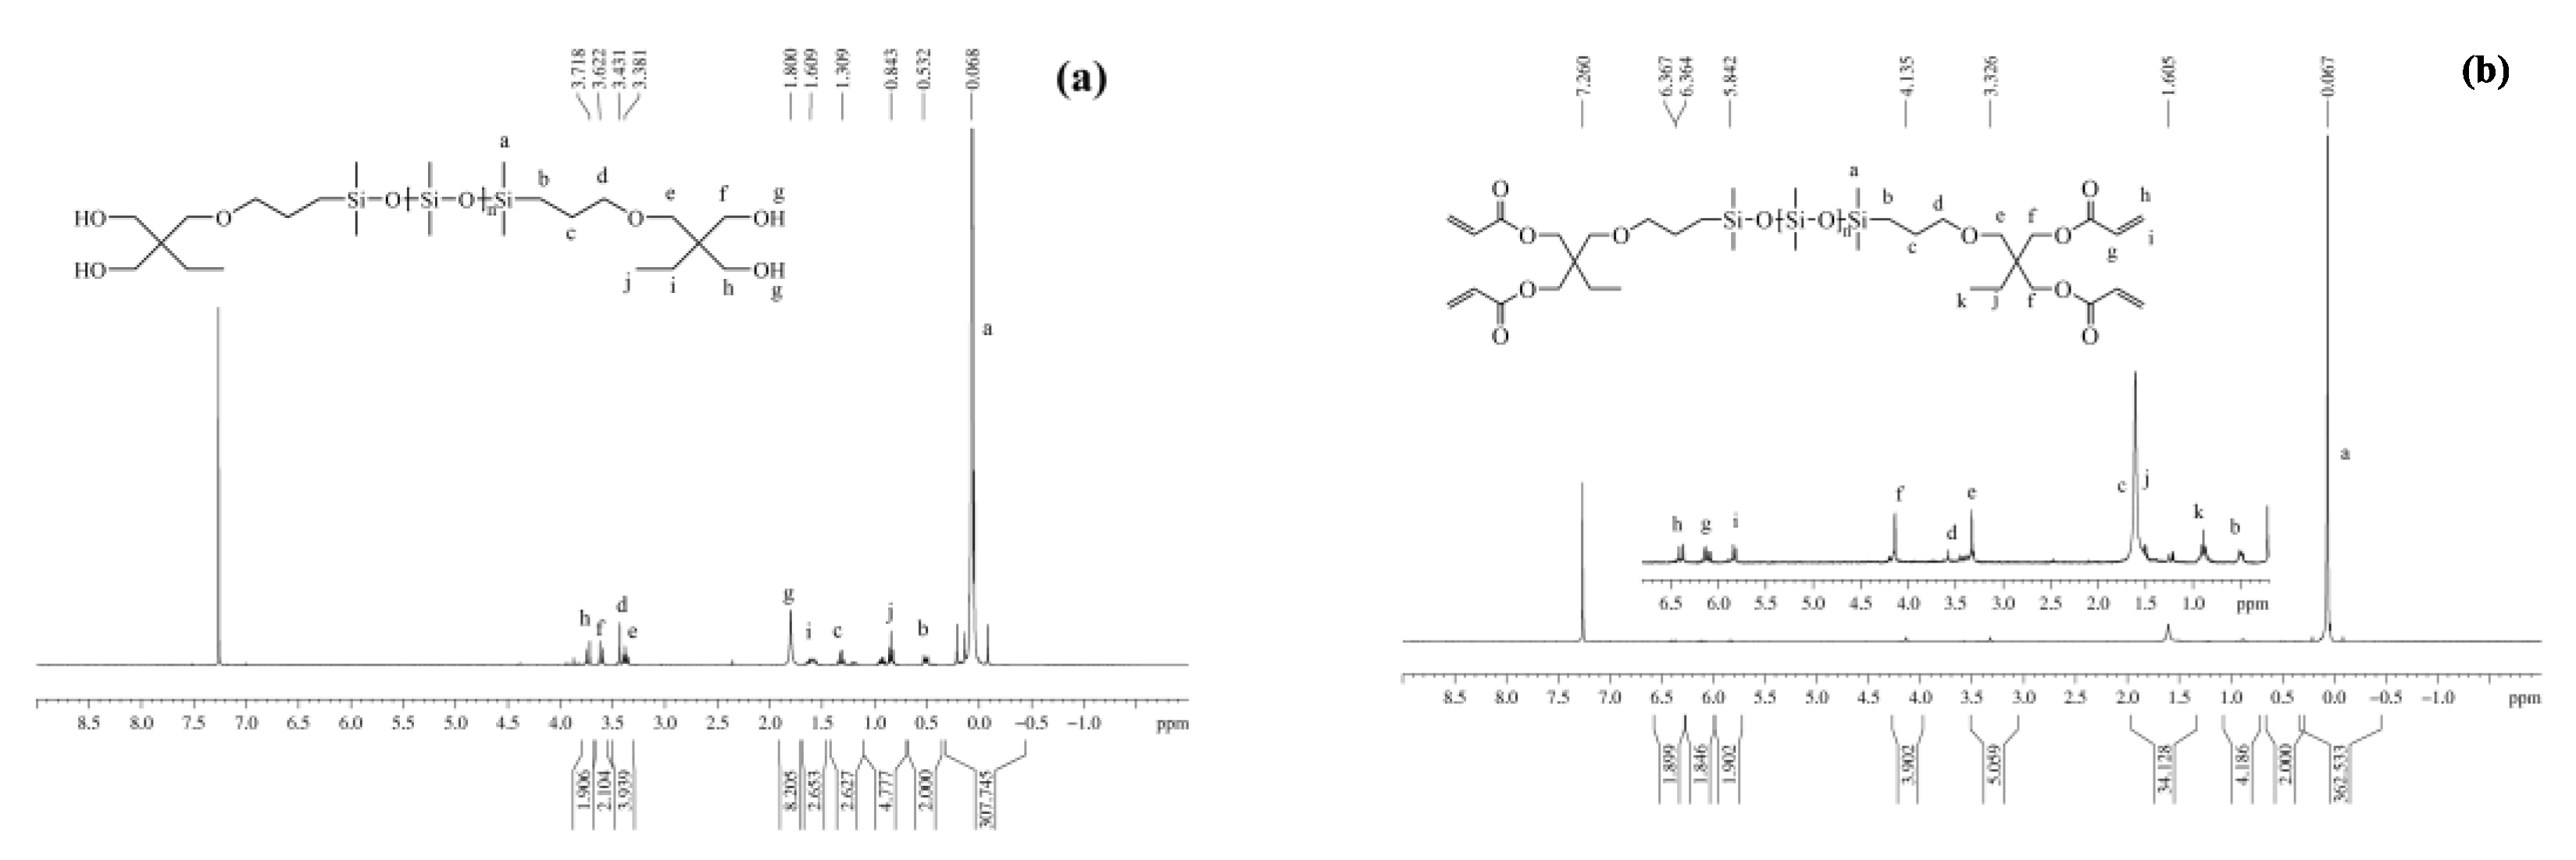
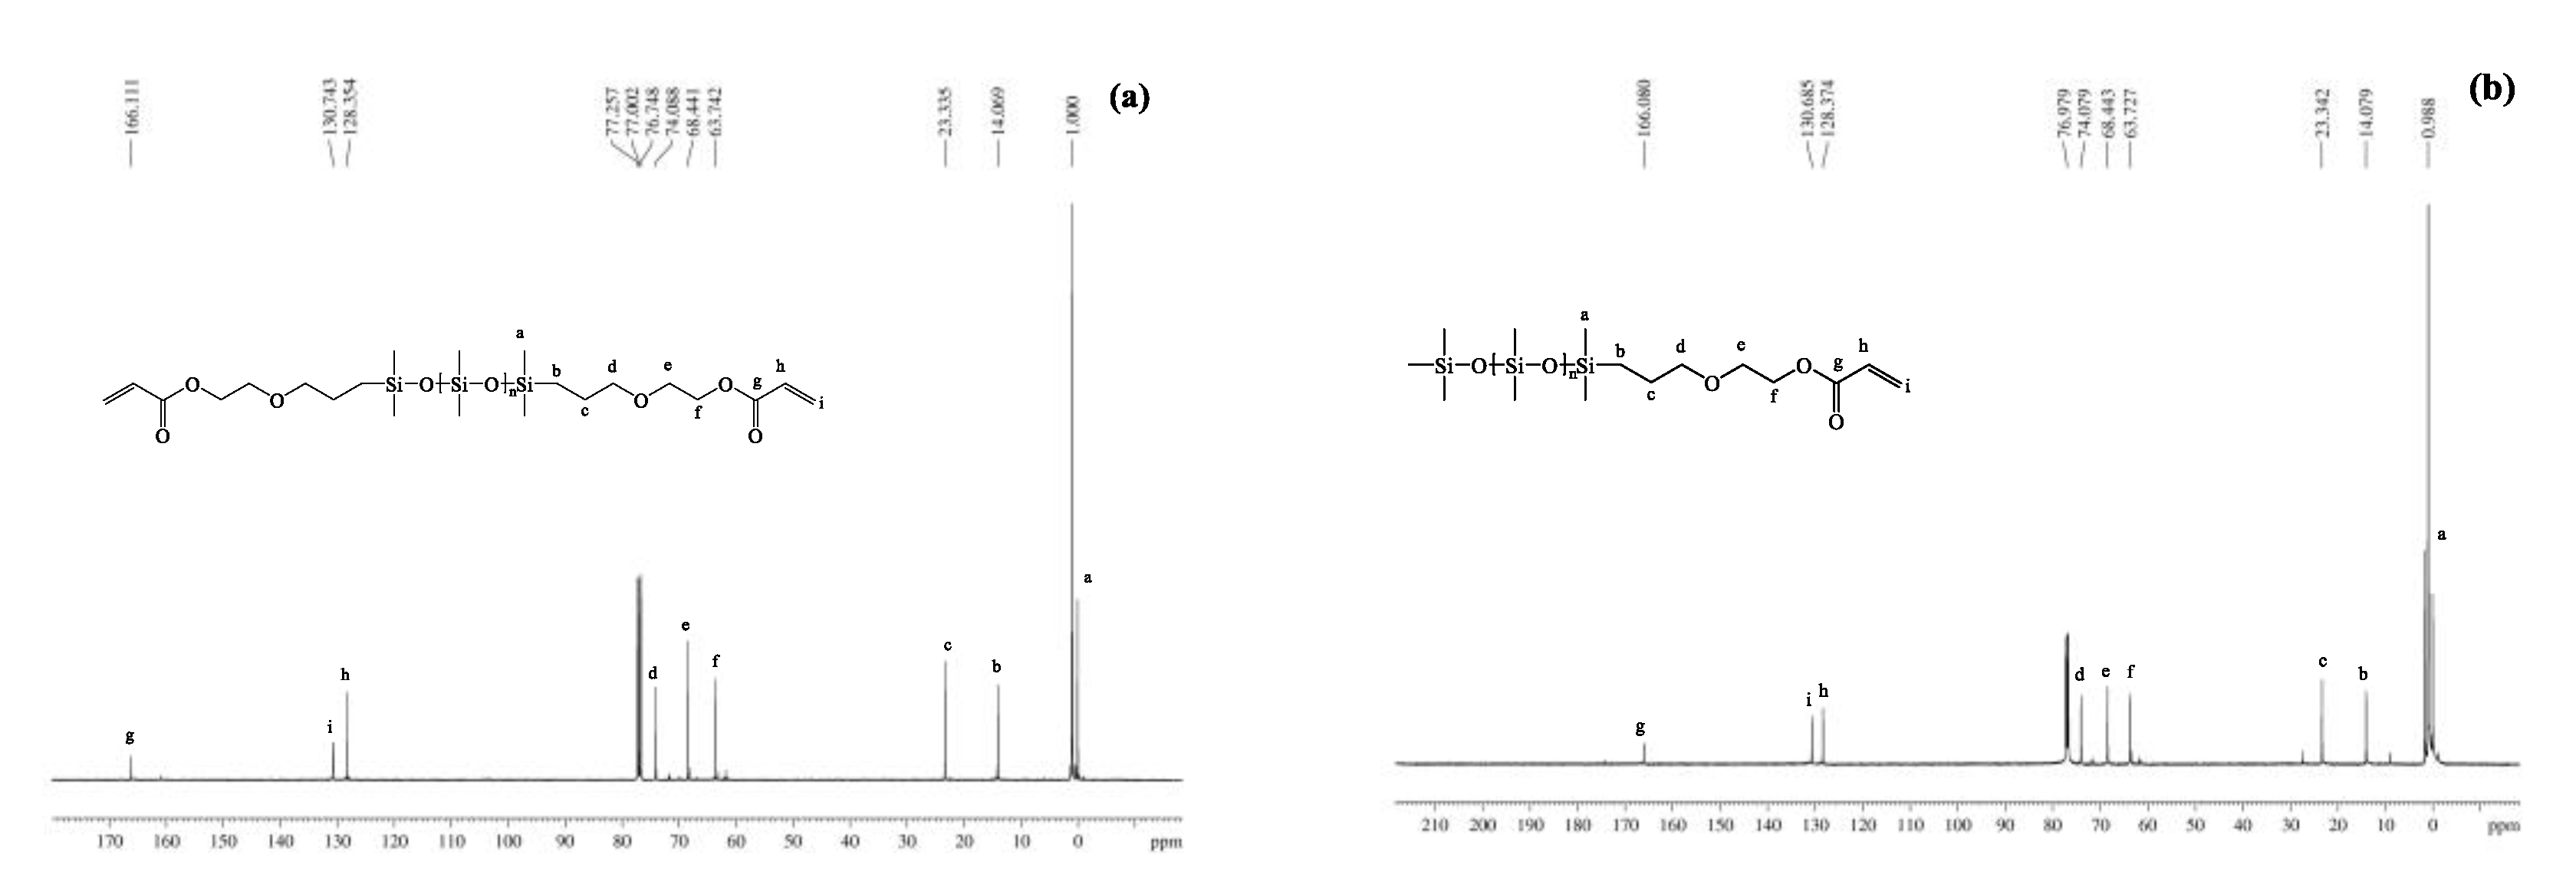
3.1.3. NMR Spectra
3.2. UV Curing Products
3.2.1. Effect of the Photoinitiator Ratio on Curing Performance
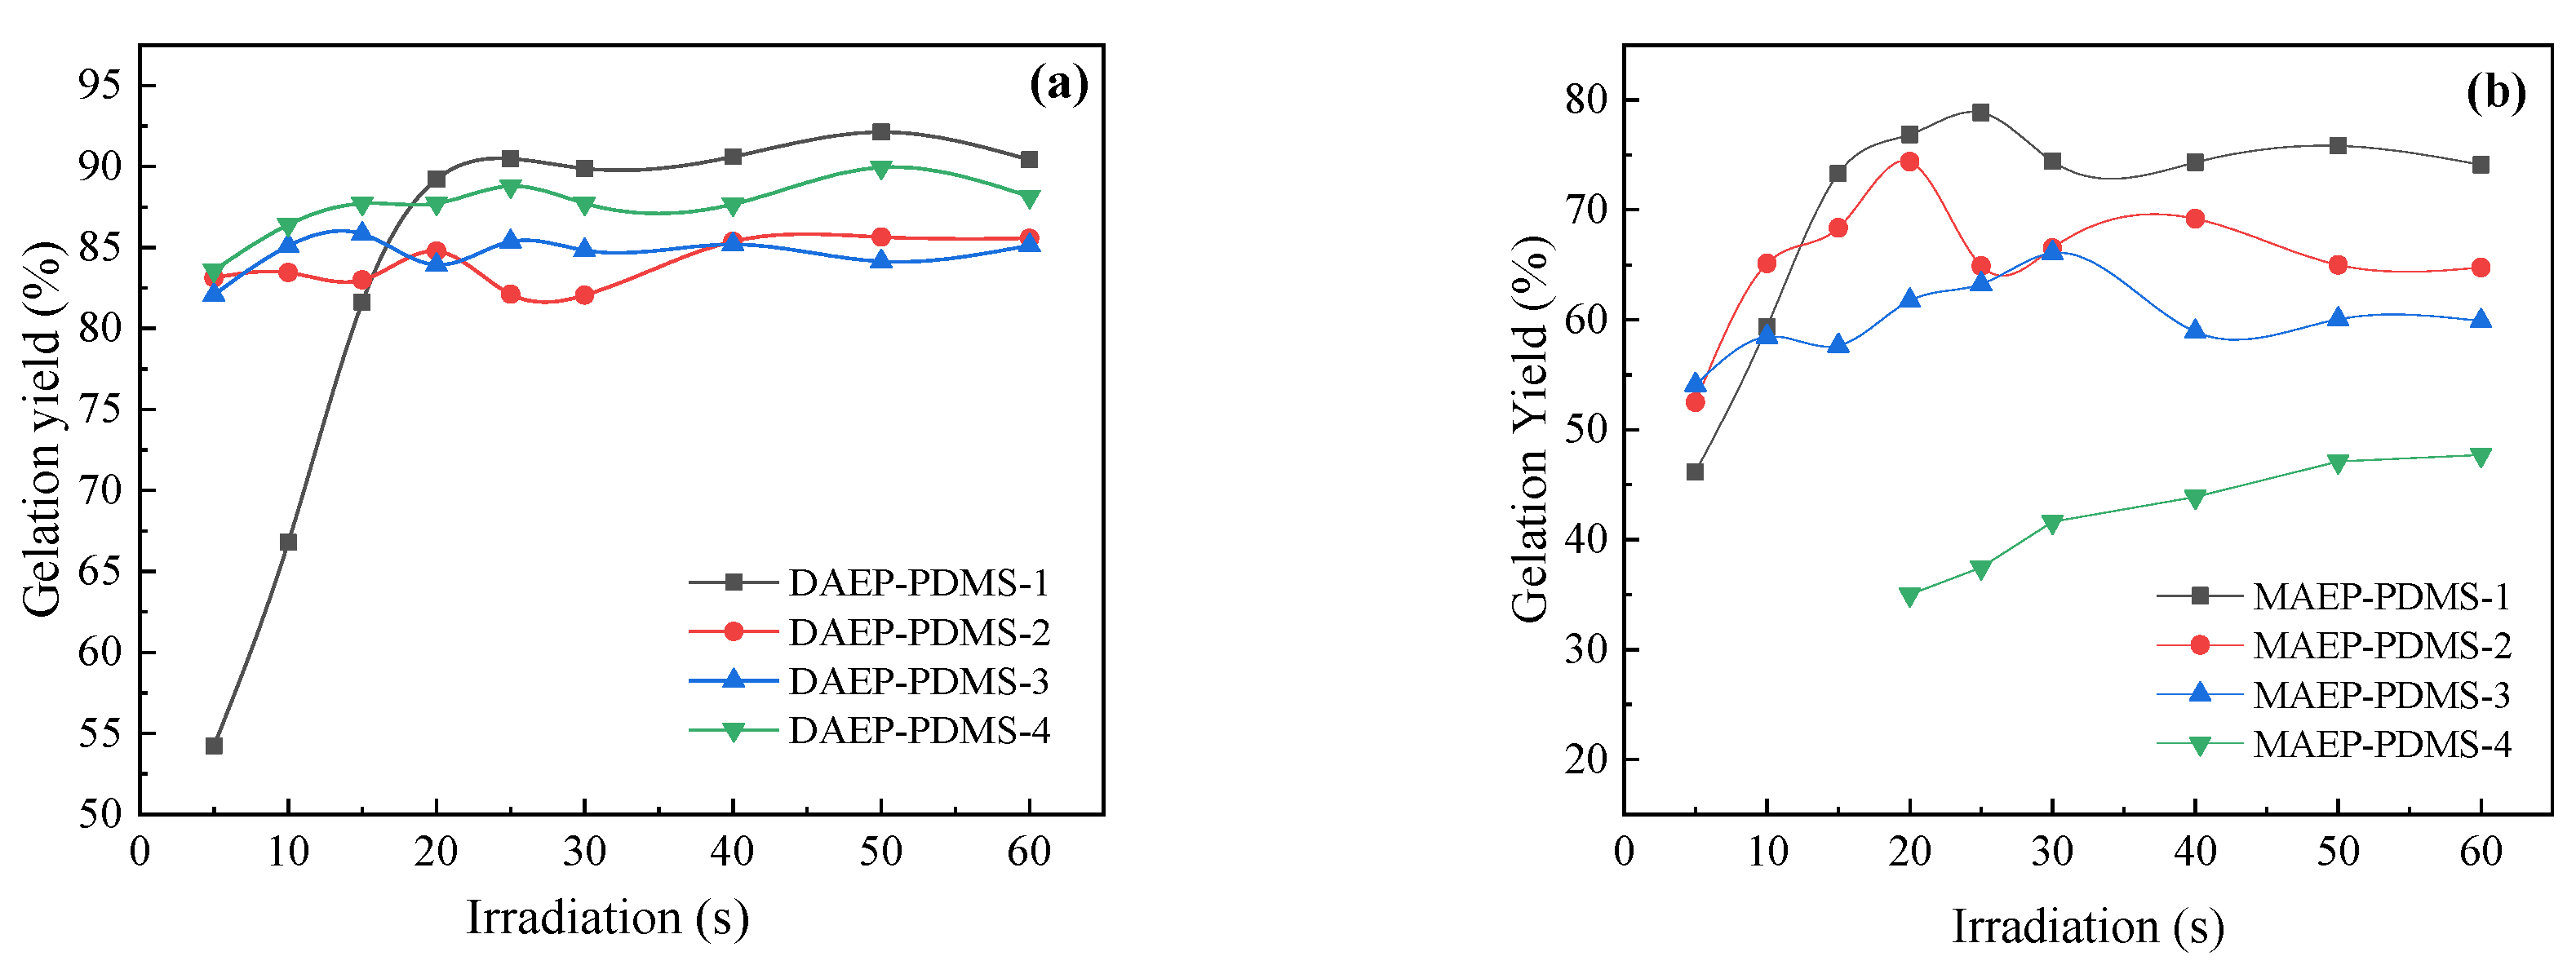
3.2.2. Effect of UV Irradiation Time and Molecular Weight on Curing Performance
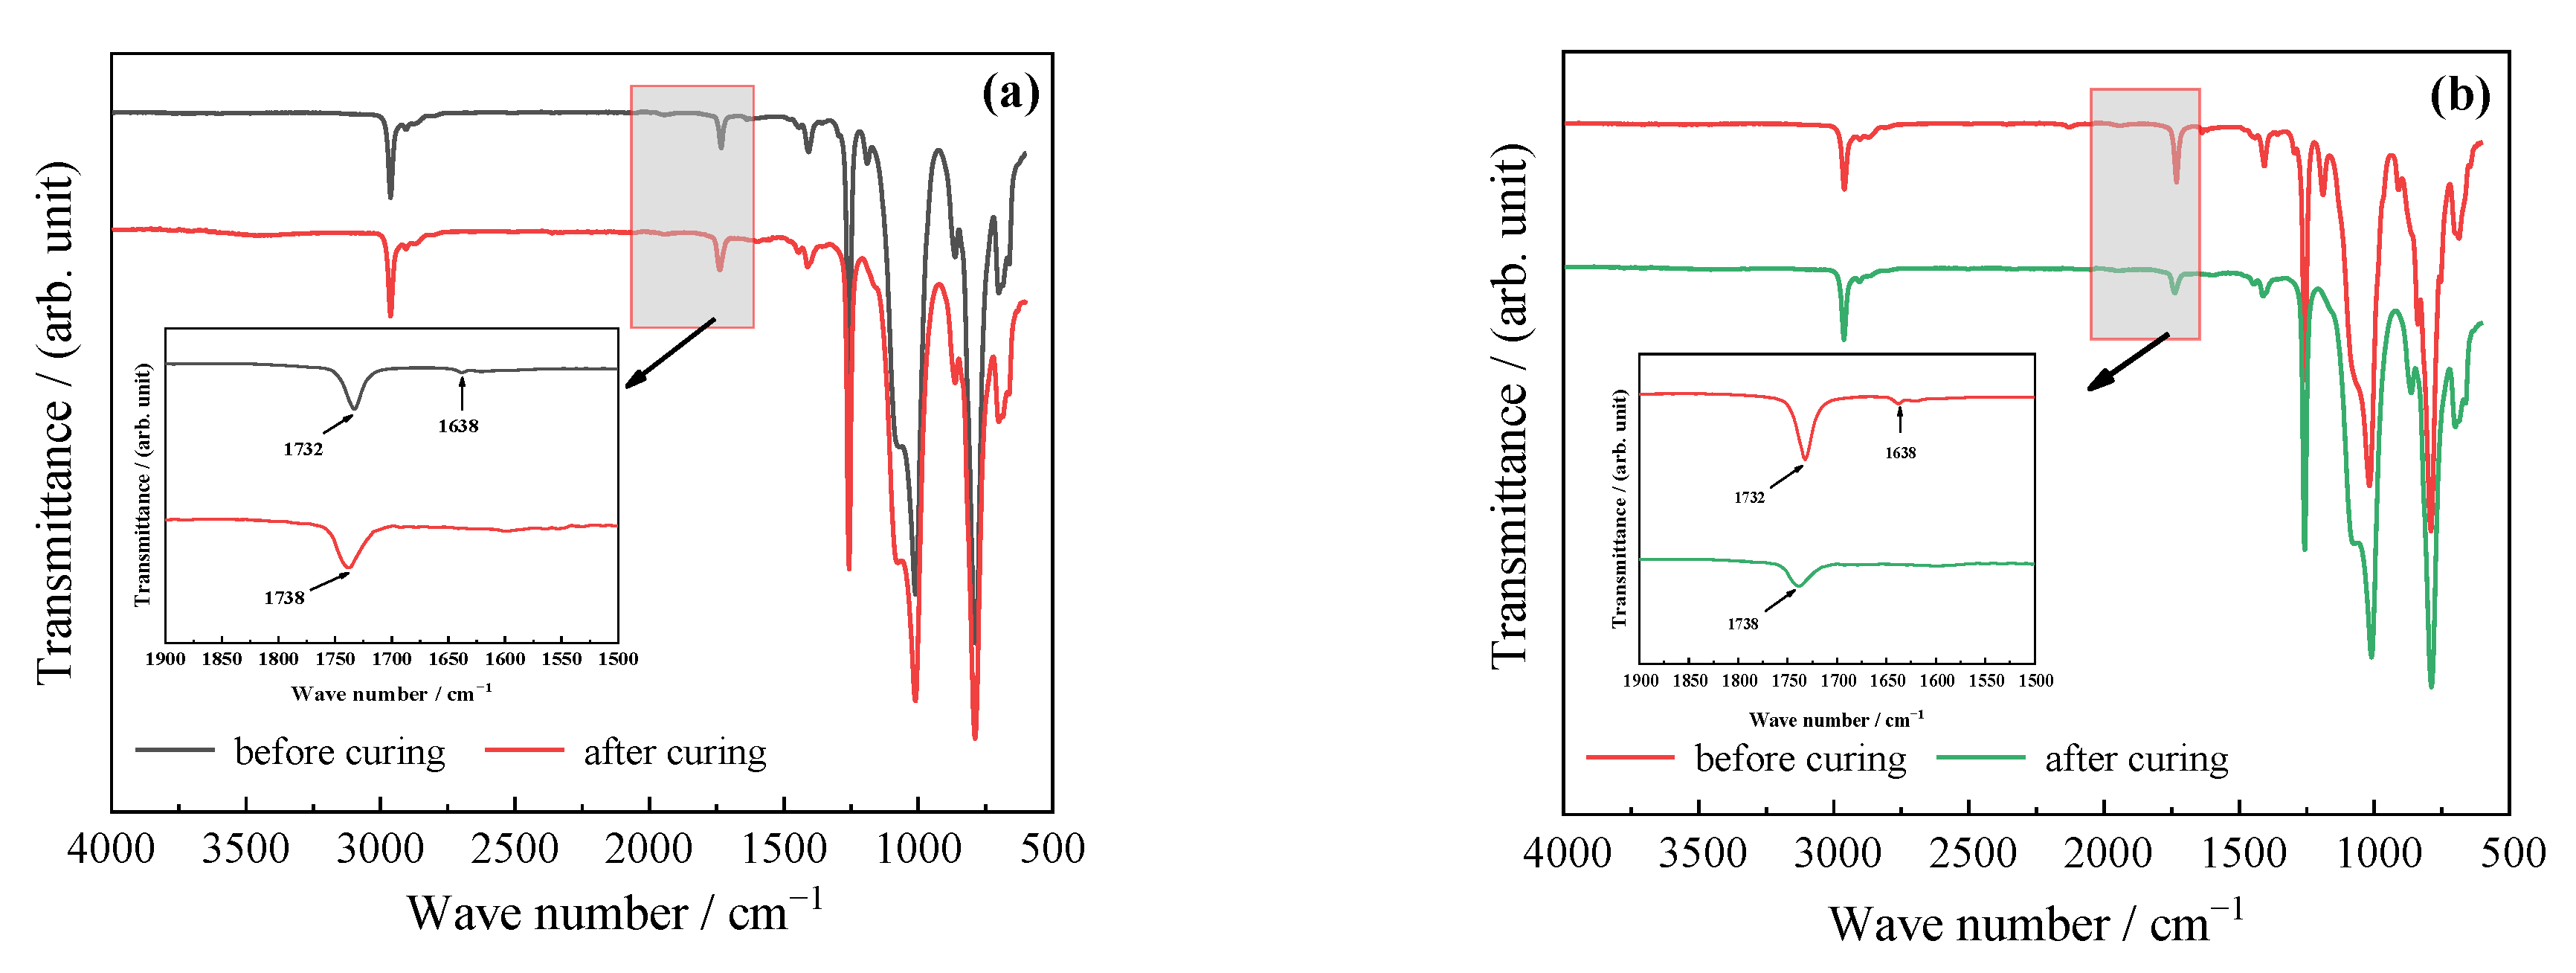
3.2.3. FT-IR Spectra of Cured Films
3.2.4. Water Absorption Degree of UV-Cured Films
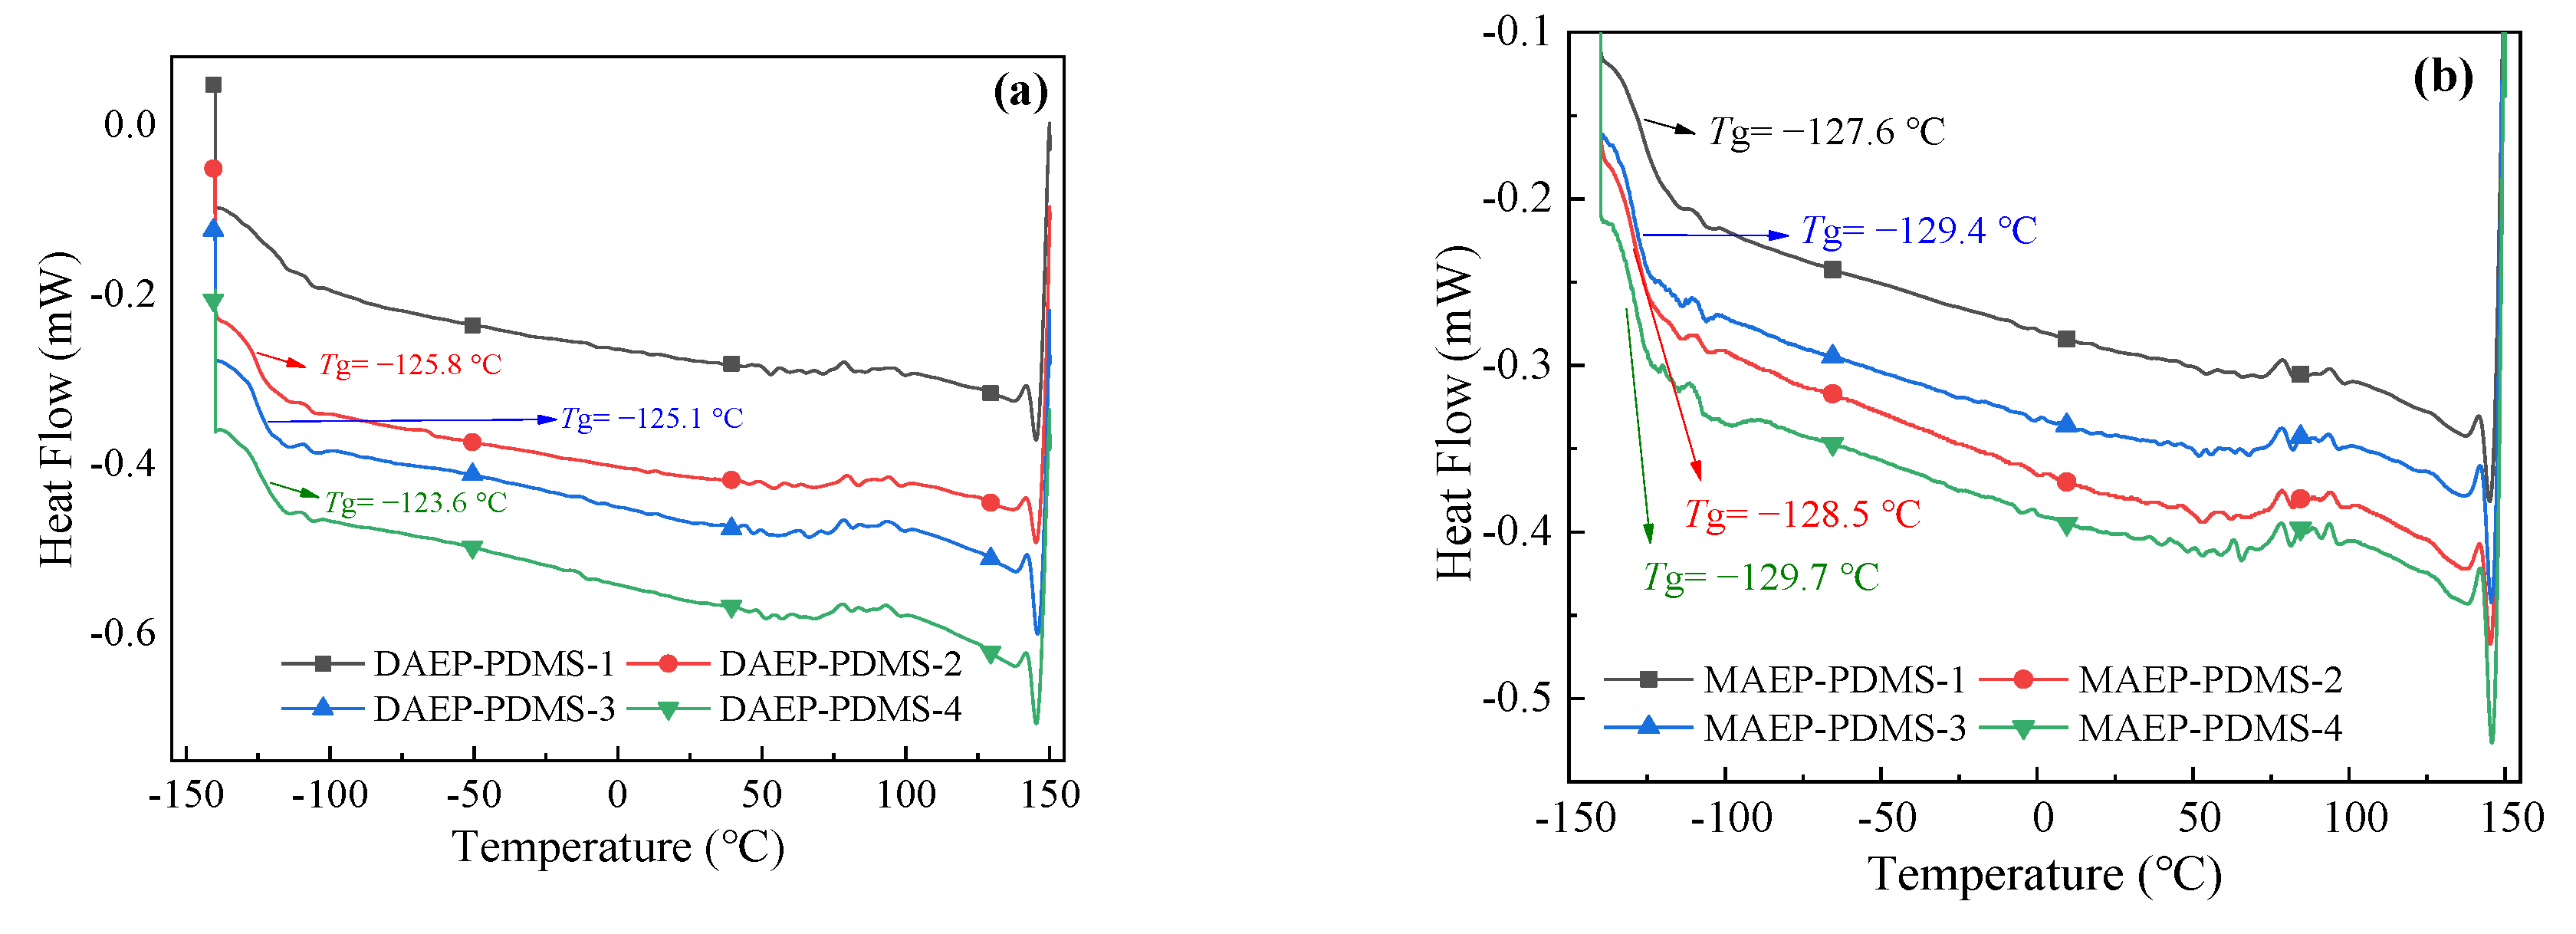
3.2.5. Thermal Properties of UV-Cured Films
3.2.6. Cross-Linking Density of UV-Cured Films
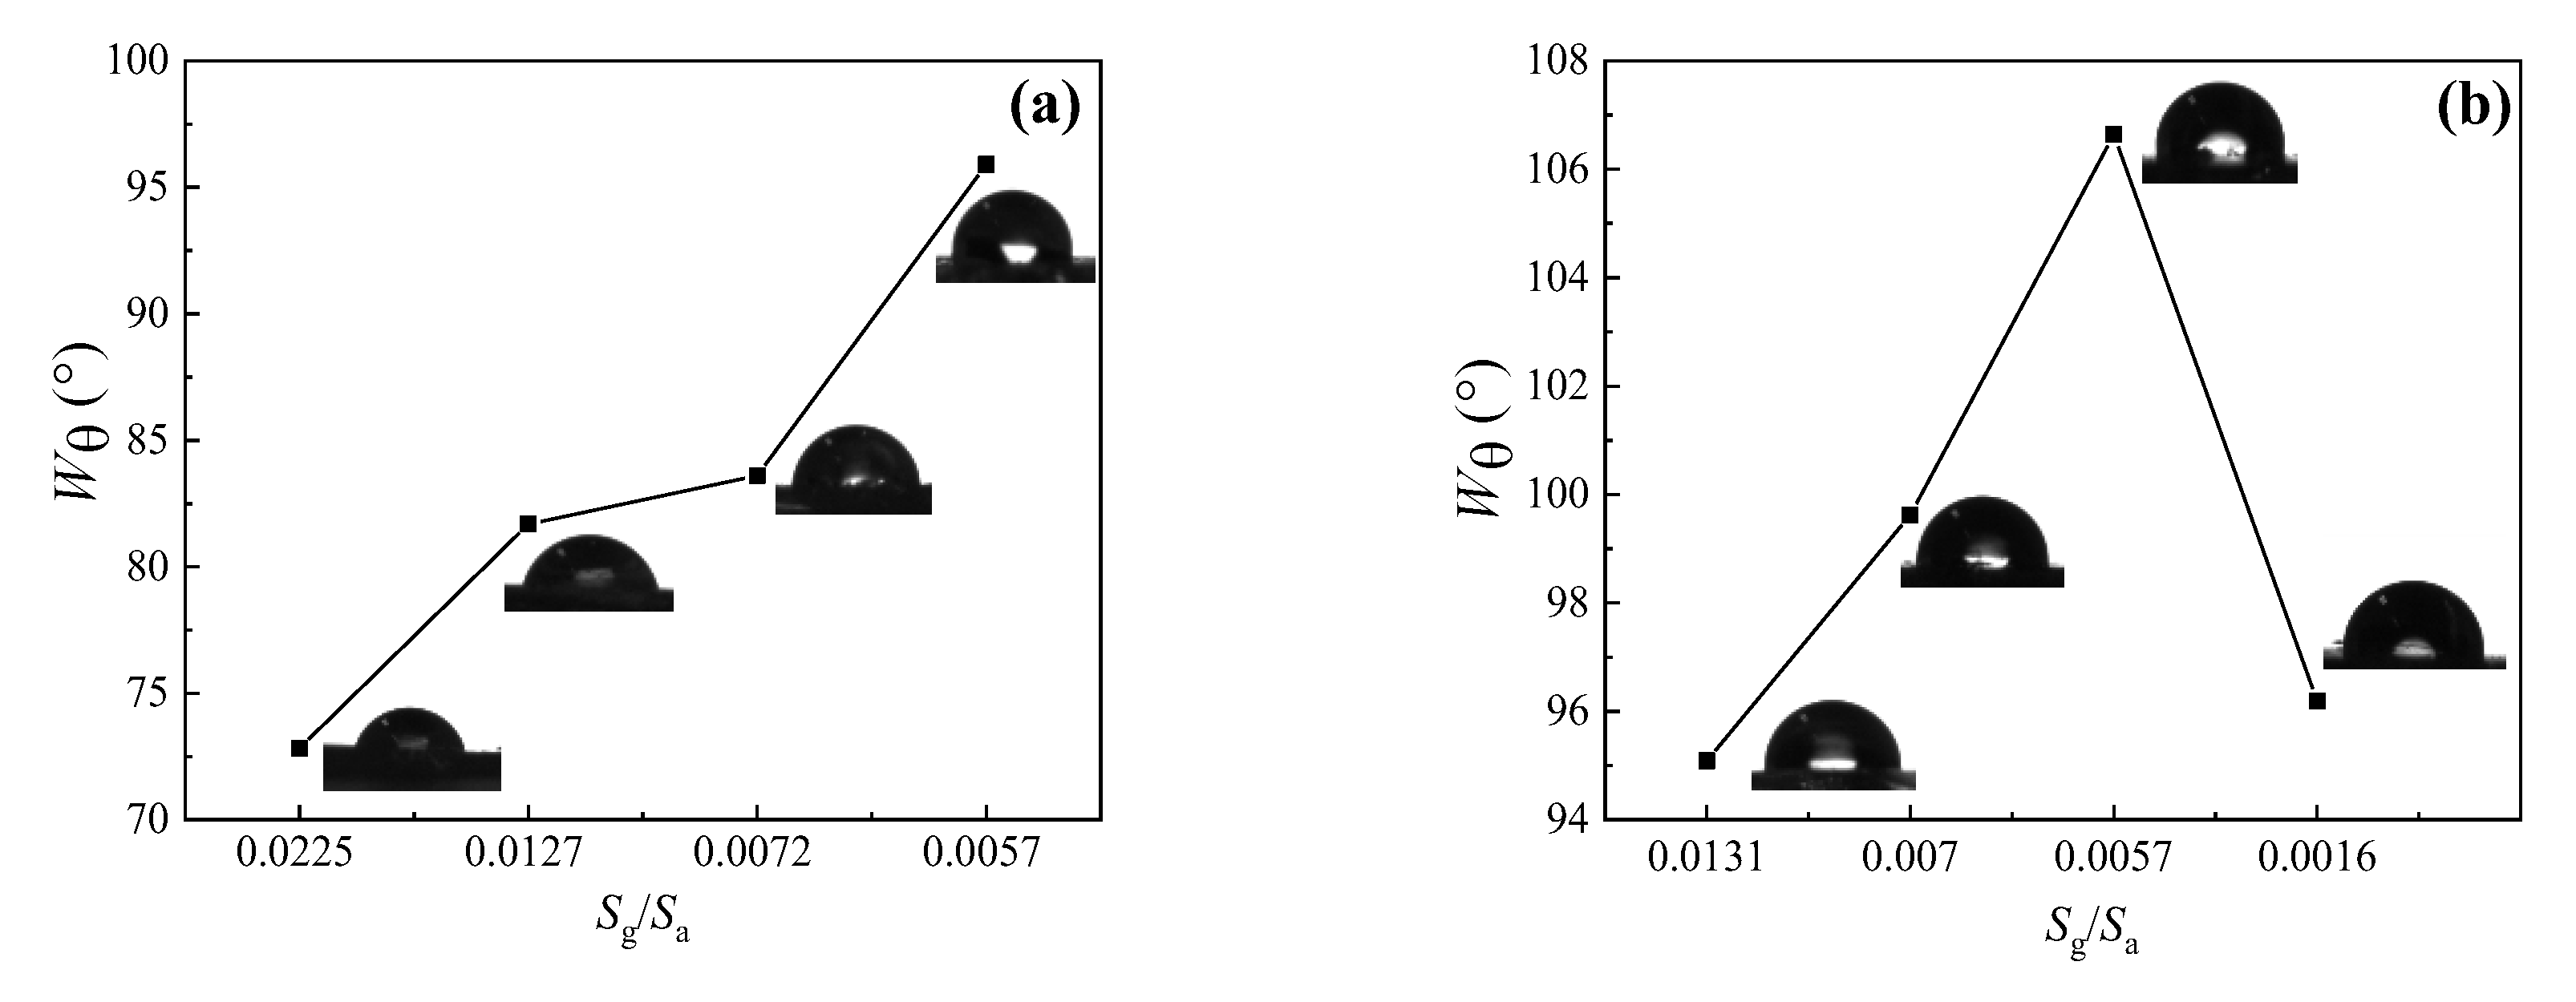
3.2.7. Water Contact Angle of UV-Cured Films
4. Conclusions
Supplementary Materials
Author Contributions
Funding
Institutional Review Board Statement
Data Availability Statement
Acknowledgments
Conflicts of Interest
References
- Agnol, L.D.; Dias, F.T.G.; Ornaghi, H.L., Jr.; Sangermano, M.; Bianchi, O. UV-curable waterborne polyurethane coatings: A state-of-the-art and recent advances review. Prog. Org. Coat. 2021, 154, 106156. [Google Scholar] [CrossRef]
- Hwang, H.D.; Park, C.H.; Moon, J.I.; Kim, H.-J.; Masubuchi, T. UV-curing behavior and physical properties of waterborne UV-curable polycarbonate-based polyurethane dispersion. Prog. Org. Coat. 2011, 72, 663–675. [Google Scholar] [CrossRef]
- Tong, J.X.; Xie, S.B.; Miao, J.T.; Luo, J.; Liu, R. Preparation of UV-cured polyurethane-urea acrylate coatings with high hardness and toughness. Prog. Org. Coat. 2024, 186, 107969. [Google Scholar] [CrossRef]
- Mapari, S.; Mestry, S.; Mhaske, S.T. Developments in pressure-sensitive adhesives: A review. Polym. Bull. 2021, 78, 4075–4108. [Google Scholar] [CrossRef]
- Zhao, J.; Chen, S.; Su, W.; Zhu, L.; Cheng, X.; Wu, J.; Zhao, S.; Zhou, C. Construction of a durable superhydrophobic surface based on the oxygen inhibition layer of organosilicon resins. Thin Solid Films 2021, 717, 138467. [Google Scholar] [CrossRef]
- Kim, Y.S.; Cho, H.J.; Lee, H.; Kim, W.Y.; Jung, Y.C.; Lee, S.Y. Development of a multi-functional acrylic urethane coating with high hardness and low surface energy. Prog. Org. Coat. 2020, 147, 105748. [Google Scholar] [CrossRef]
- Zhong, X.M.; Zhou, M.; Wang, S.; Fu, H. Preparation of water-borne non-fluorinated anti-smudge surfaces and their applications. Prog. Org. Coat. 2020, 142, 105581. [Google Scholar] [CrossRef]
- Zheng, C.; Liu, G.; Hu, H. UV-Curable Antismudge Coatings. ACS Appl. Mater. Interfaces 2017, 9, 25623–25630. [Google Scholar] [CrossRef]
- Matin, A.; Baig, U.; Akhtar, S.; Merah, N.; Gondal, M.; Bake, A.H.; Ibrahim, A. UV resistant and transparent hydrophobic surfaces with different wetting states by a facile dip-coating method. Prog. Org. Coat. 2019, 136, 105192. [Google Scholar] [CrossRef]
- Torun, I.; Ruzi, M.; Er, F.; Onses, M.S. Superhydrophobic coatings made from biocompatible polydimethylsiloxane and natural wax. Prog. Org. Coat. 2019, 136, 105279. [Google Scholar] [CrossRef]
- Zhao, Y.; Liu, E.; Fan, J.; Chen, B.; Hu, X.; He, Y.; He, C. Superhydrophobic PDMS/wax coated polyester textiles with self-healing ability via inlaying method. Prog. Org. Coat. 2019, 132, 100–107. [Google Scholar] [CrossRef]
- Salazar-Hernandez, C.; Salazar-Hernandez, M.; Carrera-Cerritos, R.; Mendoza-Miranda, J.M.; Elorza-Rodríguez, E.; Miranda-Avilés, R.; Mocada-Sánchez, C.D. Anticorrosive properties of PDMS-Silica coatings: Effect of methyl, phenyl and amino groups. Prog. Org. Coat. 2019, 136, 105220. [Google Scholar] [CrossRef]
- Xiao, T.; Geng, L.; Dai, Y.C.; Zhao, J.; Liu, C. UV-cured polymer aided phase change thermal energy storage: Preparation, mechanism and prospects. J. Energy Storage 2023, 64, 107066. [Google Scholar] [CrossRef]
- Yang, L.; Yang, J.; Nie, J.; Zhu, X. Temperature controlled cationic photo-curing of a thick, dark composite. RSC Adv. 2017, 7, 4046–4053. [Google Scholar] [CrossRef]
- Soucek, M.D.; Chen, J. Model for the Effects of Water on the Cationic UV-Curing of Cyclohexyl Epoxides. J. Coat. Technol. 2003, 75, 49–58. [Google Scholar] [CrossRef]
- Crivello, J.V. Synergistic effects in hybrid free radical/cationic photopolymerizations. J. Polym. Sci. Part A Polym. Chem. 2007, 45, 3759–3769. [Google Scholar] [CrossRef]
- Lin, Y.; Stansbury, J.W. Kinetics studies of hybrid structure formation by controlled photopolymerization. Polymer 2003, 44, 4781–4789. [Google Scholar] [CrossRef]
- Zhou, R.C.; Mhanna, R.; Jin, M.; Pan, H.; Wan, D.; Versace, D.-L.; Thomas, C.; Morlet-Savary, F.; Soppera, O.; Malval, J.-P. Comparative Photoinitiating Performances of Donor-Acceptor Multibranched Triphenylamines Designed for Light-Triggered Micropatterning Applications. ACS Appl. Polym. Mater. 2021, 3, 3103–3113. [Google Scholar] [CrossRef]
- Sangermano, M.; Roppolo, I. A Chiappone. New Horizons in Cationic Photopolymerization. Polymers 2018, 10, 136. [Google Scholar] [CrossRef]
- Sangermano, M.; Razza, N.; Crivello, J.V. Cationic UV-Curing: Technology and Applications. Macromol. Mater. Eng. 2014, 299, 775–793. [Google Scholar] [CrossRef]
- Czachor-Jadacka, D.; Pilch-Pitera, B. Progress in development of UV curable powder coatings. Prog. Org. Coat. 2021, 158, 106355. [Google Scholar] [CrossRef]
- Endruweit, A.; Johnson, M.S.; Long, A.C. Curing of composite components by ultraviolet radiation: A review. Polym. Compos. 2006, 27, 119–128. [Google Scholar] [CrossRef]
- Ito, S.; Kaneko, S.; Yun, C.M.; Kobayashi, K.; Nakagawa, M. Investigation of Fluorinated (Meth)Acrylate Monomers and Macromonomers Suitable for a Hydroxy-Containing Acrylate Monomer in UV Nanoimprinting. Langmuir 2014, 30, 7127–7133. [Google Scholar] [CrossRef] [PubMed]
- Corcione, C.E.; Striani, R.; Frigione, M. UV-cured siloxane-modified methacrylic system containing hydroxyapatite as potential protective coating for carbonate stones. Prog. Org. Coat. 2013, 76, 1236–1242. [Google Scholar] [CrossRef]
- Chen, C.; Li, M.L.; Gao, Y.; Nie, J.; Sun, F. A study of nanogels with different polysiloxane chain lengths for photopolymerization stress reduction and modification of polymer network properties. RSC Adv. 2015, 5, 33729–33736. [Google Scholar] [CrossRef]
- Roth, M.; Hennen, D.; Oesterreicher, A.; Mostegel, F.H.; Kappaun, S.; Edler, M.; Griesser, T. Exploring functionalized benzophenones as low-migrationphotoinitiators for vinyl carbonate/thiol formulations. Eur. Polym. J. 2017, 88, 403–411. [Google Scholar] [CrossRef]
- Klemm, E.; Sensfuß, S.; Holfter, U.; Flammersheim, H.J. Free-Radical stabilizers for the thiol/ene-systems. Angew. Chem. Int. Ed. 1993, 212, 121–127. [Google Scholar] [CrossRef]
- Chen, Z.; Zhang, M.; Ren, P.; Lan, Z.; Guo, Z.; Yan, H.; Jin, Y.; Ren, F. Enhanced mechanical and tribological properties of epoxy composites reinforced by novel hyperbranched polysiloxane functionalized graphene/MXene hybrid. Chem. Eng. J. 2023, 466, 143086. [Google Scholar] [CrossRef]
- Cazaux, F.; Coqueret, X. Polydimethylsiloxanes with vinyl ether end-groups-I. synthesis and properties as polymerizable wetting agents. Eur. Polym. J. 1995, 31, 521–525. [Google Scholar] [CrossRef]
- Corcione, C.E.; Previderio, A.; Frigione, M. Kinetics characterization of a novel photopolymerizable siloxane-modified acrylic resin. Thermochim. Acta 2010, 509, 56–61. [Google Scholar] [CrossRef]
- Corcione, C.E.; Frigione, M. Factors influencing photo curing kinetics of novel UV-cured siloxane-modified acrylic coatings: Oxygen inhibition and composition. Thermochim. Acta 2012, 534, 21–27. [Google Scholar] [CrossRef]
- Crivello, J.V.; Reichmanis, E. Photopolymer Materials and Processes for Advanced Technologies. Chem. Mater. 2013, 26, 533–548. [Google Scholar] [CrossRef]
- Li, X.; Bian, F.; Li, S.; Gui, X.; Yao, M.; Hu, J.; Lin, S. Preparation of siloxymethyl-modified silicone acrylate prepolymers with UV/moisture dual curability for applications in anti-smudge and anti-fingerprint coatings. Colloids Surf. A 2023, 658, 130669. [Google Scholar] [CrossRef]
- Li, X.Q.; Bian, F.Q.; Hu, J.W.; Li, S.; Gui, X.; Lin, S. One-step synthesis of novel multifunctional silicone acrylate prepolymers for use in UV-curable coatings. Prog. Org. Coat. 2022, 163, 106601. [Google Scholar] [CrossRef]
- Liu, Q.; Dong, H.; Guo, S.; Zhang, Y.; Wang, E.; Qu, Z.; Chen, D.; Huang, L.; Hou, J.; Zheng, Y.; et al. Preparation and properties of a fast-cross-linkingα-cyanoacryloyloxyethyloxypropyl-functionalizedpolydimethylsiloxane. Nano Sel. 2022, 3, 1557–1573. [Google Scholar] [CrossRef]
- Cai, L.; Xia, Y.; Jin, C.; Hu, X.; Xu, Y.; Chen, Y.; Zhang, R.; Qu, Z.; Dong, H.; Wu, C. Synthesis and UV curing properties of cycloaliphatic epoxy functionalized cross-type MDQ silicone resins. China Plast. Ind. 2023, 51, 35–43. [Google Scholar] [CrossRef]
- Chandra, D.; Crosby, A.J. Self-wrinkling of UV-Cured Polymer Films. Adv. Mater. 2011, 23, 3441–3445. [Google Scholar] [CrossRef]


| Entry | Mn a (g·mol−1) | m b DHEP-PDMS (g) | m c AC (g) | m d TEA (g) | m e DCM (g) | m f DAEP-PDMS (g) | Mn g (g·mol−1) | Reaction Degree (%) | Yield (%) | PDI | η25 (cP) |
|---|---|---|---|---|---|---|---|---|---|---|---|
| DAEP-PDMS-1 | 1050 | 30.00 | 5.18 | 5.79 | 30.00 | 26.28 | 1180 | 84.7 | 74.7 | 1.90 | 32.75 |
| DAEP-PDMS-2 | 1910 | 30.00 | 2.84 | 3.18 | 30.00 | 23.03 | 2130 | 78.1 | 70.1 | 2.17 | 31.50 |
| DAEP-PDMS-3 | 3020 | 30.00 | 1.80 | 2.01 | 30.00 | 24.21 | 3090 | 93.7 | 76.1 | 1.97 | 73.25 |
| DAEP-PDMS-4 | 4010 | 30.00 | 1.35 | 1.51 | 30.00 | 23.26 | 4150 | 82.4 | 74.2 | 2.12 | 95.00 |
| Entry | Precursor | M a NMR (g·mol−1) | m b (g) | m c AHE (g) | m d Cat. (g) | m e (g) | Yield (%) |
|---|---|---|---|---|---|---|---|
| MAMP-PDMS-1 | MDMS-PDMS-1 | 550 | 20.00 | 3.74 | 0.24 | 21.58 | 90.90 |
| MAMP-PDMS-2 | MDMS-PDMS-2 | 960 | 30.00 | 3.17 | 0.33 | 30.93 | 93.25 |
| MAMP-PDMS-3 | MDMS-PDMS-3 | 1440 | 18.86 | 1.34 | 0.20 | 18.23 | 90.27 |
| MAMP-PDMS-4 | MDMS-PDMS-4 | 2220 | 30.00 | 1.38 | 0.31 | 29.30 | 93.37 |
| Entry | Intermediate | m a (g) | MNMR (g·mol−1) | mAC (g) | mTEA (g) | mDCM (g) | m b (g) | Reaction Degree (%) | Yield (%) | η25 (cP) |
|---|---|---|---|---|---|---|---|---|---|---|
| MAEP-PDMS-1 | MAMP-PDMS-1 | 15.00 | 650 | 2.09 | 2.34 | 30.00 | 14.55 | 89.5 | 85.14 | 7.25 |
| MAEP-PDMS-2 | MAMP-PDMS-2 | 15.00 | 1060 | 1.28 | 1.42 | 30.00 | 12.54 | 86.8 | 77.03 | 15.75 |
| MAEP-PDMS-3 | MAMP-PDMS-3 | 18.00 | 1550 | 1.06 | 1.21 | 36.00 | 13.78 | 72.8 | 72.30 | 64.00 |
| MAEP-PDMS-4 | MAMP-PDMS-4 | 15.00 | 2220 | 0.61 | 0.68 | 30.00 | 10.73 | 39.0 | 68.74 | 41.75 |
| Entry | Prepolymer | mHMPP/mHCPK | Gelation Yield (%) |
|---|---|---|---|
| A1 | DAEP-PDMS-1 | 1:0 | 89.1 |
| A2 | DAEP-PDMS-1 | 1:1 | 89.2 |
| A3 | DAEP-PDMS-1 | 2:1 | 89.3 |
| A4 | DAEP-PDMS-1 | 3:1 | 89.3 |
| A5 | DAEP-PDMS-1 | 4:1 | 89.8 |
| A6 | DAEP-PDMS-1 | 5:1 | 89.5 |
| B1 | MAEP-PDMS-1 | 1:0 | 81.0 |
| B2 | MAEP-PDMS-1 | 1:1 | 85.8 |
| B3 | MAEP-PDMS-1 | 2:1 | 81.6 |
| B4 | MAEP-PDMS-1 | 3:1 | 82.8 |
| B5 | MAEP-PDMS-1 | 4:1 | 85.4 |
| B6 | MAEP-PDMS-1 | 5:1 | 81.2 |
| Entry | Sg/Sa | First Test | Second Test | Third Test | Water Absorption (%) | ||||||
|---|---|---|---|---|---|---|---|---|---|---|---|
| ma1 (mg) | mb1 (mg) | mc1 (mg) | ma2 (mg) | mb2 (mg) | mc2 (mg) | ma3 (mg) | mb3 (mg) | mc3 (mg) | |||
| DAEP-PDMS-1 | 2.25 × 10⁻² | 16.9 | 15.3 | 26.7 | 17.2 | 15.6 | 15.6 | 16.8 | 14.8 | 26.0 | 5.65 |
| DAEP-PDMS-2 | 1.27 × 10⁻² | 27.0 | 40.4 | 23.0 | 29.0 | 44.2 | 44.2 | 26.1 | 39.6 | 22.6 | 12.01 |
| DAEP-PDMS-3 | 0.72 × 10⁻² | 37.0 | 35.4 | 50.9 | 36.9 | 35.8 | 35.8 | 35.7 | 34.8 | 49.5 | 3.26 |
| DAEP-PDMS-4 | 0.57 × 10⁻² | 26.3 | 23.3 | 50.0 | 26.1 | 25.5 | 25.5 | 25.7 | 23.4 | 47.8 | 4.57 |
| MAEP-PDMS-1 | 1.31 × 10⁻² | 46.7 | 46.9 | 44.5 | 27.6 | 26.3 | 25.0 | 15.3 | 14.7 | 14.3 | 4.15 |
| MAEP-PDMS-2 | 0.70 × 10⁻² | 32.8 | 33.0 | 31.4 | 19.5 | 19.9 | 18.9 | 31.0 | 31.6 | 30.4 | 4.63 |
| MAEP-PDMS-3 | 0.57 × 10⁻² | 35.1 | 35.2 | 34.2 | 22.9 | 23.1 | 22.7 | 64.9 | 63.8 | 62.9 | 2.00 |
| MAEP-PDMS-4 | 0.16 × 10⁻² | 47.7 | 47.7 | 45.9 | 27.3 | 26.5 | 26.2 | 23.0 | 22.5 | 22.2 | 2.06 |
| Entry | ρ a (g·cm−3) | W0 b (g) | Ws c (g) | φ d (%) | ve e × 10−4 (mol·cm−3) | Mc f (g·mol−1) |
|---|---|---|---|---|---|---|
| DAEP-PDMS-1 | 0.67 | 0.11 | 0.16 | 0.75 | 39.3 | 172 |
| DAEP-PDMS-2 | 0.88 | 0.11 | 0.21 | 0.52 | 10.0 | 881 |
| DAEP-PDMS-3 | 0.89 | 0.11 | 0.25 | 0.44 | 6.3 | 1413 |
| DAEP-PDMS-4 | 0.74 | 0.10 | 0.21 | 0.51 | 9.7 | 765 |
| MAEP-PDMS-1 | 1.00 | 0.10 | 0.20 | 0.45 | 6.5 | 1537 |
| MAEP-PDMS-2 | 0.85 | 0.13 | 0.31 | 0.44 | 6.0 | 1412 |
| MAEP-PDMS-3 | 0.97 | 0.11 | 0.25 | 0.43 | 5.6 | 1731 |
| MAEP-PDMS-4 | 1.11 | 0.09 | 0.17 | 0.48 | 8.2 | 1350 |
Disclaimer/Publisher’s Note: The statements, opinions and data contained in all publications are solely those of the individual author(s) and contributor(s) and not of MDPI and/or the editor(s). MDPI and/or the editor(s) disclaim responsibility for any injury to people or property resulting from any ideas, methods, instructions or products referred to in the content. |
© 2024 by the authors. Licensee MDPI, Basel, Switzerland. This article is an open access article distributed under the terms and conditions of the Creative Commons Attribution (CC BY) license (https://creativecommons.org/licenses/by/4.0/).
Share and Cite
Du, D.; Chen, X.; Wu, Y.; Wu, C.; Qu, Z.; Song, Y.; Qin, D.; Li, Q.; Dong, H. The Preparation of Acryloxyl Group Functionalized Siloxane Polymers and the Study of Their Ultra Violet Curing Properties. Polymers 2024, 16, 465. https://doi.org/10.3390/polym16040465
Du D, Chen X, Wu Y, Wu C, Qu Z, Song Y, Qin D, Li Q, Dong H. The Preparation of Acryloxyl Group Functionalized Siloxane Polymers and the Study of Their Ultra Violet Curing Properties. Polymers. 2024; 16(4):465. https://doi.org/10.3390/polym16040465
Chicago/Turabian StyleDu, Dan, Xupeng Chen, Yue Wu, Chuan Wu, Zhirong Qu, Yanjiang Song, Dawei Qin, Qiao Li, and Hong Dong. 2024. "The Preparation of Acryloxyl Group Functionalized Siloxane Polymers and the Study of Their Ultra Violet Curing Properties" Polymers 16, no. 4: 465. https://doi.org/10.3390/polym16040465
APA StyleDu, D., Chen, X., Wu, Y., Wu, C., Qu, Z., Song, Y., Qin, D., Li, Q., & Dong, H. (2024). The Preparation of Acryloxyl Group Functionalized Siloxane Polymers and the Study of Their Ultra Violet Curing Properties. Polymers, 16(4), 465. https://doi.org/10.3390/polym16040465