
Preparation and Characterization of Theophylline Controlled Release Matrix System Incorporating Poloxamer 407, Stearyl Alcohol, and Hydroxypropyl Methylcellulose: A Novel Formulation and Development Study


Abstract
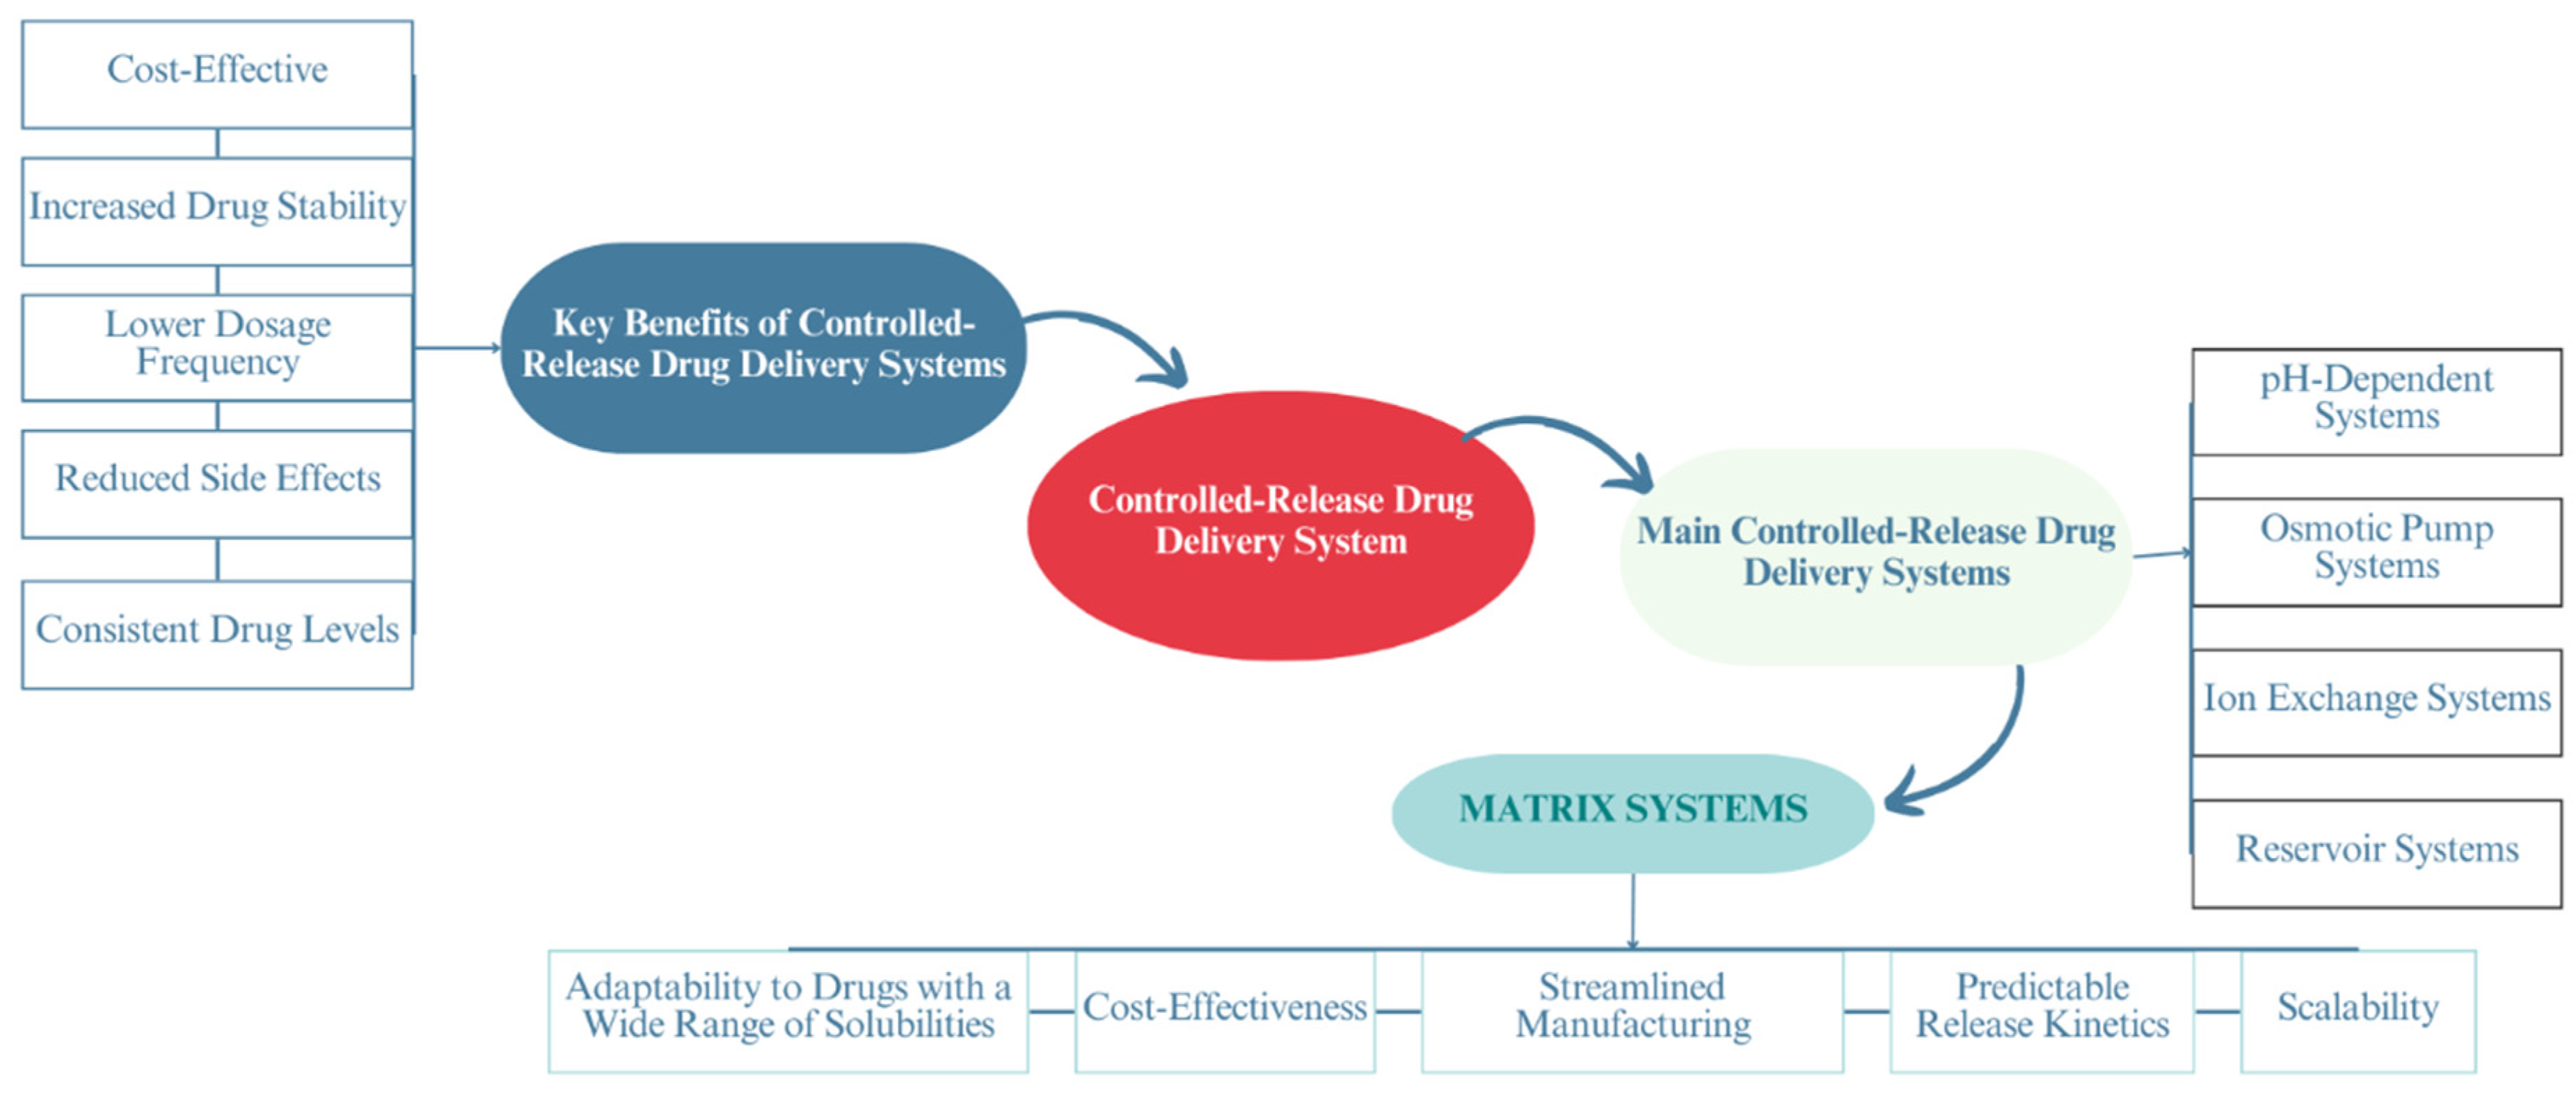
1. Introduction
2. Materials and Methodology
2.1. Materials
2.2. Methodology
2.2.1. Preparation of a Controlled-Release Matrix System Containing Theophylline
Preparation of the First Series of Controlled-Release Matrix Systems: Incorporating THN with P-407
Preparation of the Second Series of Controlled-Release Matrix Systems: Combining THN, P-407, and STA
Preparation of the Third Series of Controlled-Release Matrix Systems: Incorporating THN, P-407, and HPMC
Preparation of the Fourth Series of Controlled-Release Matrix Systems: Integrating THN, P-407, STA, and HPMC
2.2.2. Drug Content Determination
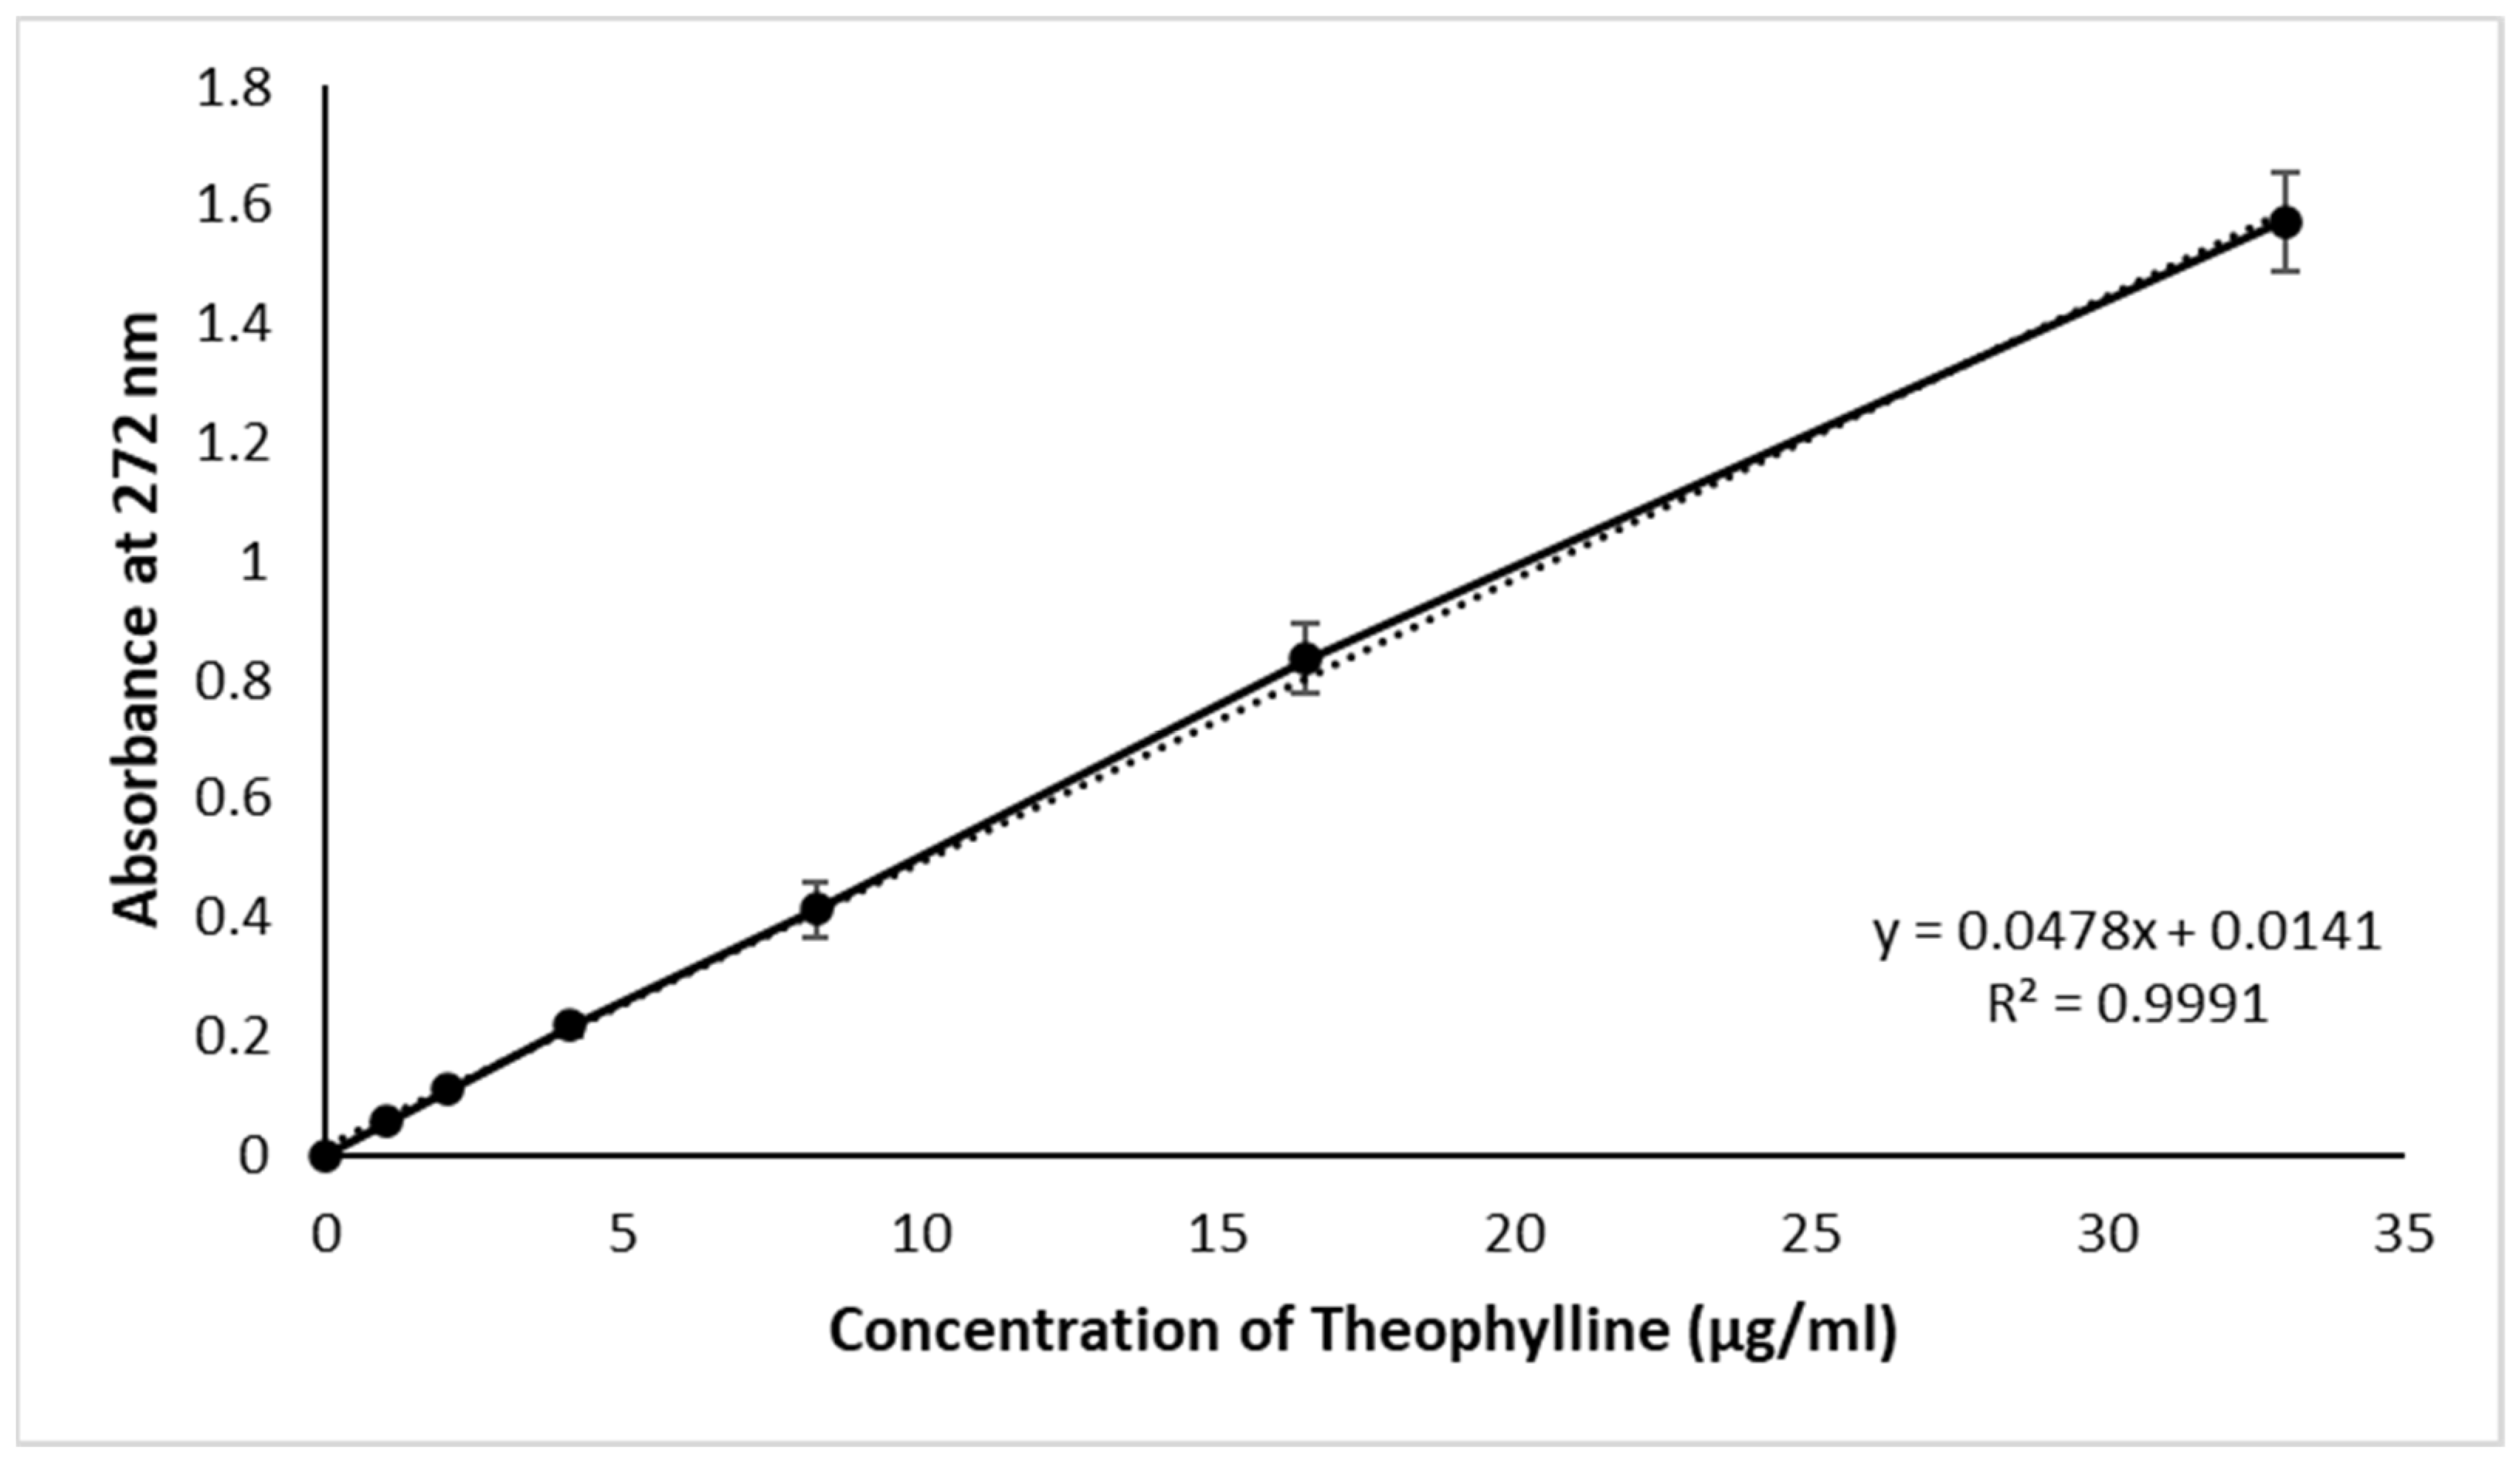
2.2.3. Calibration Curve
2.2.4. In Vitro Dissolution Studies
2.2.5. Release Kinetic Model Evaluation
2.2.6. Characterization Using X-ray Diffraction
2.2.7. Characterization Using Scanning Electron Microscopy
2.2.8. Characterization Using Fourier Transform Infrared
2.2.9. Thermal Analysis via Differential Scanning Calorimetry
2.2.10. Thermal Analysis via Thermogravimetric Analysis
2.2.11. Stability under Varied Storage Temperatures and Humidity Levels
2.2.12. Statistical Analyses
3. Results
3.1. Calibration Curve and Drug Content
3.2. In Vitro Drug Release
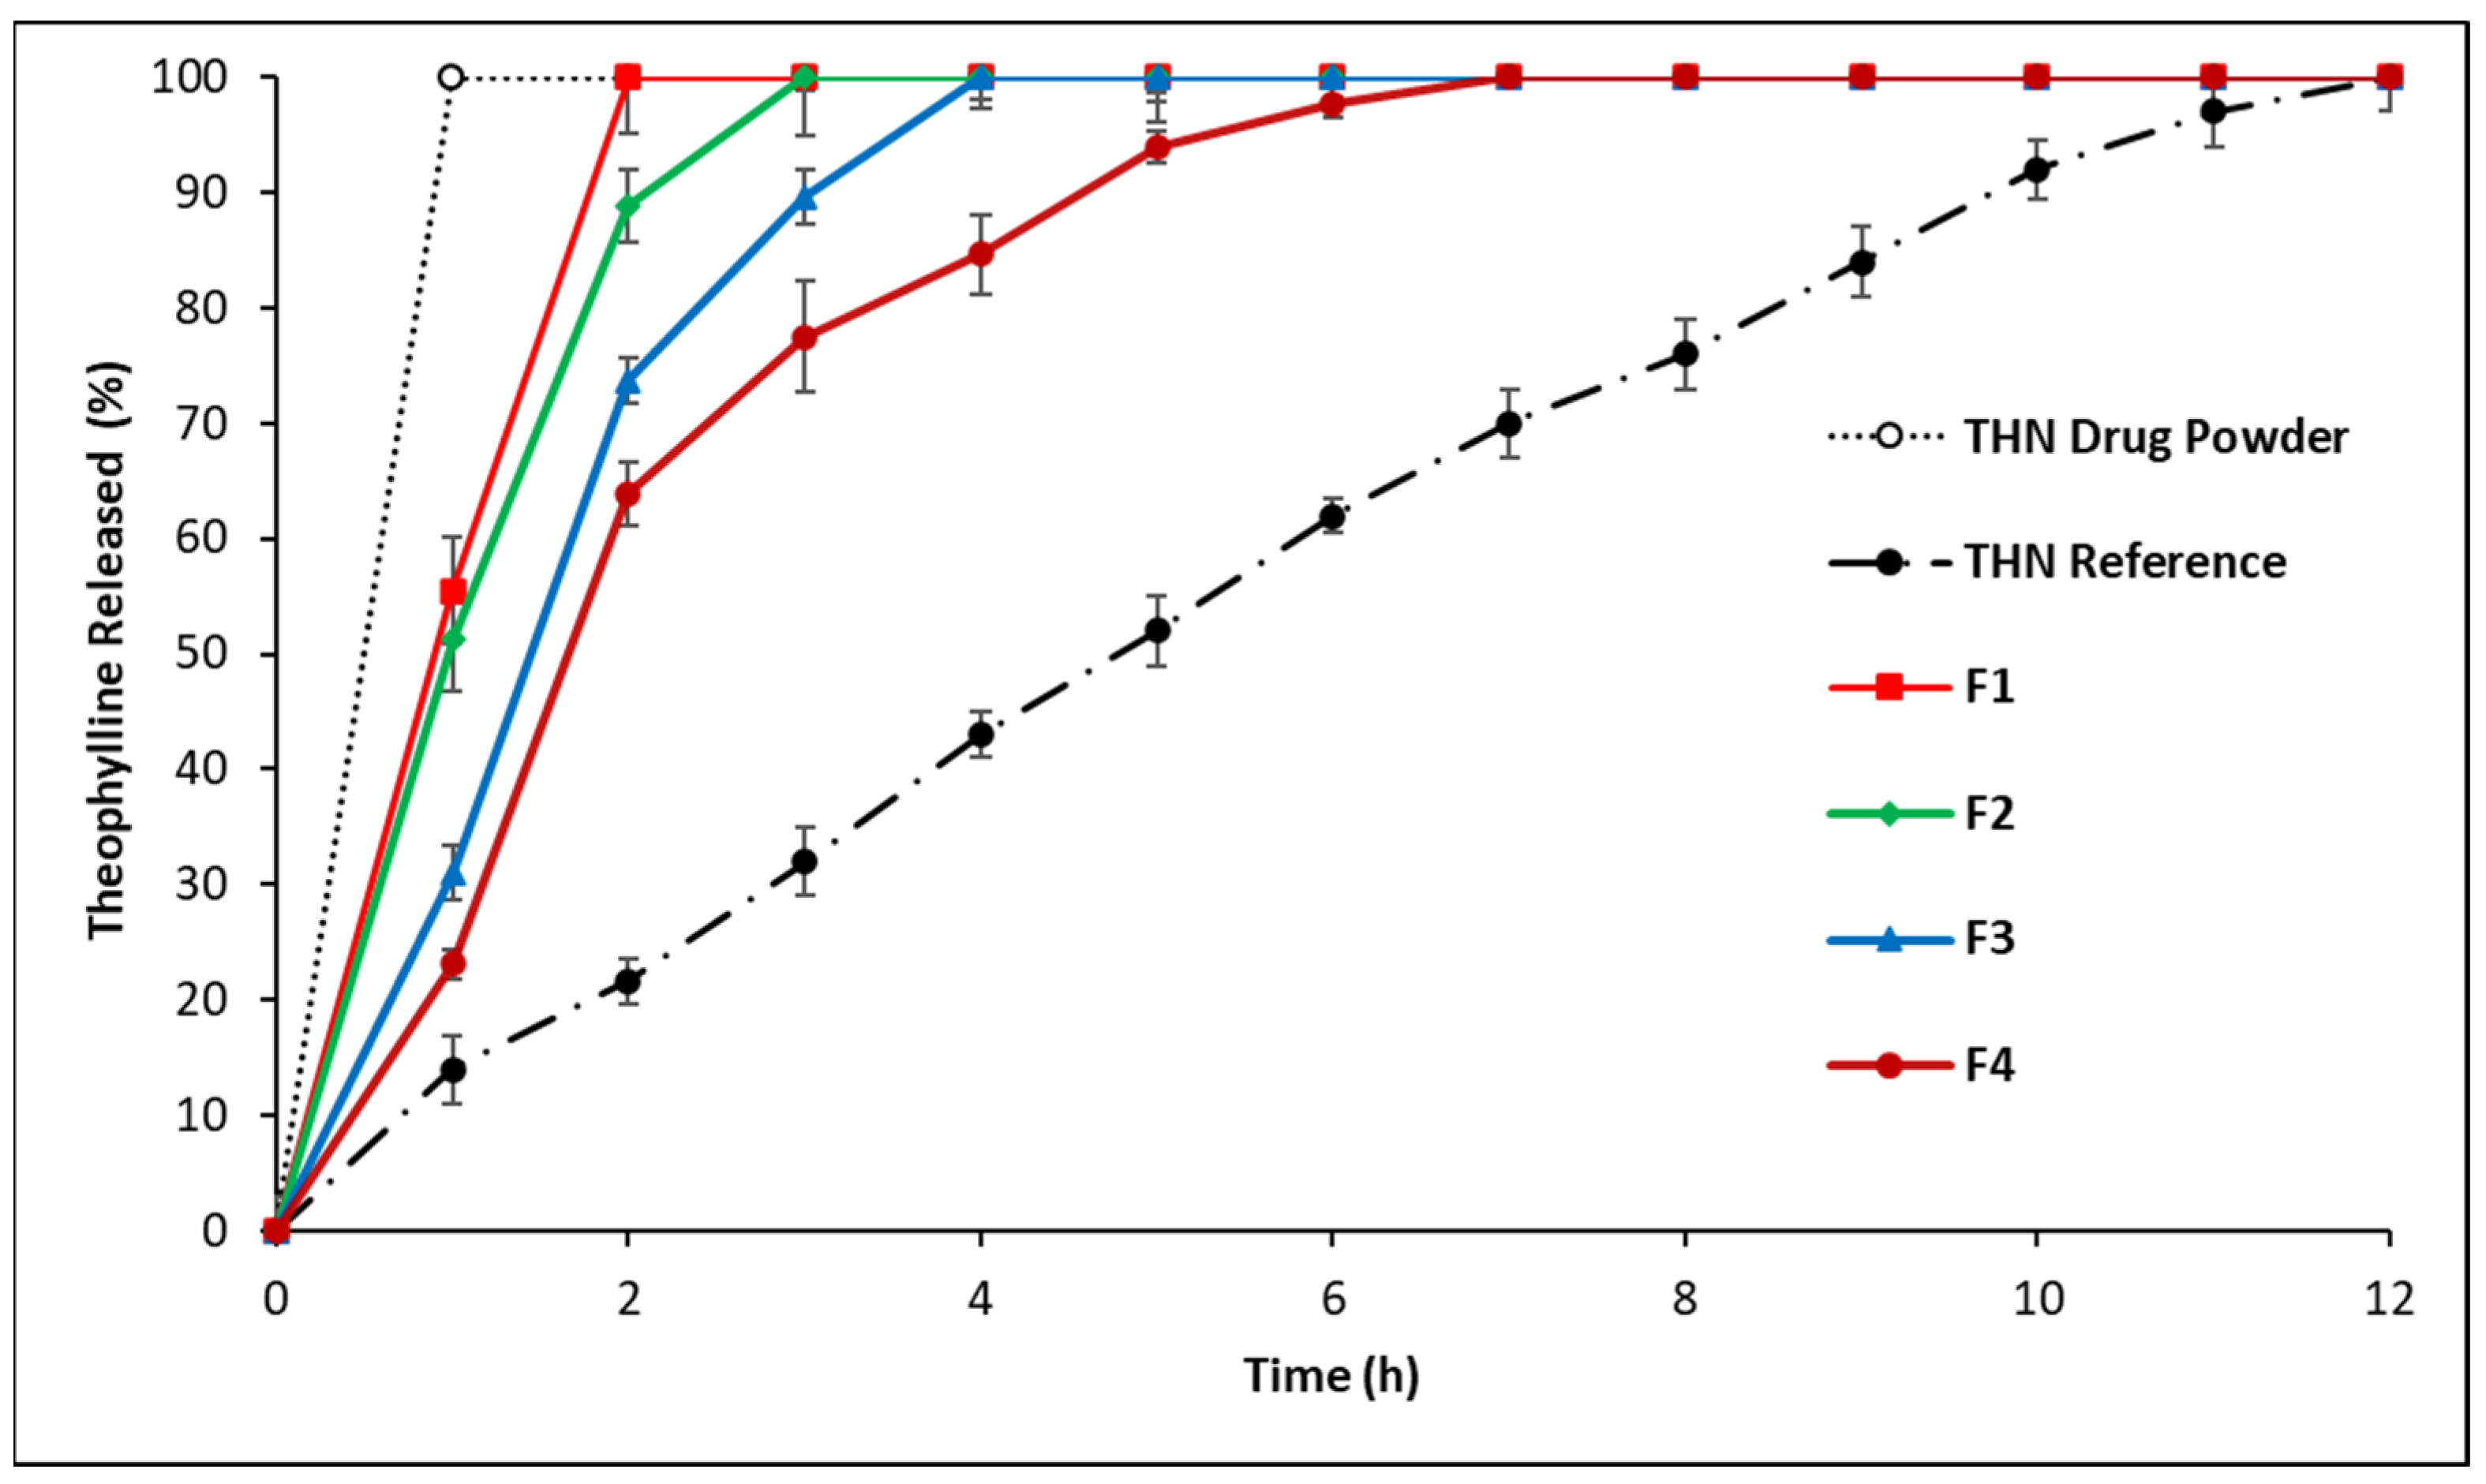
3.2.1. In Vitro Drug Release: First-Series Analysis
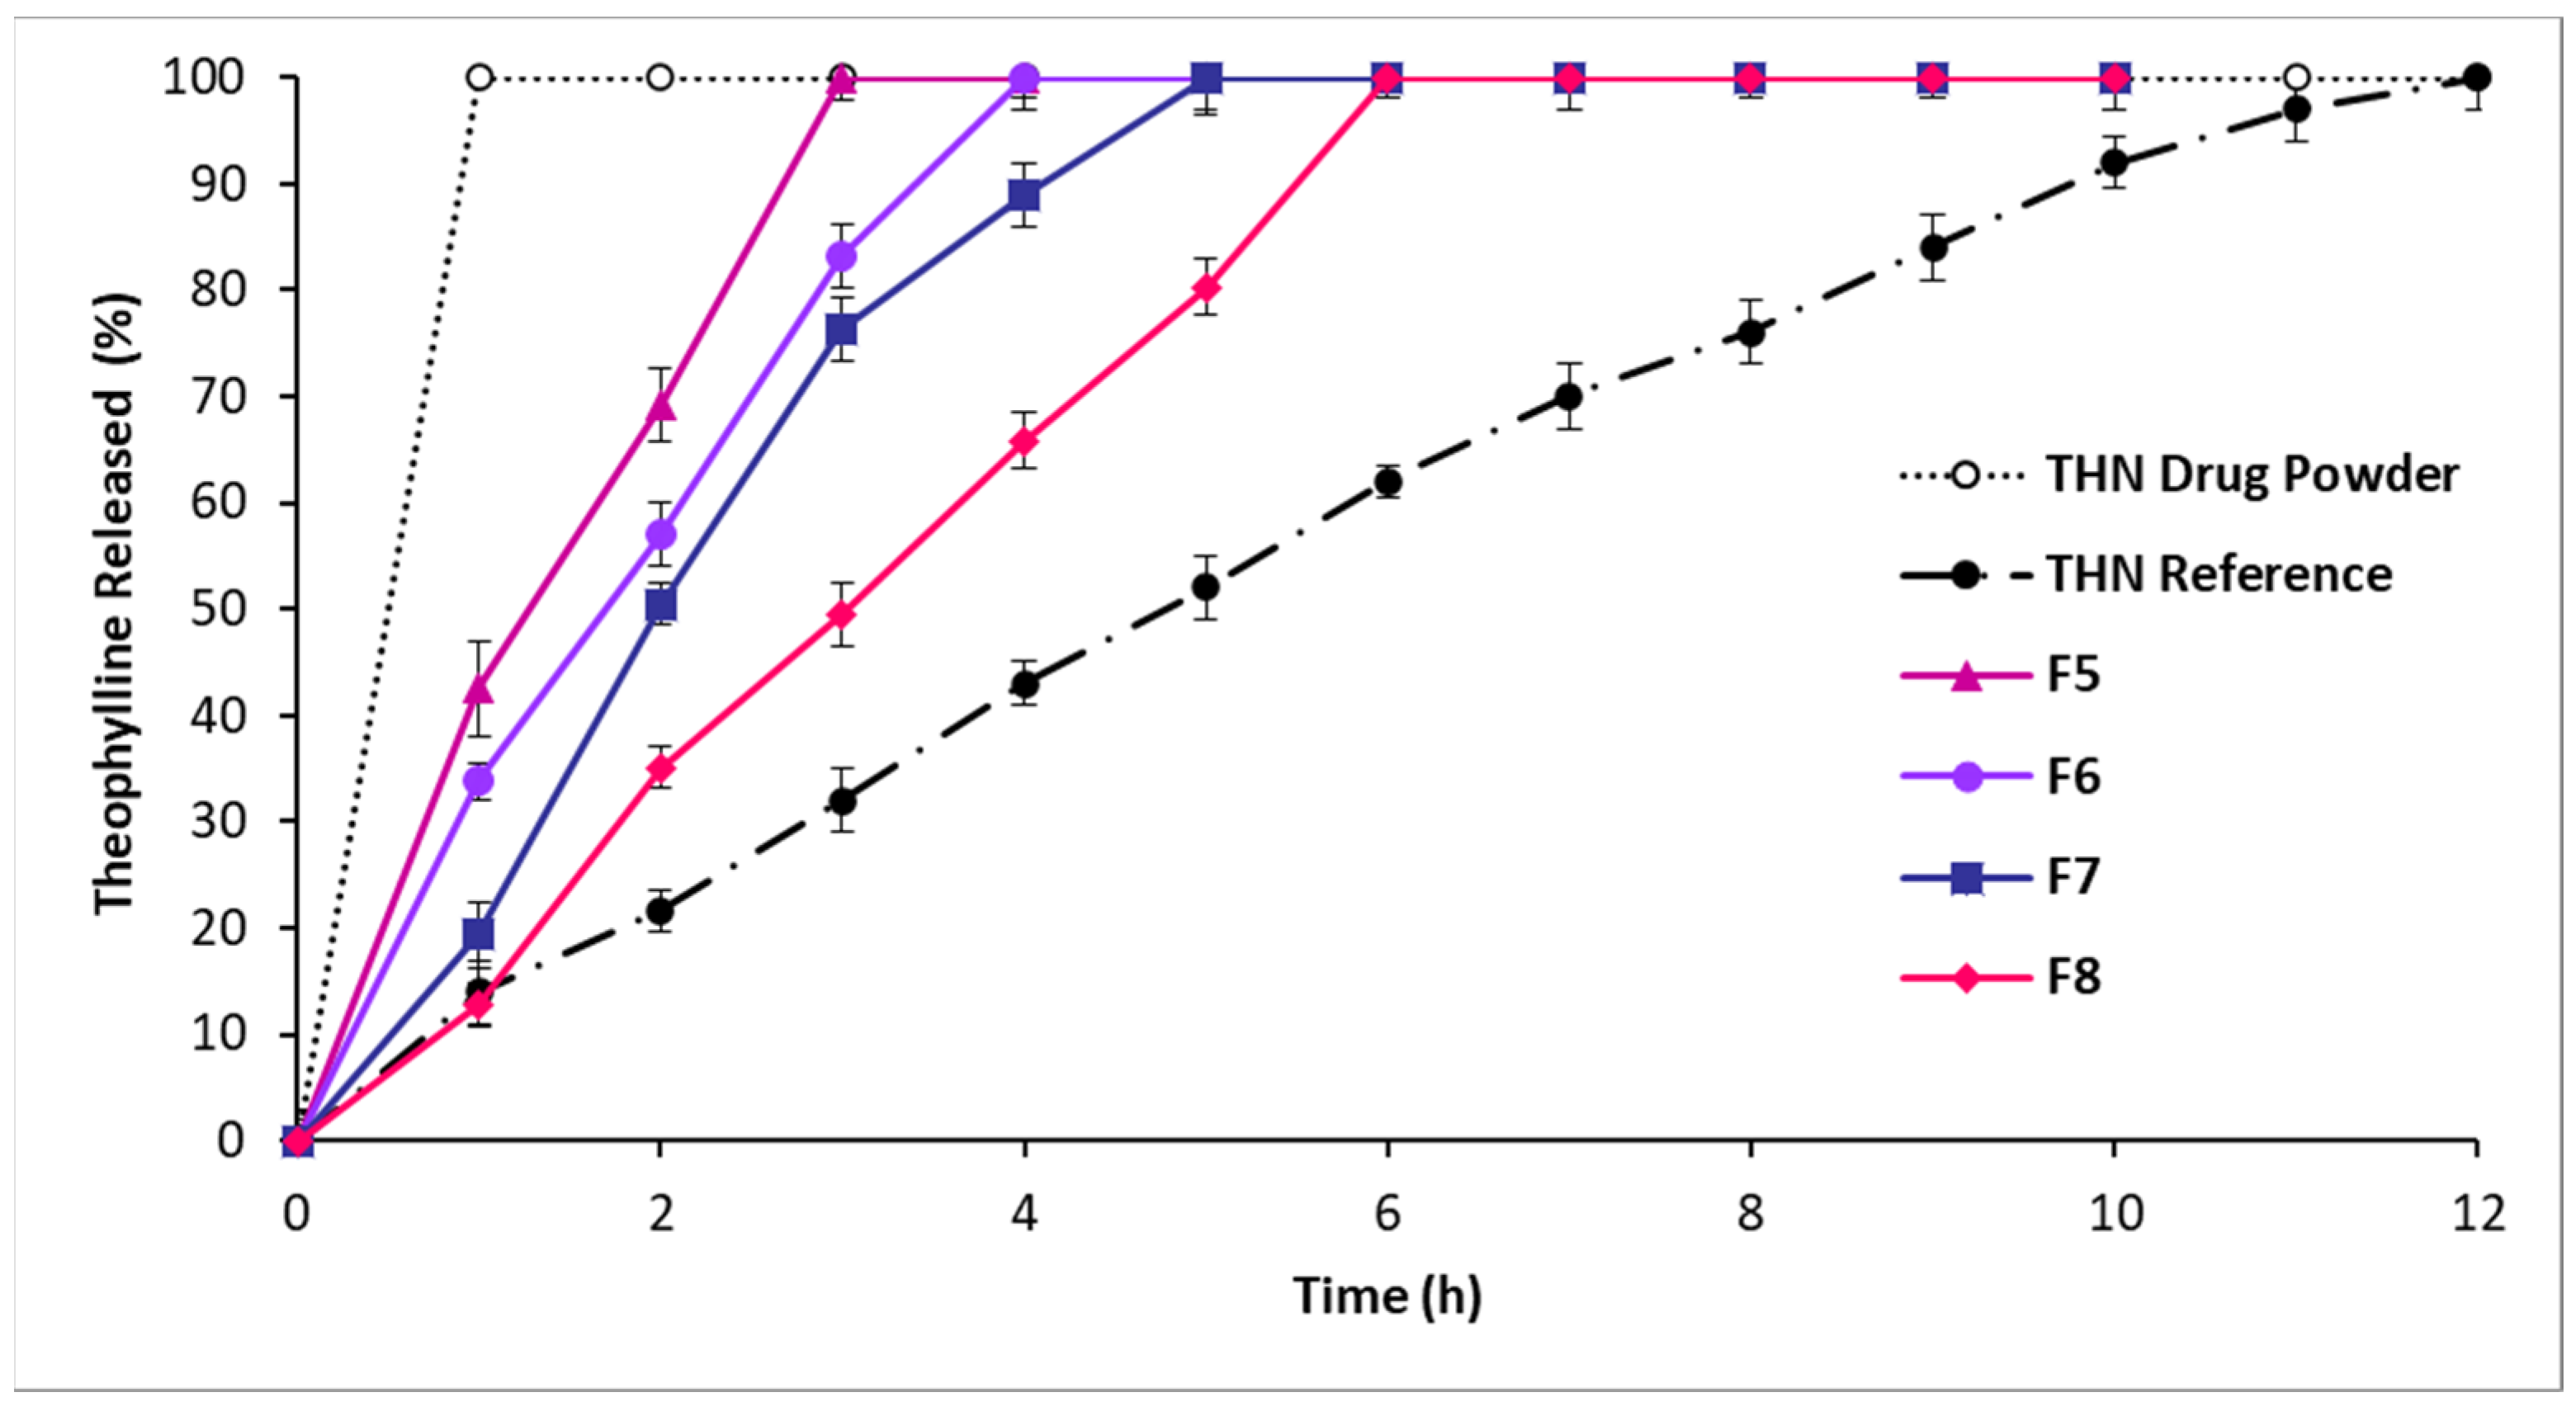
3.2.2. In Vitro Drug Release: Second-Series Analysis
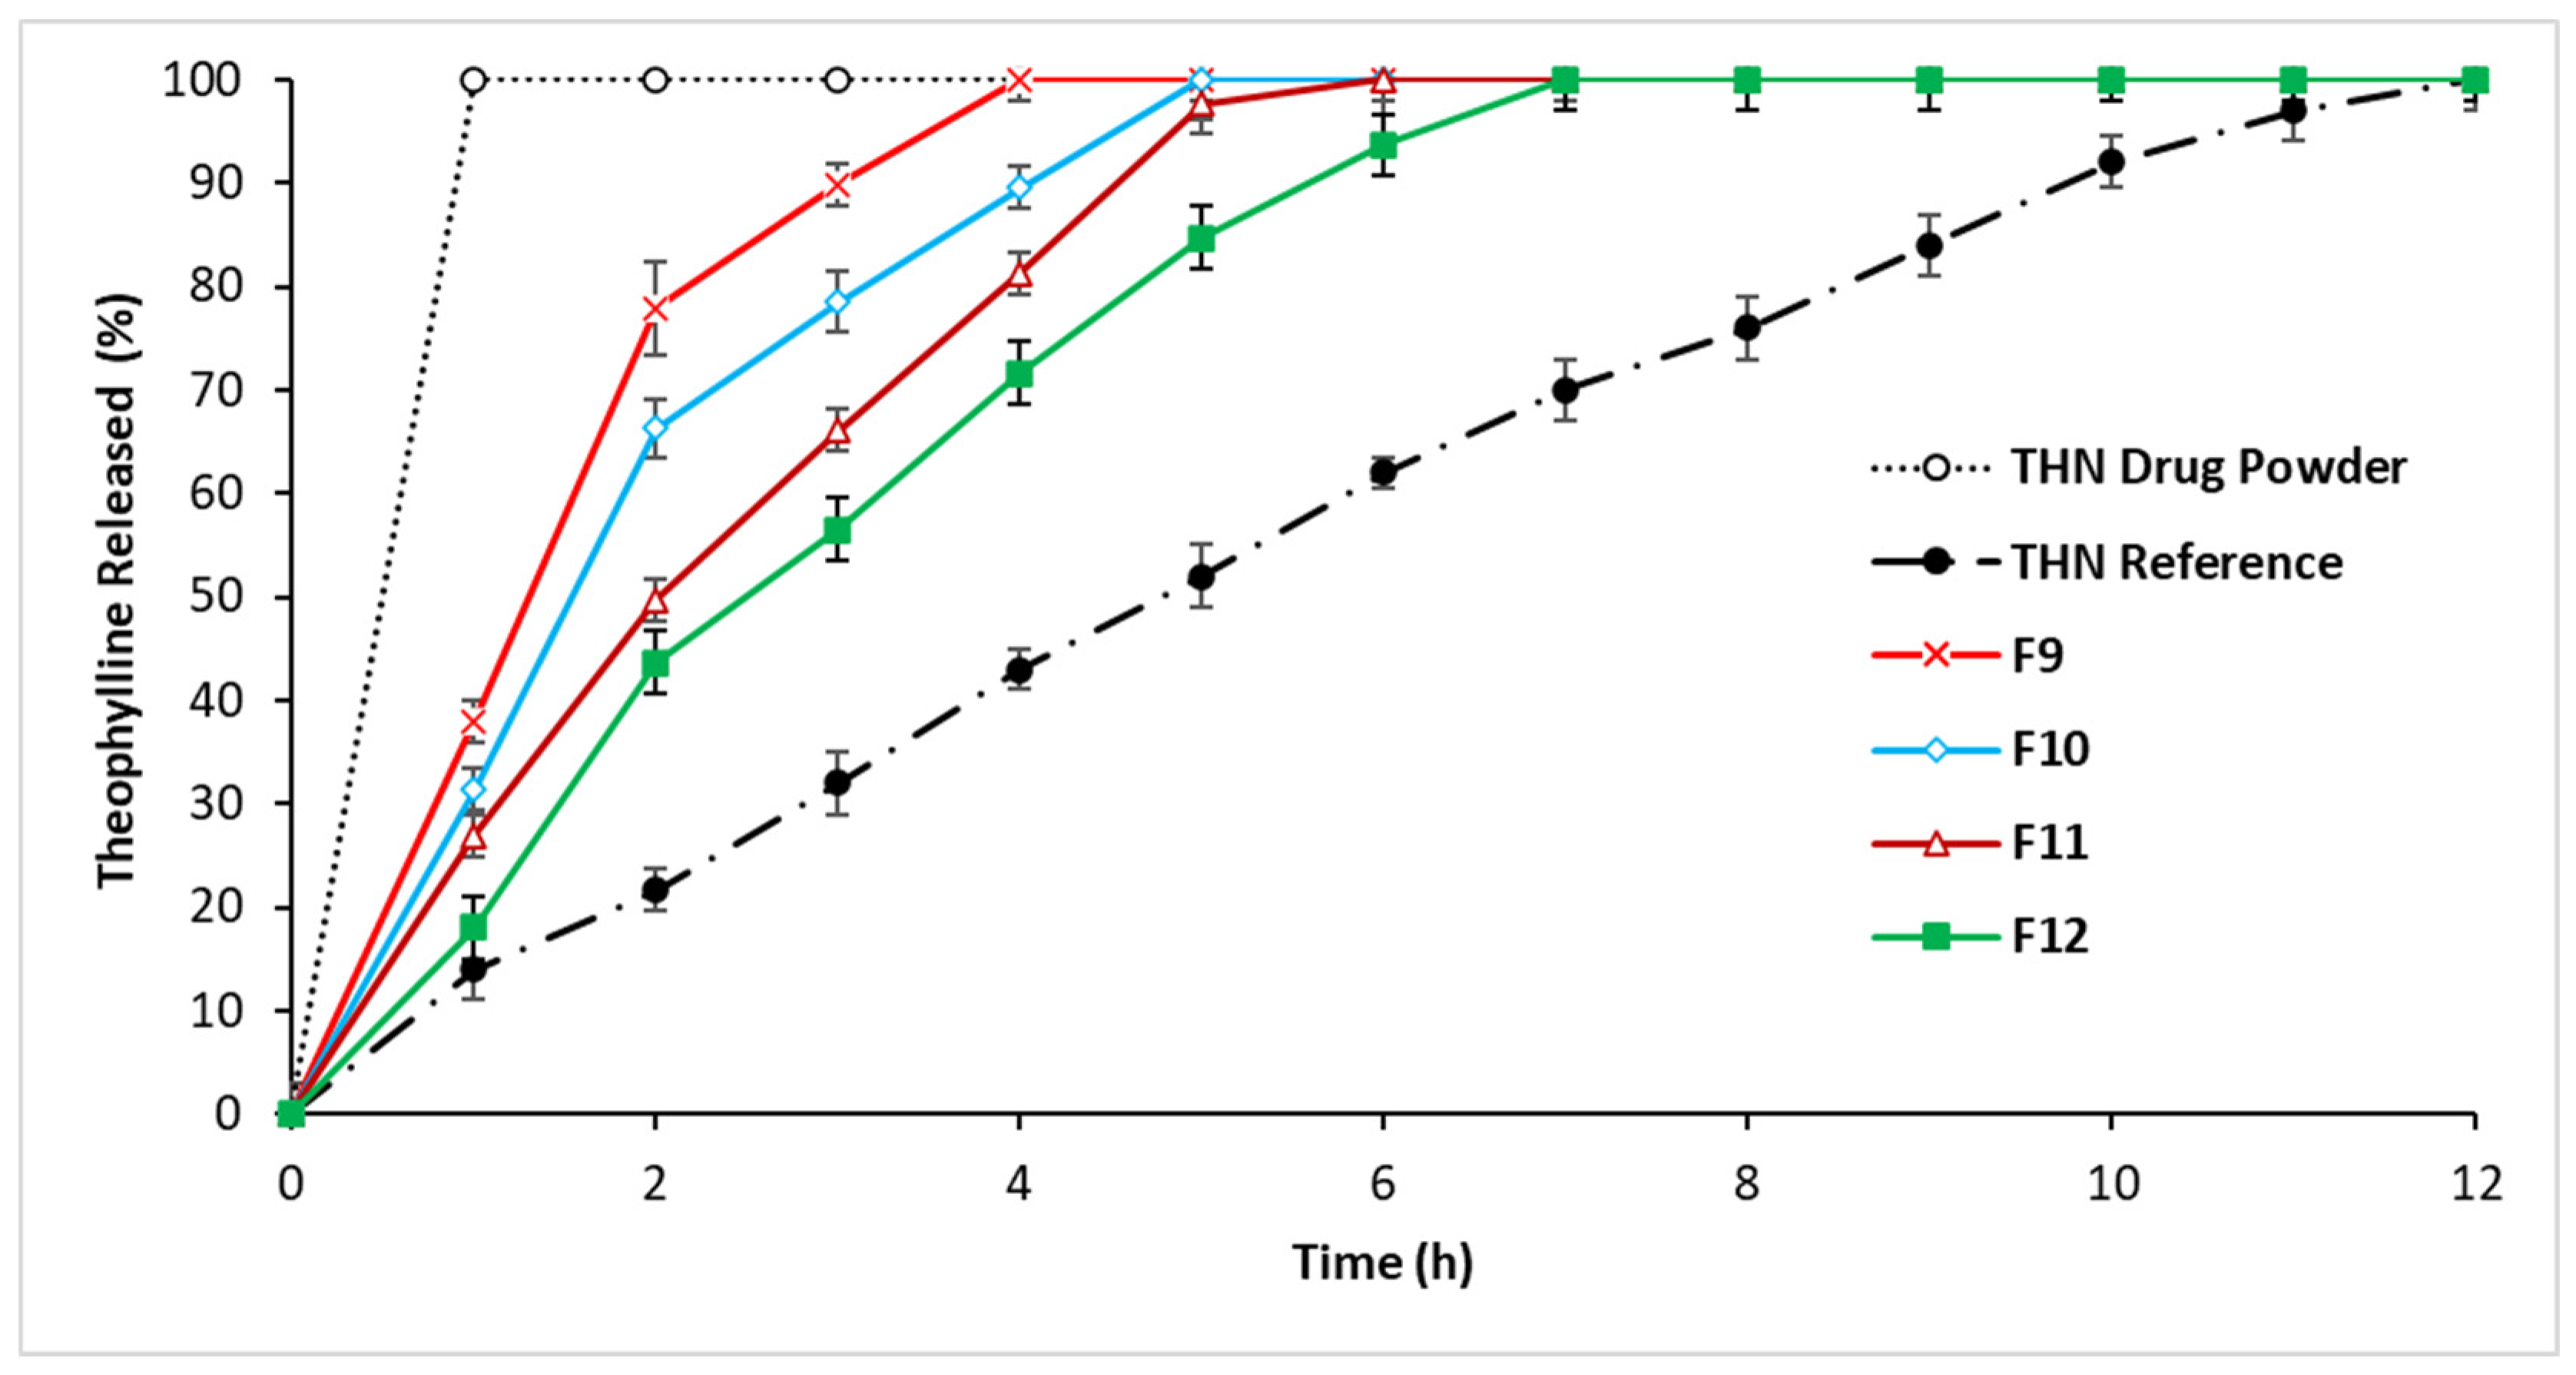
3.2.3. In Vitro Drug Release: Third-Series Analysis
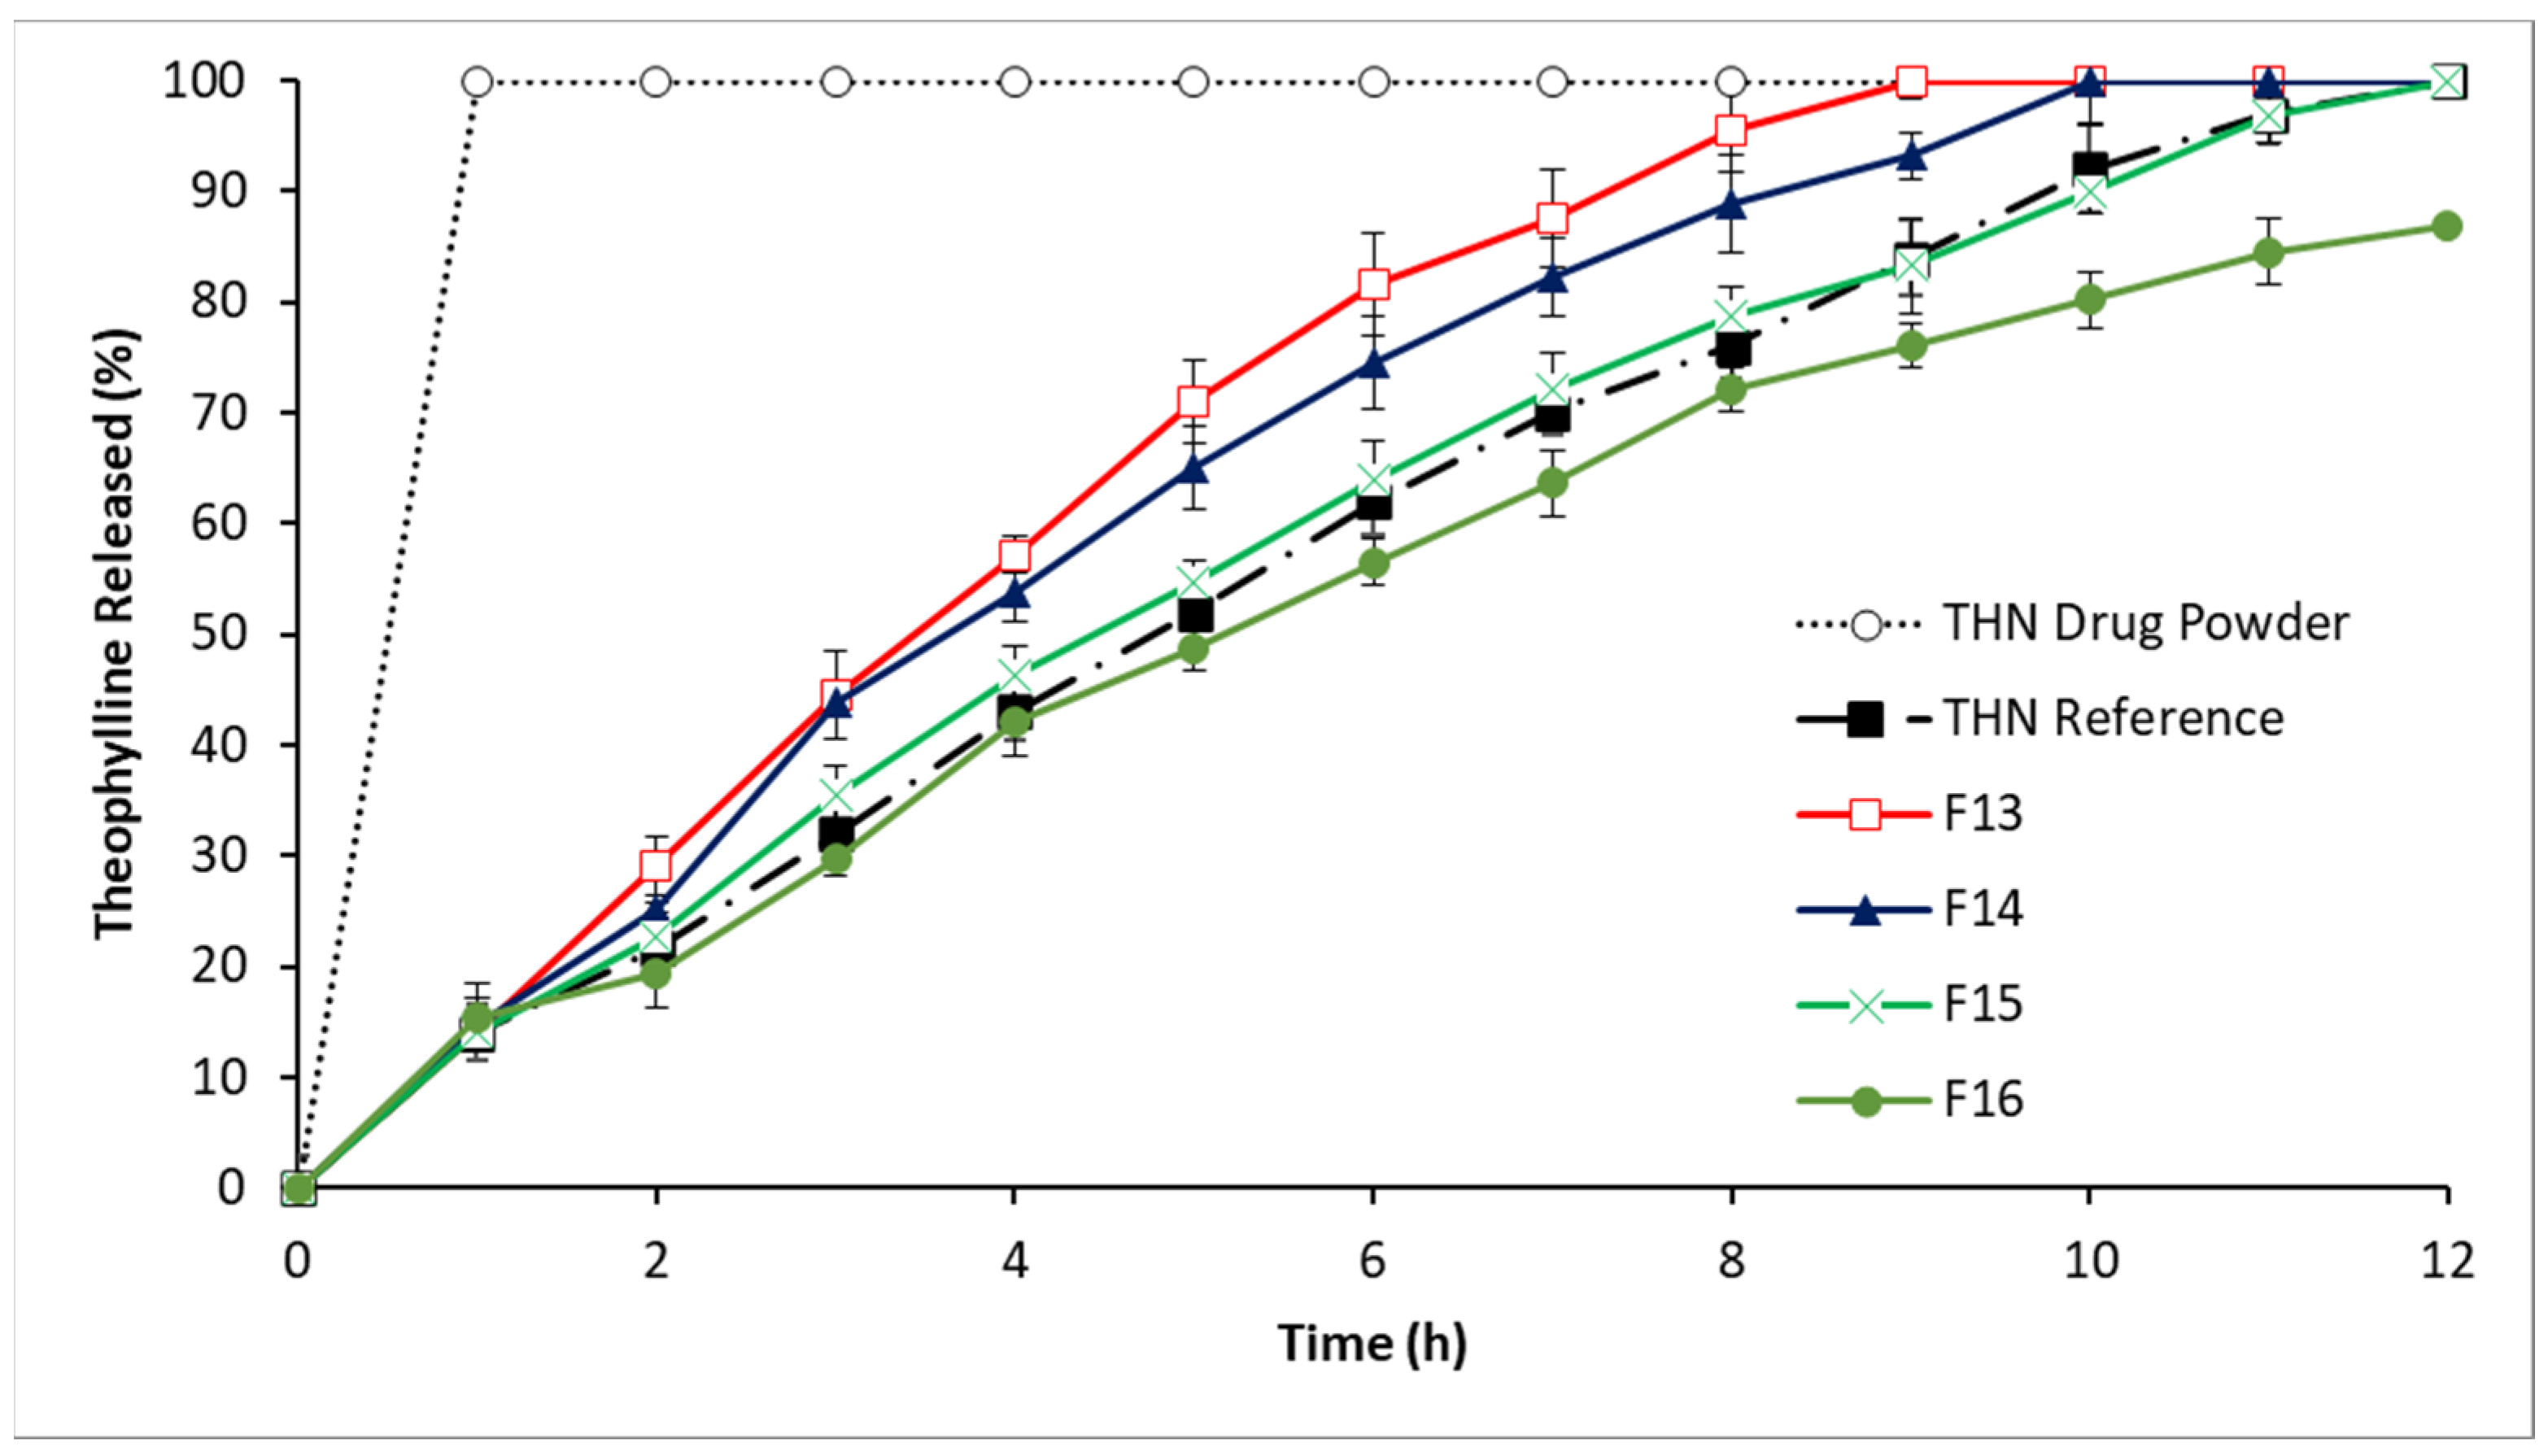
3.2.4. In Vitro Drug Release: Fourth-Series Analysis
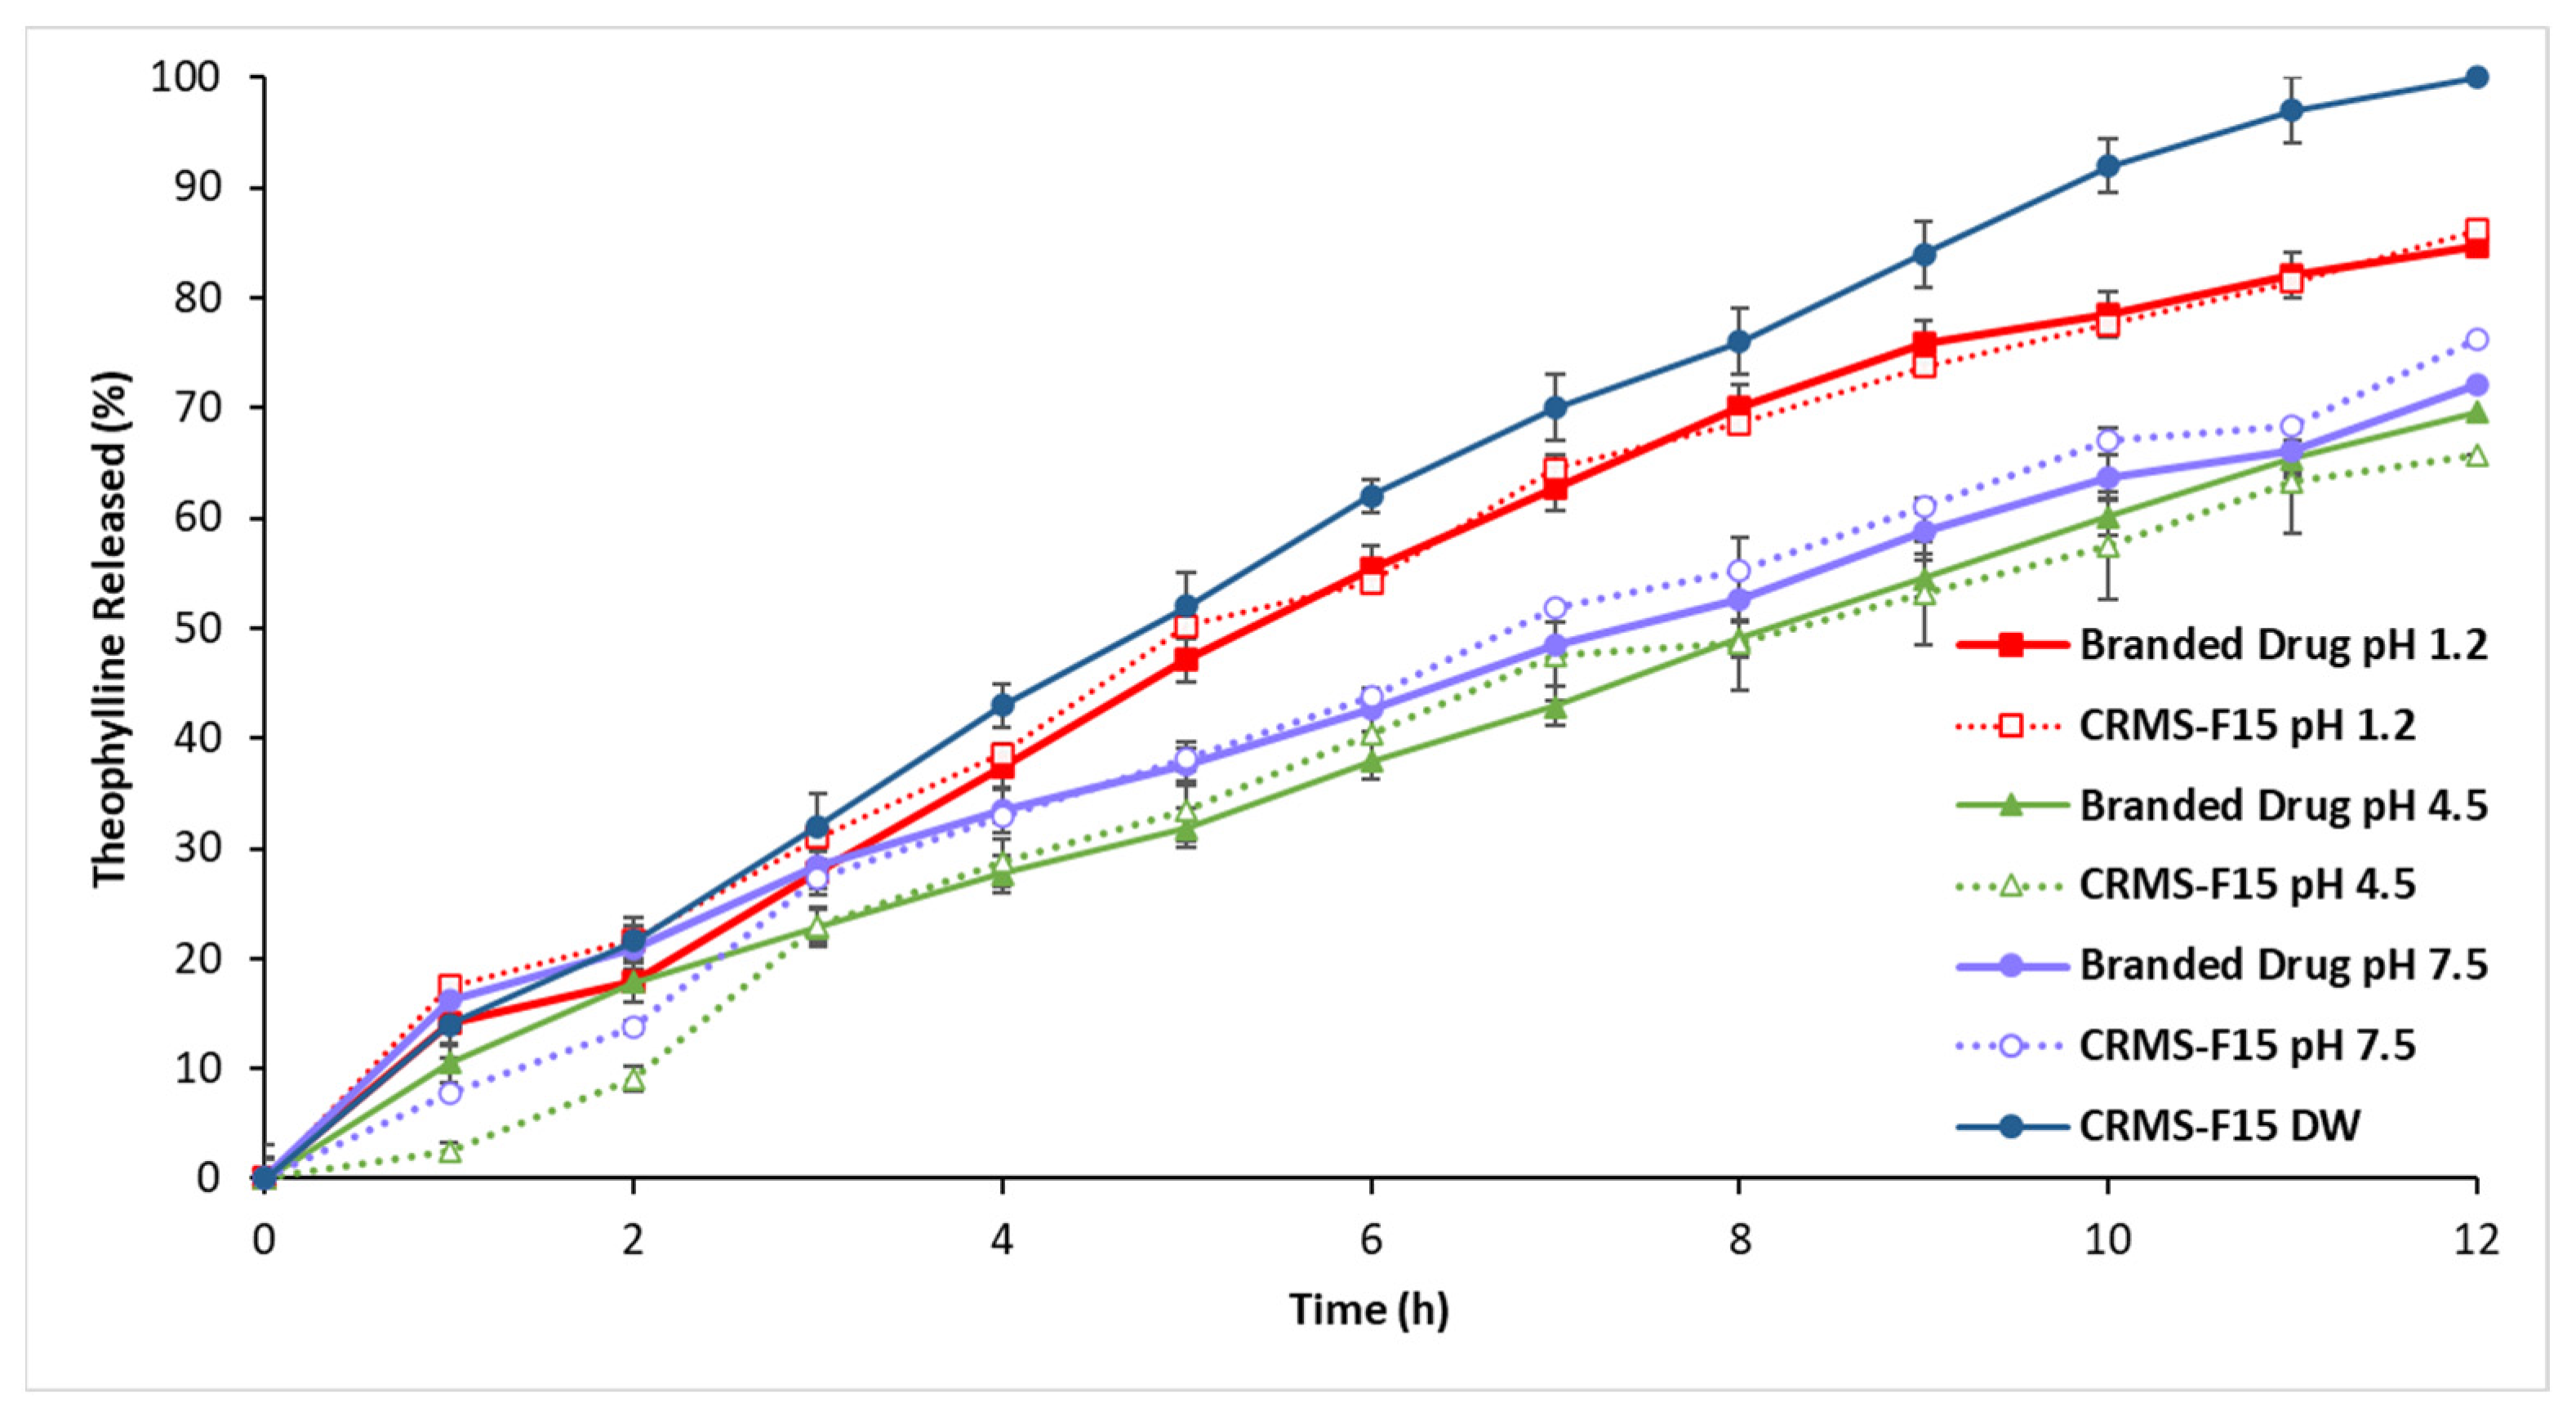
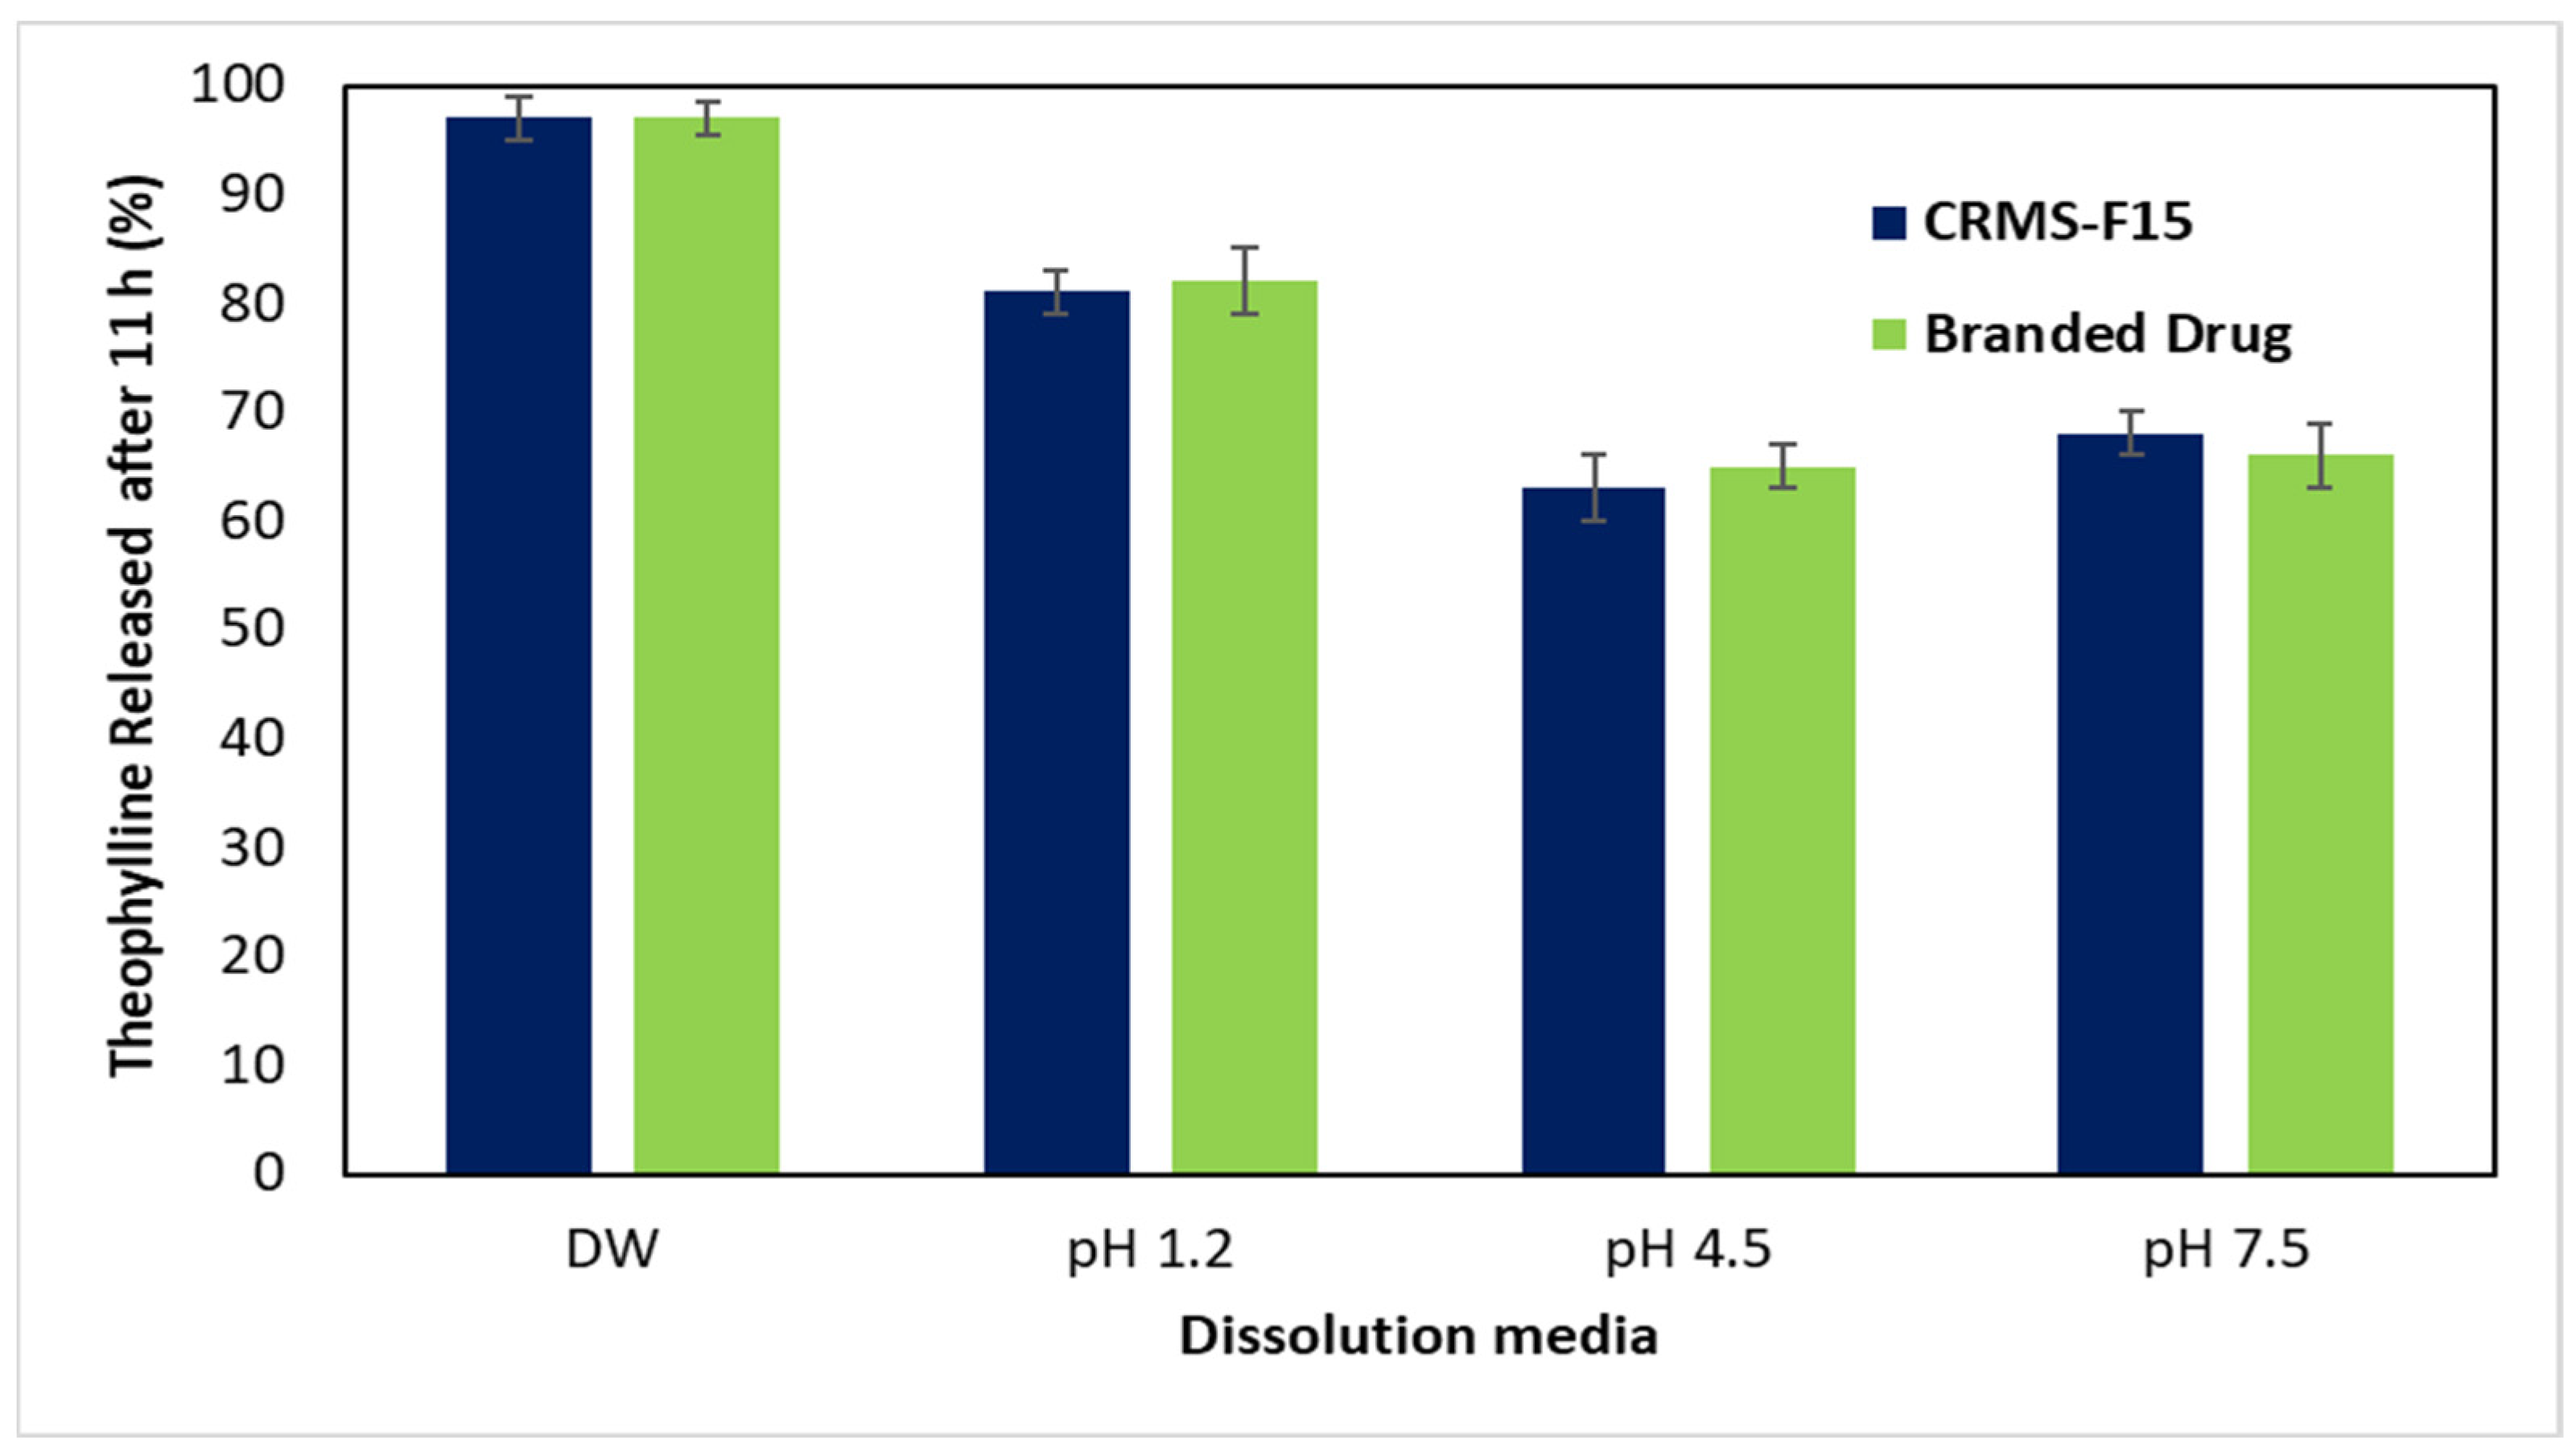
3.2.5. In Vitro Drug Release in Media of Different pH Levels (pH 1.2, 4.5, 7.5)
3.3. Kinetic Release Model Evaluation
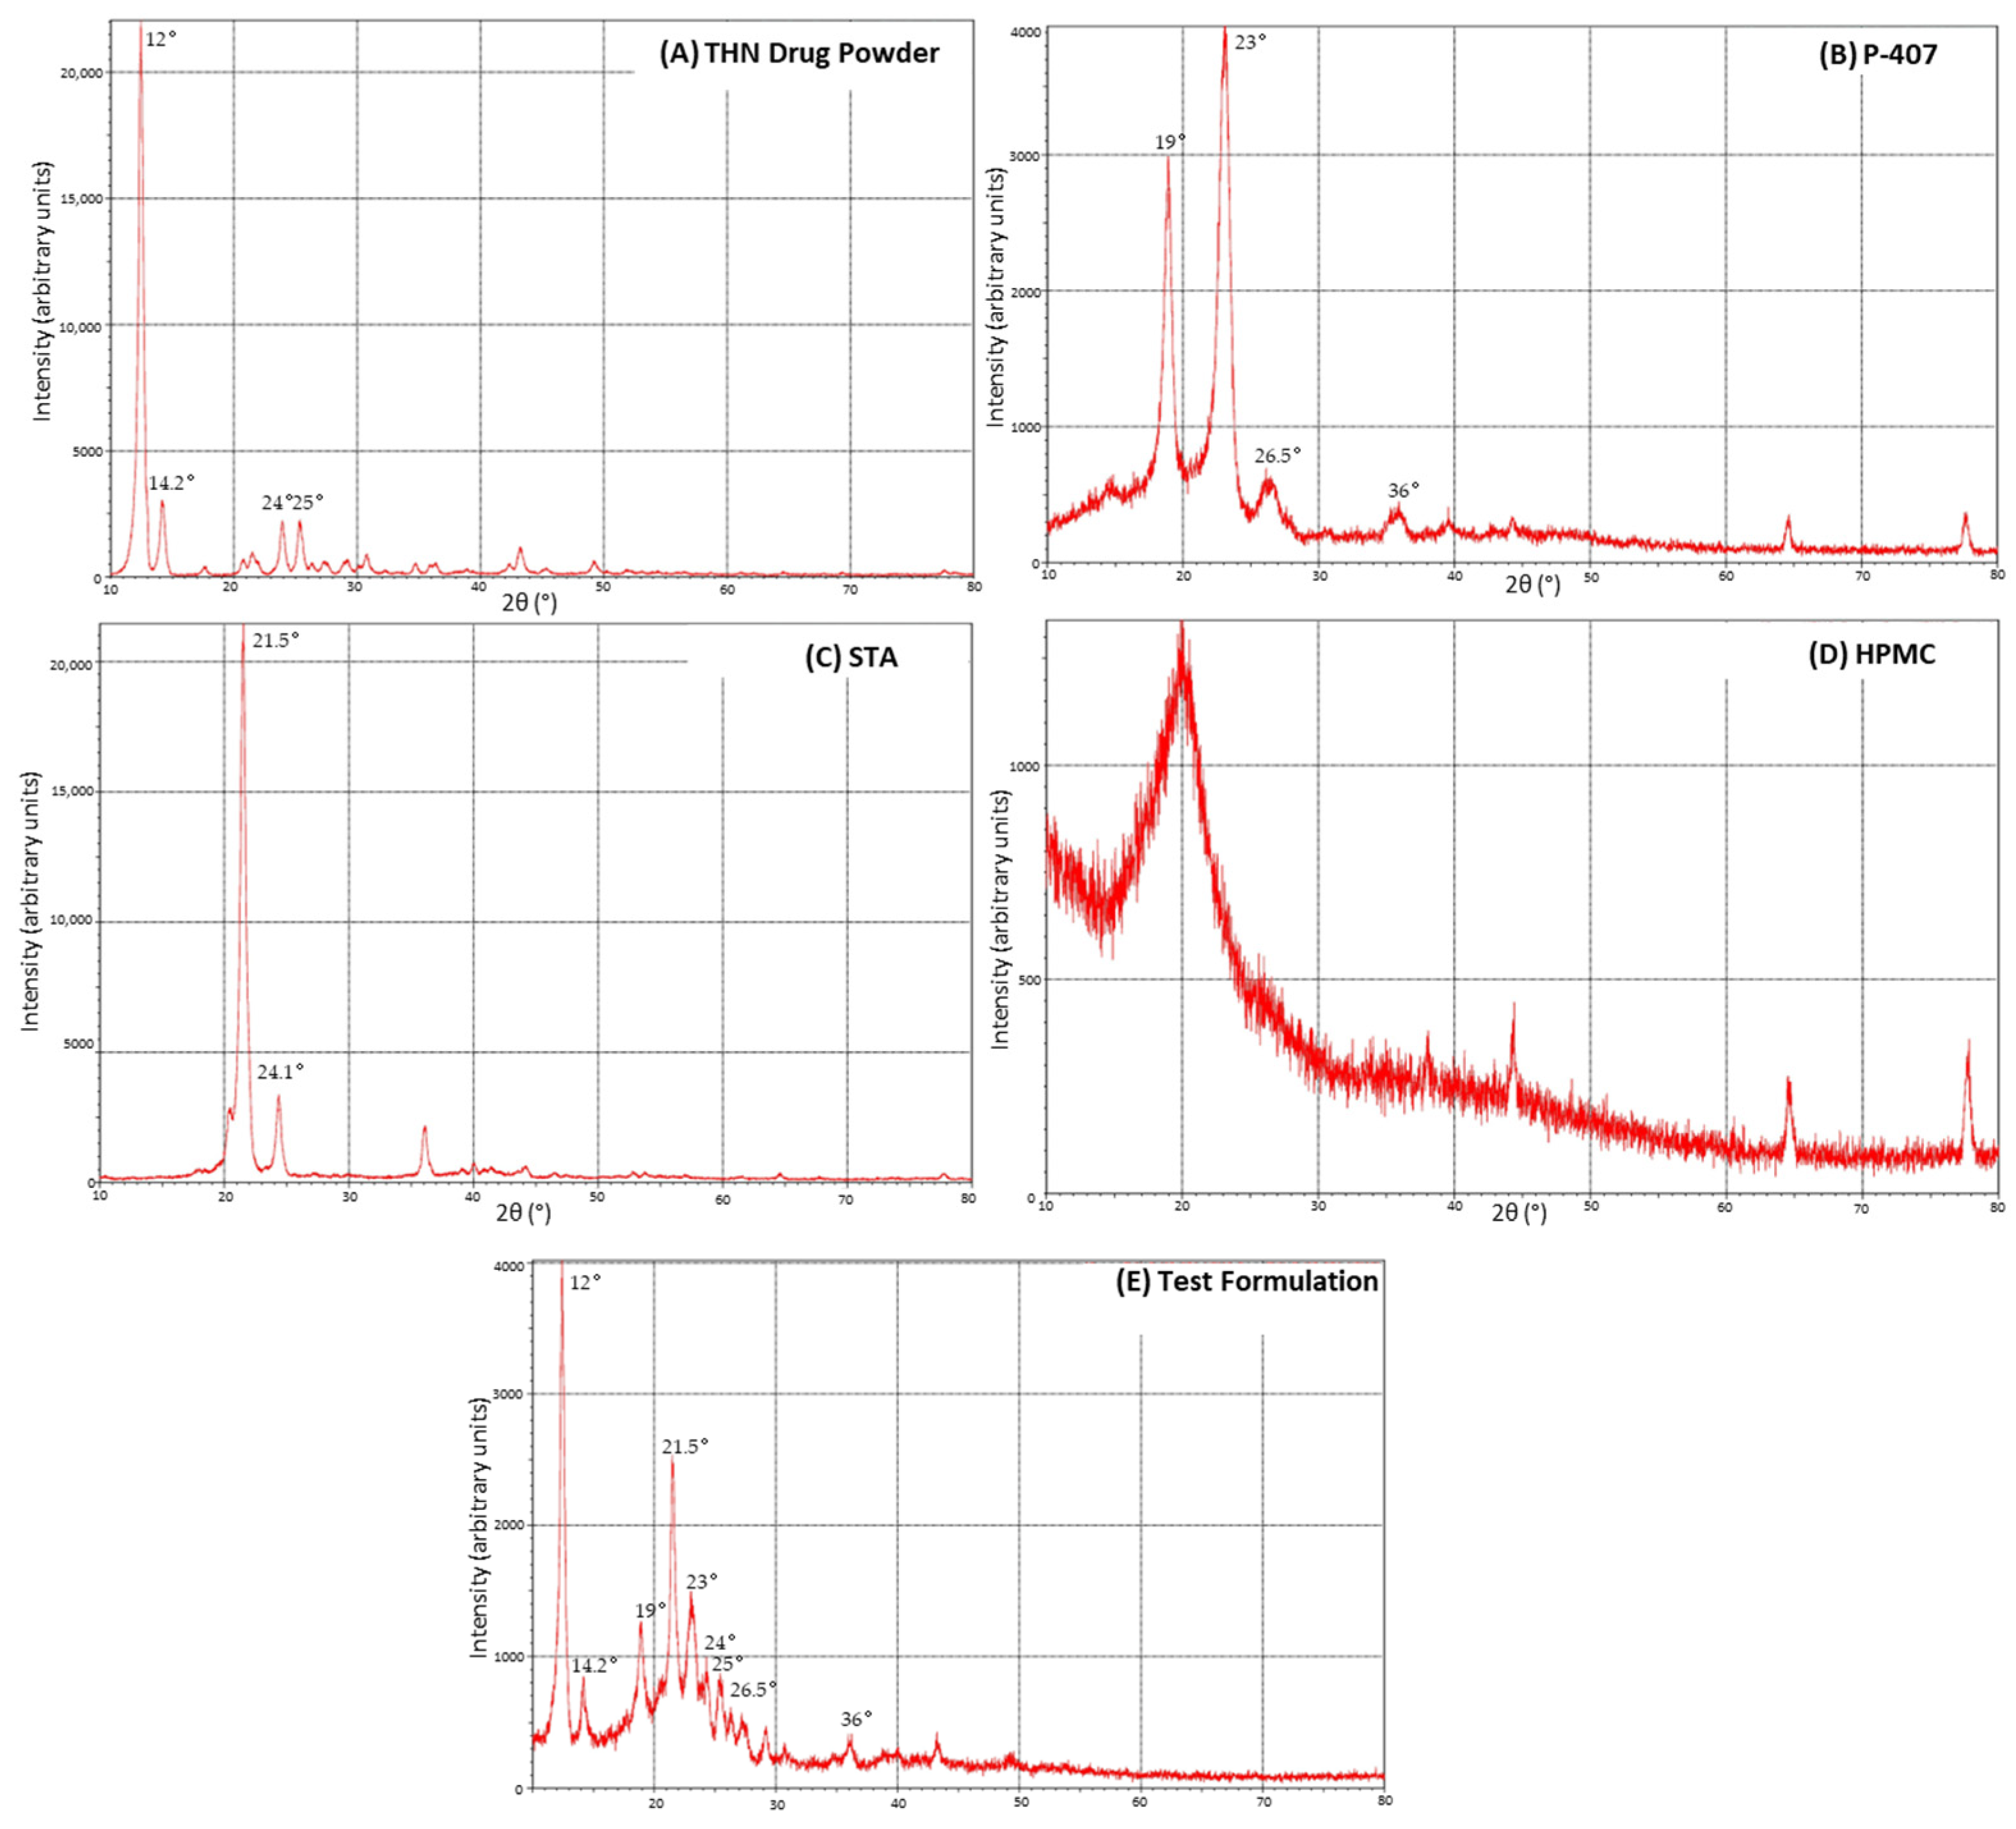
3.4. X-ray Diffraction
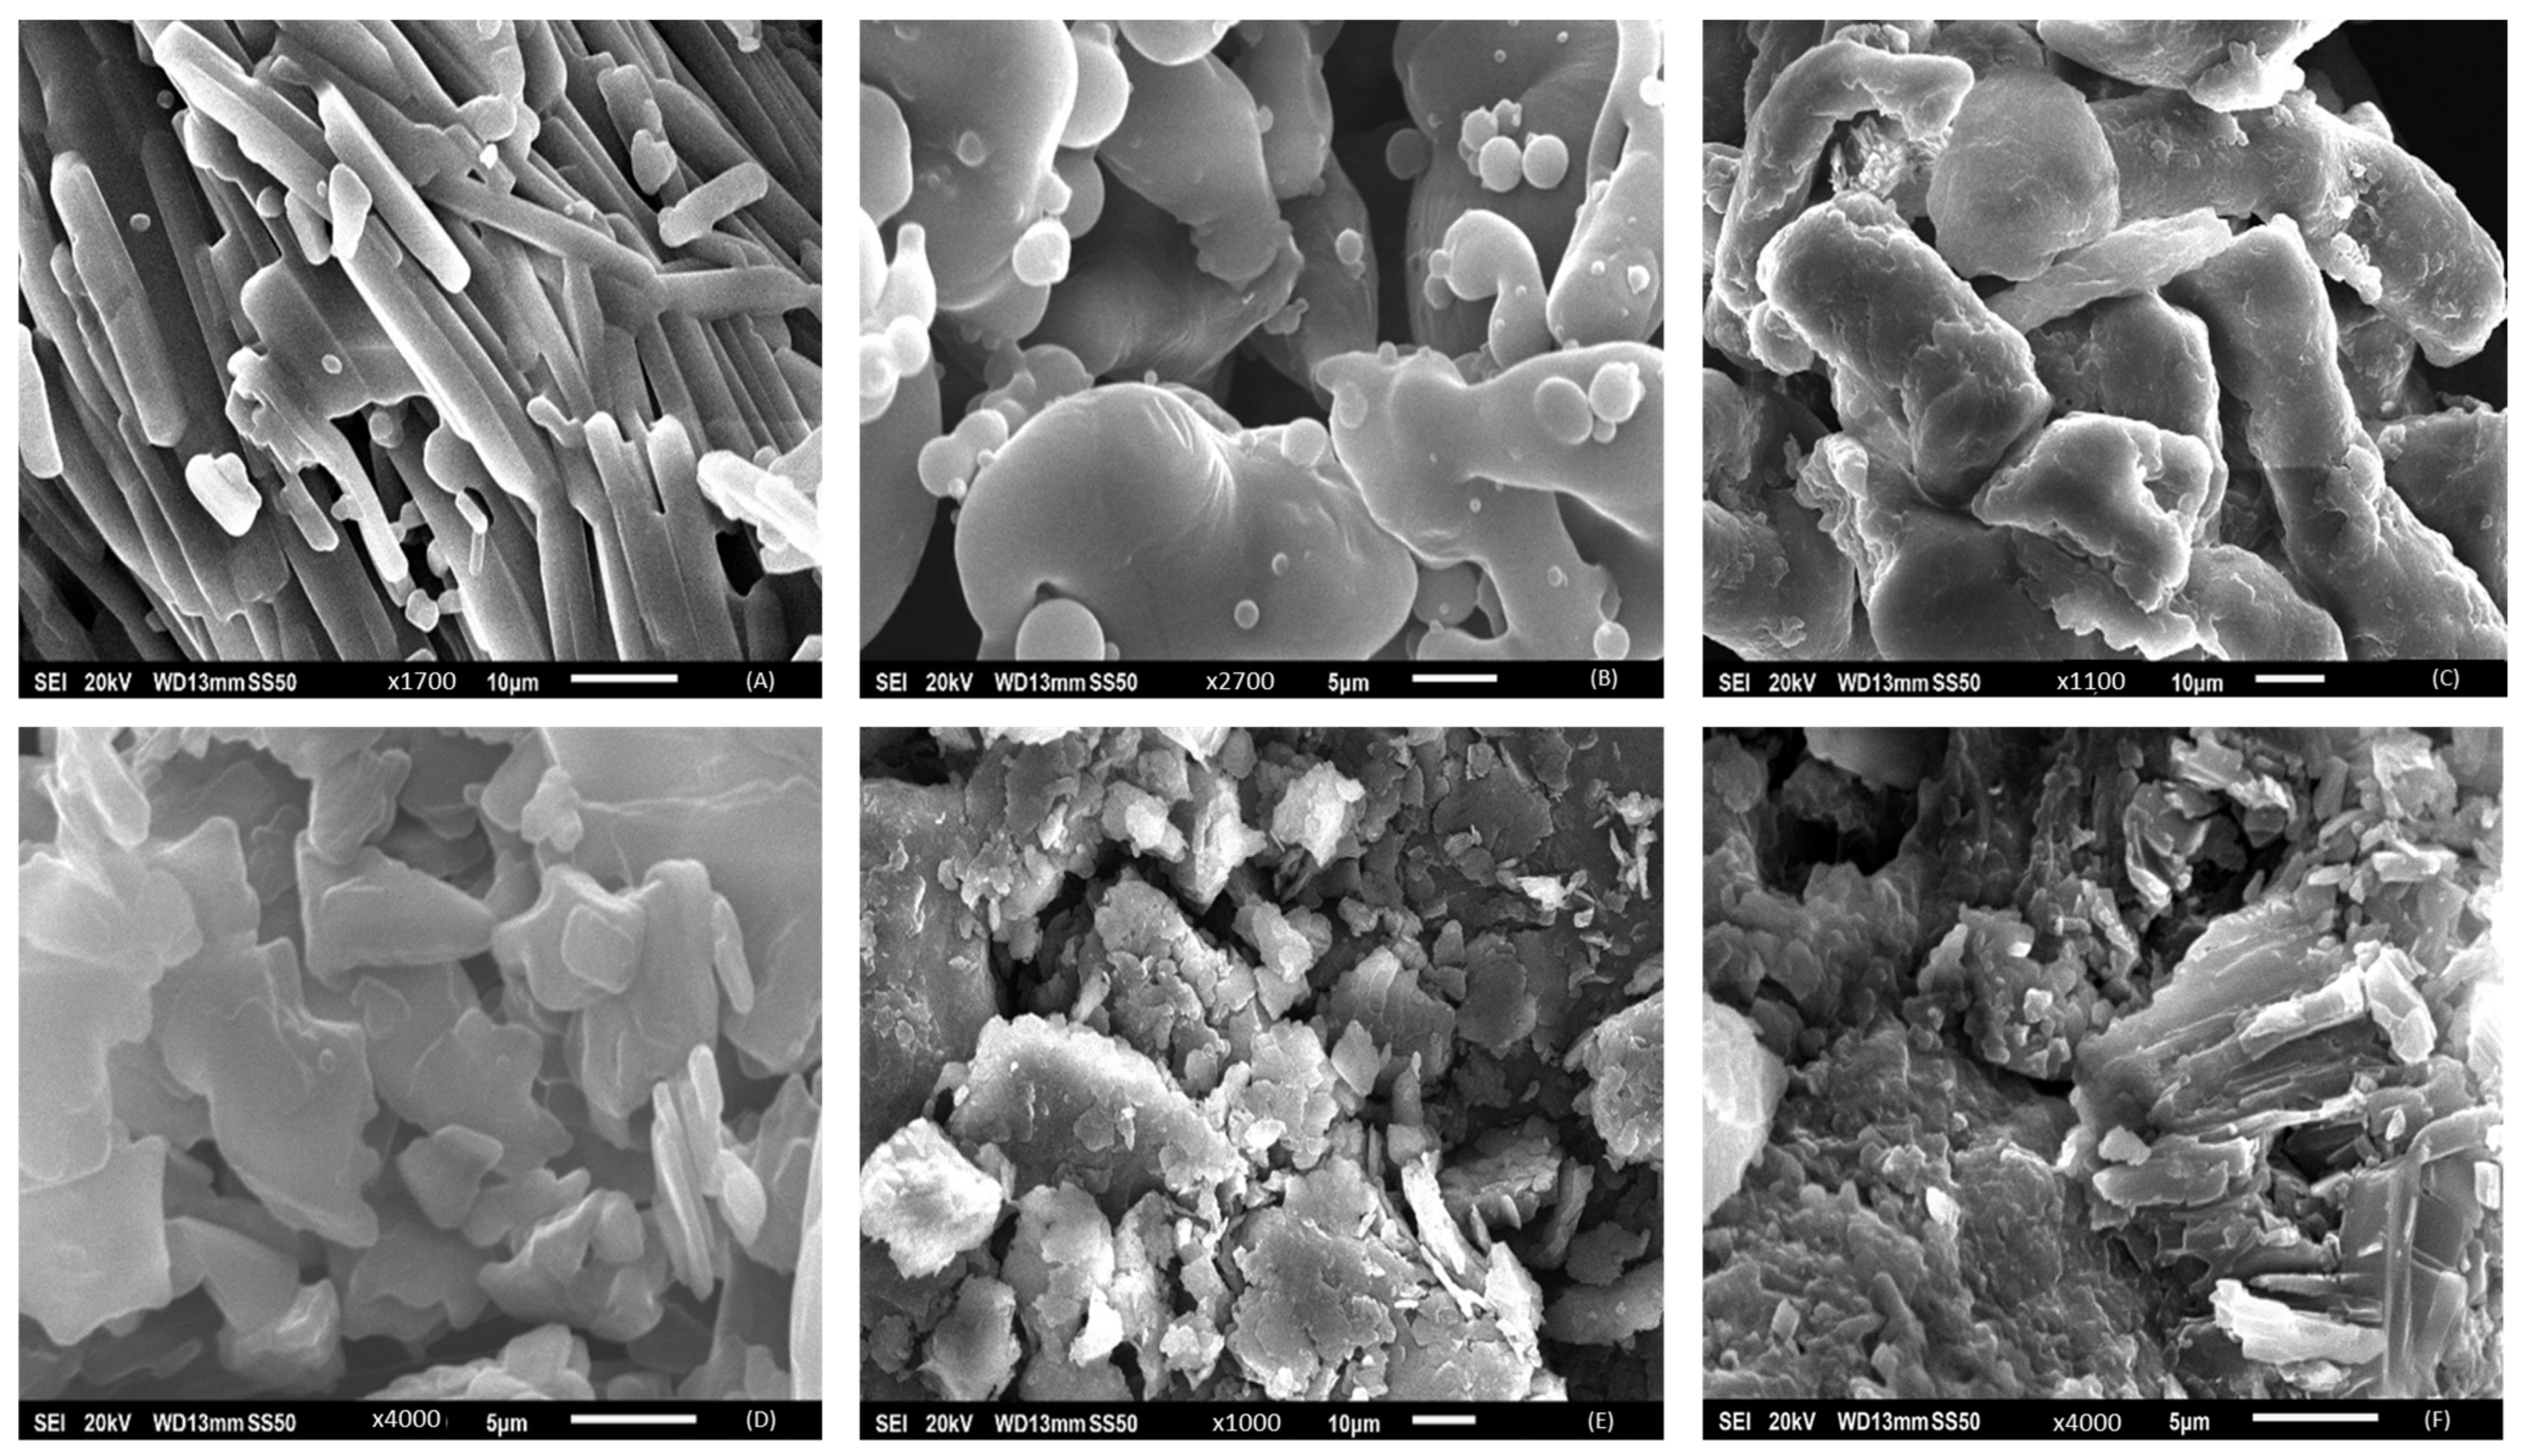
3.5. Scanning Electron Microscopy
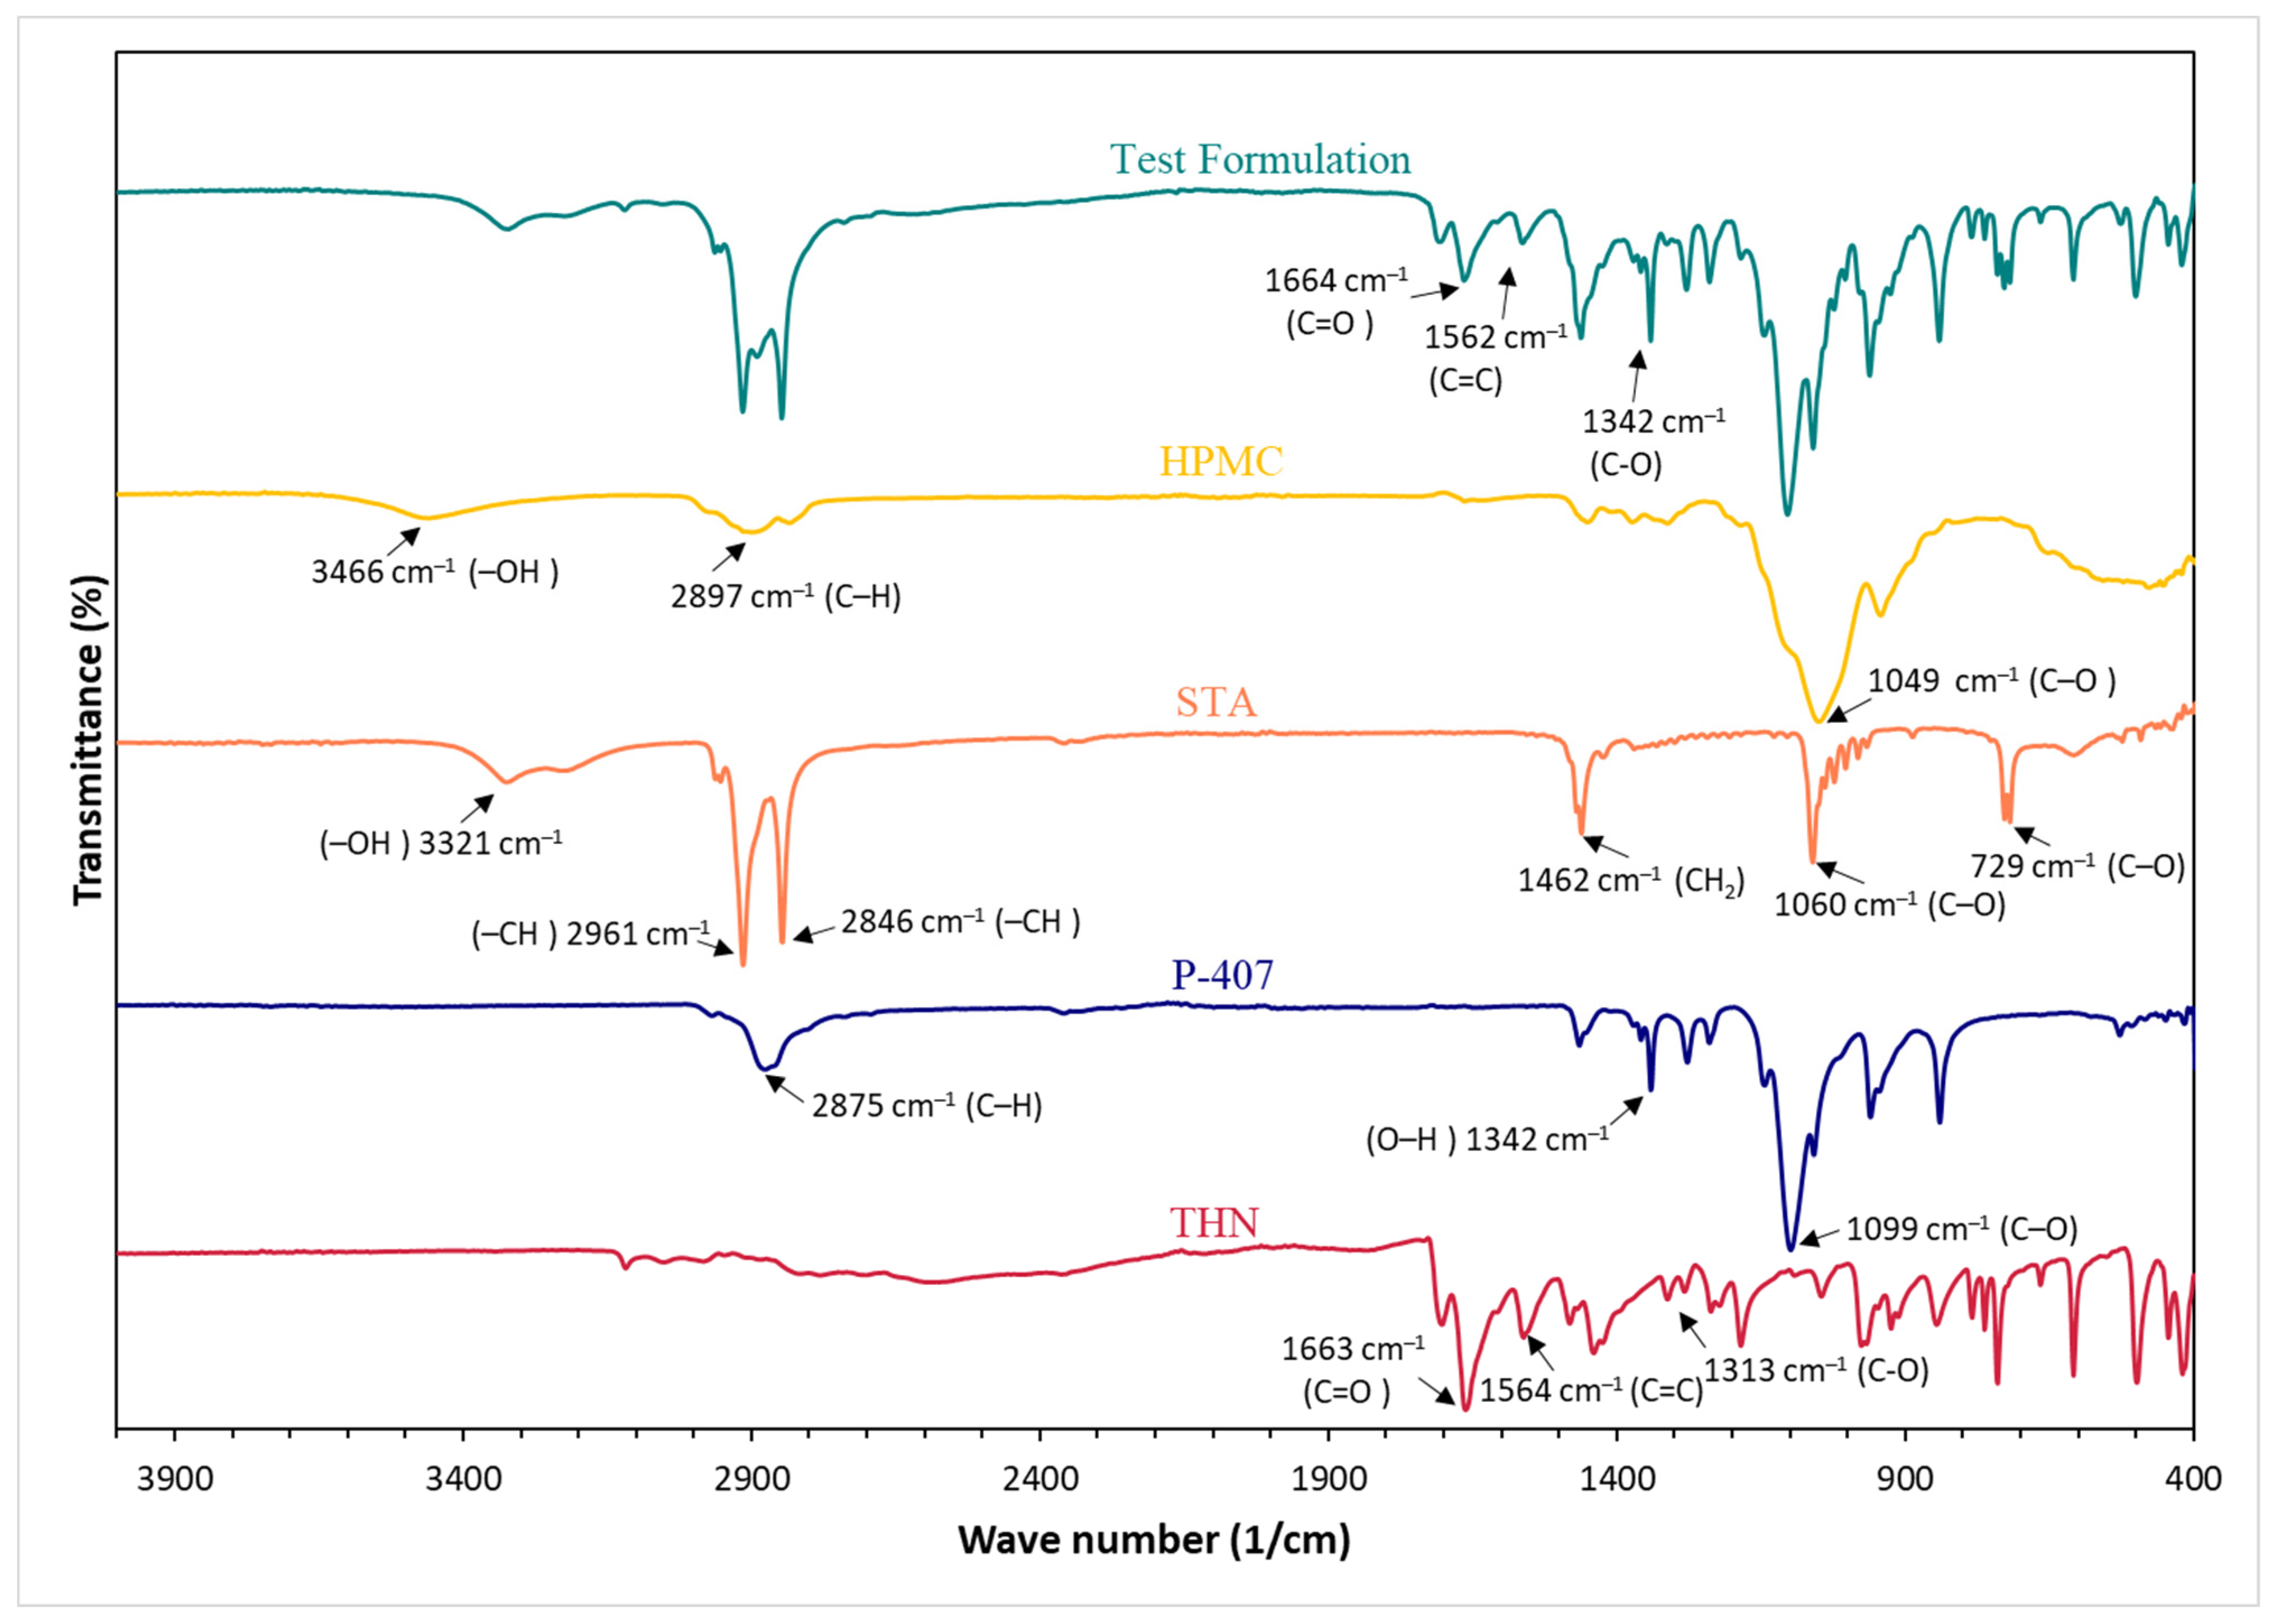
3.6. Fourier Transform Infrared
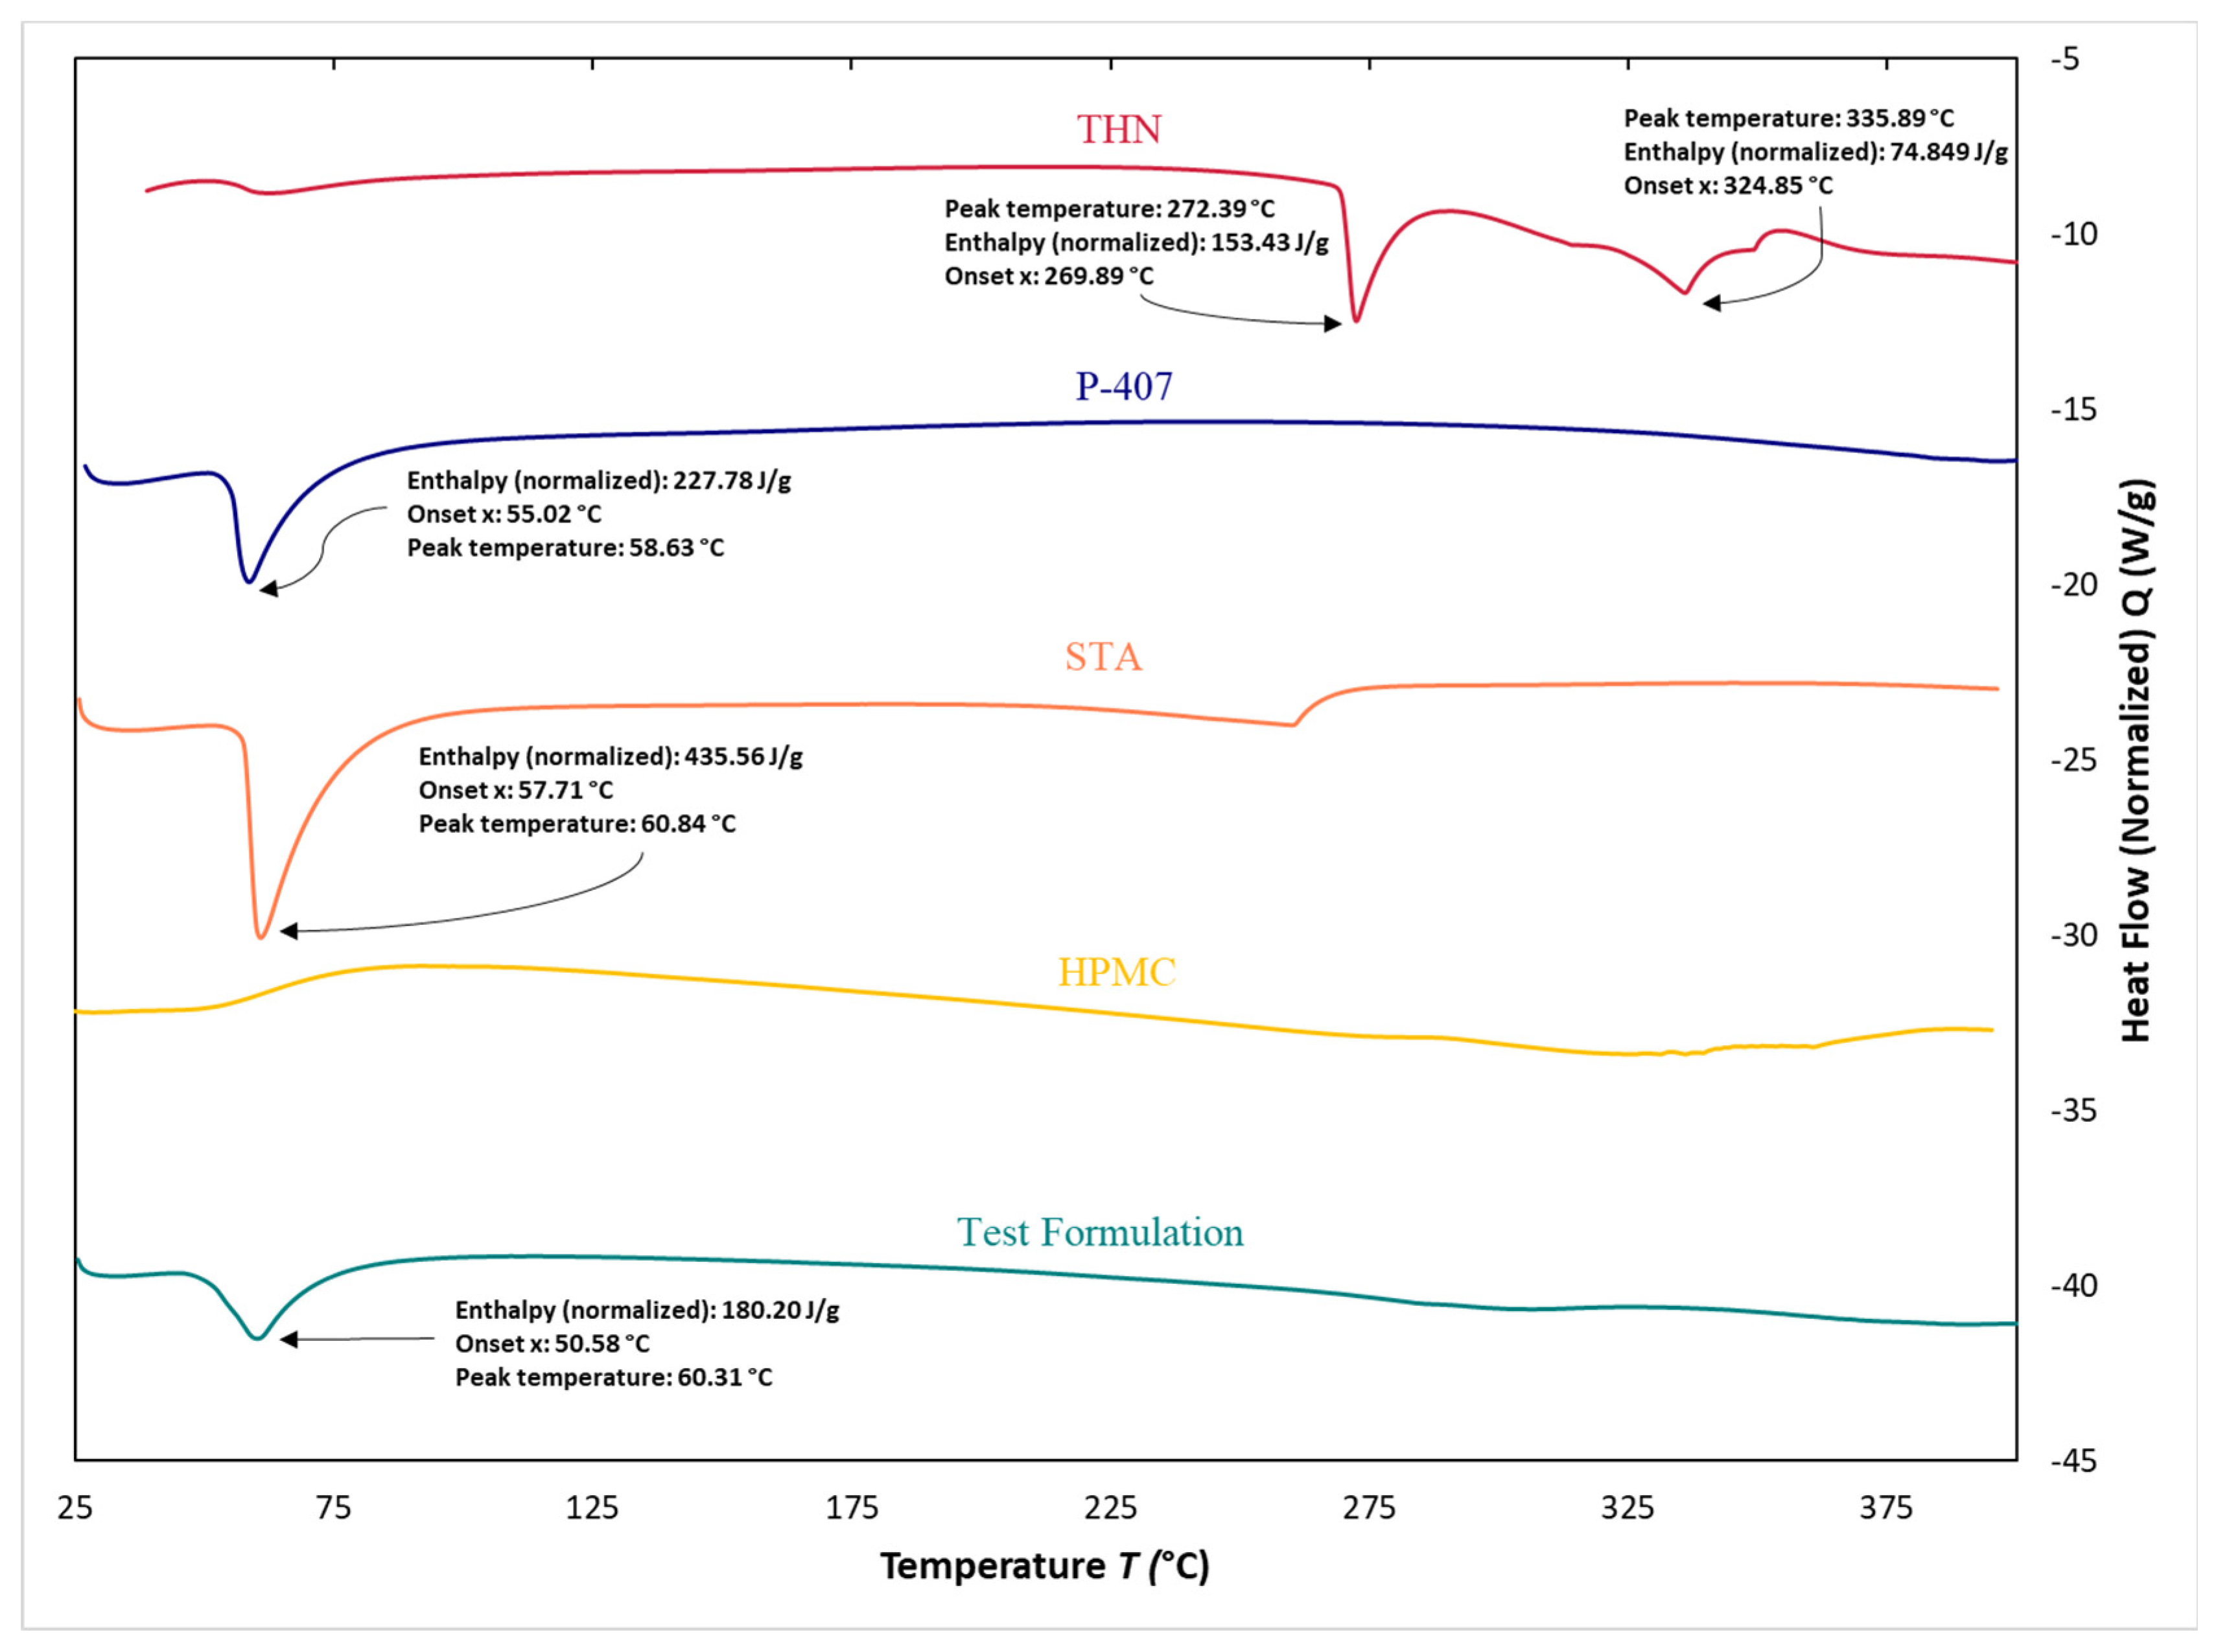
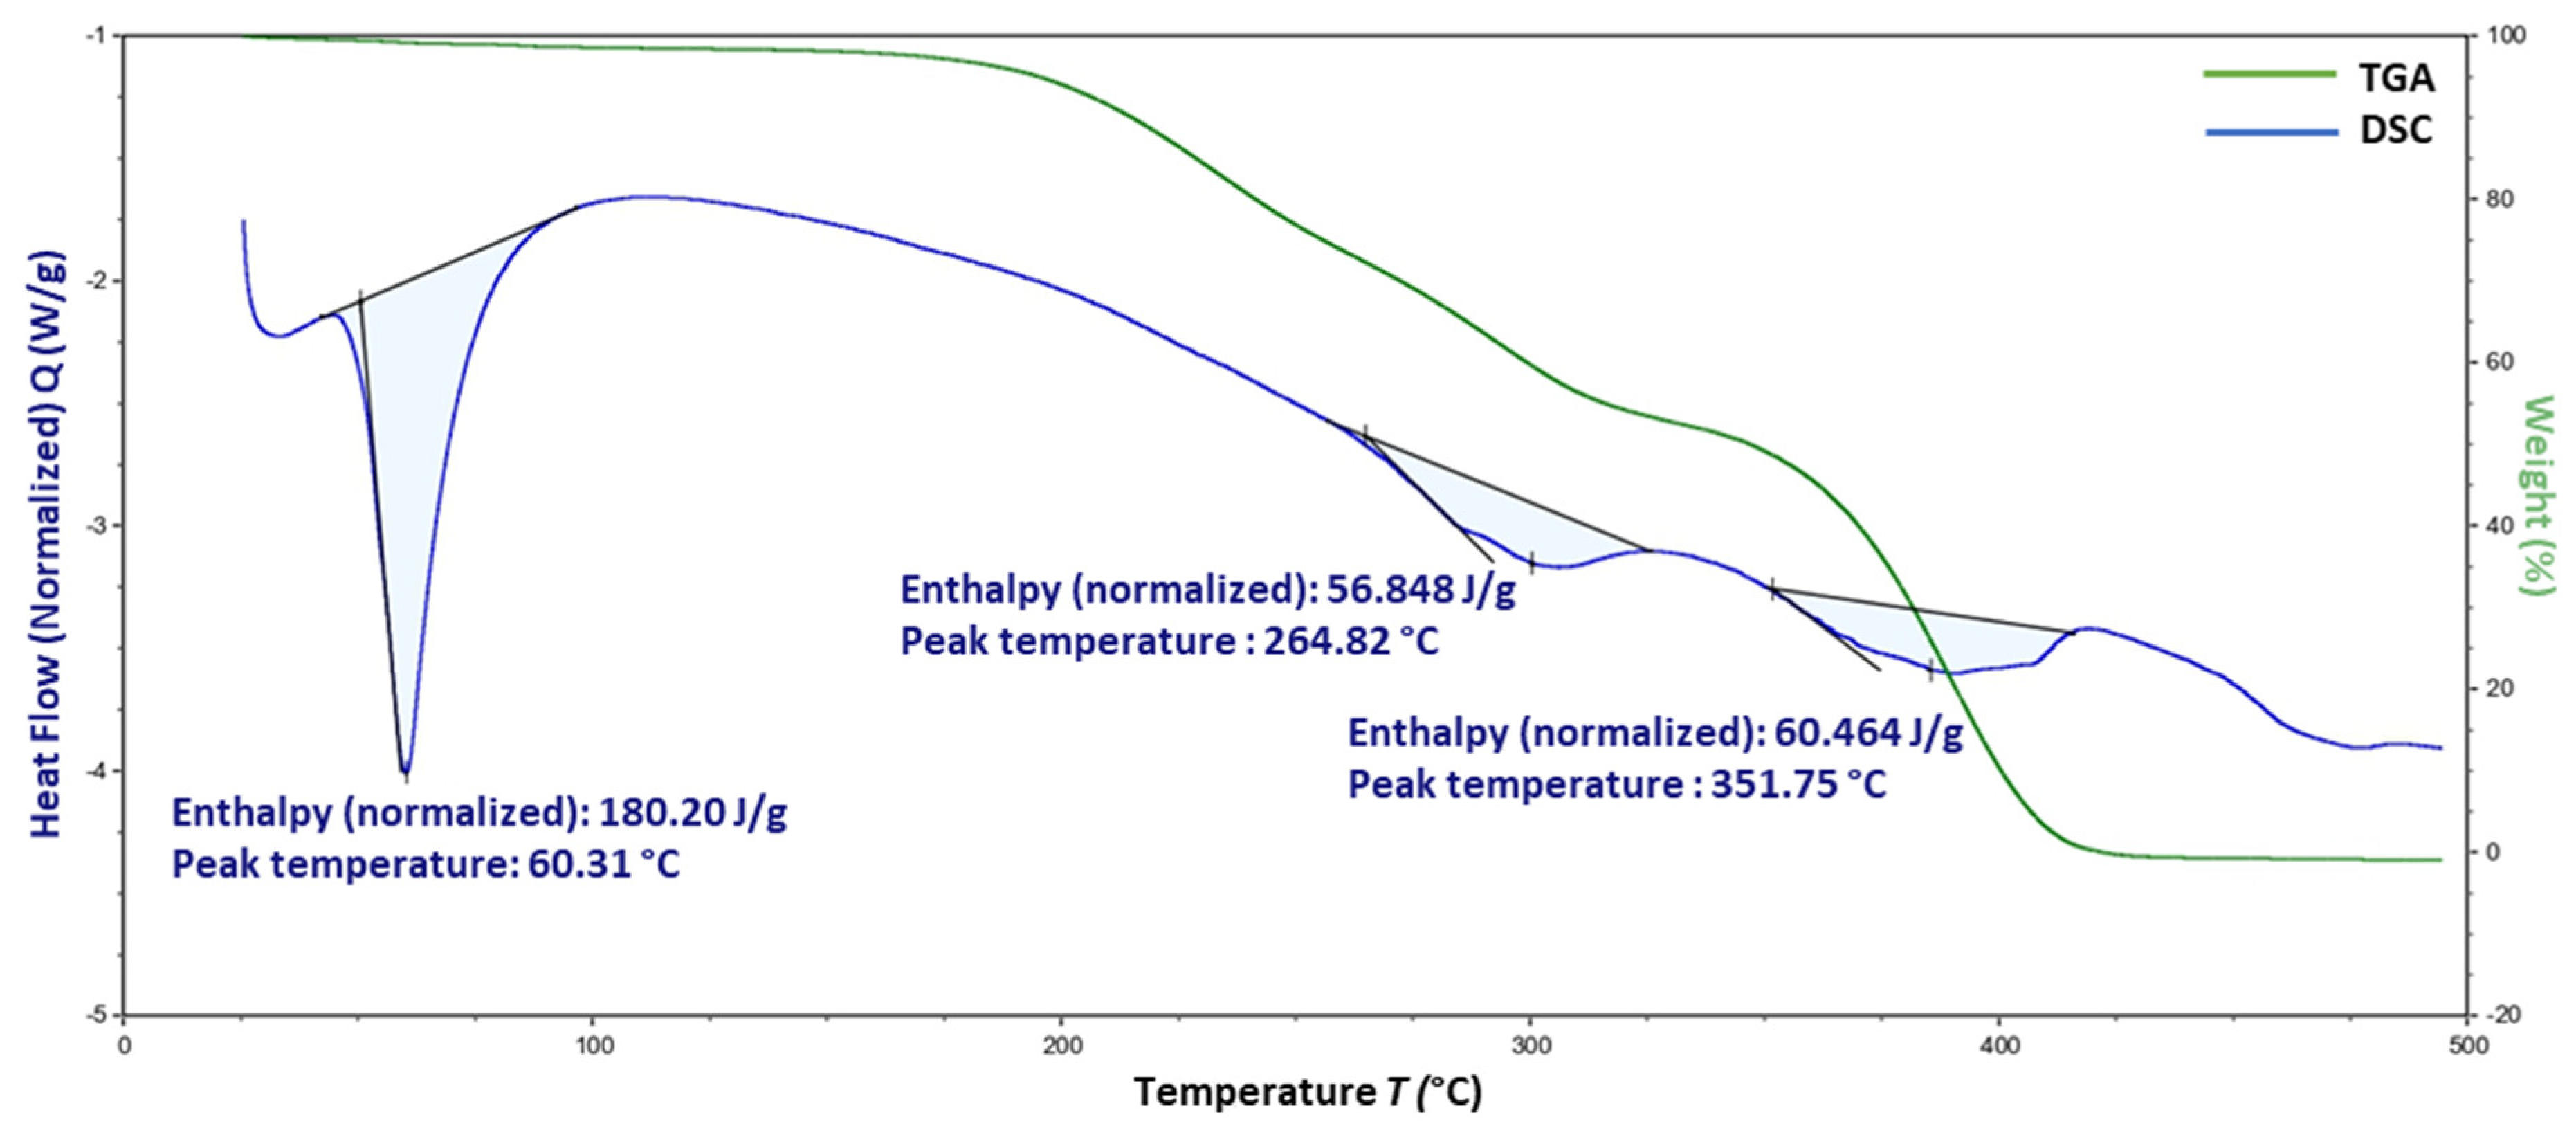
3.7. Differential Scanning Calorimetry
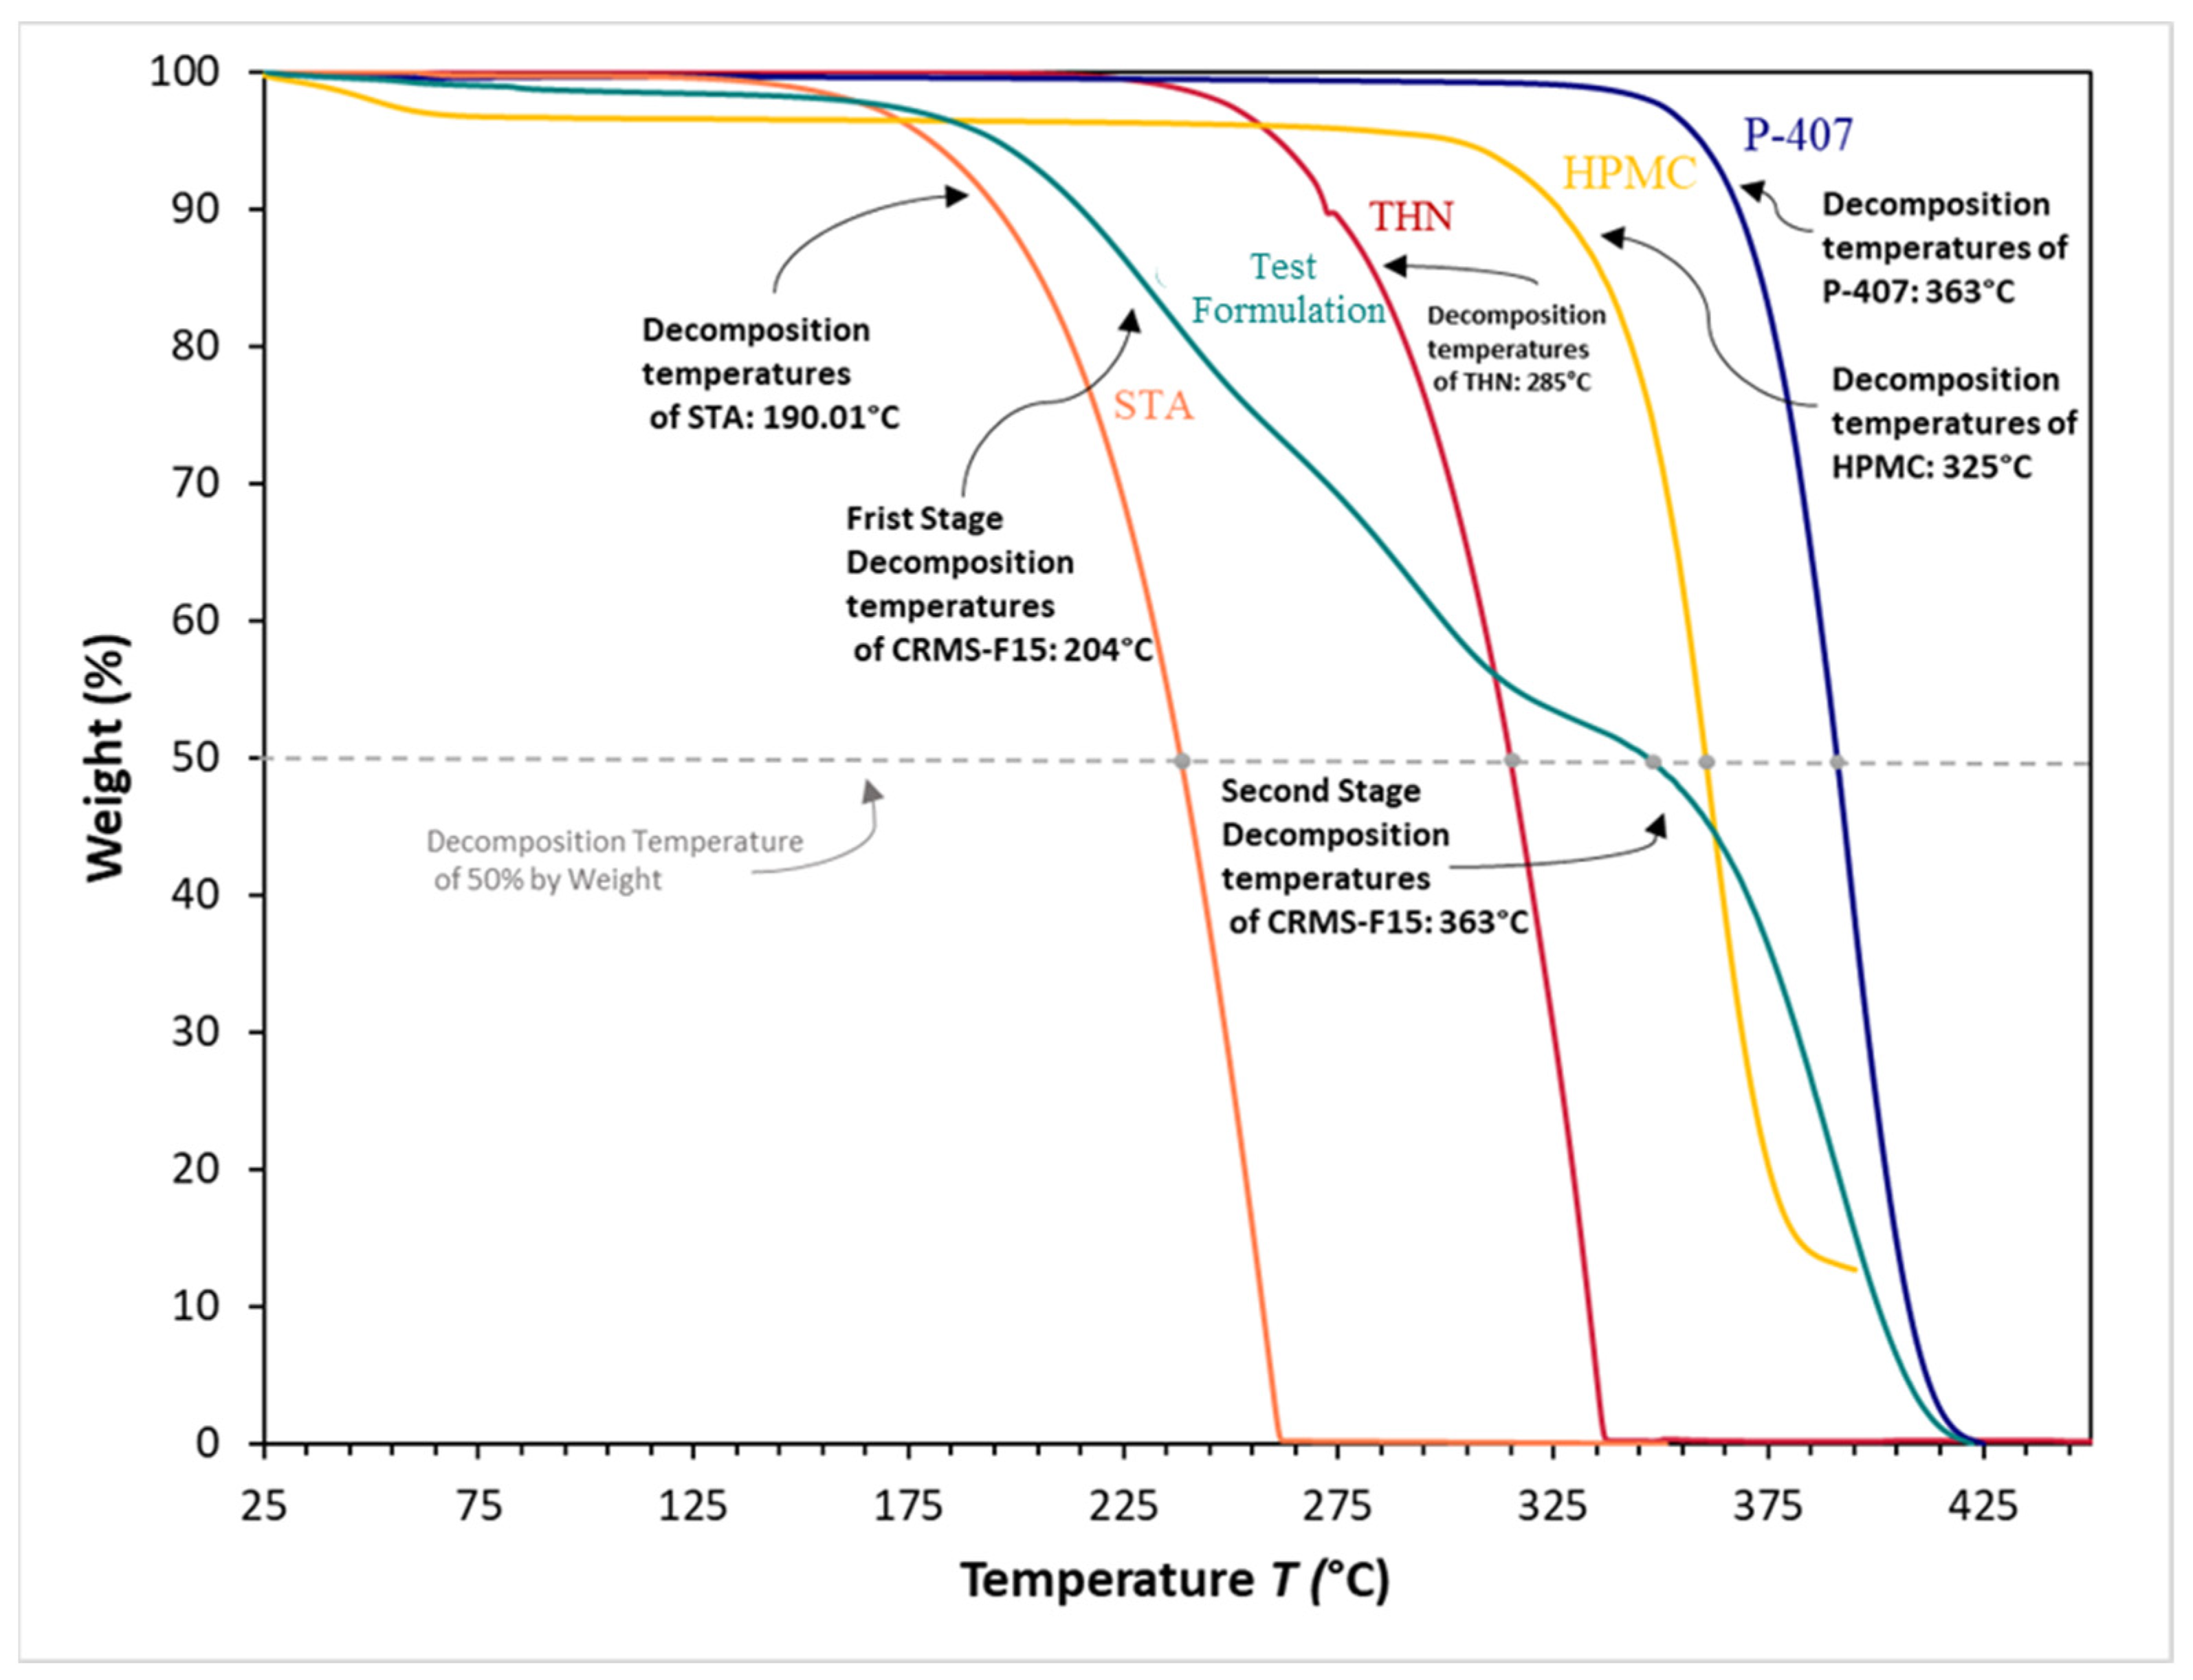
3.8. Thermogravimetric Analysis
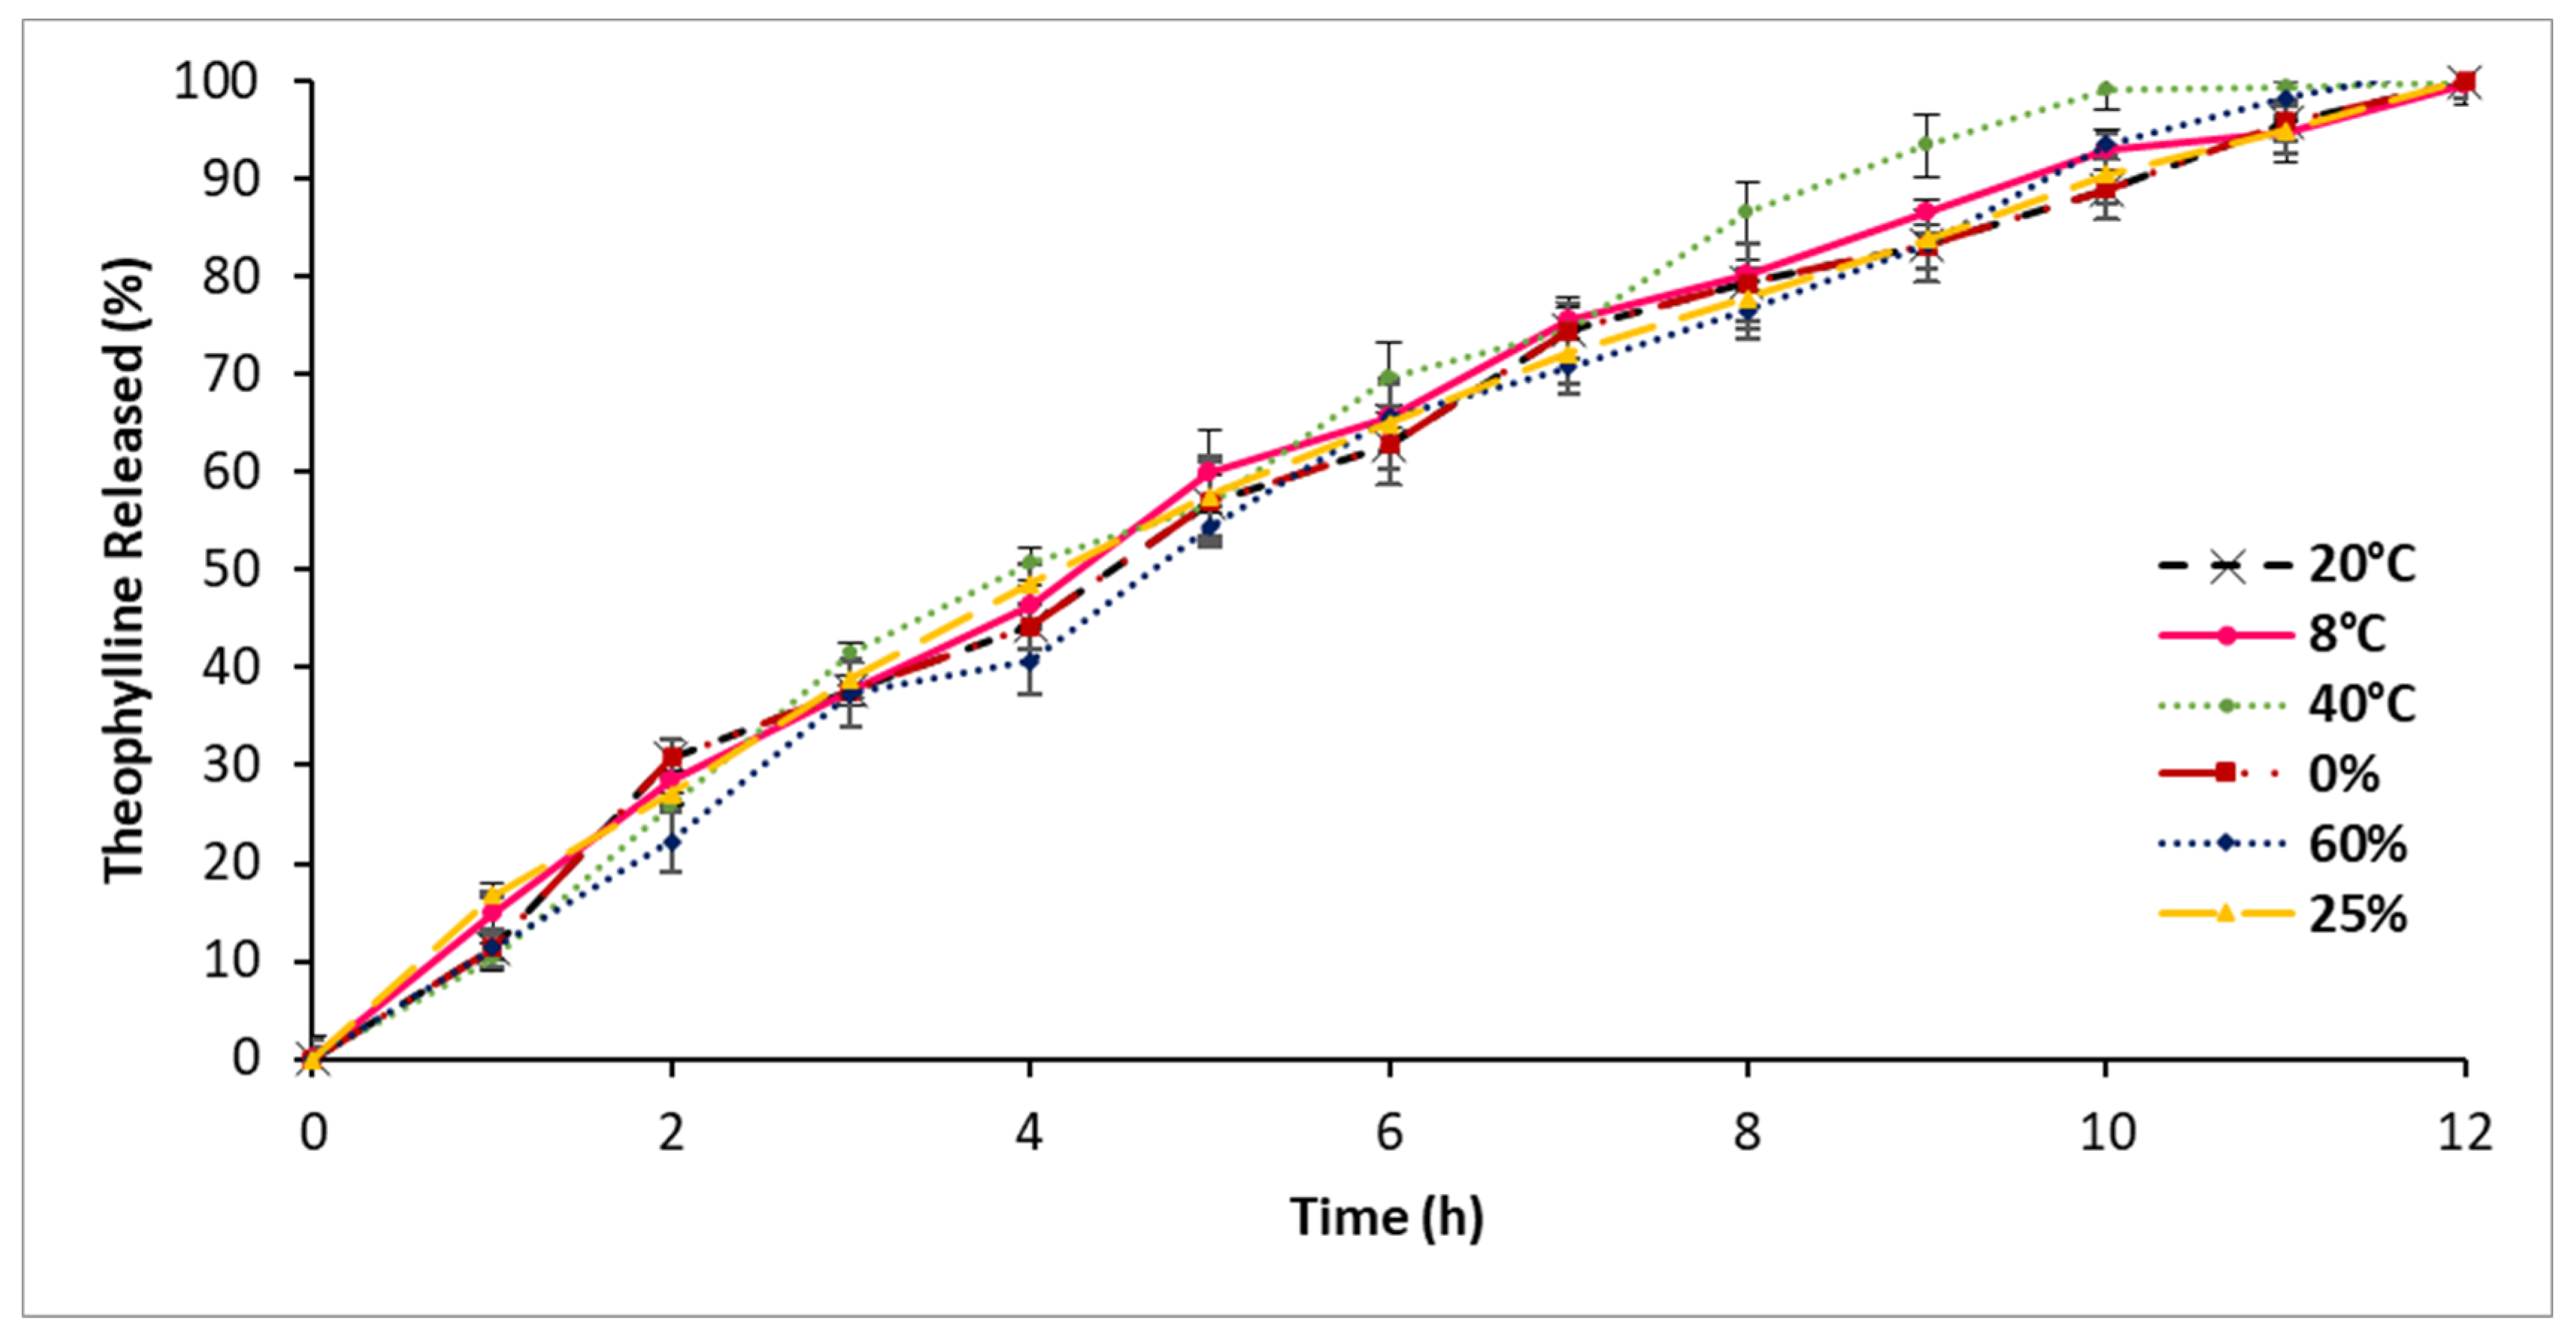
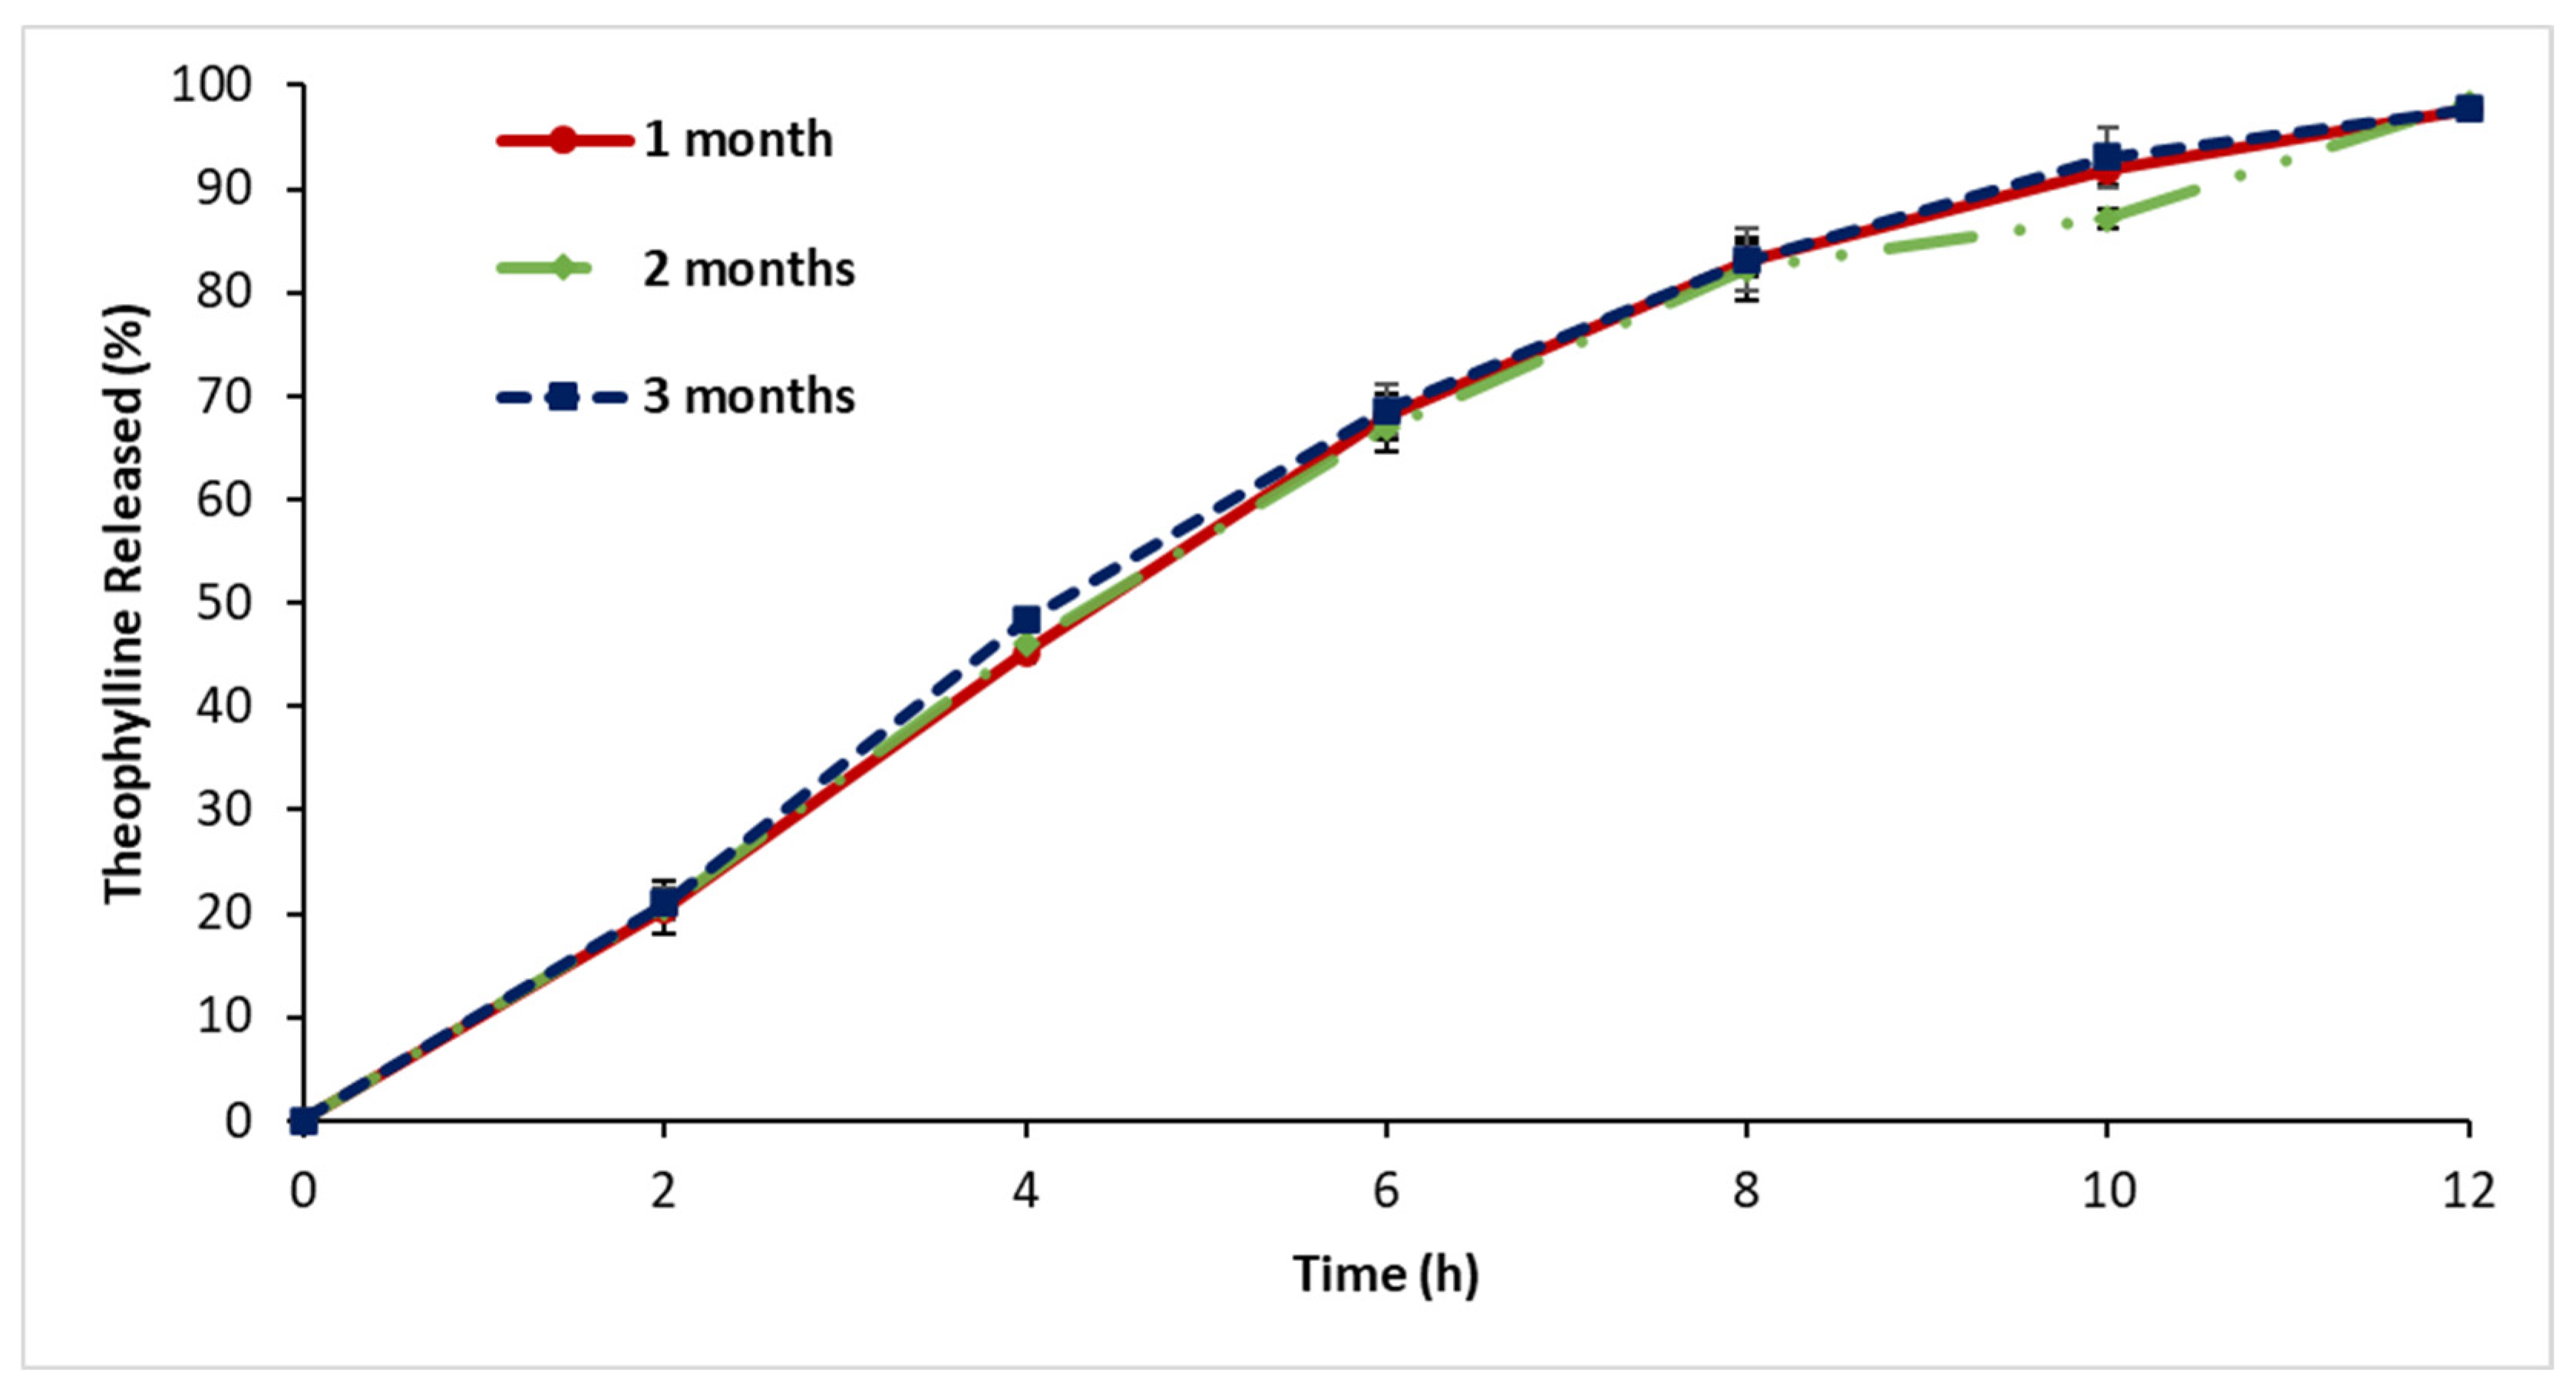
3.9. Stability Assessment
4. Discussion
4.1. In Vitro Drug Release
4.1.1. In Vitro Drug Release: First-Series Analysis
4.1.2. In Vitro Drug Release: Second-Series Analysis
4.1.3. In Vitro Drug Release: Third-Series Analysis
4.1.4. In Vitro Drug Release: Fourth-Series Analysis
4.1.5. In Vitro Drug Release in Media of Different pH Levels (pH 1.2, 4.5, 7.5)
4.2. Release Kinetic Model Evaluation
4.3. X-ray Diffraction
4.4. Scanning Electron Microscopy
4.5. Fourier Transform Infrared
4.6. Differential Scanning Calorimetry
4.7. Thermogravimetric Analysis
4.8. Stability Assessment
5. Conclusions
Author Contributions
Funding
Institutional Review Board Statement
Informed Consent Statement
Data Availability Statement
Acknowledgments
Conflicts of Interest
References
- Bai, X.; Smith, Z.; Wang, Y.; Butterworth, S.; Tirella, A. Sustained Drug Release from Smart Nanoparticles in Cancer Therapy: A Comprehensive Review. Micromachines 2022, 13, 1623. [Google Scholar] [CrossRef]
- Zhao, X.; Wei, W.; Niu, R.; Li, Q.; Hu, C.; Jiang, S. 3D Printed Intragastric Floating and Sustained-Release Tablets with Air Chambers. J. Pharm. Sci. 2022, 111, 116–123. [Google Scholar] [CrossRef] [PubMed]
- Vlachou, M.; Geraniou, E.; Siamidi, A. Modified Release of Furosemide from Eudragits® and Poly(Ethylene Oxide)-Based Matrices and Dry-Coated Tablets. Acta Pharm. 2020, 70, 49–61. [Google Scholar] [CrossRef] [PubMed]
- Ghumman, S.A.; Bashir, S.; Ahmad, J.; Hameed, H.; Khan, I.U. Colocasia Esculenta Corms Mucilage-Alginate Microspheres of Oxcarbazepine: Design, Optimization and Evaluation. Acta Pol. Pharm. 2017, 74, 505–517. [Google Scholar] [PubMed]
- Klein, S.; Seeger, N.; Mehta, R.; Missaghi, S.; Grybos, R.; Rajabi-Siahboomi, A. Robustness of Barrier Membrane Coated Metoprolol Tartrate Matrix Tablets: Drug Release Evaluation under Physiologically Relevant in Vitro Conditions. Int. J. Pharm. 2018, 543, 368–375. [Google Scholar] [CrossRef] [PubMed]
- Barnes, P.J. Theophylline. Am. J. Respir. Crit. Care Med. 2013, 188, 901–906. [Google Scholar] [CrossRef] [PubMed]
- Anirudhan, T.S.; Parvathy, J. Novel Semi-IPN Based on Crosslinked Carboxymethyl Starch and Clay for the in Vitro Release of Theophylline. Int. J. Biol. Macromol. 2014, 67, 238–245. [Google Scholar] [CrossRef] [PubMed]
- Hamstra, S.I.; Roy, B.D.; Tiidus, P.; MacNeil, A.J.; Klentrou, P.; MacPherson, R.E.K.; Fajardo, V.A. Beyond Its Psychiatric Use: The Benefits of Low-Dose Lithium Supplementation. Curr. Neuropharmacol. 2023, 21, 891–910. [Google Scholar] [CrossRef]
- Imam, S.H.; Landry, K.; Kaul, V.; Gambhir, H.; John, D.; Kloss, B. Free Phenytoin Toxicity. Am. J. Emerg. Med. 2014, 32, 1301.e3–1301.e4. [Google Scholar] [CrossRef]
- Nasr, N.E.H.; Metwaly, M.G.; Ahmed, E.O.; Fares, A.R.; ElMeshad, A.N. Investigating the Root Cause of N-Nitrosodimethylamine Formation in Metformin Pharmaceutical Products. Expert Opin. Drug Saf. 2021, 20, 855–862. [Google Scholar] [CrossRef]
- Sichilima, T.; Rieder, M.J. Adderall and Cardiovascular Risk: A Therapeutic Dilemma. Paediatr. Child Health 2009, 14, 193–195. [Google Scholar] [CrossRef] [PubMed][Green Version]
- Oliveira, C.L.C.G.; Machado, V.F.; de Freitas Tavares, H.; Ribeiro, G.L.M.; Arrais, P.S.D. Recall of Substandard Medicines in Brazil during the Period 2010–2018. BMC Health Serv. Res. 2023, 23, 238. [Google Scholar] [CrossRef] [PubMed]
- Vaidya, V.; Patel, P. Health Expenditure Comparison of Extended-Release Metoprolol Succinate and Immediate-Release Metoprolol Tartarate. Clin. Outcomes Res. 2012, 4, 49–56. [Google Scholar] [CrossRef] [PubMed][Green Version]
- Adepu, S.; Ramakrishna, S. Controlled Drug Delivery Systems: Current Status and Future Directions. Molecules 2021, 26, 5905. [Google Scholar] [CrossRef]
- Arafat, M.; Fahelelbom, K.; Sarfraz, M.; Bostanudin, M.; Sharif, Q.-A.; Esmaeil, A.; AL Hanbali, O.; Aburuz, S. Comparison between Branded and Generic Furosemide 40 Mg Tablets Using Thermal Gravimetric Analysis and Fourier Transform Infrared Spectroscopy. J. Pharm. Bioallied Sci. 2020, 12, 489. [Google Scholar] [CrossRef] [PubMed]
- Arafat, M.; Ahmed, Z.; Arafat, O. Comparison Between Generic Drugs and Brand Name Drugs From Bioequivalence and Thermoequivalence Prospective. Int. J. Pharm. Pharm. Sci. 2017, 9, 1–4. [Google Scholar] [CrossRef]
- Wolny, D.; Gruchlik, A.; Chodurek, E.W.A.; Szara, M. Comparison of Dissolution Profiles of Theophylline Extended-Release Dosage Forms. Acta Pol. Pharm.—Drug Res. 2012, 69, 1384–1386. [Google Scholar]
- Ojoe, E.; Miyauchi, E.M.; Viviani, T.C.; Consiglieri, V.O. Formulation and In Vitro Evaluation of Theophylline-Eudragit® Sustained-Release Tablets. Rev. Bras. Ciências Farm. 2005, 41, 377–384. [Google Scholar] [CrossRef][Green Version]
- Viskin, S.; Havakuk, O.; Antzelevitch, C.; Rosso, R.; Aviv, T. Theophylline: The Forgotten Antiarrhythmic Drug… Now for Malignant Early Repolarization. Pacing Clin. Electrophysiol. 2017, 41, 441–443. [Google Scholar] [CrossRef]
- Montaño, L.; Sommer, B.; Gomez-Verjan, J.; Morales-Paoli, G.; Ramírez-Salinas, G.; Solís-Chagoyán, H.; Sanchez-Florentino, Z.; Calixto, E.; Pérez-Figueroa, G.; Carter, R.; et al. Theophylline: Old Drug in a New Light, Application in COVID-19 through Computational Studies. Int. J. Mol. Sci. 2022, 23, 4167. [Google Scholar] [CrossRef]
- Karamchand, S.; Williams, M.; Naidoo, P.; Decloedt, E.; Allwood, B. Post-Tuberculous Lung Disease: Should We Be Using Theophylline? J. Thorac. Dis. 2021, 13, 1230–1238. [Google Scholar] [CrossRef] [PubMed]
- Kooij, C.; Szili-Torok, T.; Roest, S.; Constantinescu, A.A.; Brugts, J.J.; Manintveld, O.; Caliskan, K. Theophylline Use to Prevent Permanent Pacing in the Contemporary Era of Heart Transplantation: The Rotterdam Experience. Front. Cardiovasc. Med. 2022, 9, 896141. [Google Scholar] [CrossRef] [PubMed]
- Samie, M.; Bashir, S.; Abbas, J.; Khan, S.; Aman, N.; Jan, H.; Muhammad, N. Design, Formulation and In-Vitro Evaluation of Sustained Release Tablet Formulations of Levosulpiride. Turk. J. Pharm. Sci. 2018, 15, 309. [Google Scholar] [CrossRef] [PubMed]
- Alviset, G.; Corvis, Y.; Hammad, K.; Lemut, J.; Maury, M.; Mignet, N.; Boudy, V. New Preservative-Free Formulation for the Enhanced Ocular Bioavailability of Prostaglandin Analogues in Glaucoma. Pharmaceutics 2022, 14, 453. [Google Scholar] [CrossRef]
- Darji, M.A.; Lalge, R.M.; Marathe, S.P.; Mulay, T.D.; Fatima, T.; Alshammari, A.; Lee, H.K.; Repka, M.A.; Narasimha Murthy, S. Excipient Stability in Oral Solid Dosage Forms: A Review. AAPS PharmSciTech 2018, 19, 12–26. [Google Scholar] [CrossRef] [PubMed]
- Bostanudin, M.F.; Arafat, M.; Tan, S.F.; Sarker, M.Z.I. Investigations of Pectin Nanostructures for Enhanced Percutaneous Delivery of Fusidic Acid. J. Appl. Polym. Sci. 2022, 139, e52760. [Google Scholar] [CrossRef]
- Bostanudin, M.F.; Arafat, M.; Sarfraz, M.; Górecki, D.C.; Barbu, E. Butylglyceryl Pectin Nanoparticles: Synthesis, Formulation and Characterization. Polymers 2019, 11, 789. [Google Scholar] [CrossRef]
- Hirun, N.; Kraisit, P.; Tantishaiyakul, V. Thermosensitive Polymer Blend Composed of Poloxamer 407, Poloxamer 188 and Polycarbophil for the Use as Mucoadhesive In Situ Gel. Polymers 2022, 14, 1836. [Google Scholar] [CrossRef]
- Khan, N.A.; Khan, A.; Ullah, R.; Ullah, M.; Alotaibi, A.; Ullah, R.; Haider, A. Preparation and Characterization of Hydrophilic Polymer Based Sustained-Release Matrix Tablets of a High Dose Hydrophobic Drug. Polymers 2022, 14, 1985. [Google Scholar] [CrossRef]
- Fiume, M.M.; Bergfeld, W.F.; Belsito, D.V.; Hill, R.A.; Klaassen, C.D.; Liebler, D.; Marks, J.G.; Shank, R.C.; Slaga, T.J.; Snyder, P.W.; et al. Safety Assessment of Stearyl Heptanoate and Related Stearyl Alkanoates as Used in Cosmetics. Int. J. Toxicol. 2012, 31, 141S–146S. [Google Scholar] [CrossRef]
- Al-Hanbali, O.A.; Hamed, R.; Arafat, M.; Bakkour, Y.; Al-Matubsi, H.; Mansour, R.; Al-Bataineh, Y.; Aldhoun, M.; Sarfraz, M.; Dardas, A.K.Y. Formulation and Evaluation of Diclofenac Controlled Release Matrix Tablets Made of HPMC and Poloxamer 188 Polymer: An Assessment on Mechanism of Drug Release. Pak. J. Pharm. Sci. 2018, 31, 345–351. [Google Scholar] [PubMed]
- Wei, Y.; Li, C.; Zhu, Q.; Zhang, X.; Guan, J.; Mao, S. Comparison of Thermosensitive in Situ Gels and Drug-Resin Complex for Ocular Drug Delivery: In Vitro Drug Release and in Vivo Tissue Distribution. Int. J. Pharm. 2020, 578, 119184. [Google Scholar] [CrossRef] [PubMed]
- Zhang, L. Development and In-Vitro Evaluation of Sustained Release Poloxamer 407 (P407) Gel Formulations of Ceftiofur. J. Control. Release 2002, 85, 73–81. [Google Scholar] [CrossRef] [PubMed]
- Parodi, B.; Russo, E.; Caviglioli, G.; Baldassari, S.; Gaglianone, N.; Schito, A.M.; Cafaggi, S. A Chitosan Lactate/Poloxamer 407-Based Matrix Containing Eudragit RS Microparticles for Vaginal Delivery of Econazole: Design and in Vitro Evaluation. Drug Dev. Ind. Pharm. 2013, 39, 1911–1920. [Google Scholar] [CrossRef] [PubMed]
- Giuliano, E.; Paolino, D.; Fresta, M.; Cosco, D. Drug-Loaded Biocompatible Nanocarriers Embedded in Poloxamer 407 Hydrogels as Therapeutic Formulations. Medicines 2018, 6, 7. [Google Scholar] [CrossRef] [PubMed]
- Arafat, M.; Sarfraz, M.; AbuRuz, S. Development and In Vitro Evaluation of Controlled Release Viagra® Containing Poloxamer-188 Using GastroplusTM PBPK Modeling Software for In Vivo Predictions and Pharmacokinetic Assessments. Pharmaceuticals 2021, 14, 479. [Google Scholar] [CrossRef] [PubMed]
- Rahamathulla, M.; Saisivam, S.; Alshetaili, A.; Hani, U.; Gangadharappa, H.V.; Alshehri, S.; Ghoneim, M.M.; Shakeel, F. Design and Evaluation of Losartan Potassium Effervescent Floating Matrix Tablets: In Vivo X-ray Imaging and Pharmacokinetic Studies in Albino Rabbits. Polymers 2021, 13, 3476. [Google Scholar] [CrossRef]
- Shaikh, M.; Desai, N.; Momin, M.; Bhatt, L.K. Formulation Development and In-Vitro/Ex-Vivo Evaluation for a Polysaccharide-Based Colon Targeted Matrix Tablet. Curr. Drug Deliv. 2021, 18, 1563–1573. [Google Scholar] [CrossRef]
- Li, J.; Zhao, J.; Tao, L.; Wang, J.; Waknis, V.; Pan, D.; Hubert, M.; Raghavan, K.; Patel, J. The Effect of Polymeric Excipients on the Physical Properties and Performance of Amorphous Dispersions: Part I, Free Volume and Glass Transition. Pharm. Res. 2015, 32, 500–515. [Google Scholar] [CrossRef]
- Abd El-Halim, S.M.; Amin, M.M.; El-Gazayerly, O.N.; Abd El-Gawad, N.A. Comparative Study on the Different Techniques for the Preparation of Sustained-Release Hydrophobic Matrices of a Highly Water-Soluble Drug. Drug Discov. Ther. 2010, 4, 484–492. [Google Scholar]
- Arafat, M.; Sarfraz, M.; Bostanudin, M.F.; Esmaeil, A.; Salam, A.; AbuRuz, S. In Vitro and In Vivo Evaluation of Oral Controlled Release Formulation of BCS Class I Drug Using Polymer Matrix System. Pharmaceuticals 2021, 14, 929. [Google Scholar] [CrossRef] [PubMed]
- Shamsuddin; Fazil, M.; Ansari, S.; Ali, J. Development and Evaluation of Solid Dispersion of Spironolactone Using Fusion Method. Int. J. Pharm. Investig. 2016, 6, 63. [Google Scholar] [CrossRef]
- Dugar, R.P.; Gajera, B.Y.; Dave, R.H. Fusion Method for Solubility and Dissolution Rate Enhancement of Ibuprofen Using Block Copolymer Poloxamer 407. AAPS PharmSciTech 2016, 17, 1428–1440. [Google Scholar] [CrossRef]
- Gorajana, A.; Garg, S.; Koh, P.; Chuah, J.; Talekar, M. Formulation Development and Dissolution Rate Enhancement of Efavirenz by Solid Dispersion Systems. Indian J. Pharm. Sci. 2013, 75, 291. [Google Scholar] [CrossRef] [PubMed]
- Ajjarapu, S.; Banda, S.; Basim, P.; Dudhipala, N. Melt Fusion Techniques for Solubility Enhancement: A Comparison of Hot Melt Extrusion and KinetiSol® Technologies. Sci. Pharm. 2022, 90, 51. [Google Scholar] [CrossRef]
- Kassaye, L.; Genete, G. Evaluation and Comparison of In-Vitro Dissolution Profiles for Different Brands of Amoxicillin Capsules. Afr. Health Sci. 2013, 13, 369–375. [Google Scholar] [CrossRef] [PubMed]
- Moore, W.; Flanner, H.H. Mathematical Comparison of Curves with an Emphasis on in Vitro Dissolution Profiles. Pharm. Tech. 1996, 20, 64–74. [Google Scholar]
- Ofori-Kwakye, K.; Mfoafo, K.A.; Kipo, S.L.; Kuntworbe, N.; Boakye-Gyasi, M. El Development and Evaluation of Natural Gum-Based Extended Release Matrix Tablets of Two Model Drugs of Different Water Solubilities by Direct Compression. Saudi Pharm. J. 2016, 24, 82–91. [Google Scholar] [CrossRef]
- Paiva, E.M.; Li, Q.; Zaczek, A.J.; Pereira, C.F.; Rohwedder, J.J.R.; Zeitler, J.A. Understanding the Metastability of Theophylline FIII by Means of Low-Frequency Vibrational Spectroscopy. Mol. Pharm. 2021, 18, 3578–3587. [Google Scholar] [CrossRef]
- Akbar, M.H.; Harmita; Suryadi, H. Preparation and Characterization of Hydroxypropyl Methylcellulose Produced From A-Cellulose Betung Bamboo (Dendrocalamus Asper) and It’s Evaluation On Gel Formulation. Int. J. Pharm. Pharm. Sci. 2020, 12, 156–165. [Google Scholar] [CrossRef]
- Arafat, M.; Sakkal, M.; Yuvaraju, P.; Esmaeil, A.; Poulose, V.; Aburuz, S. Effect of Excipients on the Quality of Drug Formulation and Immediate Release of Generic Metformin HCl Tablets. Pharmaceuticals 2023, 16, 539. [Google Scholar] [CrossRef] [PubMed]
- Fahelelbom, K.M.S.; Saleh, A.; Mansour, R.; Sayed, S. First Derivative ATR-FTIR Spectroscopic Method as a Green Tool for the Quantitative Determination of Diclofenac Sodium Tablets. F1000Research 2020, 9, 176. [Google Scholar] [CrossRef] [PubMed]
- Tatini, D.; Tempesti, P.; Ridi, F.; Fratini, E.; Bonini, M.; Baglioni, P. Pluronic/Gelatin Composites for Controlled Release of Actives. Colloids Surf. B Biointerfaces 2015, 135, 400–407. [Google Scholar] [CrossRef] [PubMed]
- Suhail, M.; Hsieh, Y.-H.; Khan, A.; Minhas, M.U.; Wu, P.-C. Preparation and In Vitro Evaluation of Aspartic/Alginic Acid Based Semi-Interpenetrating Network Hydrogels for Controlled Release of Ibuprofen. Gels 2021, 7, 68. [Google Scholar] [CrossRef] [PubMed]
- Farrag, Y.; Barral, L.; Gualillo, O.; Moncada, D.; Montero, B.; Rico, M.; Bouza, R. Effect of Different Plasticizers on Thermal, Crystalline, and Permeability Properties of Poly(3–Hydroxybutyrate–Co−3–Hydroxyhexanoate) Films. Polymers 2022, 14, 3503. [Google Scholar] [CrossRef] [PubMed]
- Gonzalez, Y.M.; Ghaly, E.S. Modified Drug Release of Poloxamer Matrix by Including Water-Soluble and Water-Insoluble Polymer. Drug Dev. Ind. Pharm. 2010, 36, 64–71. [Google Scholar] [CrossRef]
- Ahmed, S.; Ahmed Ali, A.; Ali, A.M.; Hassan, O. Design and in Vitro/in Vivo Evaluation of Sustained-Release Floating Tablets of Itopride Hydrochloride. Drug Des. Devel. Ther. 2016, 10, 4061–4071. [Google Scholar] [CrossRef]
- Usman, S.; Ismail Shehada, M.B.; Usman, A.; Islam, Q. Pharmaceutical Quality Assessment of Glimepiride Tablets—Comparison of Brands and Newly Formulated Tablets With Innovator. Asian J. Pharm. Clin. Res. 2021, 14, 63–67. [Google Scholar] [CrossRef]
- USP–NF USP Monographs: Theophylline Extended-Release Capsules. Available online: http://ftp.uspbpep.com/v29240/usp29nf24s0_m82140.html#:~:text=»TheophyllineExtended,closedcontainers (accessed on 5 January 2024).
- Samanta, H.S.; Ray, S.K. Controlled Release of Tinidazole and Theophylline from Chitosan Based Composite Hydrogels. Carbohydr. Polym. 2014, 106, 109–120. [Google Scholar] [CrossRef]
- Pironi, A.M.; Eloy, J.D.O.; Rodero, C.F.; Antonio, S.G.; Alonso, J.D.; Chorilli, M. PVP Solid Dispersions Containing Poloxamer 407 or TPGS for the Improvement of Ursolic Acid Release. Braz. J. Pharm. Sci. 2023, 59, e21217. [Google Scholar] [CrossRef]
- Ei-Badry, M.; Hassan, M.A.; Ibrahim, M.A.; Elsaghir, H. Performance of Poloxamer 407 as Hydrophilic Carrier on the Binary Mixtures with Nimesulide. Farmacia 2013, 61, 1137–1150. Available online: http://www.scopus.com/inward/record.url?scp=84890884510&partnerID=8YFLogxK (accessed on 8 January 2024).
- Blach, C.; Gravelle, A.J.; Peyronel, F.; Weiss, J.; Barbut, S.; Marangoni, A.G. Revisiting the Crystallization Behavior of Stearyl Alcohol: Stearic Acid (SO: SA) Mixtures in Edible Oil. RSC Adv. 2016, 6, 81151–81163. [Google Scholar] [CrossRef]
- Boonsiriwit, A.; Itkor, P.; Sirieawphikul, C.; Lee, Y.S. Characterization of Natural Anthocyanin Indicator Based on Cellulose Bio-Composite Film for Monitoring the Freshness of Chicken Tenderloin. Molecules 2022, 27, 2752. [Google Scholar] [CrossRef] [PubMed]
- Thakral, S.; Terban, M.W.; Thakral, N.K.; Suryanarayanan, R. Recent Advances in the Characterization of Amorphous Pharmaceuticals by X-ray Diffractometry. Adv. Drug Deliv. Rev. 2016, 100, 183–193. [Google Scholar] [CrossRef] [PubMed]
- Ghori, M.; Šupuk, E.; Conway, B. Tribo-Electrification and Powder Adhesion Studies in the Development of Polymeric Hydrophilic Drug Matrices. Materials 2015, 8, 1482–1498. [Google Scholar] [CrossRef] [PubMed]
- Kumar Singh Yadav, H.; Shivakumar, H.G. In Vitro and In Vivo Evaluation of PH-Sensitive Hydrogels of Carboxymethyl Chitosan for Intestinal Delivery of Theophylline. ISRN Pharm. 2012, 2012, 763127. [Google Scholar] [CrossRef] [PubMed]
- Bajwa, M.; Tabassam, N.; Hameed, H.; Irfan, A.; Zaman, M.; Khan, M.A.; Shazly, G.A.; Mehboob, T.; Riaz, T.; Jardan, Y.A. Bin Thermo-Responsive Sol-Gel-Based Nano-Carriers Containing Terbinafine HCl: Formulation, In Vitro and Ex Vivo Characterization, and Antifungal Activity. Gels 2023, 9, 830. [Google Scholar] [CrossRef]
- Ayaz, H.; Chinnasamy, V.; Cho, H. Characterization and Reliability of Caprylic Acid-Stearyl Alcohol Binary Mixture as Phase Change Material for a Cold Energy Storage System. Materials 2021, 14, 7418. [Google Scholar] [CrossRef]
- Kamaly, N.; Yameen, B.; Wu, J.; Farokhzad, O.C. Degradable Controlled-Release Polymers and Polymeric Nanoparticles: Mechanisms of Controlling Drug Release. Chem. Rev. 2016, 116, 2602–2663. [Google Scholar] [CrossRef]
- Shah, M.H.; Paradkar, A. Effect of HLB of Additives on the Properties and Drug Release from the Glyceryl Monooleate Matrices. Eur. J. Pharm. Biopharm. 2007, 67, 166–174. [Google Scholar] [CrossRef]
- Singh, I.; Arora, S.; Rana, V.; Arora, G.; Malik, K. Formulation and Evaluation of Controlled Release Matrix Mucoadhesive Tablets of Domperidone Using Salvia Plebeian Gum. J. Adv. Pharm. Technol. Res. 2011, 2, 163. [Google Scholar] [CrossRef] [PubMed]
- Khandare, J.; Haag, R. Pharmaceutically Used Polymers: Principles, Structures, and Applications of Pharmaceutical Delivery Systems. In Drug Delivery; Springer: Berlin/Heidelberg, Germany, 2010; pp. 221–250. [Google Scholar] [CrossRef]
- Minhas, M.U.; Khan, K.U.; Sarfraz, M.; Badshah, S.F.; Munir, A.; Barkat, K.; Basit, A.; Arafat, M. Polyvinylpyrrolidone K-30-Based Crosslinked Fast Swelling Nanogels: An Impeccable Approach for Drug’s Solubility Improvement. Biomed Res. Int. 2022, 2022, 5883239. [Google Scholar] [CrossRef]
- Dumortier, G.; Grossiord, J.L.; Agnely, F.; Chaumeil, J.C. A Review of Poloxamer 407 Pharmaceutical and Pharmacological Characteristics. Pharm. Res. 2006, 23, 2709–2728. [Google Scholar] [CrossRef] [PubMed]
- Tundisi, L.L.; Yang, R.; Borelli, L.P.P.; Alves, T.; Mehta, M.; Chaud, M.V.; Mazzola, P.G.; Kohane, D.S. Enhancement of the Mechanical and Drug-Releasing Properties of Poloxamer 407 Hydrogels with Casein. Pharm. Res. 2021, 38, 515–522. [Google Scholar] [CrossRef]
- Pandit, S.S.; Patil, A.T. Formulation and in Vitro Evaluation of Buoyant Controlled Release Lercanidipine Lipospheres. J. Microencapsul. 2009, 26, 635–641. [Google Scholar] [CrossRef] [PubMed]
- Ige, P.; Swami, B.; Patil, T.; Pradhan, J.; Patil, P.; Nerkar, P.; Surana, S. Design and Development of Sustained Release Swelling Matrix Tablets of Glipizide For Type Ii Diabetes Mellitus. Farmacia 2013, 61, 883–901. [Google Scholar]
- Cao, Q.-R.; Kim, T.-W.; Lee, B.-J. Photoimages and the Release Characteristics of Lipophilic Matrix Tablets Containing Highly Water-Soluble Potassium Citrate with High Drug Loadings. Int. J. Pharm. 2007, 339, 19–24. [Google Scholar] [CrossRef] [PubMed]
- Mahalingam, R.; Li, X.; Jasti, B.R. Semisolid Dosages: Ointments, Creams, and Gels. Pharm. Sci. Encycl. 2010, 6, 1–46. [Google Scholar] [CrossRef]
- Phaechamud, T.; Darunkaisorn, W. Drug Release Behavior of Polymeric Matrix Filled in Capsule. Saudi Pharm. J. 2016, 24, 627–634. [Google Scholar] [CrossRef]
- Bostanudin, M.F.; Salam, A.; Mahmood, A.; Arafat, M.; Kaharudin, A.N.; Sahudin, S.; Mat Lazim, A.; Azfaralariff, A. Formulation and In-Vitro Characterisation of Cross-Linked Amphiphilic Guar Gum Nanocarriers for Percutaneous Delivery of Arbutin. J. Pharm. Sci. 2021, 110, 3907–3918. [Google Scholar] [CrossRef]
- Joshi, S.C. Sol-Gel Behavior of Hydroxypropyl Methylcellulose (HPMC) in Ionic Media Including Drug Release. Materials 2011, 4, 1861–1905. [Google Scholar] [CrossRef] [PubMed]
- Huang, H.; Zhang, Y.; Liu, Y.; Guo, Y.; Hu, C. Influence of Intermolecular Interactions on Crystallite Size in Crystalline Solid Dispersions. Pharmaceutics 2023, 15, 2493. [Google Scholar] [CrossRef]
- Dash, R.P.; Srinivas, N.R.; Babu, R.J. Use of Sorbitol as Pharmaceutical Excipient in the Present Day Formulations—Issues and Challenges for Drug Absorption and Bioavailability. Drug Dev. Ind. Pharm. 2019, 45, 1421–1429. [Google Scholar] [CrossRef]
- Disdier, Z.; Savoye, S.; Dagnelie, R.V.H. Effect of Solutes Structure and PH on the N-Octanol/Water Partition Coefficient of Ionizable Organic Compounds. Chemosphere 2022, 304, 135155. [Google Scholar] [CrossRef] [PubMed]
- Rojas Gómez, R.; Restrepo Valencia, P. In Vitro-in Vivo Pharmacokinetic Correlation Model for Quality Assurance of Antiretroviral Drugs. Colomb. Medica 2015, 46, 109–116. [Google Scholar] [CrossRef]
- Ellakwa, T.E.; Alaa, F.; Doha, E. Ellakwa Influence of Poloxmer on the Dissolution Properties of Mosapride and Its Pharmaceutical Tablet Formulation. Egypt. J. Chem. 2017, 60, 443–451. [Google Scholar] [CrossRef]
- Ashames, A.; Ullah, K.; Al-Tabakha, M.; Khan, S.A.; Hassan, N.; Mannan, A.; Ikram, M.; Buabeid, M.; Murtaza, G. Development, Characterization and In-Vitro Evaluation of Guar Gum Based New Polymeric Matrices for Controlled Delivery Using Metformin HCl as Model Drug. PLoS ONE 2022, 17, e0271623. [Google Scholar] [CrossRef]
- Klang, V.; Valenta, C.; Matsko, N.B. Electron Microscopy of Pharmaceutical Systems. Micron 2013, 44, 45–74. [Google Scholar] [CrossRef]
- Devi, R.; Sharma, R.B.; Sharma, A.; Agarwal, S. Comparison of Release Retardant Effect of Some Novel Lipids by Formulating Sustained Release Tablet of BCS Class 1 Drug. Indian J. Pharm. Educ. Res. 2020, 54, s241–s250. [Google Scholar] [CrossRef]
- Otsuka, Y.; Ito, A.; Pal, S.; Mitome, H.; Takeuchi, M.; Tanaka, H. Prediction of Differential Scanning Calorimetry Curve of Theophylline Direct Compression Model Tablet Using Raman Spectra. J. Drug Deliv. Sci. Technol. 2019, 49, 254–259. [Google Scholar] [CrossRef]
- Song, Z.; Yin, J.; Xiao, P.; Chen, J.; Gou, J.; Wang, Y.; Zhang, Y.; Yin, T.; Tang, X.; He, H. Improving Breviscapine Oral Bioavailability by Preparing Nanosuspensions, Liposomes and Phospholipid Complexes. Pharmaceutics 2021, 13, 132. [Google Scholar] [CrossRef]
- Bouriche, S.; Alonso-García, A.; Cárceles-Rodríguez, C.M.; Rezgui, F.; Fernández-Varón, E. An in Vivo Pharmacokinetic Study of Metformin Microparticles as an Oral Sustained Release Formulation in Rabbits. BMC Vet. Res. 2021, 17, 315. [Google Scholar] [CrossRef]
- Akash, M.S.H.; Rehman, K. Thermo Gravimetric Analysis. In Essentials of Pharmaceutical Analysis; Springer Nature Singapore: Singapore, 2020; pp. 215–222. [Google Scholar]
- Mikrani, I.; Sarkar, M.R.; Islam, M.; Das, S.C.; Rahman Prattay, K.M. Development, Characterization and In Vitro Evaluation of Solid Dispersion Formulations of Low Aqueous Soluble BCS Class II Drug Pitavastatin with Poloxamer 407 and HPMC. Dhaka Univ. J. Pharm. Sci. 2022, 37, 325–336. [Google Scholar] [CrossRef]
- Yao, Y.; Zhou, Y.; Liu, L.; Xu, Y.; Chen, Q.; Wang, Y.; Wu, S.; Deng, Y.; Zhang, J.; Shao, A. Nanoparticle-Based Drug Delivery in Cancer Therapy and Its Role in Overcoming Drug Resistance. Front. Mol. Biosci. 2020, 7, 193. [Google Scholar] [CrossRef] [PubMed]


| Formulations | THN (%) | P-407 (%) | Total Weight (mg) |
|---|---|---|---|
| F1 | 60 | 40 | 500 |
| F2 | 50 | 50 | 600 |
| F3 | 40 | 60 | 750 |
| F4 | 30 | 70 | 1000 |
| Formulations | THN (%) | P-407 (%) | STA (%) | Total Weight (mg) |
|---|---|---|---|---|
| F5 | 39 | 58 | 3 | 775 |
| F6 | 36 | 55 | 9 | 825 |
| F7 | 33 | 50 | 17 | 900 |
| F8 | 30 | 45 | 25 | 1000 |
| Formulations | THN (%) | P-407 (%) | HPMC (%) | Total Weight (mg) |
|---|---|---|---|---|
| F9 | 39 | 58 | 3 | 775 |
| F10 | 36 | 55 | 9 | 825 |
| F11 | 33 | 50 | 17 | 900 |
| F12 | 30 | 45 | 25 | 1000 |
| Formulations | THN (%) | P-407 (%) | HPMC (%) | STA (%) | Total Weight (mg) |
|---|---|---|---|---|---|
| F13 | 30 | 30 | 20 | 20 | 1000 |
| F14 | 30 | 30 | 15 | 25 | 1000 |
| F15 | 30 | 30 | 10 | 30 | 1000 |
| F16 | 30 | 30 | 5 | 35 | 1000 |
| Model Name | of F15 | of Reference Product |
|---|---|---|
| Zero-order model | 0.9774 | 0.9863 |
| First-order model | 0.8457 | 0.8466 |
| Hixson–Crowell model | 0.9976 | 0.9956 |
| Higuchi model | 0.9702 | 0.9600 |
| Korsmeyer–Peppas model | 0.6348 | 0.6265 |
| Storage Temperature (°C) | Storage Humidity (%) | Drug Content (mg) |
|---|---|---|
| 20 | 60 | 300.00 ± 1.70 |
| 08 | 60 | 299.14 ± 0.86 |
| 40 | 60 | 298.28 ± 1.90 |
| 20 | 00 | 300.00 ± 1.72 |
| 20 | 25 | 303.45 ± 1.71 |
| 20 | 60 | 300.52 ± 0.52 |
Disclaimer/Publisher’s Note: The statements, opinions and data contained in all publications are solely those of the individual author(s) and contributor(s) and not of MDPI and/or the editor(s). MDPI and/or the editor(s) disclaim responsibility for any injury to people or property resulting from any ideas, methods, instructions or products referred to in the content. |
© 2024 by the authors. Licensee MDPI, Basel, Switzerland. This article is an open access article distributed under the terms and conditions of the Creative Commons Attribution (CC BY) license (https://creativecommons.org/licenses/by/4.0/).
Share and Cite
Sakkal, M.; Arafat, M.; Yuvaraju, P.; Beiram, R.; AbuRuz, S. Preparation and Characterization of Theophylline Controlled Release Matrix System Incorporating Poloxamer 407, Stearyl Alcohol, and Hydroxypropyl Methylcellulose: A Novel Formulation and Development Study. Polymers 2024, 16, 643. https://doi.org/10.3390/polym16050643
Sakkal M, Arafat M, Yuvaraju P, Beiram R, AbuRuz S. Preparation and Characterization of Theophylline Controlled Release Matrix System Incorporating Poloxamer 407, Stearyl Alcohol, and Hydroxypropyl Methylcellulose: A Novel Formulation and Development Study. Polymers. 2024; 16(5):643. https://doi.org/10.3390/polym16050643
Chicago/Turabian StyleSakkal, Molham, Mosab Arafat, Priya Yuvaraju, Rami Beiram, and Salahdein AbuRuz. 2024. "Preparation and Characterization of Theophylline Controlled Release Matrix System Incorporating Poloxamer 407, Stearyl Alcohol, and Hydroxypropyl Methylcellulose: A Novel Formulation and Development Study" Polymers 16, no. 5: 643. https://doi.org/10.3390/polym16050643
APA StyleSakkal, M., Arafat, M., Yuvaraju, P., Beiram, R., & AbuRuz, S. (2024). Preparation and Characterization of Theophylline Controlled Release Matrix System Incorporating Poloxamer 407, Stearyl Alcohol, and Hydroxypropyl Methylcellulose: A Novel Formulation and Development Study. Polymers, 16(5), 643. https://doi.org/10.3390/polym16050643