
A Facile Approach to Produce Activated Carbon from Waste Textiles via Self-Purging Microwave Pyrolysis and FeCl3 Activation for Electromagnetic Shielding Applications

 , , , and
Abstract
:1. Introduction
2. Materials and Methods
2.1. Materials
2.2. Production of the Multi-Layered Textile Structure
2.3. Experiments and Carbonization System
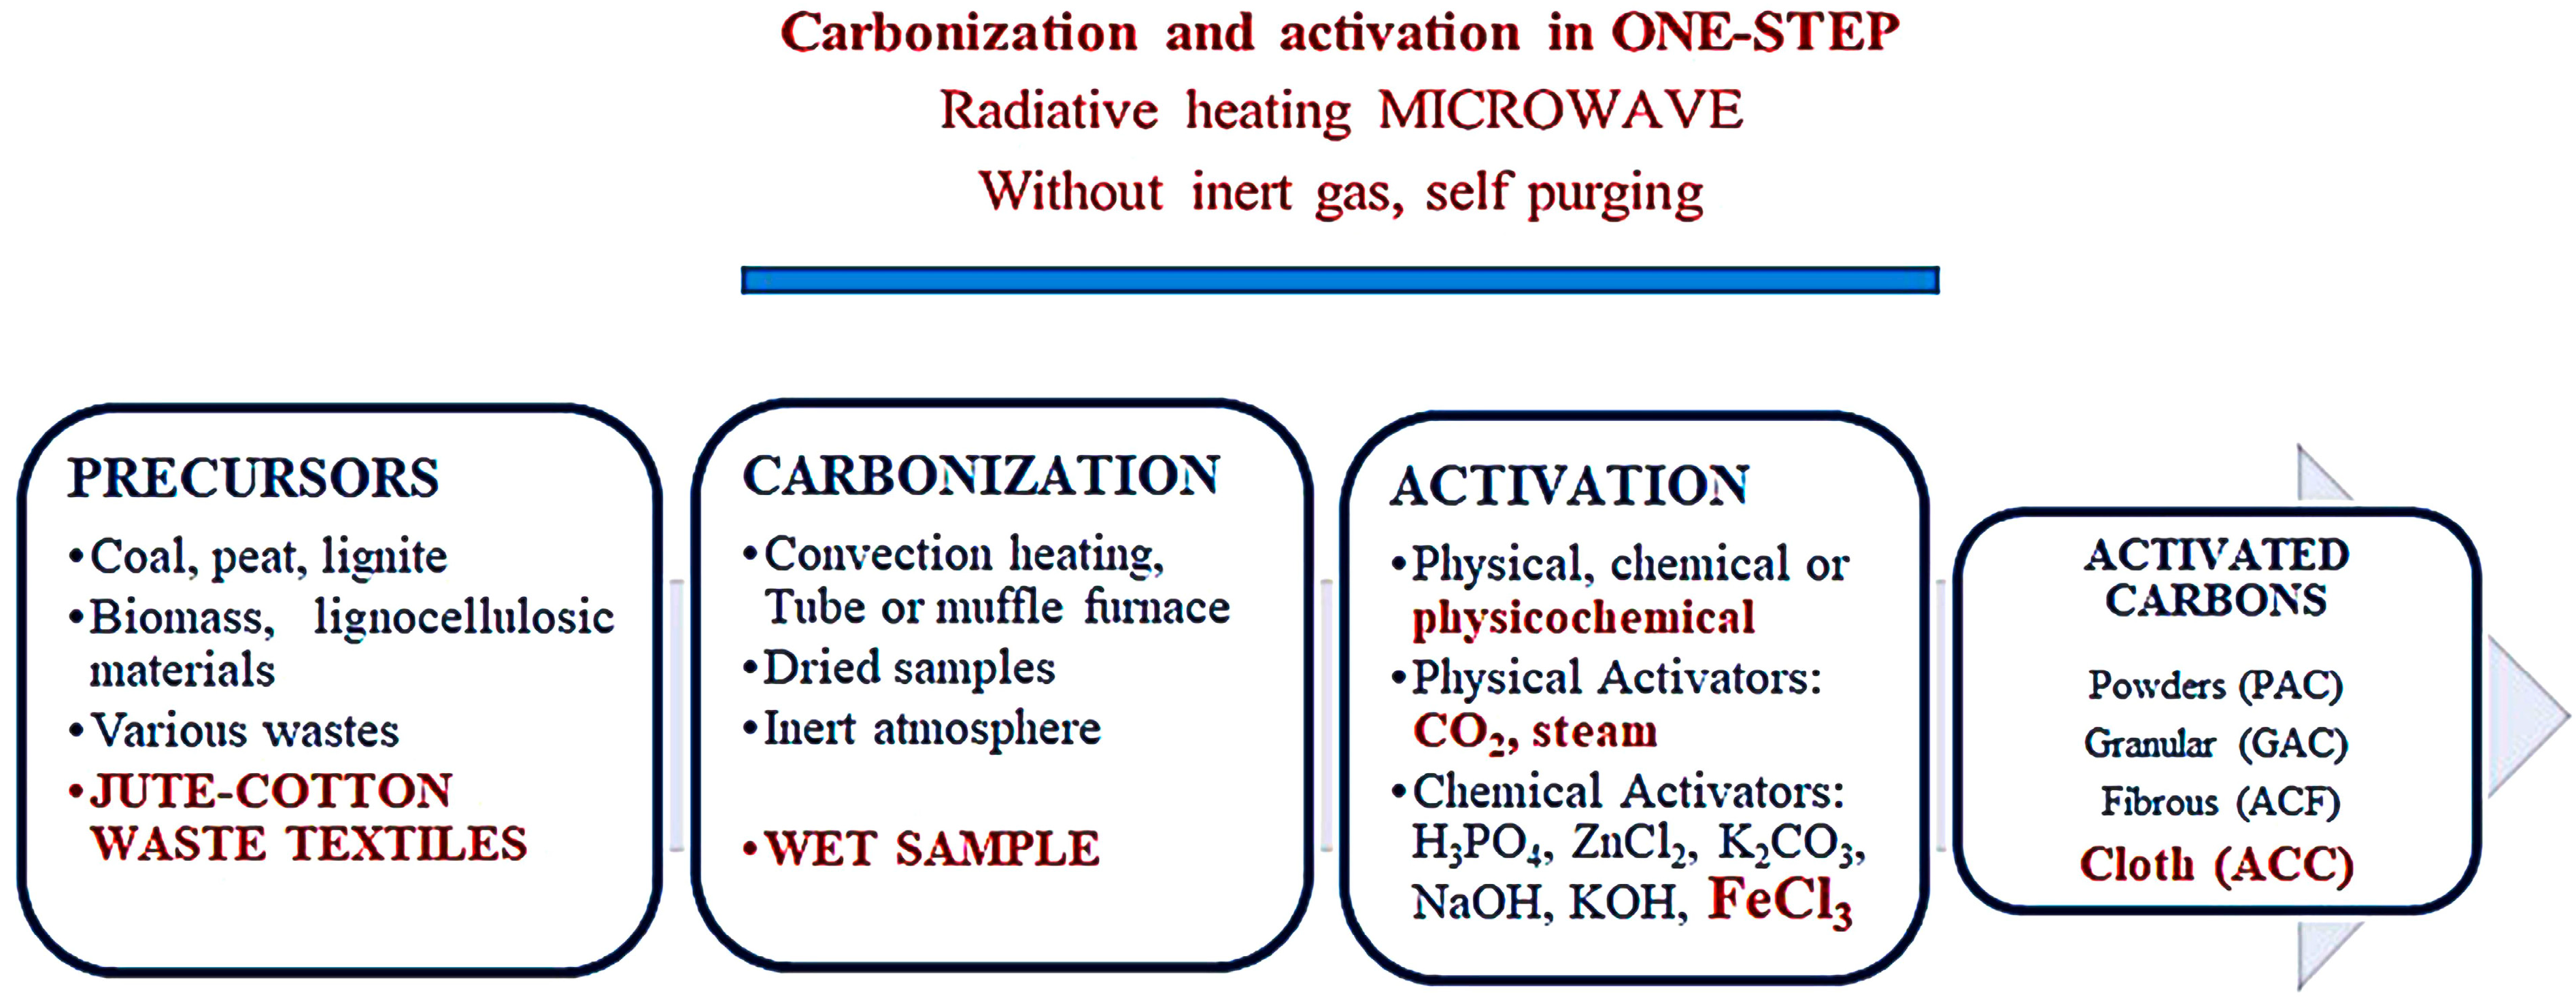
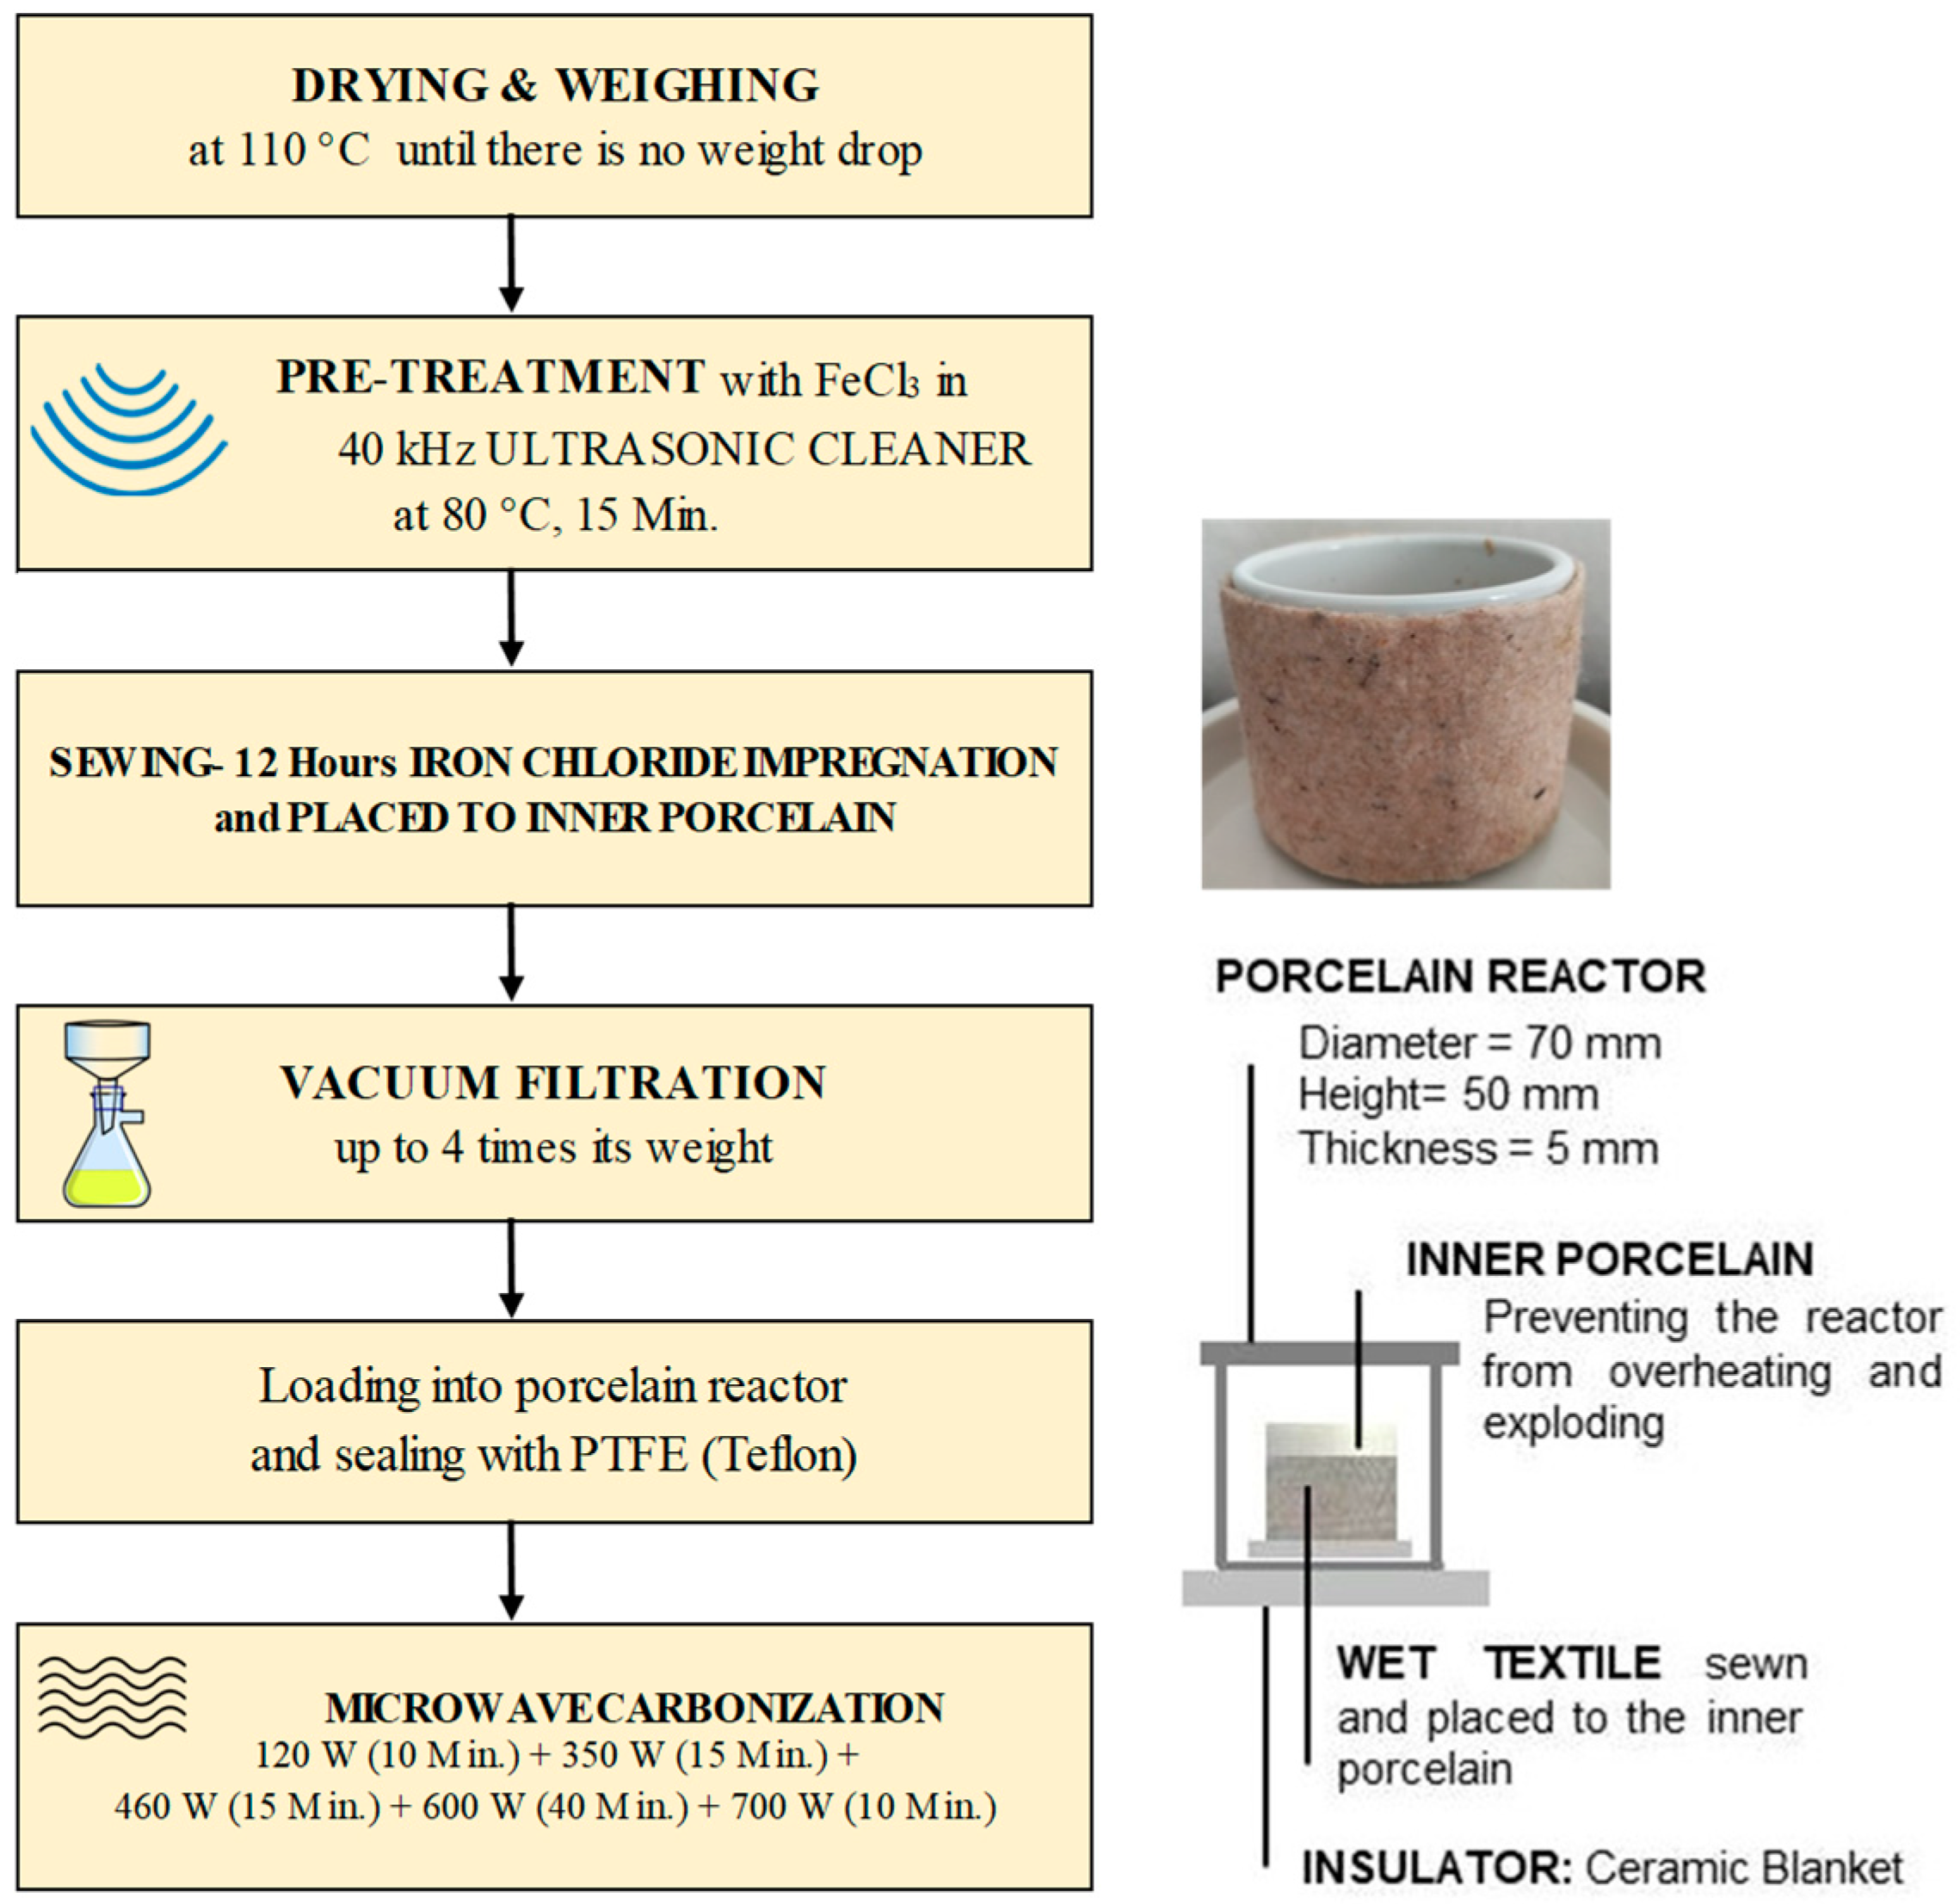
- The preliminary tests were used due to a lack of similar studies. After approximately 1 h, porcelain slowly evolves from microwave transparency to microwave absorbency, endangering work safety. More than 1 h was needed to make the desired product. When started directly at high power values, the porcelain exploded. Slowly elevated power was applied for safety conditions and mimicking slow pyrolysis. The microwave procedure was as follows: 120 W (10 min) + 350 W (15 min) + 460 W (15 min) + 600 W (40 min) + 700 W (10 min).
- Nonwoven–woven composite textiles were sewn by allowing approximately 5% shrinkage from the inner porcelain diameter. After being impregnated with FeCl3, they were carefully placed on the inner porcelain (3 cm height, 4 cm inner diameter, and 3 mm thickness). The reason for the sewing method was not only to protect the reactor from heat fluctuations but also to increase the efficiency of the process by producing more material since the lateral surface was larger than the base area. In addition, a microwave absorber was needed to achieve homogenous heating (Figure 3). Materials that contain polar molecules are ideal for this purpose. That is why FeCl3 was used as an absorber.
2.4. Characterizations
3. Results and Discussion
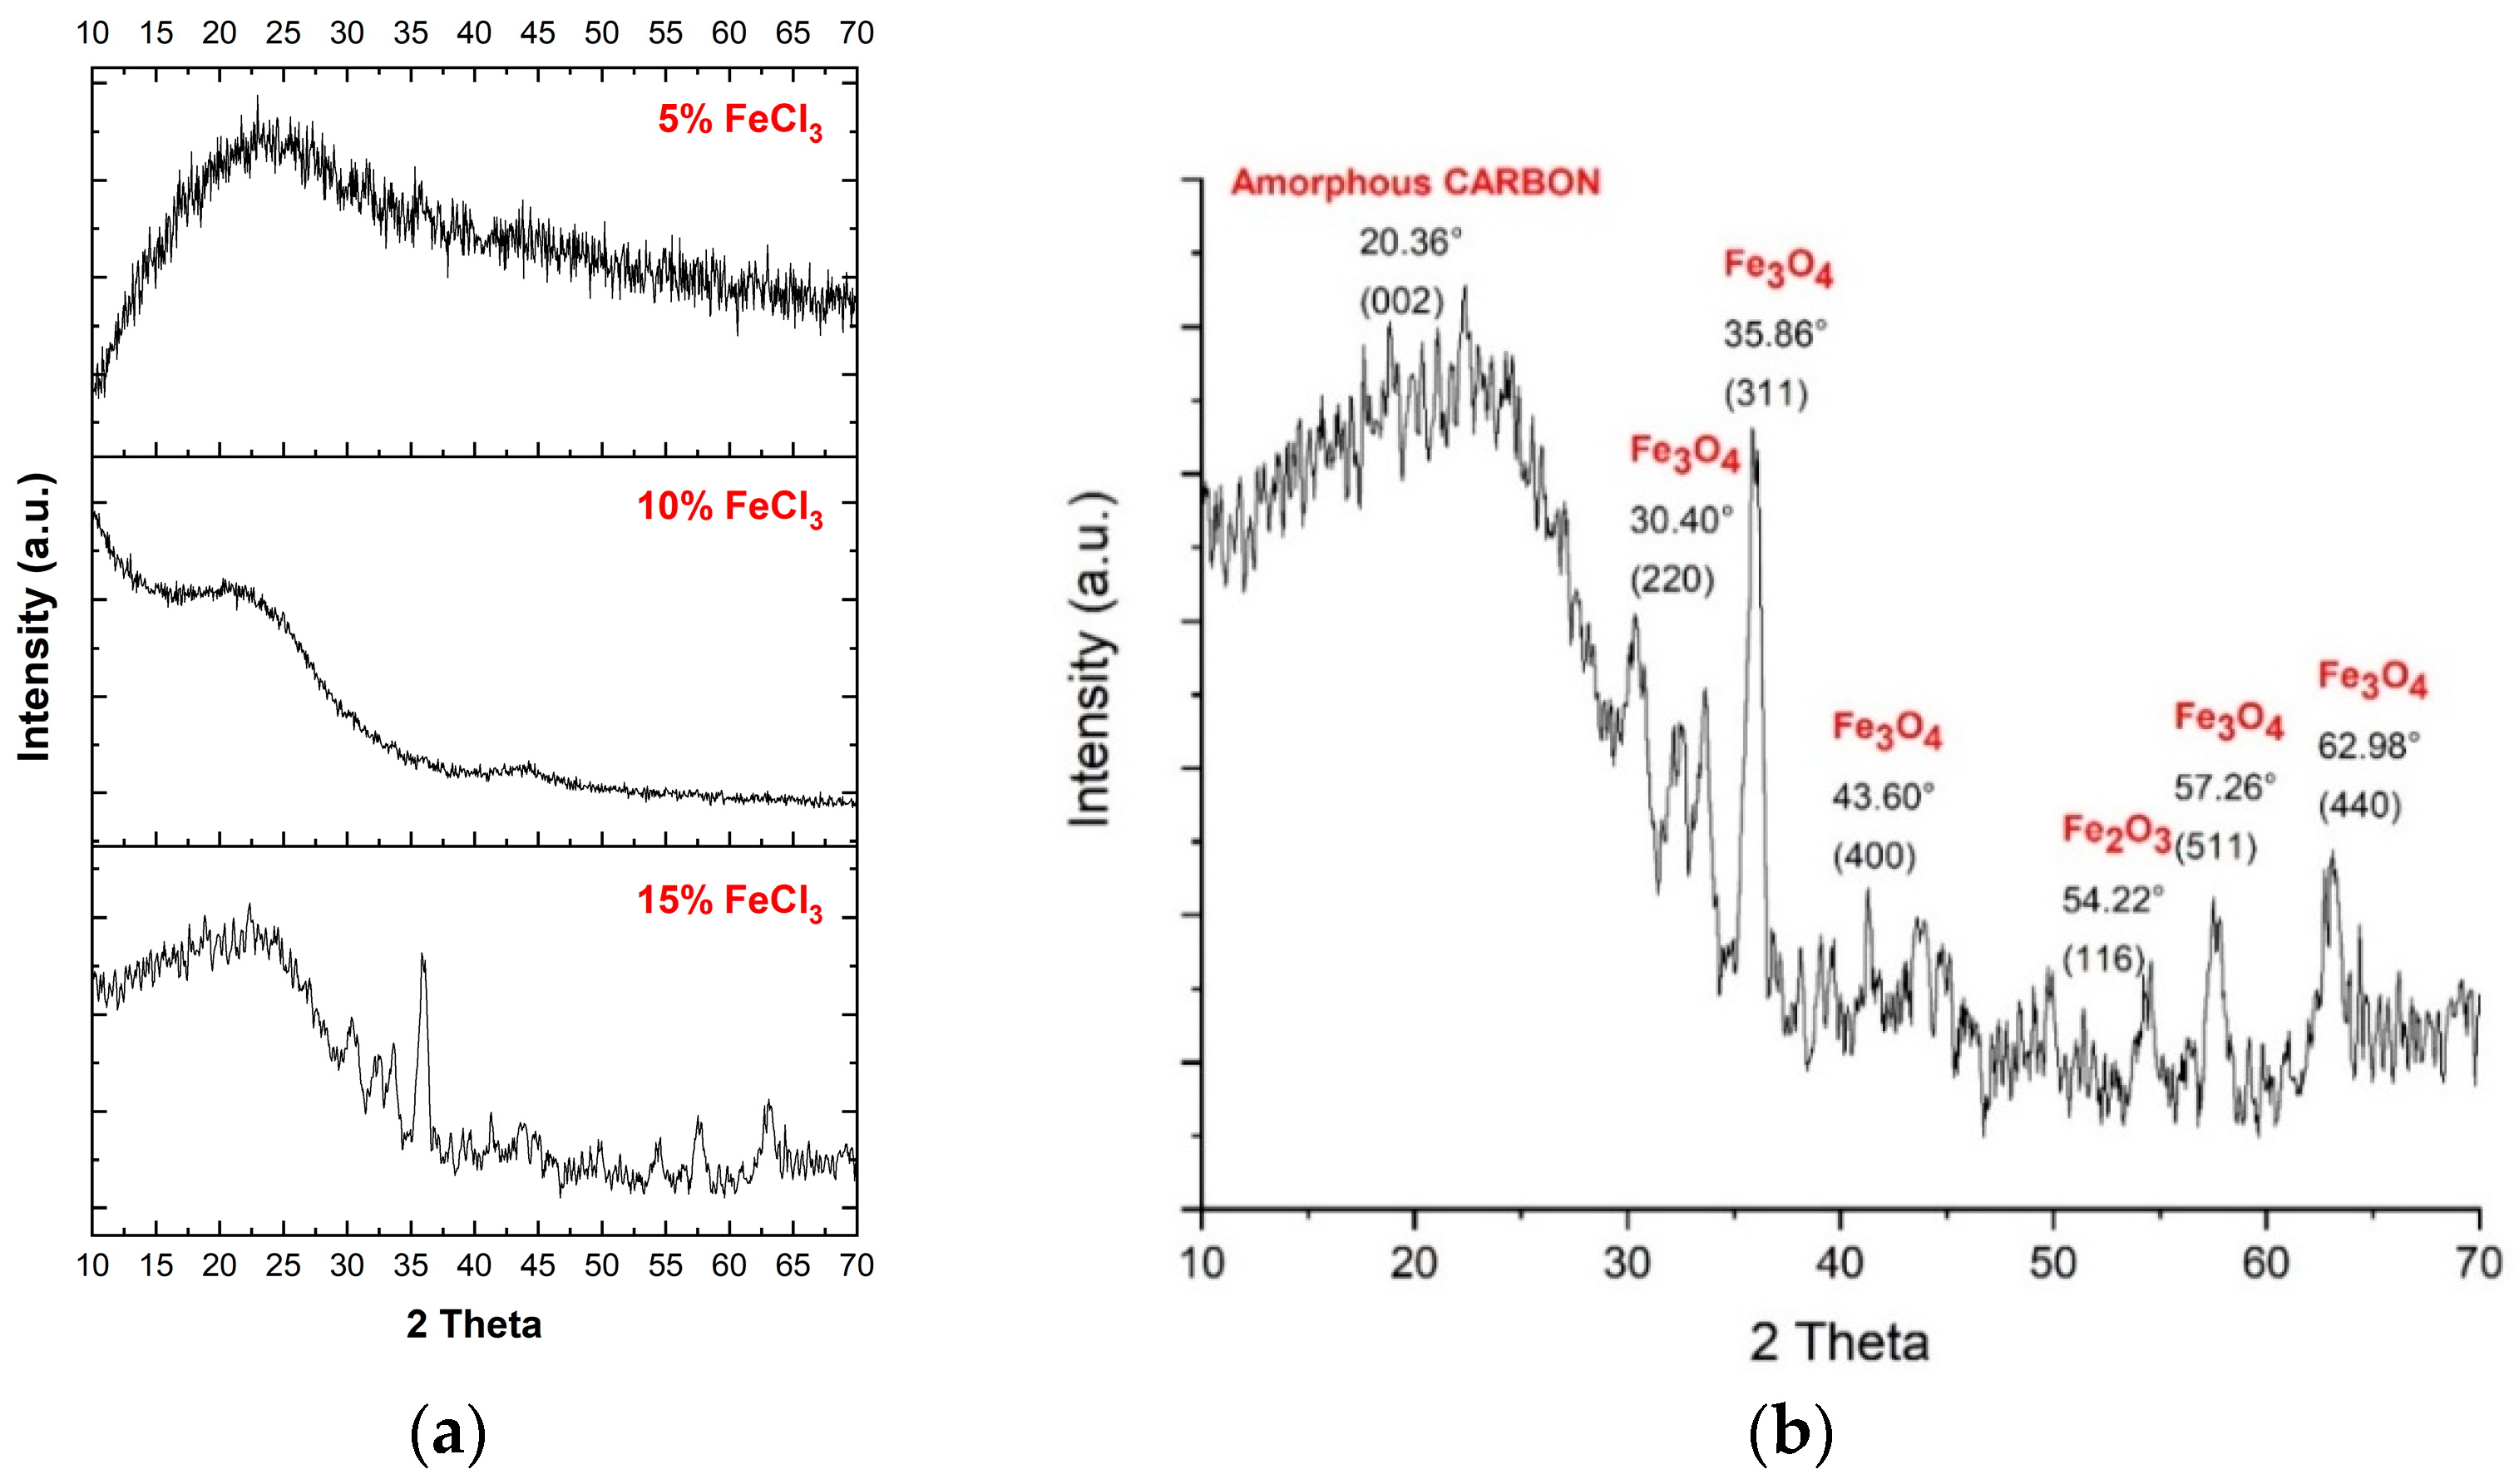
3.1. XRD Analysis
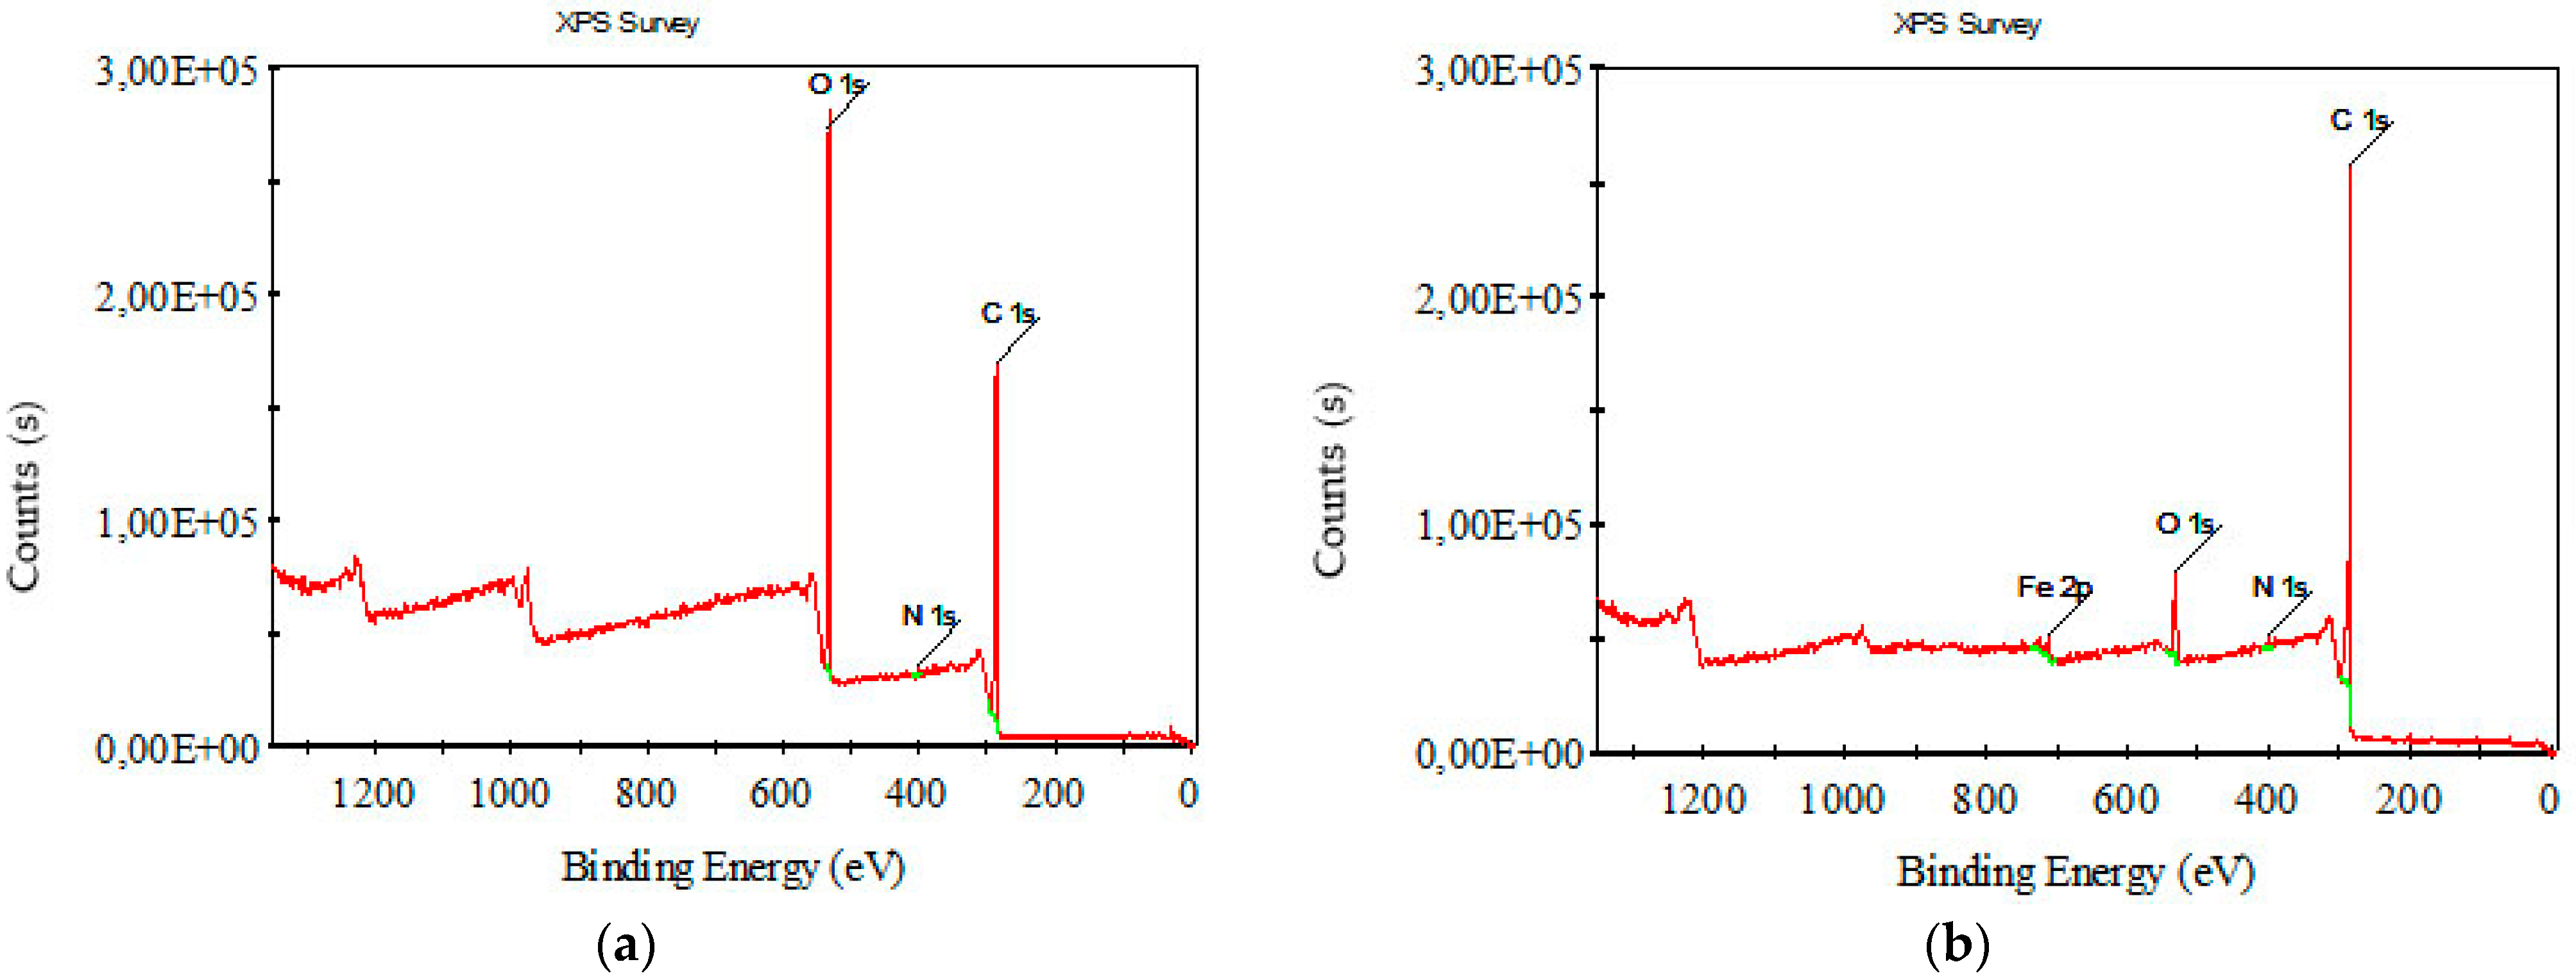
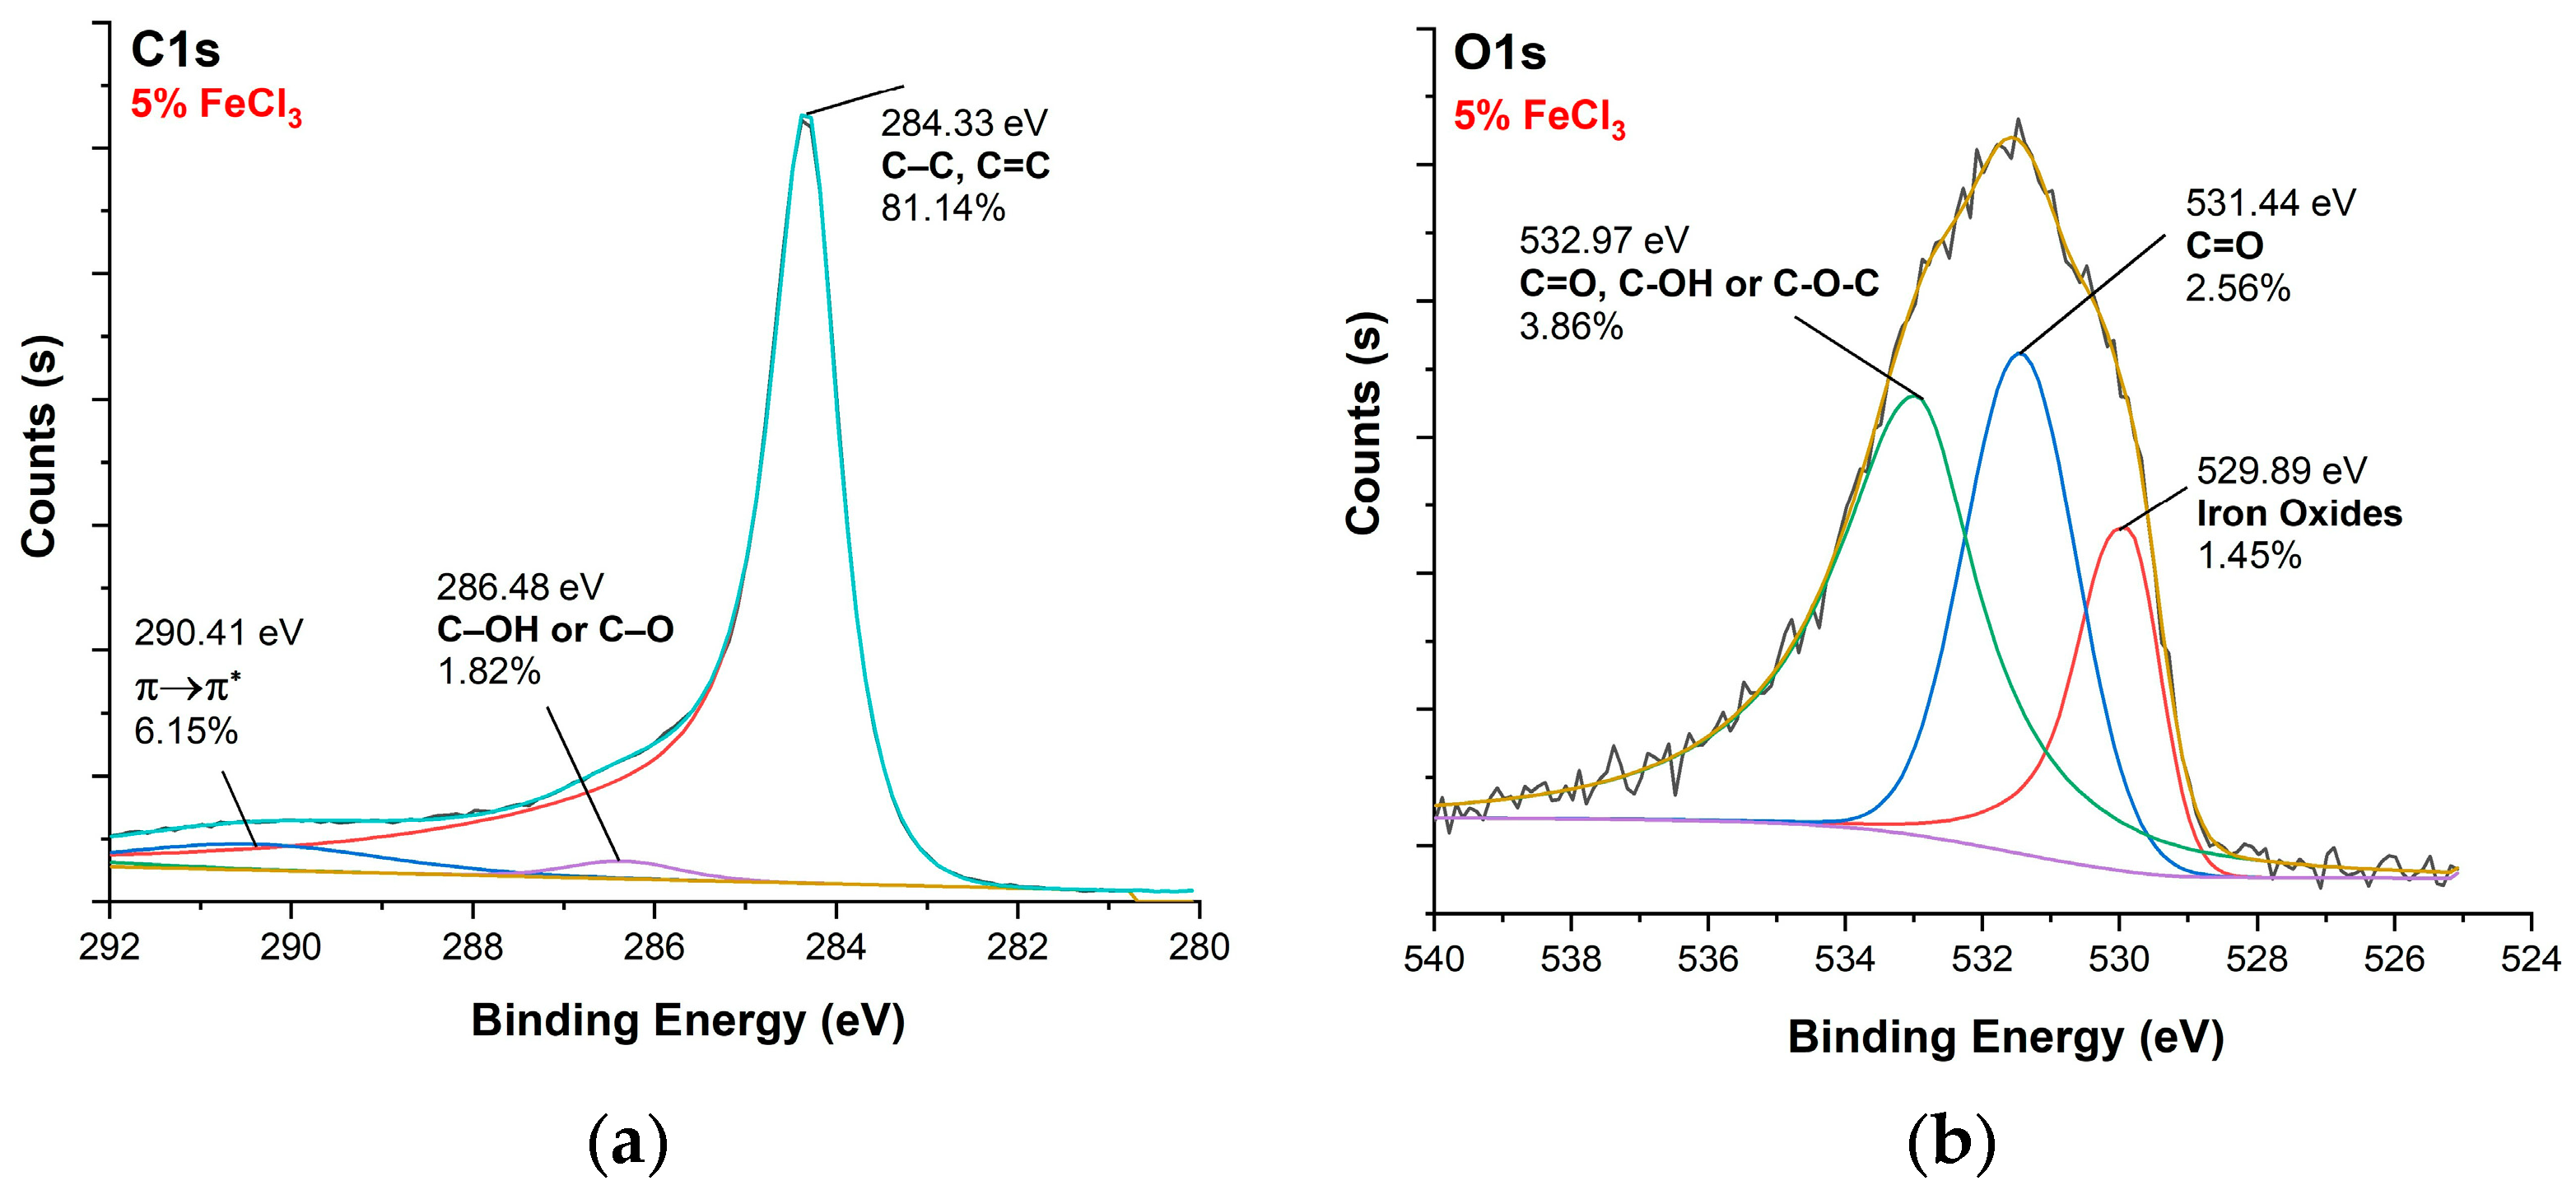
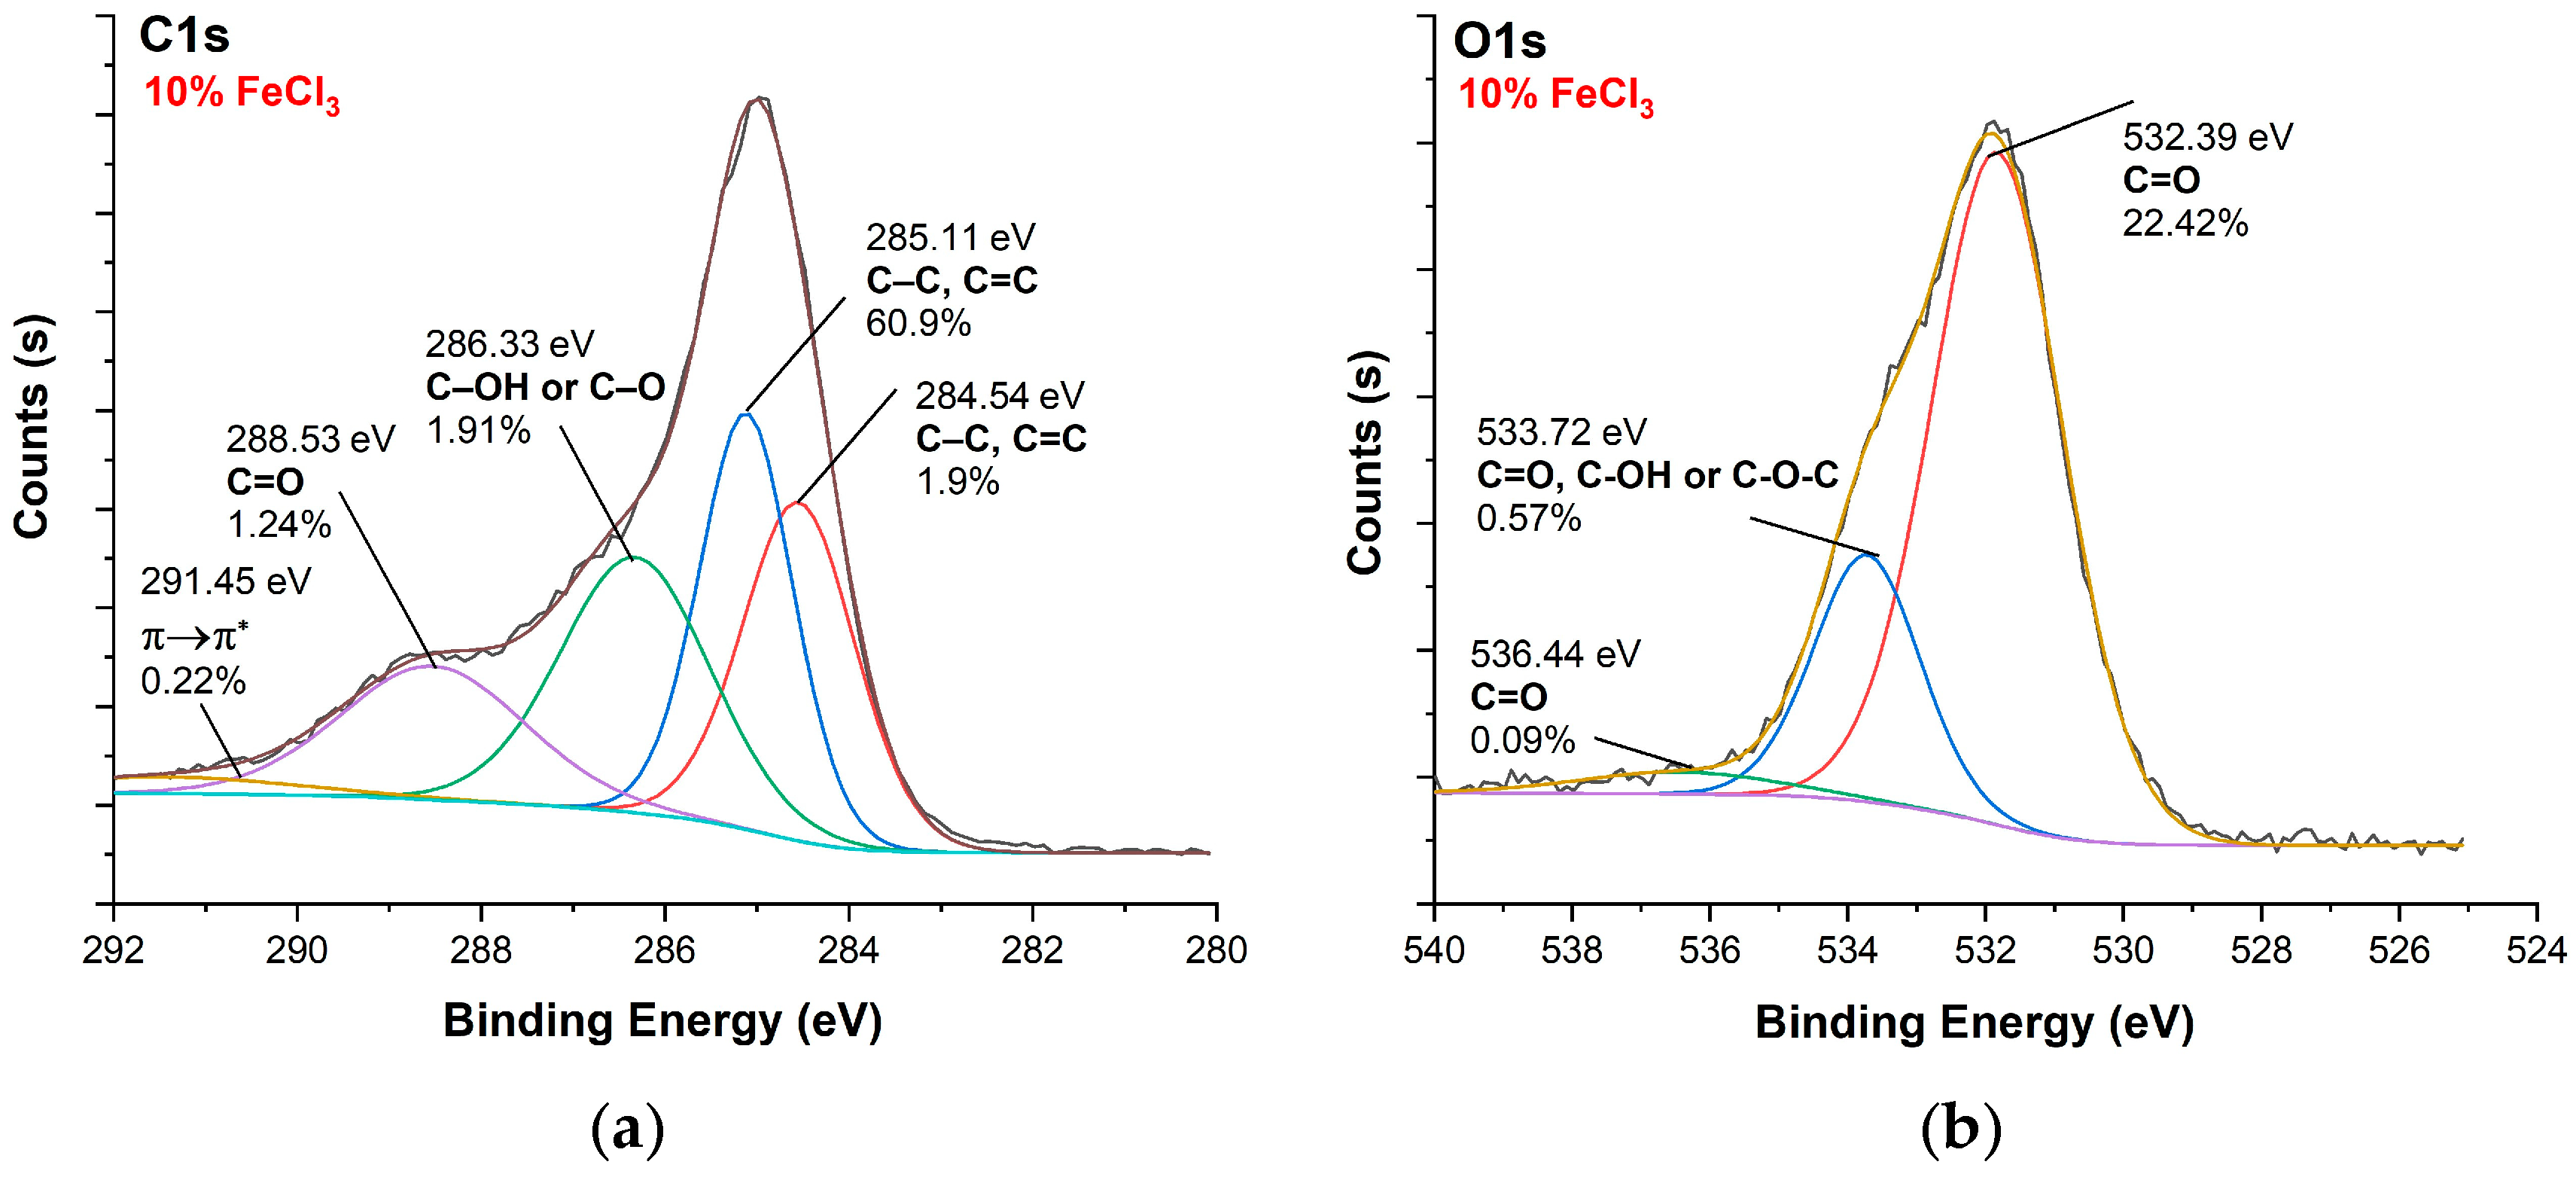
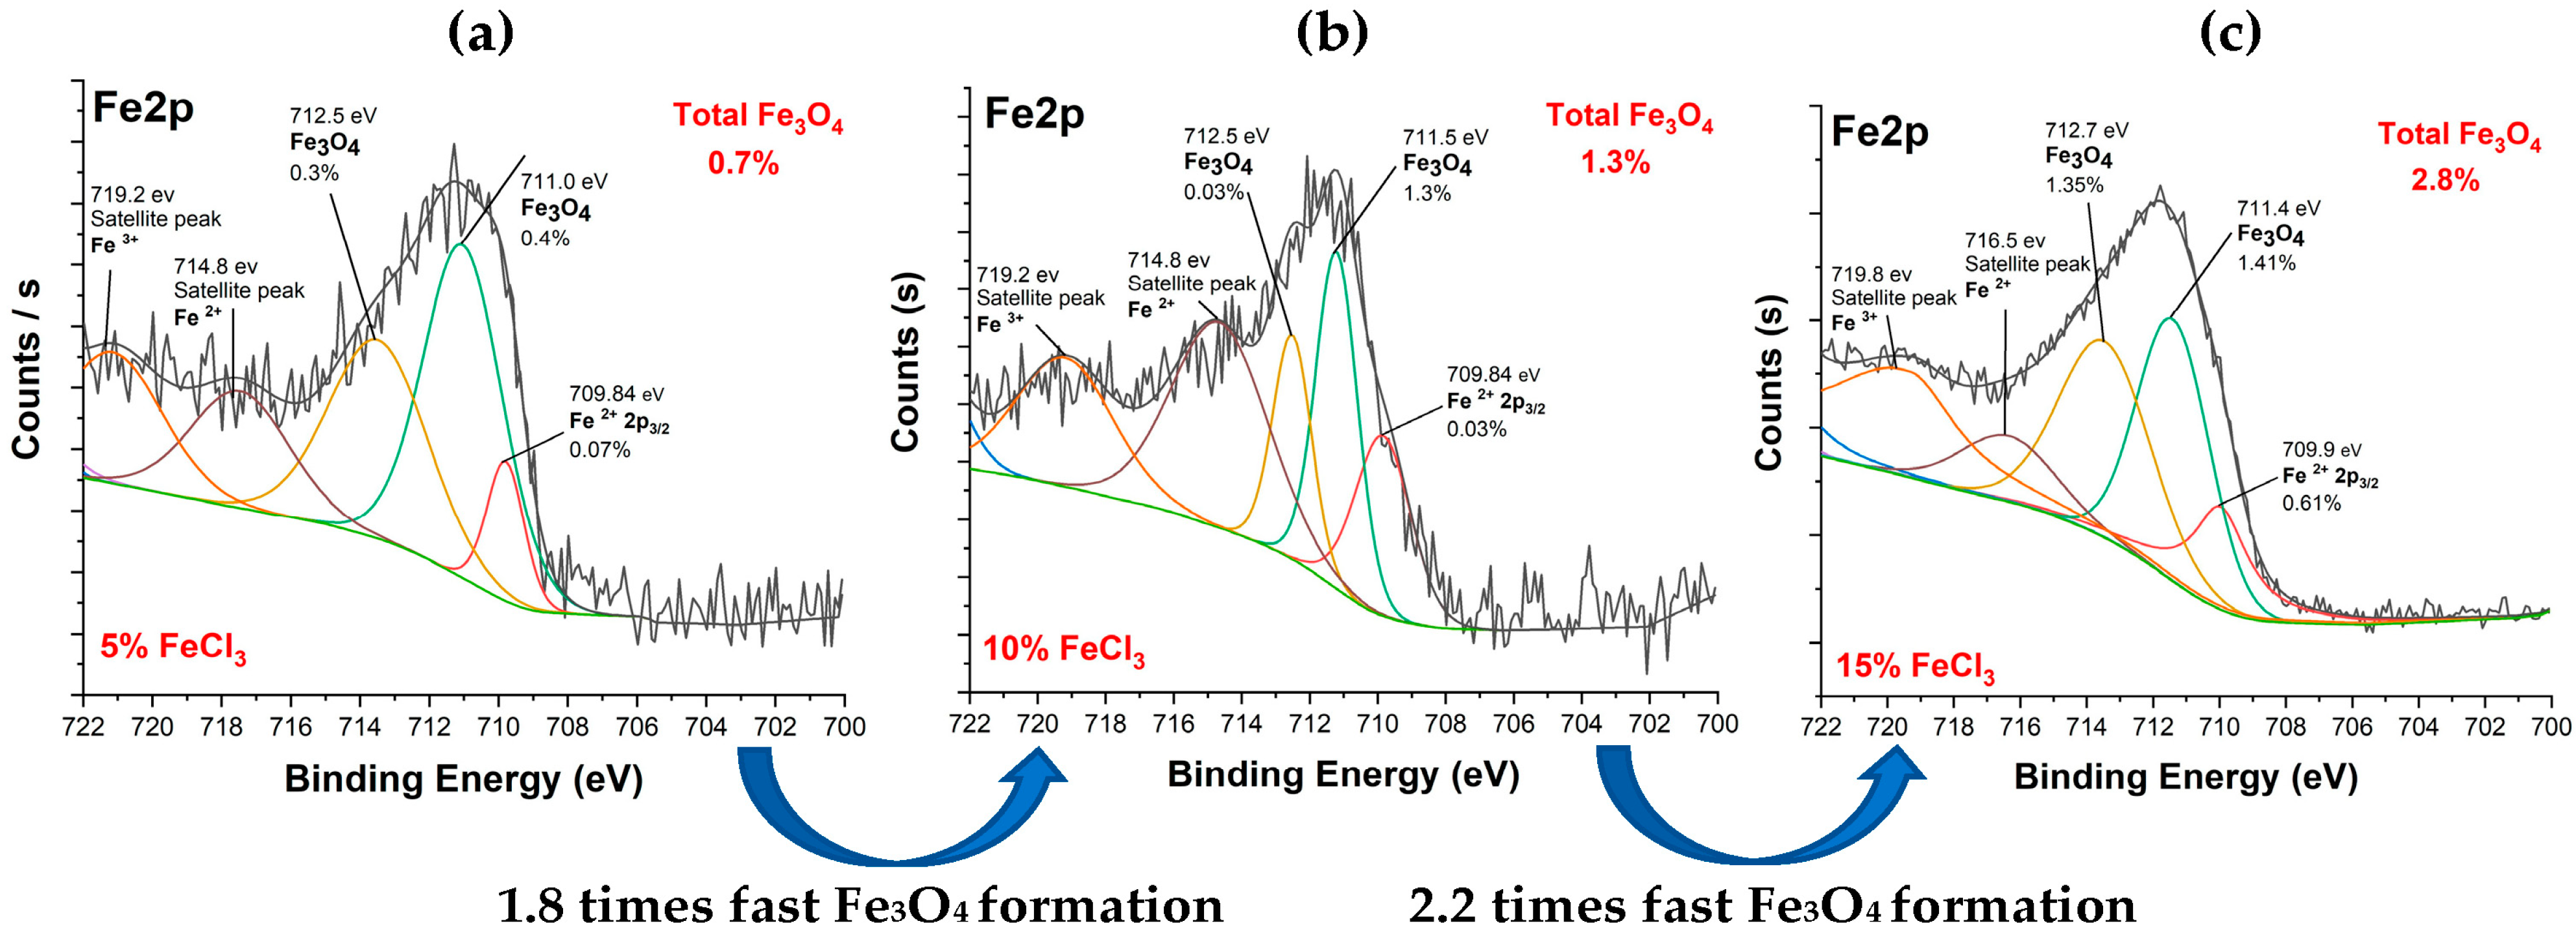
3.2. XPS Analysis
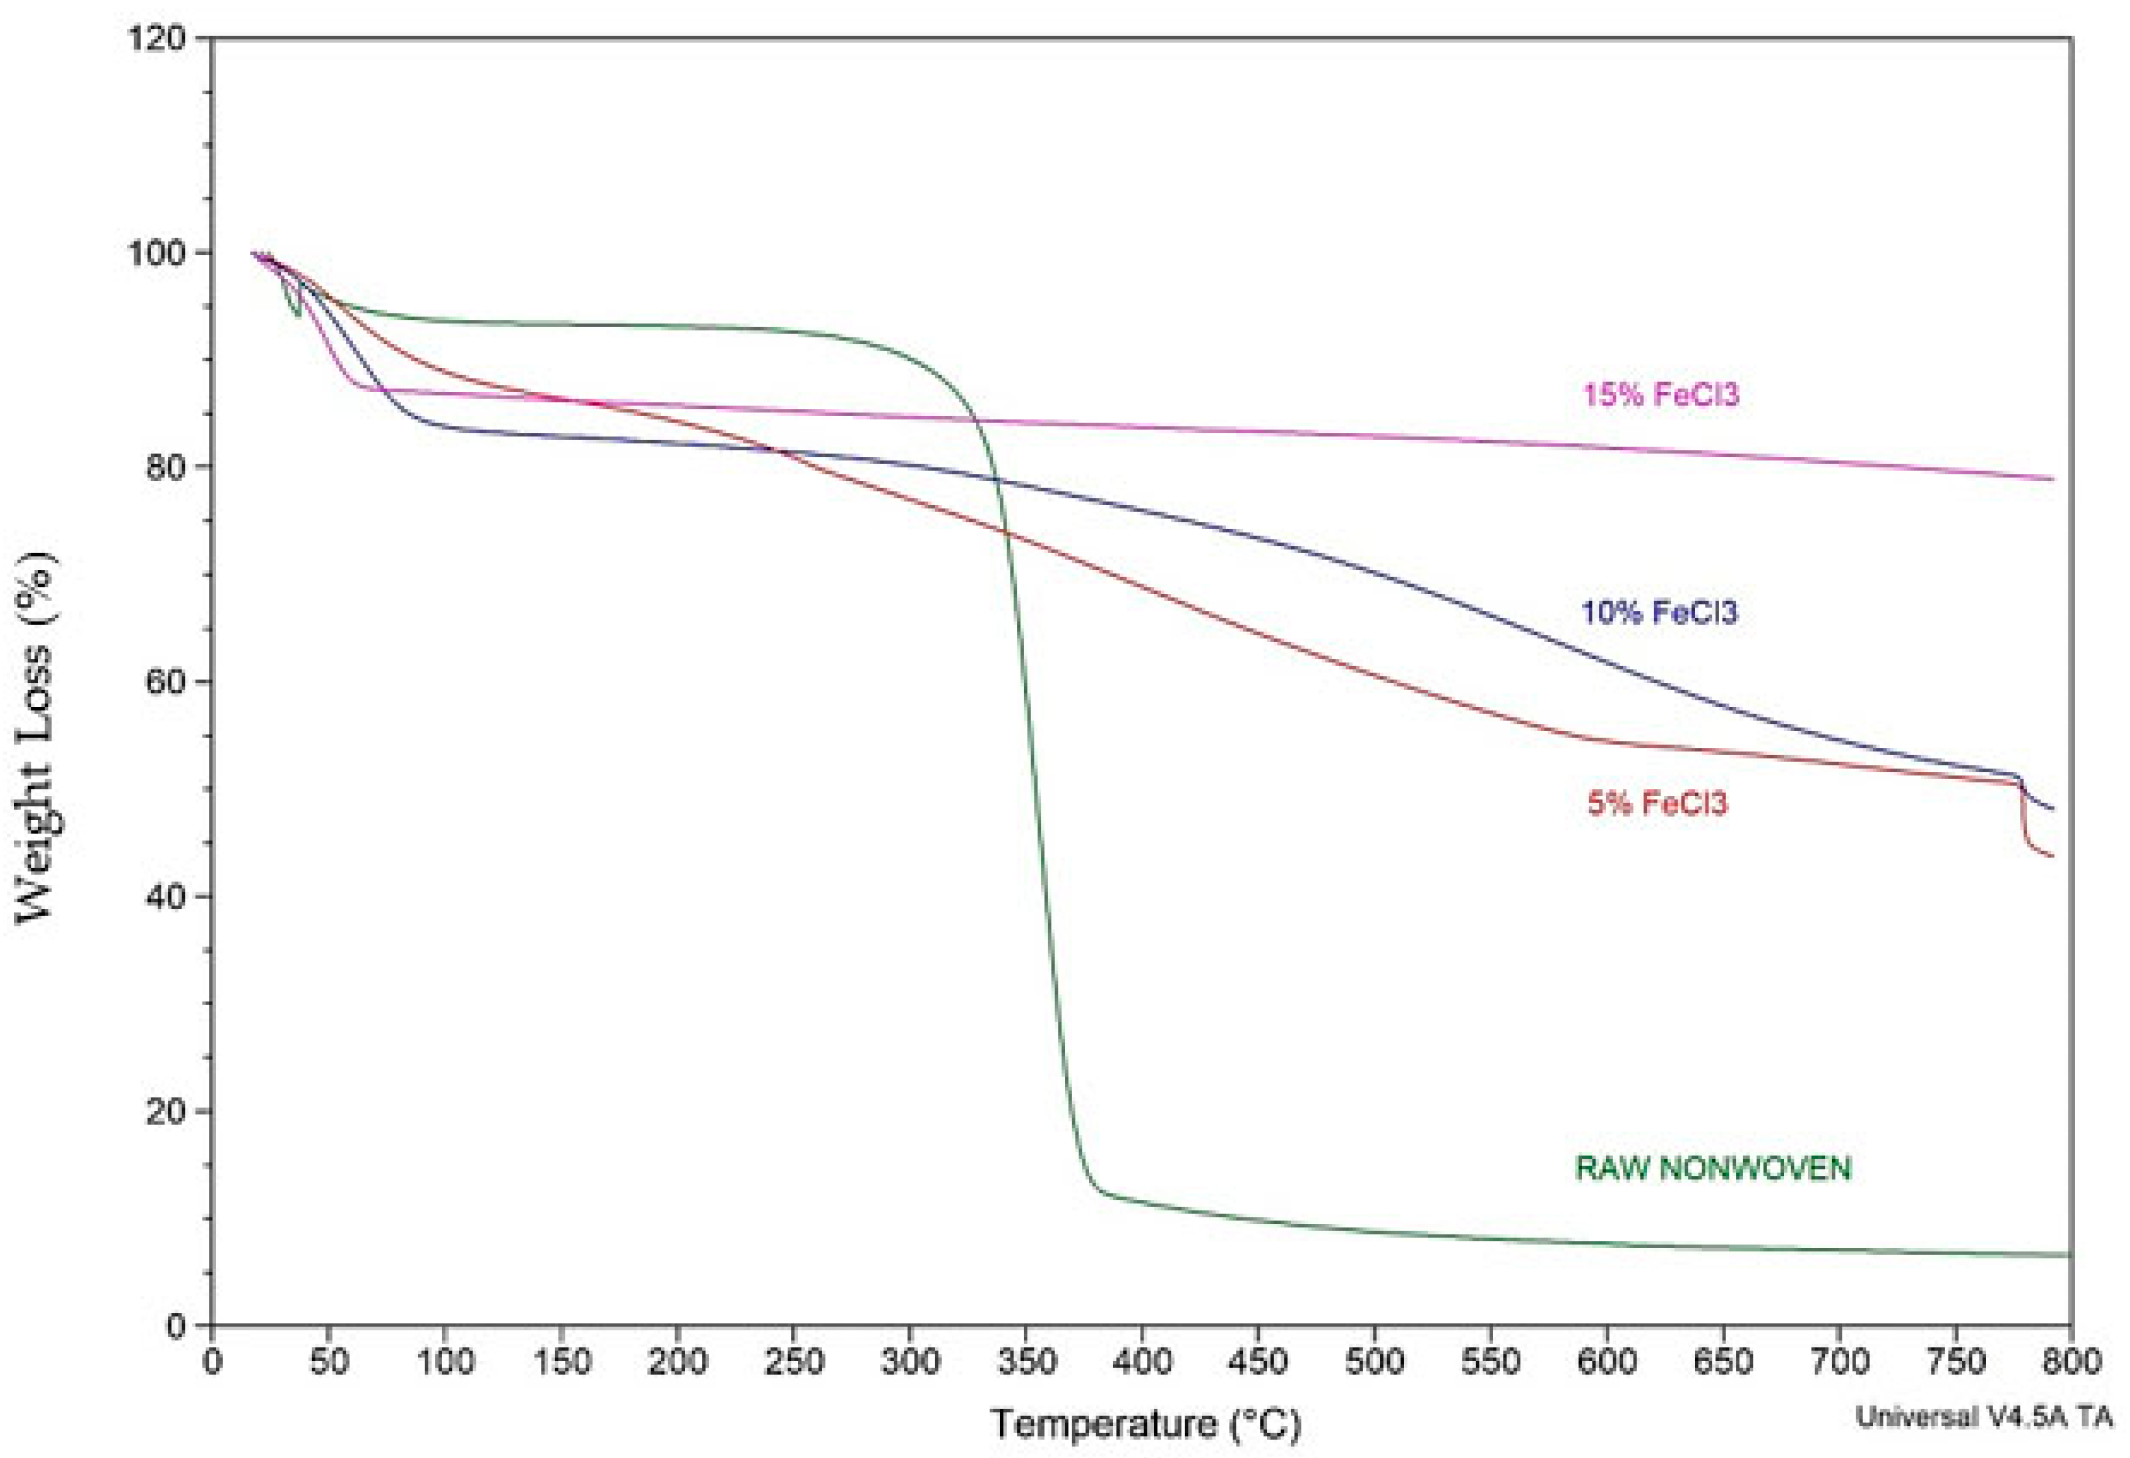
3.3. TGA Analysis
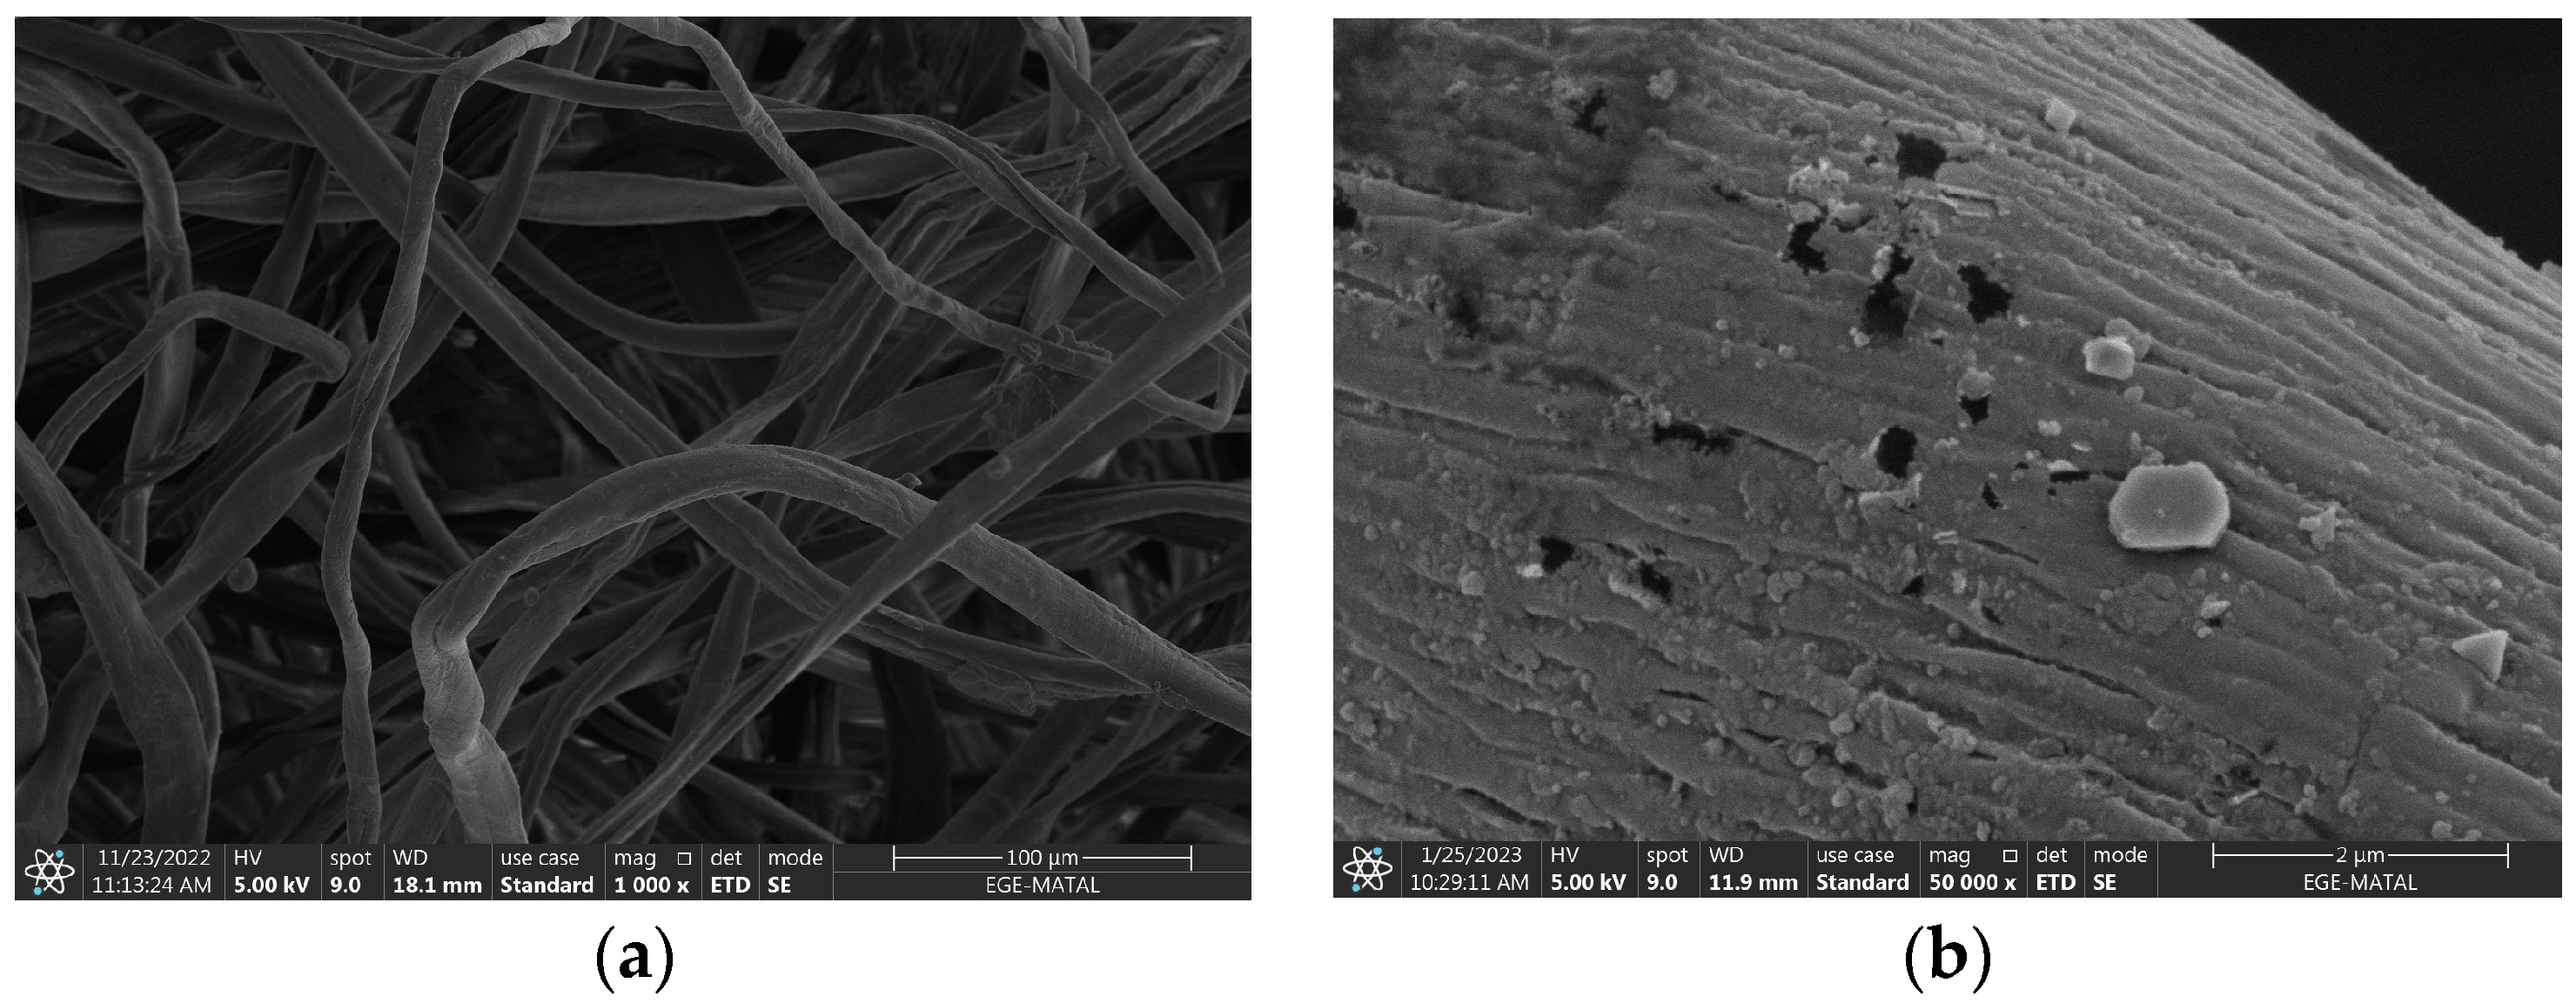
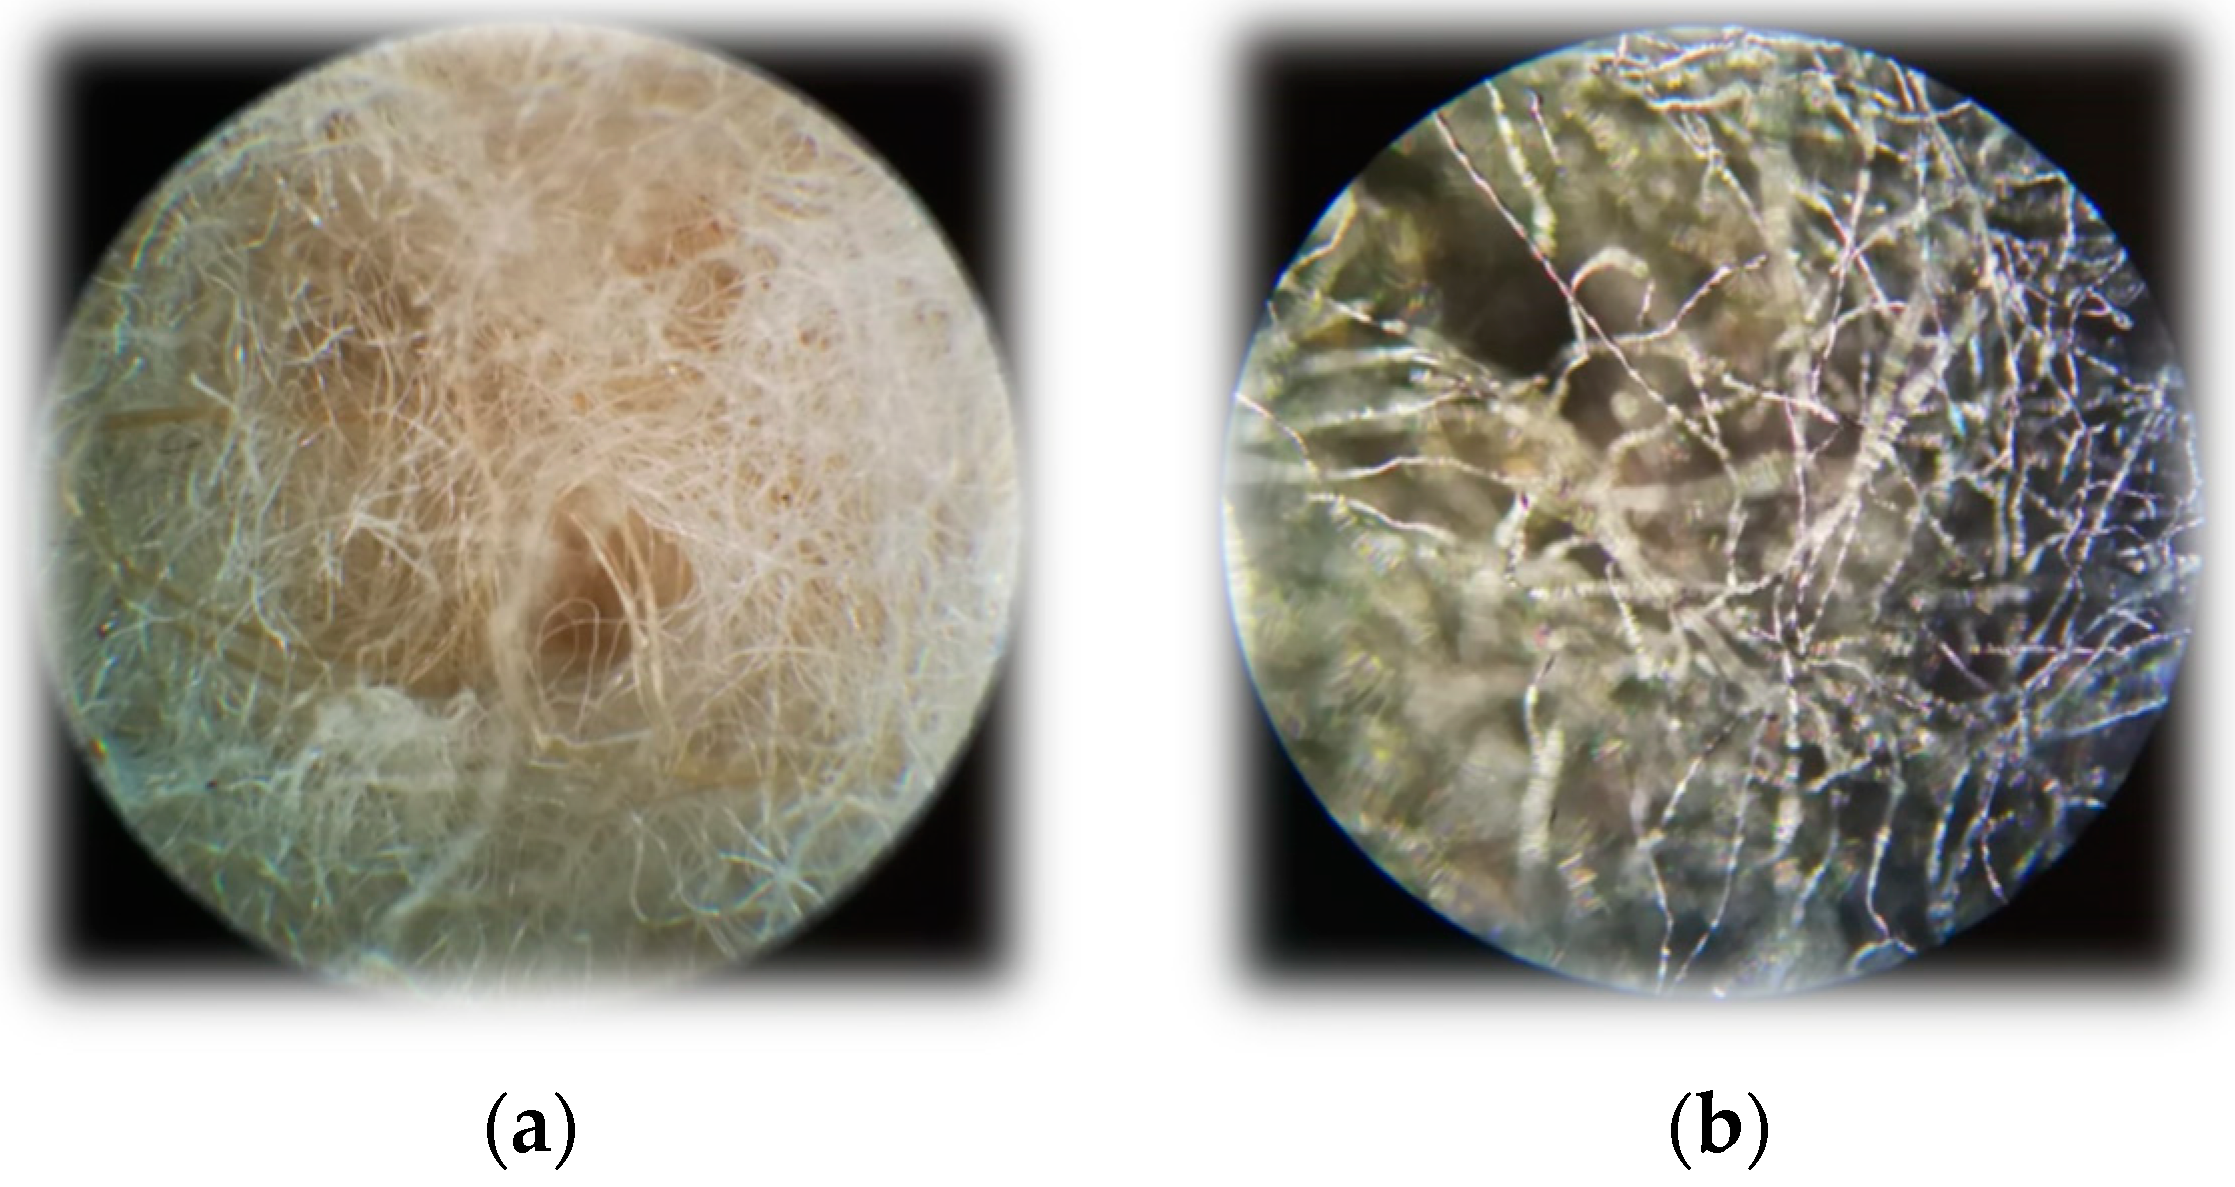
3.4. SEM and Microscopic Analysis
3.5. Yield
3.6. Pore Structure
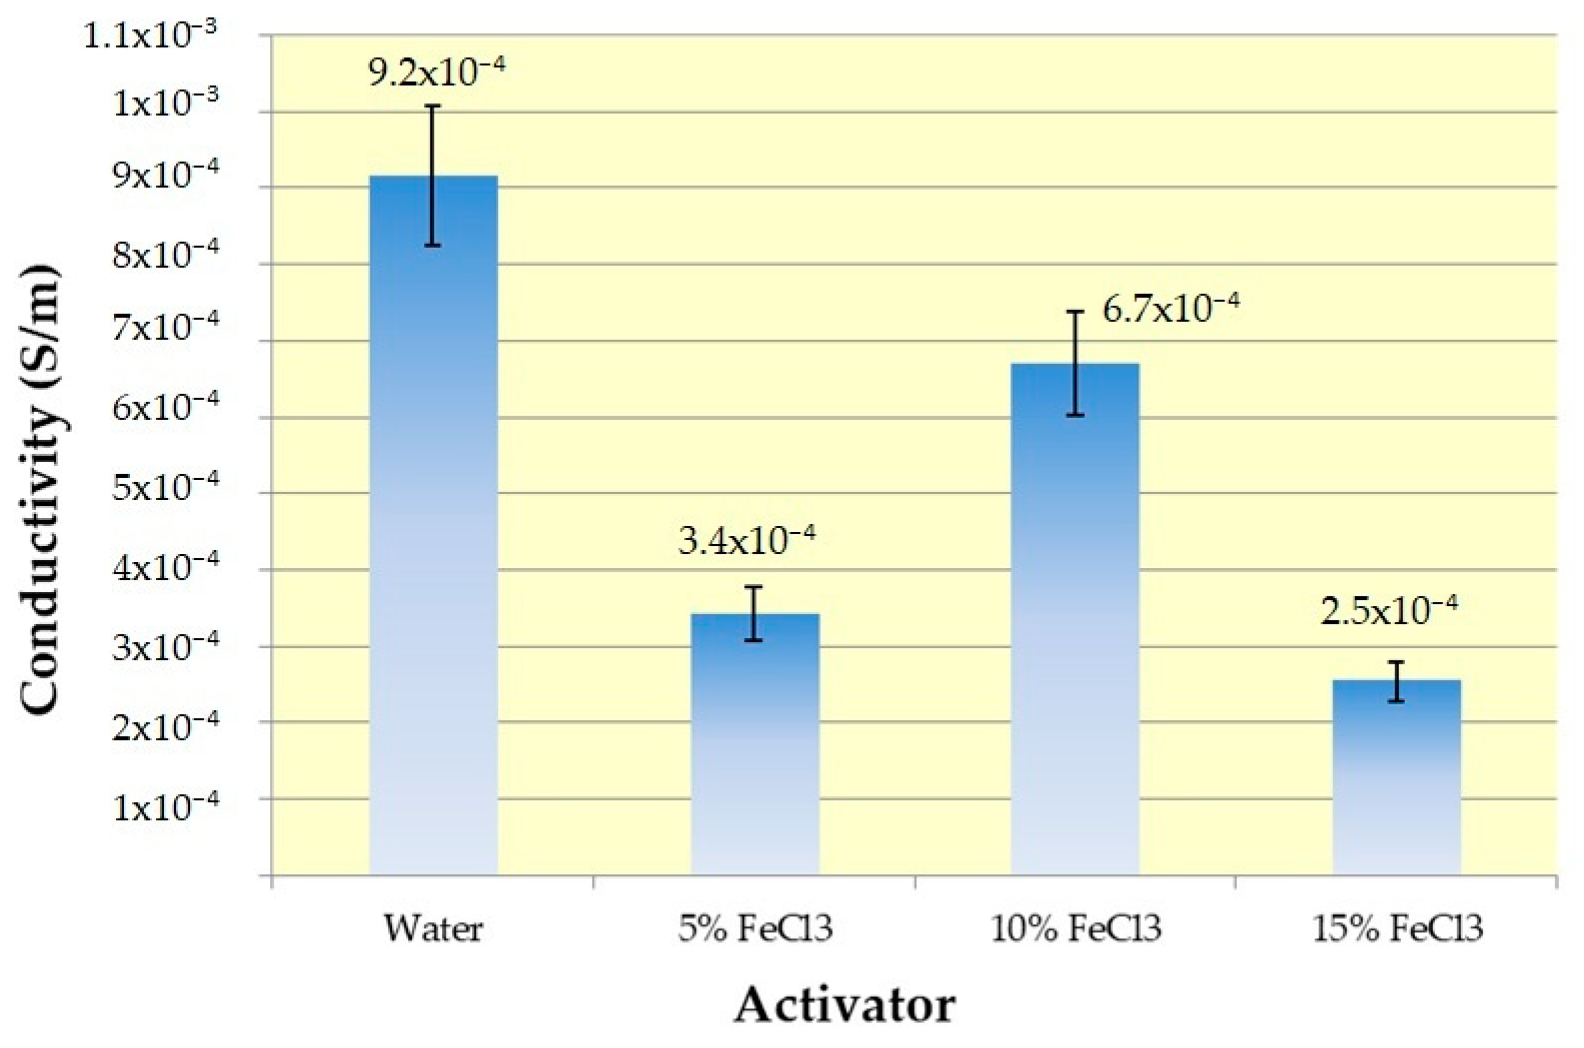
3.7. Conductivity
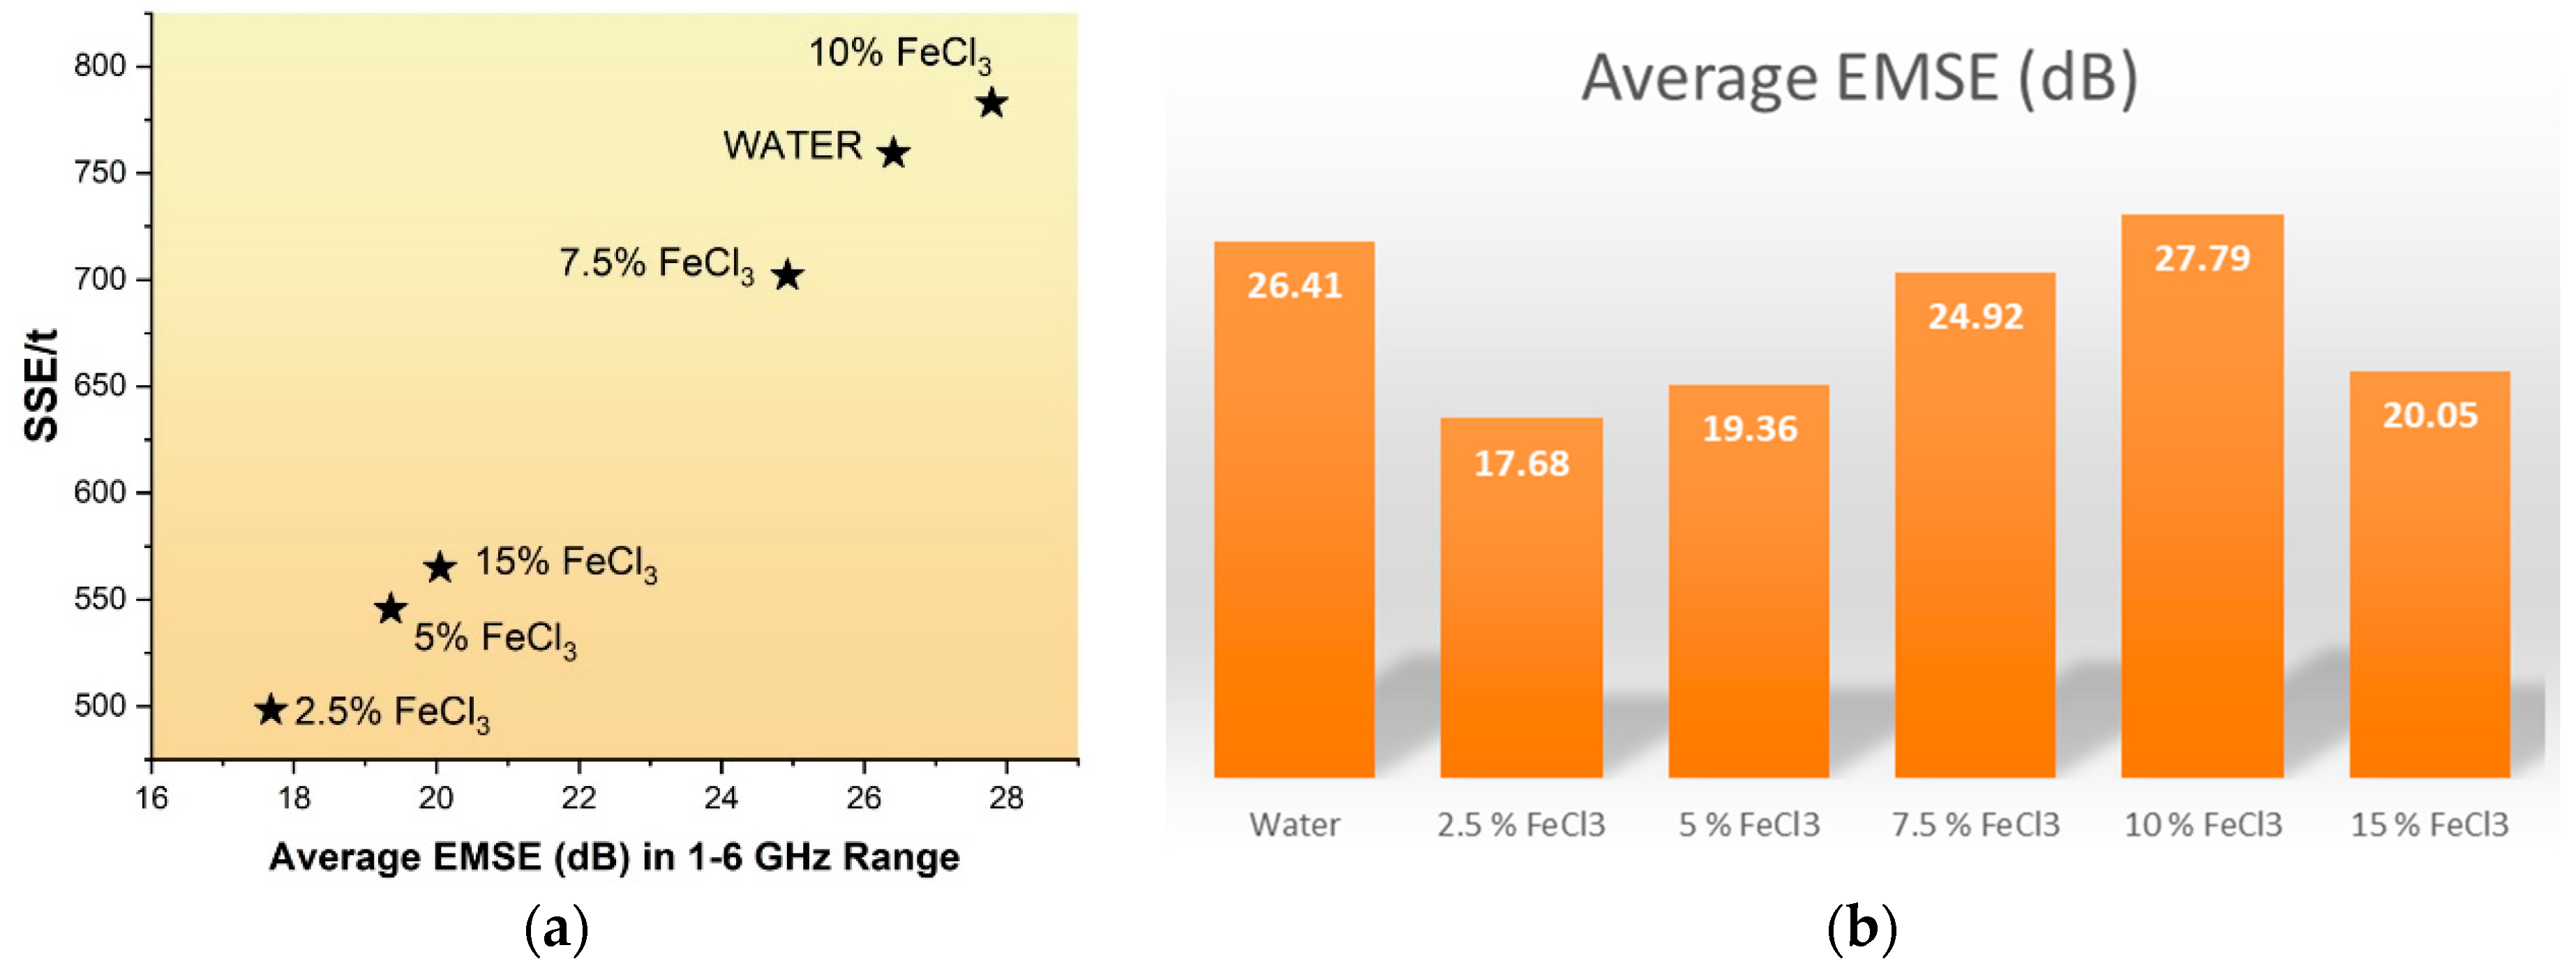
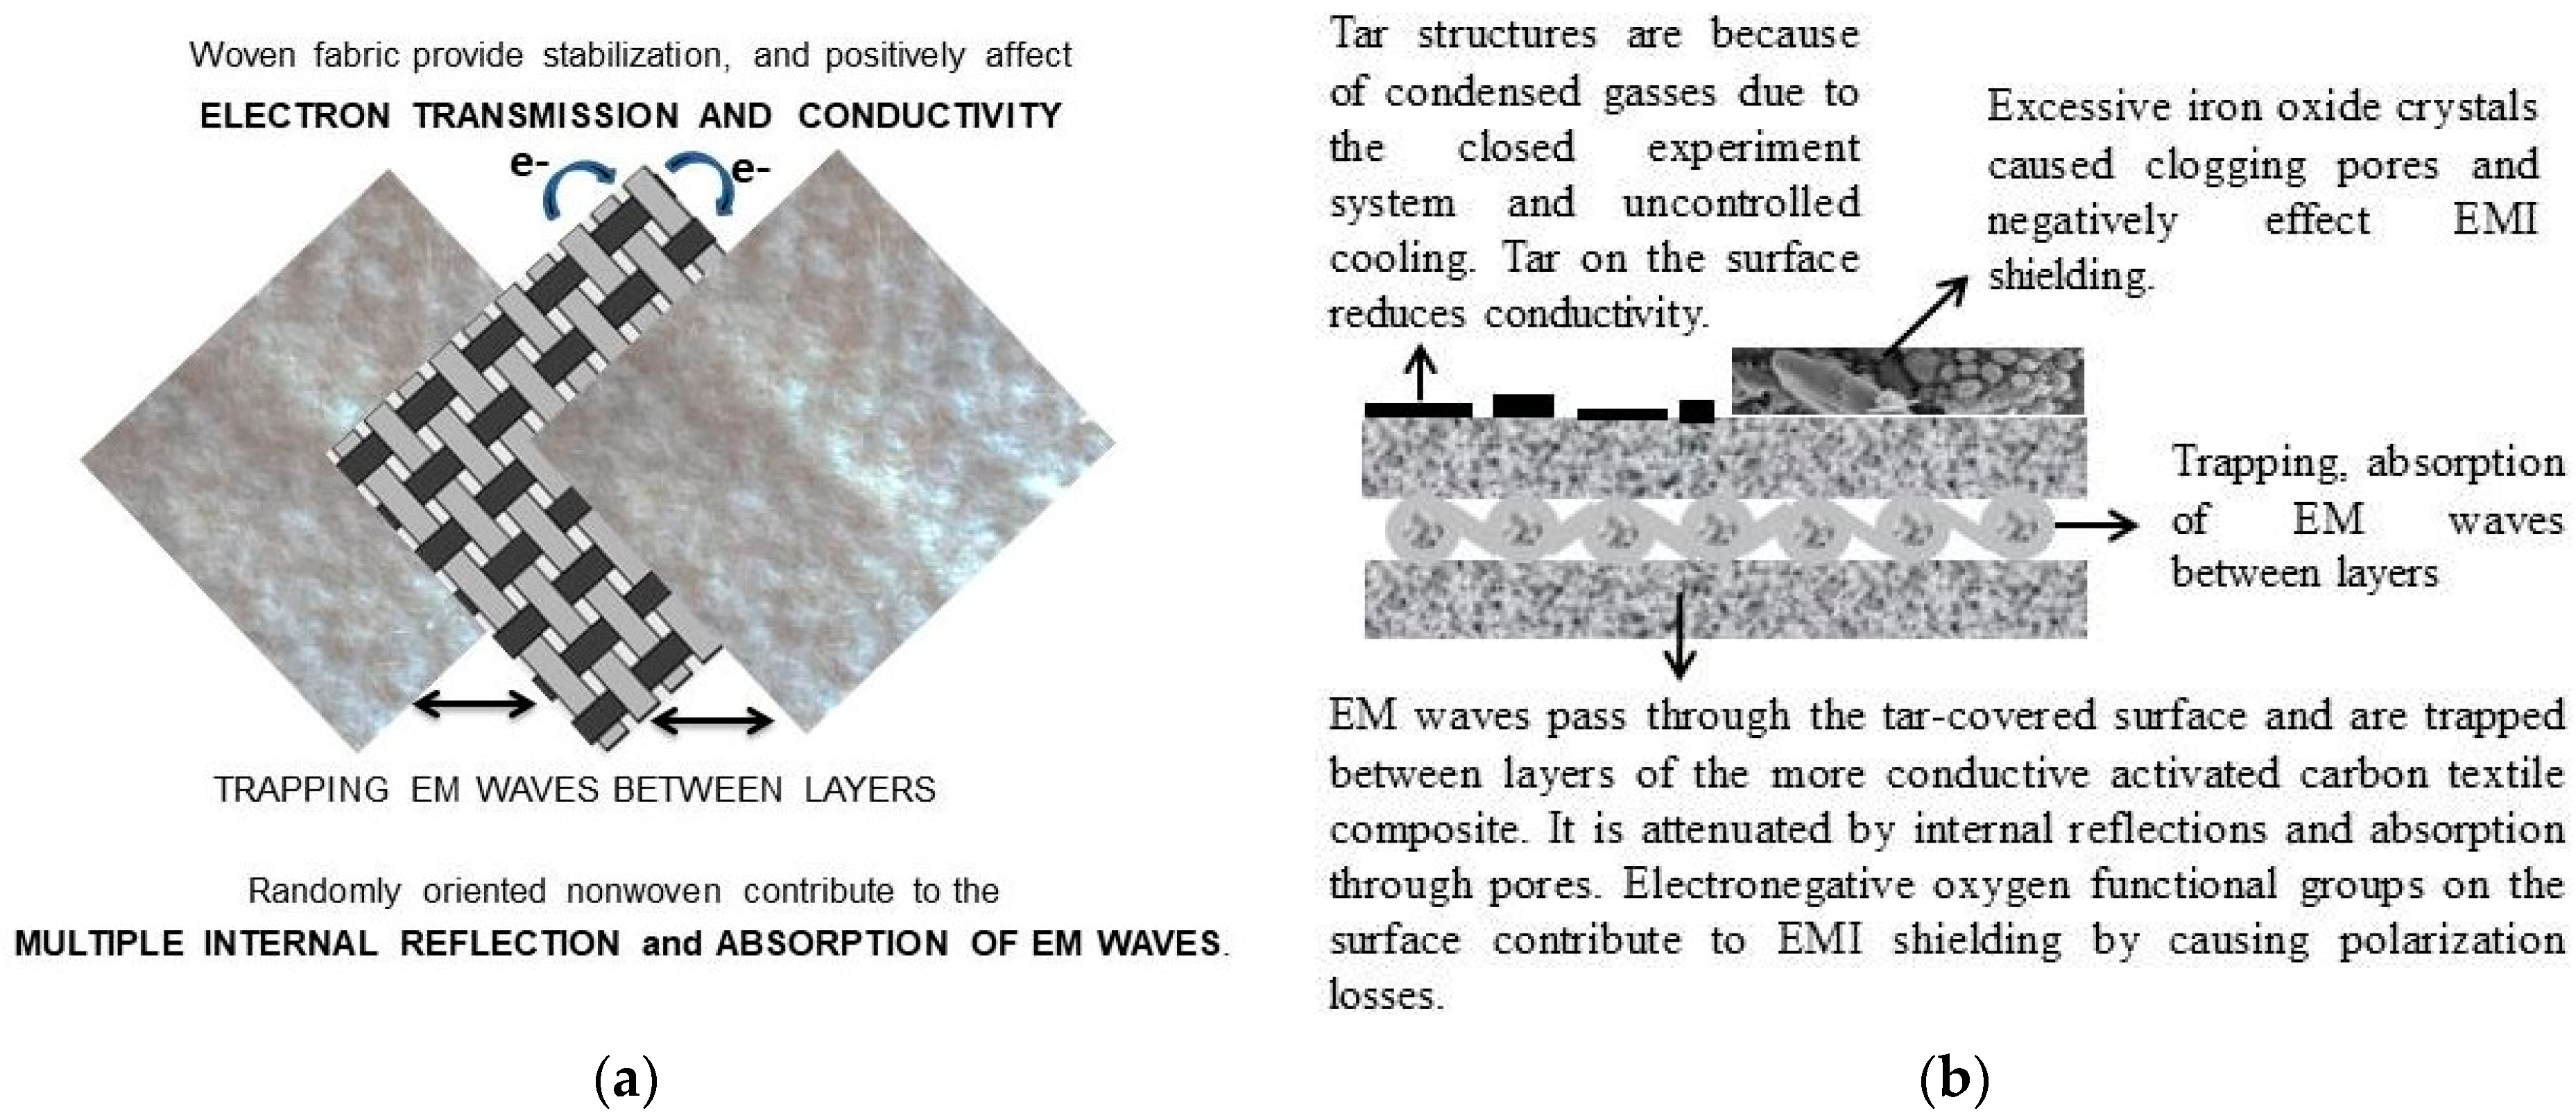
3.8. Electromagnetic Shielding Efficiency
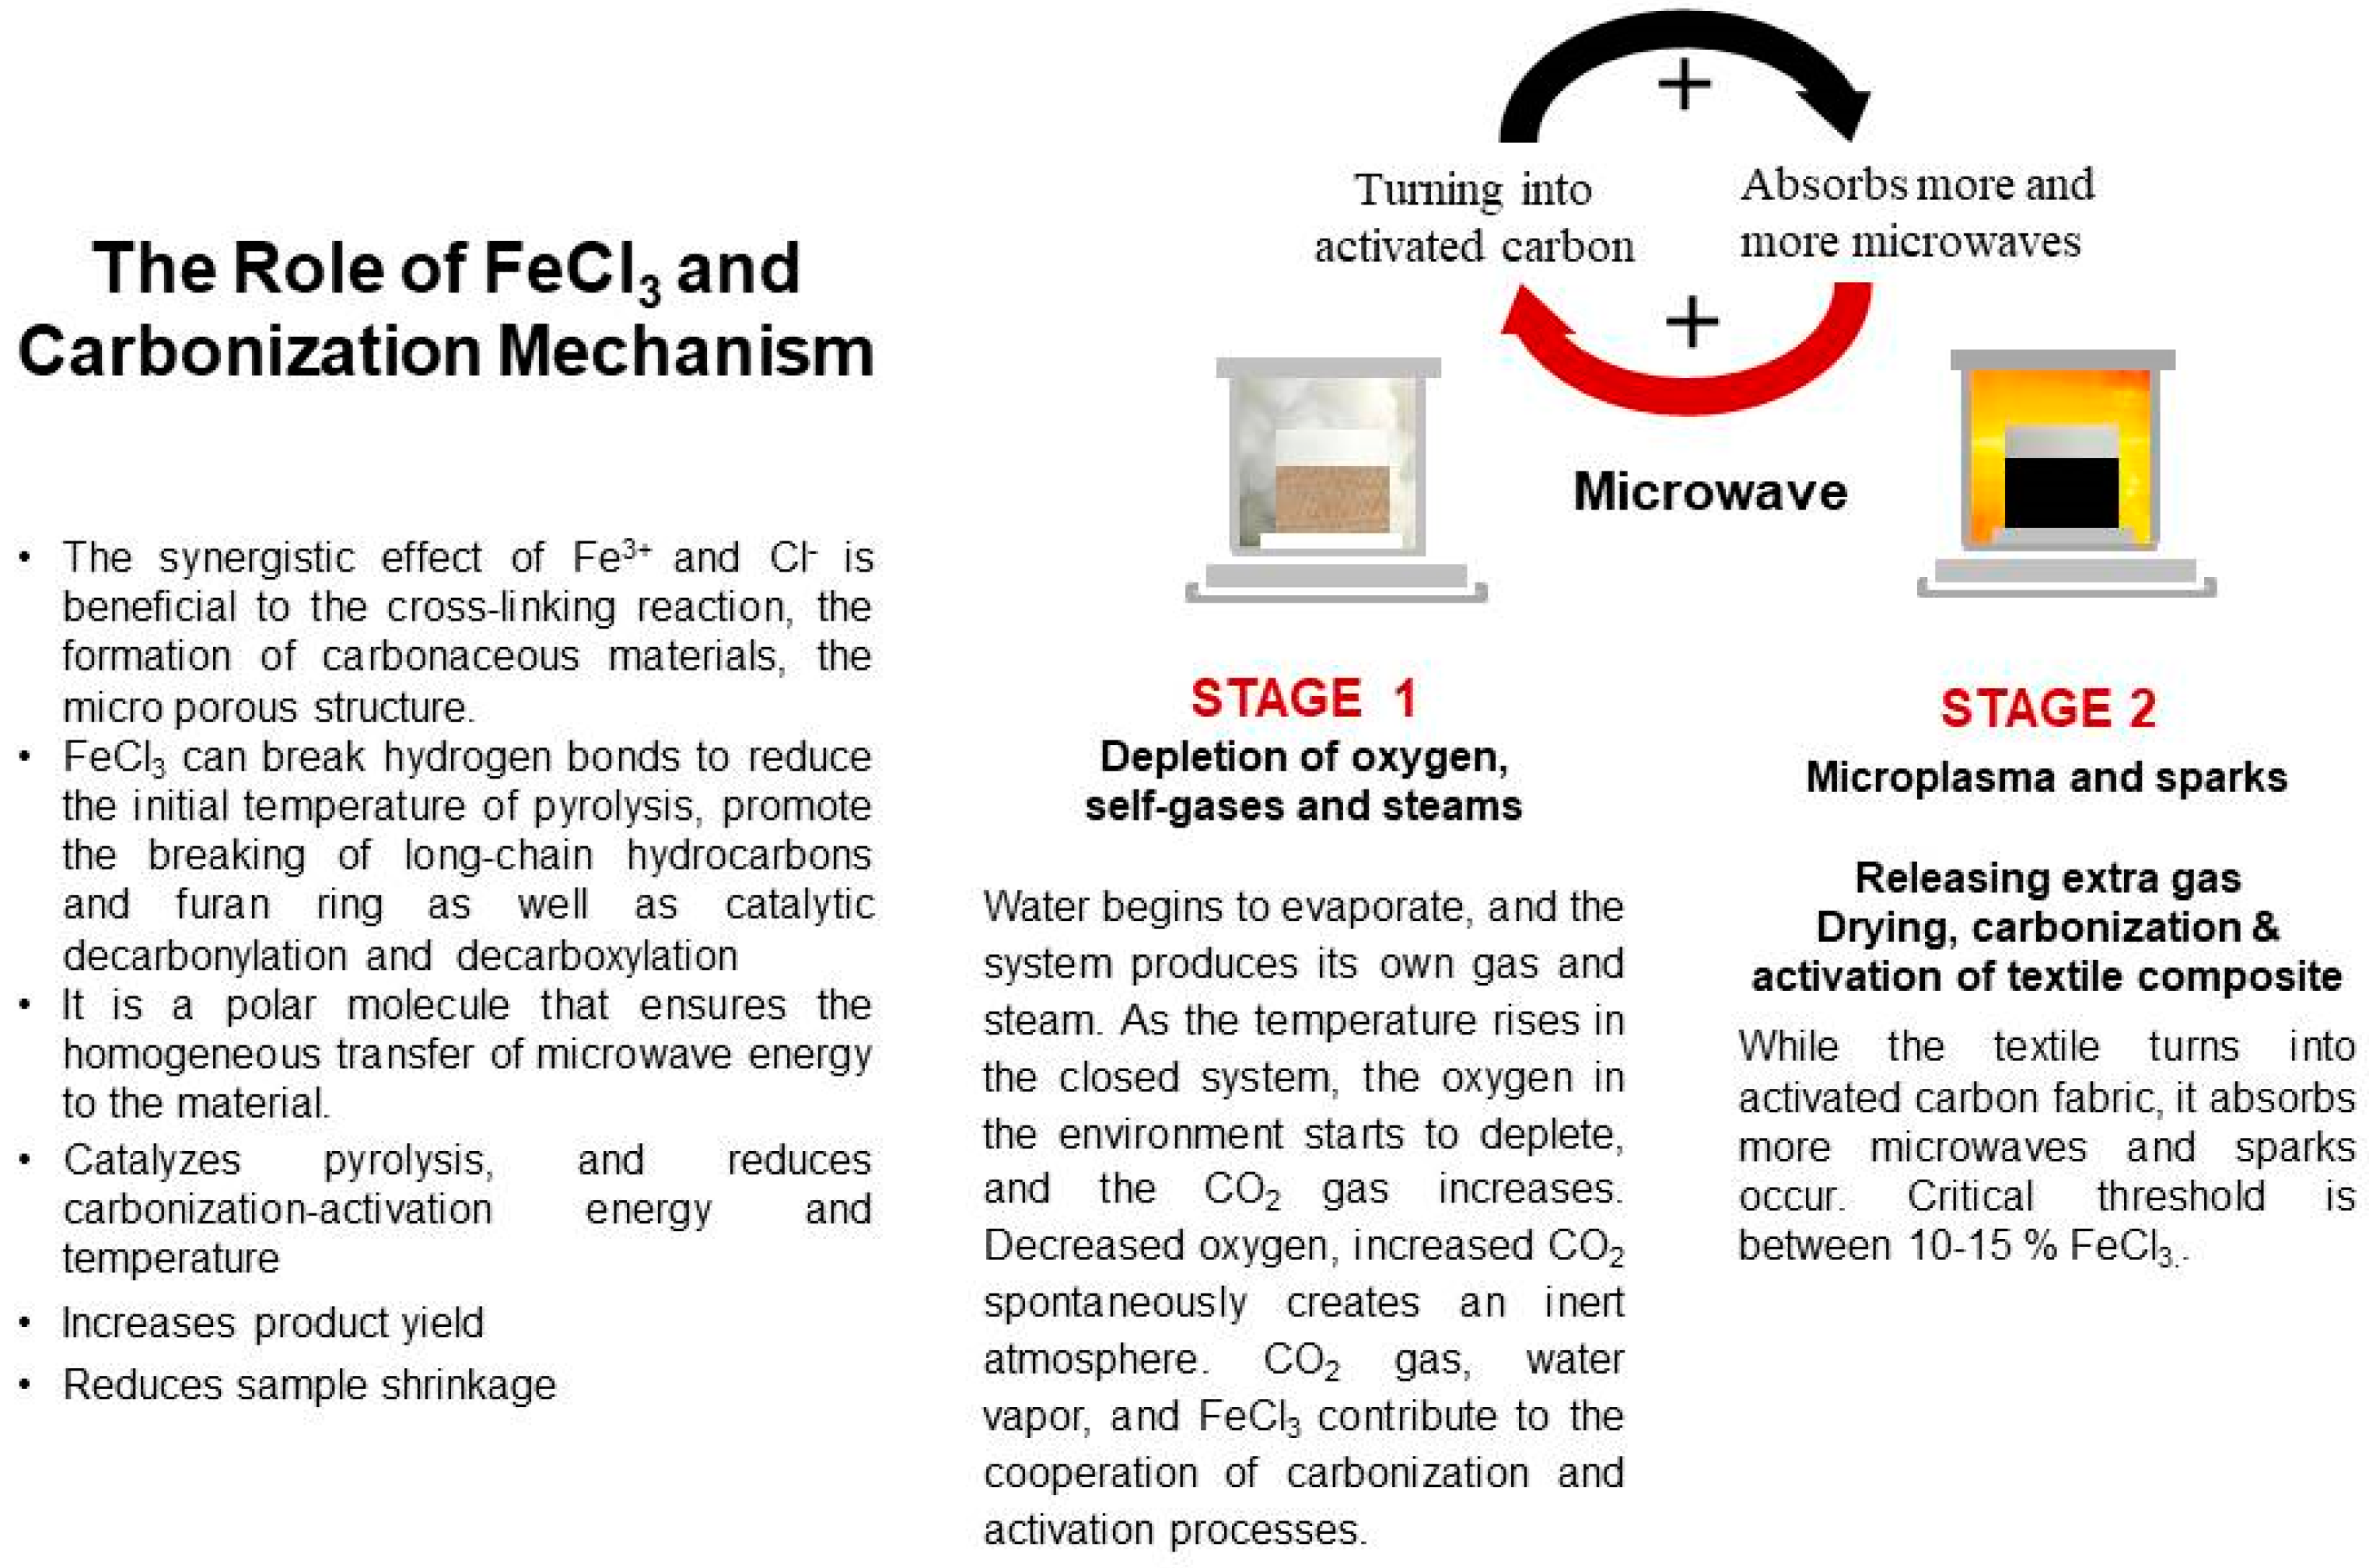
3.9. The Role of FeCl3 in the Carbonization Mechanism
3.10. Green Metrics of the Study
4. Conclusions
Supplementary Materials
Author Contributions
Funding
Institutional Review Board Statement
Data Availability Statement
Conflicts of Interest
Abbreviations
| AC | Activated carbon |
| BET | Brunauer Emmett Teller |
| EMI | Electromagnetic Interference |
| EMSE | Electromagnetic shielding efficiency |
| FWHM | Full Width Half Maximum |
| PTFE | Polytetrafluoroethylene or Teflon |
| WATER | Nonwoven was carbonized with only water |
| XPS | X-ray photoelectron spectroscopy |
| XRD | X-ray diffraction |
References
- Morari, C.; Bălan, I. Methods for Determining Shielding Effectiveness of Materials. Electroteh. Electron. Autom. 2015, 63, 126–136. [Google Scholar]
- Wanasinghe, D.; Aslani, F.; Ma, G.; Habibi, D. Review of Polymer Composites with Diverse Nanofillers for Electromagnetic Interference Shielding. Nanomaterials 2020, 10, 541. [Google Scholar] [CrossRef]
- Han, M.-G. Electromagnetic Materials and Devices-Chapter 10: Lightweight Electromagnetic Interference Shielding Materials and Their Mechanisms; Han, M.-G., Ed.; IntechOpen: London, UK, 2020; Chapter 10; ISBN 978-1-83880-102-1. [Google Scholar]
- Thomassin, J.M.; Jérôme, C.; Pardoen, T.; Bailly, C.; Huynen, I.; Detrembleur, C. Polymer/Carbon Based Composites as Electromagnetic Interference (EMI) Shielding Materials. Mater. Sci. Eng. R Rep. 2013, 74, 211–232. [Google Scholar] [CrossRef]
- Abbasi, H.; Antunes, M.; Velasco, J.I. Recent Advances in Carbon-Based Polymer Nanocomposites for Electromagnetic Interference Shielding. Prog. Mater. Sci. 2019, 103, 319–373. [Google Scholar] [CrossRef]
- Singh, A.K.; Shishkin, A.; Koppel, T.; Gupta, N. A Review of Porous Lightweight Composite Materials for Electromagnetic Interference Shielding. Compos. Part B Eng. 2018, 149, 188–197. [Google Scholar] [CrossRef]
- Gogotsi, Y. Not Just Graphene: The Wonderful World of Carbon and Related Nanomaterials. MRS Bull. 2015, 40, 1110–1120. [Google Scholar] [CrossRef]
- Gupta, S.; Tai, N.H. Carbon Materials and Their Composites for Electromagnetic Interference Shielding Effectiveness in X-Band. Carbon N. Y. 2019, 152, 159–187. [Google Scholar] [CrossRef]
- Xia, C.; Zhang, S.; Ren, H.; Shi, S.Q.; Zhang, H.; Cai, L.; Li, J. Scalable Fabrication of Natural-Fiber Reinforced Composites with Electromagnetic Interference Shielding Properties by Incorporating Powdered Activated Carbon. Materials 2016, 9, 10. [Google Scholar] [CrossRef] [PubMed]
- Chen, J.Y. Activated Carbon Fiber and Textiles; Woodhead Publishing Limited: Sawston, UK, 2016; ISBN 9780081006788. [Google Scholar]
- Sousa, É.M.L.; Otero, M.; Rocha, L.S.; Gil, M.V.; Ferreira, P.; Esteves, V.I.; Calisto, V. Multivariable Optimization of Activated Carbon Production from Microwave Pyrolysis of Brewery Wastes—Application in the Removal of Antibiotics from Water. J. Hazard. Mater. 2022, 431, 128556. [Google Scholar] [CrossRef]
- Krishnamurthy, K.; Khurana, H.K.; Jun, S.; Irudayaraj, J.; Demirci, A. Infrared Heating in Food Processing: An Overview. Compr. Rev. Food Sci. Food Saf. 2008, 7, 2–13. [Google Scholar] [CrossRef]
- Lam, S.S.; Chase, H.A. A Review on Waste to Energy Processes Using Microwave Pyrolysis. Energies 2012, 5, 4209–4232. [Google Scholar] [CrossRef]
- Tadda, M.A.; Ahsan, A.; Shitu, A.; Elsergany, M. A Review on Activated Carbon: Process, Application and Prospects. J. Adv. Civ. Eng. Pract. Res. 2016, 2, 7–13. [Google Scholar]
- Xu, Z.; Tian, D.; Sun, Z.; Zhang, D.; Zhou, Y.; Chen, W.; Deng, H. Highly Porous Activated Carbon Synthesized by Pyrolysis of Polyester Fabric Wastes with Different Iron Salts: Pore Development and Adsorption Behavior. Colloids Surf. A Physicochem. Eng. Asp. 2019, 565, 180–187. [Google Scholar] [CrossRef]
- Xu, Z.; Sun, Z.; Zhou, Y.; Chen, W.; Zhang, T.; Huang, Y.; Zhang, D. Insights into the Pyrolysis Behavior and Adsorption Properties of Activated Carbon from Waste Cotton Textiles by FeCl3-Activation. Colloids Surf. A Physicochem. Eng. Asp. 2019, 582, 123934. [Google Scholar] [CrossRef]
- Bedia, J.; Peñas-Garzón, M.; Gómez-Avilés, A.; Rodriguez, J.J.; Belver, C. Review on Activated Carbons by Chemical Activation with FeCl3. C-J. Carbon Res. 2020, 6, 21. [Google Scholar] [CrossRef]
- Mahani, A.A.; Motahari, S.; Nayyeri, V. Synthesis, Characterization and Dielectric Properties of One-Step Pyrolyzed/Activated Resorcinol-Formaldehyde Based Carbon Aerogels for Electromagnetic Interference Shielding Applications. Mater. Chem. Phys. 2018, 213, 492–501. [Google Scholar] [CrossRef]
- Xu, Z.; Zhou, Y.; Sun, Z.; Zhang, D.; Huang, Y.; Gu, S.; Chen, W. Understanding Reactions and Pore-Forming Mechanisms between Waste Cotton Woven and FeCl3 during the Synthesis of Magnetic Activated Carbon. Chemosphere 2020, 241, 125120. [Google Scholar] [CrossRef] [PubMed]
- Christian, J.; Quillope, C.; Carpio, R.B.; Gatdula, K.M.; Concepcion, M.; Detras, M.; Doliente, S.S. Optimization of Process Parameters of Self-Purging Microwave Pyrolysis of Corn Cob for Biochar Production. Heliyon 2021, 7, e08417. [Google Scholar] [CrossRef]
- Intani, K.; Latif, S.; Cao, Z.; Müller, J. Characterisation of Biochar from Maize Residues Produced in a Self-Purging Pyrolysis Reactor. Bioresour. Technol. 2018, 265, 224–235. [Google Scholar] [CrossRef]
- Intani, K.; Latif, S.; Kabir, A.K.M.R.; Müller, J. Effect of Self-Purging Pyrolysis on Yield of Biochar from Maize Cobs, Husks and Leaves. Bioresour. Technol. 2016, 218, 541–551. [Google Scholar] [CrossRef]
- Karthik, D.; Baheti, V.; Militky, J.; Naeem, M.S.; Tunakova, V.; Ali, A. Activated Carbon Derived from Carbonization of Kevlar Waste Materials: A Novel Single Stage Method. Materials 2021, 14, 6433. [Google Scholar] [CrossRef] [PubMed]
- Kong, S.H.; Lam, S.S.; Yek, P.N.Y.; Liew, R.K.; Ma, N.L.; Osman, M.S.; Wong, C.C. Self-Purging Microwave Pyrolysis: An Innovative Approach to Convert Oil Palm Shell into Carbon-Rich Biochar for Methylene Blue Adsorption. J. Chem. Technol. Biotechnol. 2019, 94, 1397–1405. [Google Scholar] [CrossRef]
- Xia, C.; Shi, S.Q. Self-Activation for Activated Carbon from Biomass: Theory and Parameters. Green Chem. 2016, 18, 2063–2071. [Google Scholar] [CrossRef]
- Yimyam, K.; Wongrueng, A.; Rakruam, P. Haloacetonitriles Adsorption Using a Low-Cost Adsorbent Derived from Canvas Fabric. Environ. Res. 2023, 234, 116539. [Google Scholar] [CrossRef] [PubMed]
- Xia, M.; Shao, X.; Sun, Z.; Xu, Z. Conversion of Cotton Textile Wastes into Porous Carbons by Chemical Activation with ZnCl2, H3PO4, and FeCl3. Environ. Sci. Pollut. Res. 2020, 27, 25186–25196. [Google Scholar] [CrossRef] [PubMed]
- Xu, Z.; Gu, S.; Sun, Z.; Zhang, D.; Zhou, Y.; Gao, Y.; Qi, R.; Chen, W. Synthesis of Char-Based Adsorbents from Cotton Textile Waste Assisted by Iron Salts at Low Pyrolysis Temperature for Cr(VI) Removal. Environ. Sci. Pollut. Res. 2020, 27, 11012–11025. [Google Scholar] [CrossRef] [PubMed]
- Xu, Z.; Zhang, T.; Yuan, Z.; Zhang, D.; Sun, Z. Fabrication of Cotton Textile Waste-Based Magnetic Activated Carbon Using FeCl3 Activation by the Box—Behnken Design: Optimization and Characteristics. RSC Adv. 2018, 8, 38081–38090. [Google Scholar] [CrossRef] [PubMed]
- Huidobro, A.; Pastor, A.C.; Rodríguez-Reinoso, F. Preparation of Activated Carbon Cloth from Viscous Rayon—Part IV. Chemical Activation. Carbon N. Y. 2001, 39, 389–398. [Google Scholar] [CrossRef]
- Naeem, S.; Baheti, V.; Militky, J.; Wiener, J.; Behera, P.; Ashraf, A. Sorption Properties of Iron Impregnated Activated Carbon Web for Removal of Methylene Blue from Aqueous Media. Fibers Polym. 2016, 17, 1245–1255. [Google Scholar] [CrossRef]
- Sert, S.; Duran Kaya, D.; Körlü, A. Development of Activated Carbon Textiles Produced from Jute and Cotton Wastes for Electromagnetic Shielding Applications. Fibers 2023, 11, 110. [Google Scholar] [CrossRef]
- Zou, L.; Lan, C.; Yang, L.; Xu, Z.; Chu, C.; Liu, Y.; Qiu, Y. The Optimization of Nanocomposite Coating with Polyaniline Coated Carbon Nanotubes on Fabrics for Exceptional Electromagnetic Interference Shielding. Diam. Relat. Mater. 2020, 104, 107757. [Google Scholar] [CrossRef]
- Ghosh, S.; Mondal, S.; Ganguly, S.; Remanan, S.; Singha, N.; Das, N.C. Carbon Nanostructures Based Mechanically Robust Conducting Cotton Fabric for Improved Electromagnetic Interference Shielding. Fibers Polym. 2018, 19, 1064–1073. [Google Scholar] [CrossRef]
- Tian, M.; Du, M.; Qu, L.; Chen, S.; Zhu, S.; Han, G. Electromagnetic Interference Shielding Cotton Fabrics with High Electrical Conductivity and Electrical Heating Behavior: Via Layer-by-Layer Self-Assembly Route. RSC Adv. 2017, 7, 42641–42652. [Google Scholar] [CrossRef]
- Im, J.S.; Kim, J.G.; Lee, S.H.; Lee, Y.S. Enhanced Adhesion and Dispersion of Carbon Nanotube in PANI/PEO Electrospun Fibers for Shielding Effectiveness of Electromagnetic Interference. Colloids Surfaces A Physicochem. Eng. Asp. 2010, 364, 151–157. [Google Scholar] [CrossRef]
- Zou, L.; Lan, C.; Li, X.; Zhang, S.; Qiu, Y.; Ma, Y. Superhydrophobization of Cotton Fabric with Multiwalled Carbon Nanotubes for Durable Electromagnetic Interference Shielding. Fibers Polym. 2015, 16, 2158–2164. [Google Scholar] [CrossRef]
- Gupta, K.K.; Abbas, S.M.; Abhyankar, A.C. Carbon Black/Polyurethane Nanocomposite-Coated Fabric for Microwave Attenuation in X & Ku-Band (8–18 GHz) Frequency Range. J. Ind. Text. 2016, 46, 510–529. [Google Scholar] [CrossRef]
- Sarkar, K.; Das, D.; Chattopadhyay, S. Smart and Economic Conductive Textile for Electromagnetic Interference Shielding. Procedia Eng. 2017, 216, 93–100. [Google Scholar] [CrossRef]
- Ghosh, S.; Ganguly, S.; Das, P.; Das, T.K.; Bose, M.; Singha, N.K.; Das, A.K.; Das, N.C. Fabrication of Reduced Graphene Oxide/Silver Nanoparticles Decorated Conductive Cotton Fabric for High Performing Electromagnetic Interference Shielding and Antibacterial Application. Fibers Polym. 2019, 20, 1161–1171. [Google Scholar] [CrossRef]
- Gamage, S.J.P.; Yang, K.; Braveenth, R.; Raagulan, K.; Kim, H.S.; Lee, Y.S.; Yang, C.M.; Moon, J.J.; Chai, K.Y. MWCNT Coated Free-Standing Carbon Fiber Fabric for Enhanced Performance in EMI Shielding with a Higher Absolute EMI SE. Materials 2017, 10, 1350. [Google Scholar] [CrossRef]
- Siavashani, V.S.; Gursoy, N.C.; Montazer, M.; Altay, P. Stretchable Electromagnetic Interference Shielding Textile Using Conductive Polymers and Metal Nanoparticles. Fibers Polym. 2022, 23, 2748–2759. [Google Scholar] [CrossRef]
- Li, J.; Li, Y.; Yang, L.; Yin, S. Ti3C2Tx/PANI/Liquid Metal Composite Microspheres with 3D Nanoflower Structure: Preparation, Characterization, and Applications in EMI Shielding. Adv. Mater. Interfaces 2022, 9, 2102266. [Google Scholar] [CrossRef]
- Nair, G.G.; Pai, A.R.; Kalarikkal, N.; Thomas, S.; Thomas, P.C. Electromagnetic Attenuation Performance of Sustainable E-Textile Derived from Polypyrrole Impregnated Jute Fabrics with Predominant Microwave Absorption. J. Nat. Fibers 2022, 19, 13348–13361. [Google Scholar] [CrossRef]
- Waseem, M.; Xie, Y.; Yu, K.; Zhou, X.; Cai, Y.; Zhang, X.; Liu, B.; Chen, J. Lightweight ZnO/Carbonated Cotton Fiber Nanocomposites for Electromagnetic Interference Applications: Preparation and Properties. Polymers 2024, 16, 116. [Google Scholar] [CrossRef]
- Cleveland, C.J. Encyclopedia of Energy; Elsevier Inc.: Amsterdam, The Netherlands, 2004; Volume 3, ISBN 978-0-12-176480-7. [Google Scholar]
- TS EN 50147-1:1996; Anechoic chambers—Part 1: Shield Attenuation Measurement. Cenelec: Brussels, Belgium, 1996.
- Chou, C.Y.; Loiland, J.A.; Lobo, R.F. Reverse Water-Gas Shift Iron Catalyst Derived from Magnetite. Catalysts 2019, 9, 773. [Google Scholar] [CrossRef]
- Rasheed, R.T.; Al-Algawi, S.D.; Kareem, H.H.; Mansoor, H.S. Preparation and Characterization of Hematite Iron Oxide (α-Fe2O3) by Sol-Gel Method. Chem. Sci. J. 2018, 9, 4. [Google Scholar] [CrossRef]
- Kim, T.H.; Jeon, E.K.; Ko, Y.; Jang, B.Y.; Kim, B.S.; Song, H.K. Enlarging the D-Spacing of Graphite and Polarizing Its Surface Charge for Driving Lithium Ions Fast. J. Mater. Chem. A 2014, 2, 7600–7605. [Google Scholar] [CrossRef]
- Chen, Y.; Zhang, Y.; Kou, Q.; Liu, Y.; Han, D.; Wang, D.; Sun, Y.; Zhang, Y.; Wang, Y.; Lu, Z.; et al. Enhanced Catalytic Reduction of 4-Nitrophenol Driven by Fe3O4-Au Magnetic Nanocomposite Interface Engineering: From Facile Preparation to Recyclable Application. Nanomaterials 2018, 8, 353. [Google Scholar] [CrossRef]
- Momose, Y.; Sakurai, T.; Nakayama, K. Thermal Analysis of Photoelectron Emission (PE) and x-Ray Photoelectron Spectroscopy (XPS) Data for Iron Surfaces Scratched in Air, Water, and Liquid Organics. Appl. Sci. 2020, 10, 2111. [Google Scholar] [CrossRef]
- Shen, M.; Zhu, X.; Zhang, S. Extraneous Fe Increased the Carbon Retention of Sludge-Based Biochar. Bull. Environ. Contam. Toxicol. 2021, 106, 198–204. [Google Scholar] [CrossRef]
- Mohamed, A.L.; El-Naggar, M.E.; Hassabo, A.G. Preparation of Hybrid Nanoparticles to Enhance the Electrical Conductivity and Performance Properties of Cotton Fabrics. J. Mater. Res. Technol. 2021, 12, 542–554. [Google Scholar] [CrossRef]
- Ferreira, D.P.; Ferreira, A.; Fangueiro, R. Searching for Natural Conductive Fibrous Structures via a Green Sustainable Approach Based on Jute Fibers and Silver Nanoparticles. Polymers 2018, 10, 63. [Google Scholar] [CrossRef] [PubMed]
- Barroso-Bogeat, A.; Alexandre-Franco, M.; Fernández-González, C.; Macías-García, A.; Gómez-Serrano, V. Electrical Conductivity of Activated Carbon-Metal Oxide Nanocomposites under Compression: A Comparison Study. Phys. Chem. Chem. Phys. 2014, 16, 25161–25175. [Google Scholar] [CrossRef] [PubMed]
- Barroso Bogeat, A. Understanding and Tuning the Electrical Conductivity of Activated Carbon: A State-of-the-Art Review. Crit. Rev. Solid State Mater. Sci. 2021, 46, 1–37. [Google Scholar] [CrossRef]
- Adinaveen, T.; Vijaya, J.J.; Kennedy, L.J. Comparative Study of Electrical Conductivity on Activated Carbons Prepared from Various Cellulose Materials. Arab. J. Sci. Eng. 2016, 41, 55–65. [Google Scholar] [CrossRef]
- Li, H.; Lu, X.; Yuan, D.; Sun, J.; Erden, F.; Wang, F.; He, C. Lightweight Flexible Carbon Nanotube/Polyaniline Films with Outstanding EMI Shielding Properties. J. Mater. Chem. C 2017, 5, 8694–8698. [Google Scholar] [CrossRef]
- Naeem, S.; Baheti, V.; Tunakova, V.; Militky, J.; Karthik, D.; Tomkova, B. Development of Porous and Electrically Conductive Activated Carbon Web for Effective EMI Shielding Applications. Carbon N. Y. 2017, 111, 439–447. [Google Scholar] [CrossRef]
- Zheng, Q.; Cao, W.Q.; Zhai, H.; Cao, M.S. Tailoring Carbon-Based Nanofiber Microstructures for Electromagnetic Absorption, Shielding, and Devices. Mater. Chem. Front. 2023, 7, 1737–1759. [Google Scholar] [CrossRef]
- Gaoui, B.; Hadjadj, A.; Kious, M. Enhancement of the Shielding Effectiveness of Multilayer Materials by Gradient Thickness in the Stacked Layers. J. Mater. Sci. Mater. Electron. 2017, 28, 11292–11299. [Google Scholar] [CrossRef]
- Jimenez-Gonzalez, C.; Ponder, C.S.; Broxterman, Q.B.; Manley, J.B. Using the Right Green Yardstick: Why Process Mass Intensity Is Used in the Pharmaceutical Industry To Drive More Sustainable Processes. Org. Process Res. Dev. 2011, 15, 912–917. [Google Scholar] [CrossRef]


| Ref. | Materials Activator | Methods | Heating and Process Time | Max. Surface Aream2/g | Vmic/Vtot % | Pore Diameter (nm) | Product Yield % Application Area Max. Performance |
|---|---|---|---|---|---|---|---|
| [26] | Canvas Fabric FeCl3·6H2O | Dry Sample 800 °C, N2 atmosphere Powder product | Tube Furnace ~1.5 h +2 h | 577.25 | 63.13 | 1.12 | No yield info. Adsorption 51–85% |
| [27] | Cotton textile wastes FeCl3·6H2O | Dry Sample 500 °C, N2 atmosphere Powder product | Tube Furnace ~45 min +1 h | 1854.70 | No info. | 3.11 | 37 Adsorption Cr(VI) 26.05 mg g−1 |
| [19] | Waste cotton woven FeCl3·6H2O | Dry Sample 800 °C, N2 atmosphere Powder product | Tube Furnace ~1.5 h +1 h | 706 | 45.3 | No info. | 9.32 Understanding Mechanism |
| [28] | Cotton textile waste FeCl3·6H2O | Dry Sample 800 °C, N2 atmosphere Powder product | Tube Furnace ~0.5 h +1 h | 78 | No info. | No info. | 43.9 Adsorption Cr(VI) 73.79 mg g−1 |
| [16] | Waste cotton textiles FeCl3·6H2O | Dry Sample 700 °C, N2 atmosphere Powder product | Tube Furnace ~1 h +1 h | No info. | No info. | No info. | No yield information Adsorption Cr(VI) 267.12 mg g−1 |
| [15] | Polyester fabric wastes FeCl3·6H2O | Dry Sample 650 °C, N2 atmosphere Powder product | Tube Furnace ~1 h +1 h | 1400 | 29.66 | 4.10 | 19.54 Adsorption Eriochrome Black T 445.51 mg g−1 |
| [29] | Cotton textile waste FeCl3·6H2O | Dry Sample 700 °C, N2 atmosphere Powder product | Tube Furnace ~3 h +1 h | 837.39 | No info. | 2.89 | 32.66 Adsorption Cr(VI) 212.77 mg g−1 |
| [30] | Viscous rayon fabric FeCl3·6H2O | Dry Fabric 825 °C, N2 atmosphere Carbon Cloth | Tube Furnace ~2.5 h +1 h | No info. | No info. | No Info. | 25 No application |
| [31] | Nonwoven web from acrylic fibrous waste FeCl3·6H2O | Dry nonwoven 1200 °C, w/o inert gas Activated carbon textile | Muffle Furnace ~9 h | 570 | No info. | No info. | No yield info. Adsorption Metilen Blue 20.61 mg g−1 |
| [32] | Cotton–jute waste H2SO4 | Wet nonwoven w/o inert gas Activated carbon textile | Microwave 1.5 h | 383.92 | 62.4 96.5 | 2.10 | 46.73 EMI Shielding 38.60 dB at 1 GHz |
| This Study | Cotton–jute waste FeCl3·6H2O | Wet nonwoven w/o inert gas Activated carbon textile | Microwave 1.5 h | 789.9 | 72.3 77.9 | 1.85 | 59.20 EMI Shielding 39.35 dB at 1 GHz |
| Ref. | Textile Substrate | Substances | Application Method | Sheet Resistance Conductivity | EMSE (dB) | Frequency |
|---|---|---|---|---|---|---|
| [33] | Cotton Woven Fabric | Polyaniline (PANI)/CNTs | Immersion | 20.1 ± 1.7 Ω/sq | 23 | 4–6 GHz |
| [34] | Cotton Woven Fabric | Carbon Black | Knife Over Roll Coating | 0.12 kohm/cm2 | 30.80 | 8.2–12.4 GHz |
| [35] | Cotton Woven Fabric | Chitosan/Graphene | Layer-by-Layer (LbL) electrostatic self-assembly (ESA) | 1.67 × 10³ S/m | 30.04 | 30 MHz 6 GHz |
| [36] | PANI/PEO fiber | Multi-Walled Carbon Nanotube | Electrospinning | 4.8 × 10³ S/m | 42 | 800 4000 MHz |
| [37] | Cotton Woven Fabric | Nafion-Multi-Walled Carbon Nanotubes | Dip Coating | 378 Ω/sq | 9 | 3.9–6 GHz |
| [38] | Cotton Woven Fabric | Carbon Black Polyurethane | Knife Over Roll | 30 × 103–149 Ω/sq | 18 | 8–18 GHz |
| [39] | Cotton Woven Fabric | Carbon Black | Knife Over Roll | No Info. | 22 | 8.2–12.4 GHz |
| [40] | Cotton Woven Fabric | rGO/Ag | Dip Coating | 6.2 × 10⁻⁶ S/cm 1.7 S/cm | 27.36 | 8.2–12.4 GHz |
| [41] | Carbon Nonwoven Fabric | Multi-Walled Carbon Nanotubes | Dip Coating | 11.02–16.42 S/cm | 37 | 2.7 GHz |
| [42] | Cotton/Lycra Knitted Fabric | PPy/PEDOT:PSS/Ag | Dip Coating and in situ polymerization | 15 Ω/sq | 40 | 8.2–12.4 GHz |
| [43] | Carbon Woven Fabric | Titanium carbide/PANI/liquid metal | Immersion | 3.9 × 10³ S/m | 52 | 8.2–12.4 GHz |
| [44] | Jute Woven Fabric | PPy | Impregnation and in situ polymerization | 1.10 S/cm | 30.2 | 8.2–12.4 GHz |
| [45] | Cotton fiber | ZnO | at 800 °C for two h carbonization | 53 S/m | 38.08 | 18–26 GHz |
| [32] | Cotton–jute waste textile structure | H2SO4 for carbonization activation | Microwave carbonization | 4.2 × 10⁻⁸ S/m 0.09 S/m | 38.60 | 1–6 GHz |
| This Study | Cotton–jute waste textile structure | FeCl3 for carbonization activation | Microwave carbonization | 6.7 × 10⁻⁴ S/m | 39.35 | 1–6 GHz |
| Activator | 2 Theta | FWHM | Lc (nm) | d (002) |
|---|---|---|---|---|
| 5% FeCl3 | 24 | 17.4 | 0.49 | 0.37 |
| 10% FeCl3 | 20.6 | 14.9 | 0.57 | 0.43 |
| 15% FeCl3 | 20.4 | 14.3 | 0.59 | 0.44 |
| BE (eV) Functional Group | 284.5 285.5 C-C C=C | 286.3 286.5 C-OH C-O | 287.7 288.8 (C=O) | 289 (O-C=O) | 290.9 291.9 π→π* | C | O | N | Fe | C:O Rate |
|---|---|---|---|---|---|---|---|---|---|---|
| RAW Textile | 32.2 | 27.3 | 8.4 | 1.9 | - | 69.7 | 29.0 | 1.3 | - | 2.4 |
| 5% FeCl3 | 81.1 | 1.8 | - | - | 6.1 | 90.5 | 7.9 | 0.9 | 0.8 | 11.4 |
| 10% FeCl3 | 62.8 | - | 6.1 | - | 0.2 | 69.1 | 23.1 | 6.46 | 1.4 | 3.0 |
| 15% FeCl3 | 54.6 | - | 13.4 | - | 2.1 | 70.1 | 23.9 | 2.6 | 3.4 | 2.9 |
| Material | ~Moisture% | Tonset (°C) | Decomposition Temperature (°C) | Tendset (°C) | Residue % |
|---|---|---|---|---|---|
| RAW Textile | 7.2 | 335.7 | 355.3 | 372.6 | 5.9 |
| 5% FeCl3 | 10.9 | 355.3 | 365.7 | 554.8 | 43.8 |
| 10% FeCl3 | 12.5 | 394.5 | 404.3 | 781 | 48.2 |
| 15% FeCl3 | 15.6 | 764.9 | 592.8 | 791.1 | 78.9 |
| Average Fibre Size (μm) | ||
|---|---|---|
| Raw Textile | Carbonized Textile with | |
| 31.2 | Water | 15% FeCl3 |
| 4.7 | 15.4 | |
| Activator | Yield (%) |
|---|---|
| Water | 14.4 |
| 5% FeCl3 | 38.8 |
| 10% FeCl3 | 43.6 |
| 15% FeCl3 | 59.2 |
| Activator | Surface Area (m2/g) | Micro Pore Area (m2/g) | Micro Pore Volume (cm3/g) | Total Pore Volume (cm3/g) | Pore Diameter (nm) |
|---|---|---|---|---|---|
| Water | 380.7 | 355.4 (93%) | 0.2 | 0.2 | 1.6 |
| 5% FeCl3 | 789.9 | 669.3 (85%) | 0.3 | 0.3 | 1.7 |
| 10% FeCl3 | 758.5 | 630 (83%) | 0.2 | 0.3 | 1.8 |
| 15% FeCl3 | 754.4 | 633.9 (84%) | 0.2 | 0.3 | 1.9 |
| Activator | Conductivity (S/m) | Sheet Resistance (Ω/sq) |
|---|---|---|
| Raw Textile | ~10−12 for Cotton 6.7 × 10⁻⁸ for jute | Refs. [54,55] |
| Water | 9.2 × 10⁻⁴ | 8.7 × 10⁵ |
| 5% FeCl3 | 3.4 × 10⁻⁴ | 2.3 × 10⁶ |
| 10% FeCl3 | 6.7 × 10⁻⁴ | 1.2 × 10⁶ |
| 15% FeCl3 | 2.54 × 10⁻⁴ | 3.15 × 10⁶ |
| FeCl3 | EMSE (dB) | Average EMSE | Maximum | Minimum | Specific EMSE | Absolute EMSE | |||||||
|---|---|---|---|---|---|---|---|---|---|---|---|---|---|
| 1 GHz | 2 GHz | 3 GHz | 4 GHz | 5 GHz | 6 GHz | dB | dB | GHz | dB | GHz | SSE | SSE/t | |
| Water | 28.4 | 14.2 | 24.3 | 25.8 | 30.5 | 35.4 | 26.4 | 35.4 | 6 | 14.2 | 2 | 186. | 759.3 |
| 2.5% | 27.6 | 9.4 | 19.8 | 17.6 | 17.1 | 14.8 | 17.7 | 27.6 | 1 | 9.4 | 2 | 124.6 | 498.2 |
| 5% | 33.9 | 12.4 | 16 | 10.2 | 20.3 | 23.5 | 19.4 | 33.9 | 1 | 10.2 | 4 | 136.5 | 545.5 |
| 7.5% | 35.2 | 9.3 | 27.5 | 22.2 | 25.9 | 29.3 | 24.9 | 35.2 | 1 | 9.3 | 2 | 175.5 | 702.1 |
| 10% | 39.4 | 16.1 | 24.5 | 23.4 | 29.9 | 33.5 | 27.8 | 39.4 | 1 | 16.1 | 2 | 195.7 | 782.9 |
| 15% | 33.9 | 12.5 | 16.8 | 10.5 | 22.9 | 23.8 | 20.1 | 33.9 | 1 | 10.6 | 4 | 141.3 | 565 |
| Activator | PMI | Specific Water mL/g | Specific Energy kWh/g | Unit Cost $/g |
|---|---|---|---|---|
| 5% FeCl3 | 41.2 | 29.4 | 0.5 | 0.2 |
| 10% FeCl3 | 36.7 | 24.8 | 0.5 | 0.2 |
| 15% FeCl3 | 27 | 17.2 | 0.3 | 0.2 |
Disclaimer/Publisher’s Note: The statements, opinions and data contained in all publications are solely those of the individual author(s) and contributor(s) and not of MDPI and/or the editor(s). MDPI and/or the editor(s) disclaim responsibility for any injury to people or property resulting from any ideas, methods, instructions or products referred to in the content. |
© 2024 by the authors. Licensee MDPI, Basel, Switzerland. This article is an open access article distributed under the terms and conditions of the Creative Commons Attribution (CC BY) license (https://creativecommons.org/licenses/by/4.0/).
Share and Cite
Sert, S.; Gultekin, Ş.S.; Gültekin, B.; Duran Kaya, D.; Körlü, A. A Facile Approach to Produce Activated Carbon from Waste Textiles via Self-Purging Microwave Pyrolysis and FeCl3 Activation for Electromagnetic Shielding Applications. Polymers 2024, 16, 915. https://doi.org/10.3390/polym16070915
Sert S, Gultekin ŞS, Gültekin B, Duran Kaya D, Körlü A. A Facile Approach to Produce Activated Carbon from Waste Textiles via Self-Purging Microwave Pyrolysis and FeCl3 Activation for Electromagnetic Shielding Applications. Polymers. 2024; 16(7):915. https://doi.org/10.3390/polym16070915
Chicago/Turabian StyleSert, Sema, Şirin Siyahjani Gultekin, Burak Gültekin, Deniz Duran Kaya, and Ayşegül Körlü. 2024. "A Facile Approach to Produce Activated Carbon from Waste Textiles via Self-Purging Microwave Pyrolysis and FeCl3 Activation for Electromagnetic Shielding Applications" Polymers 16, no. 7: 915. https://doi.org/10.3390/polym16070915