

Applying the Taguchi Method to Improve Key Parameters of Extrusion Vacuum-Forming Quality


Abstract
1. Introduction
2. Literature
3. Research Method and Analysis Experiment
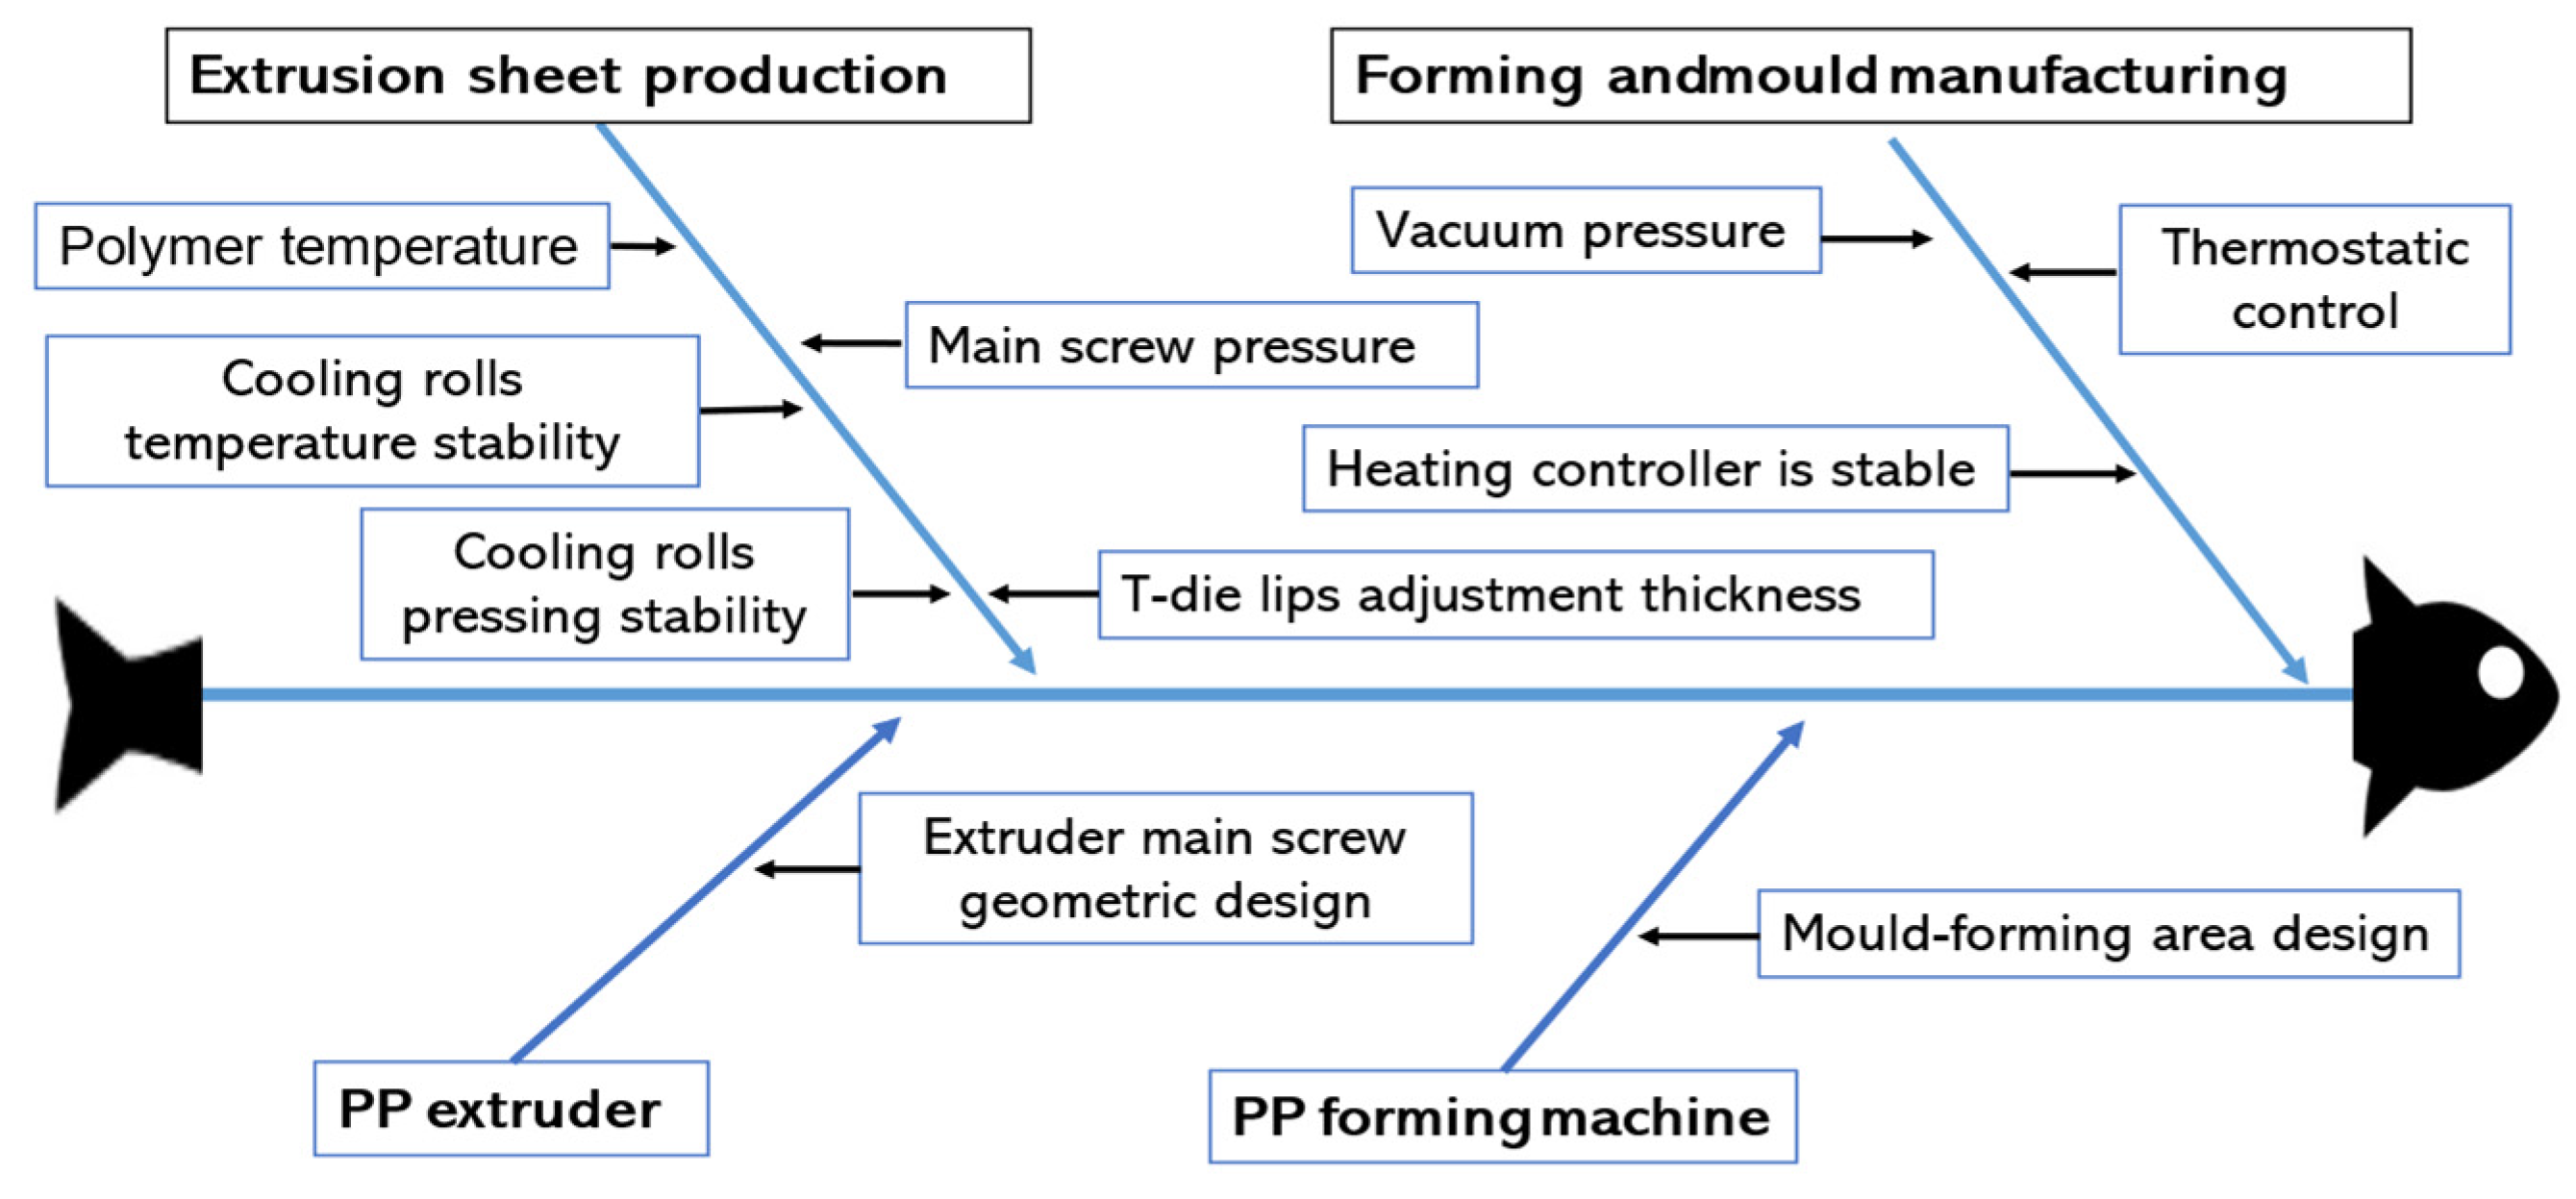
3.1. Analysis Based on Three Iterations of the Delphi Technique
3.2. Analysis of Variance (ANOVA)
3.3. Taguchi Method: Optimization of the Key Factor Parameter Experiment [22]
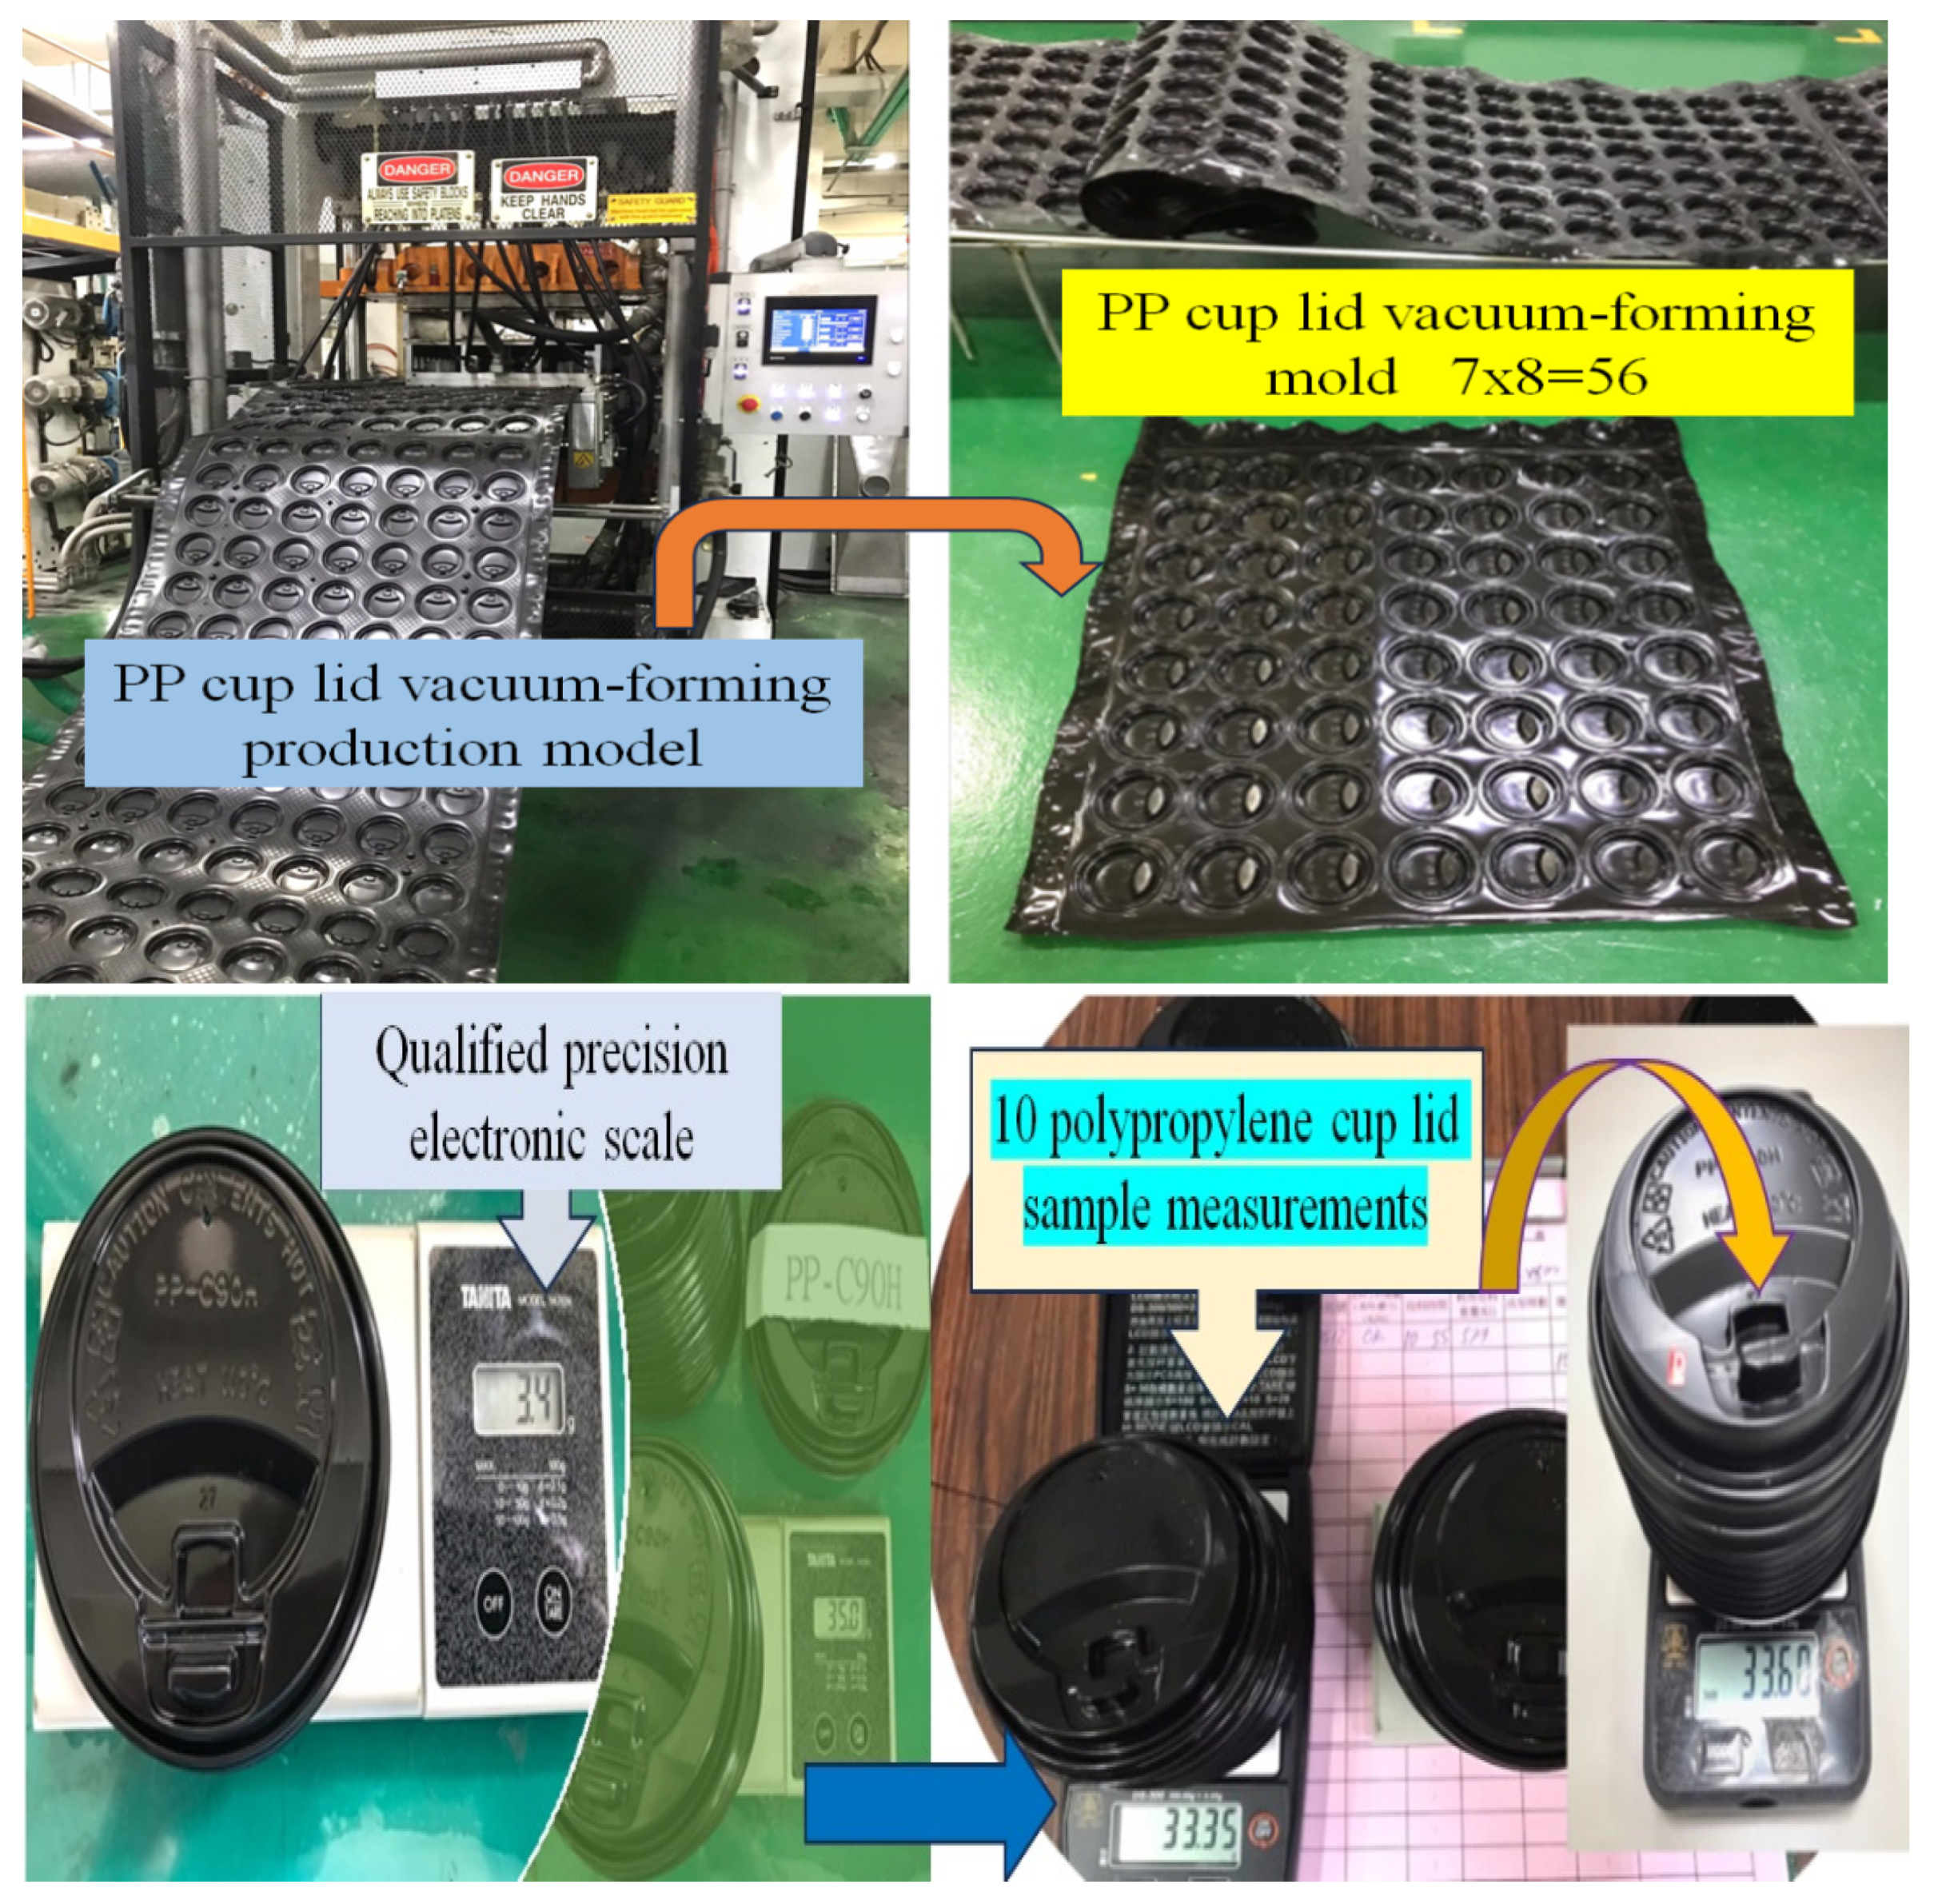
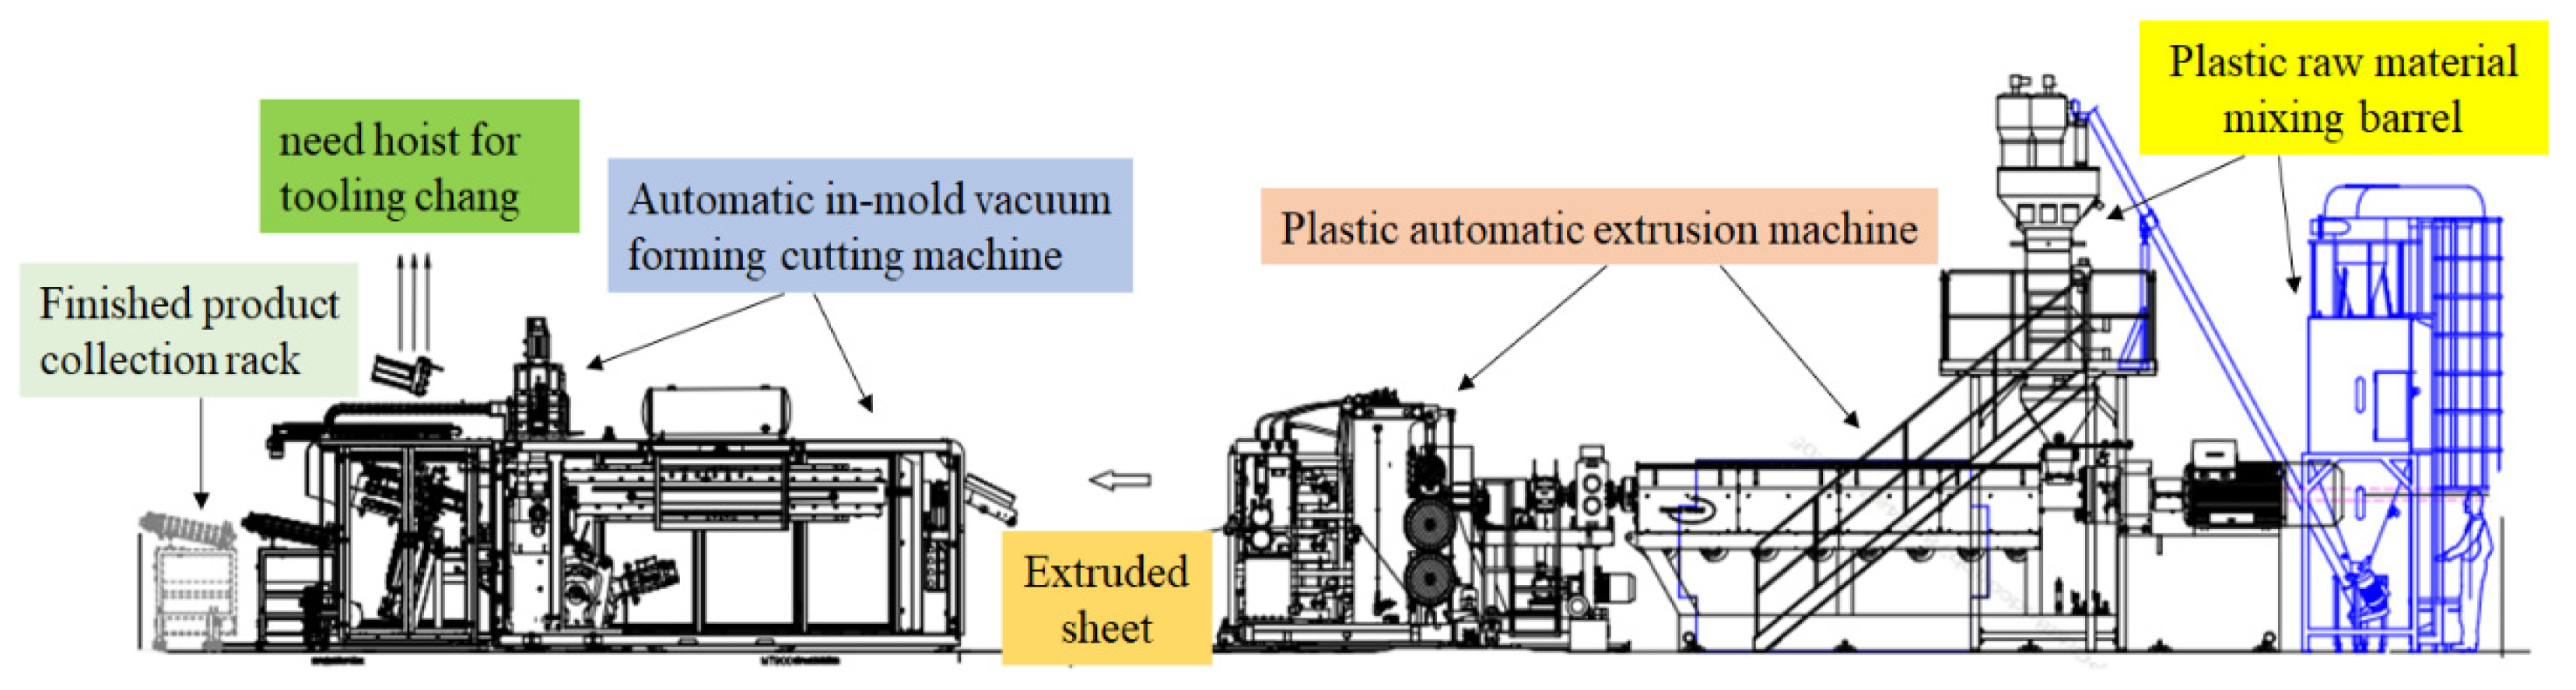
3.4. Experimental Procedure of the Study
3.5. Analysis of Variance (ANOVA)
3.6. Experimental Confirmation
- (1)
- The original process S/N ratio formula calculation is predicted.
- (2)
- The S/N ratio formula under the best combination is calculated.
- (3)
- From the original process to the optimal process, the calculation formula for the increase in S/N ratio is:
Experimental Comparison after Process Improvement [34]
4. Conclusions
Author Contributions
Funding
Institutional Review Board Statement
Data Availability Statement
Conflicts of Interest
References
- Walther, B.A.; Yen, N.; Hu, C.-S. Strategies, actions, and policies by Taiwan’s ENGOs, media, and government to reduce plastic use and marine plastic pollution. Mar. Policy 2021, 126, 104391. [Google Scholar] [CrossRef]
- Silva, A.L.P.; Prata, J.C.; Walker, T.R.; Campos, D.; Duarte, A.C.; Soares, A.M.; Barcelò, D.; Rocha-Santos, T. Rethinking and optimising plastic waste management under COVID-19 pandemic: Policy solutions based on redesign and reduction of single-use plastics and personal protective equipment. Sci. Total. Environ. 2020, 742, 140565. [Google Scholar] [CrossRef] [PubMed]
- Borrelle, S.B.; Ringma, J.; Law, K.L.; Monnahan, C.C.; Lebreton, L.; McGivern, A.; Murphy, E.; Jambeck, J.; Leonard, G.H.; Hilleary, M.A.; et al. Predicted growth in plastic waste exceeds efforts to mitigate plastic pollution. Science 2020, 369, 1515–1518. [Google Scholar] [CrossRef] [PubMed]
- Clayton, C.A.B. Building Collective Ownership of Single-Use Plastic Waste in Youth Communities: A Jamaican Case Study. Soc. Sci. 2021, 10, 412. [Google Scholar] [CrossRef]
- Dybka-Stępień, K.; Antolak, H.; Kmiotek, M.; Piechota, D.; Koziróg, A. Disposable food packaging and serving materials—Trends and biodegradability. Polymers 2021, 13, 3606. [Google Scholar] [CrossRef] [PubMed]
- Jang, Y.; Kim, K.N.; Woo, J. Post-consumer plastic packaging waste from online food delivery services in South Korea. Waste Manag. 2023, 156, 177–186. [Google Scholar] [CrossRef] [PubMed]
- Clive, M.; Theresa, C. Polypropylene: The Definitive User’s Guide and Databook; William Andrew: Norwich, NY, USA, 1998; Available online: https://www.sciencedirect.com/book/9781884207587/polypropylene (accessed on 10 December 2023).
- Somaye, A. Polypropylene in the Industry of Food Packaging. 2012. Available online: https://www.intechopen.com/chapters/37229 (accessed on 21 December 2023).
- Albert, K.A.; Cruz, C.A.; Palm, J.P.; Johnson, R.W. Polypropylene resins for sheeting and thermoforming. J. Plast. Film Sheeting 1985, 1, 250–257. [Google Scholar] [CrossRef]
- Alotaibi, M.; Aldhafeeri, T.; Barry, C. The Impact of Reprocessing with a Quad Screw Extruder on the Degradation of Polypropylene. Polymers 2022, 14, 2661. [Google Scholar] [CrossRef] [PubMed]
- Daronde, S.; Kuthe, A.; Keerti, S.; Khatirkar, R.; Bagde, A.; Kamble, M.; Dahake, S. The Effect of Vacuum on the Mechanical Properties of Sand Cast AA6061 Alloy. J. Mater. Eng. Perform. 2022, 31, 262–271. [Google Scholar] [CrossRef]
- Kan, M.; Ipek, O.; Koru, M. An investigation into the effect of vacuum conditions on the filling analysis of the pressure casting process. Int. J. Met. 2023, 17, 430–446. [Google Scholar] [CrossRef]
- SUNWELL. 2024. Available online: https://www.sunwellglobal.com.tw/ (accessed on 5 January 2024).
- FCFC. 2024. Available online: https://www.fcfc-plastics.com/pp-resin.htm/ (accessed on 5 January 2024).
- Hos Win Enterprise Co., Ltd. 2024. Available online: https://www.laiwell.com/ (accessed on 5 January 2024).
- Chen, D.-C.; Chen, D.-F.; Huang, S.-M.; Huang, M.-J.; Shyr, W.-J.; Chiou, C.-F. Critical Success Factors to Improve the Business Performance of Tea Drink Chains. Sustainability 2021, 13, 8953. [Google Scholar] [CrossRef]
- Jou, Y.-T.; Silitonga, R.M.; Lin, M.-C.; Sukwadi, R.; Rivaldo, J. Application of Six Sigma Methodology in an Automotive Manufacturing Company: A Case Study. Sustainability 2022, 14, 14497. [Google Scholar] [CrossRef]
- Abdulai, M.N.; Prah, J.; Walker, E.; Afrifa, A.D. A fishbone analysis of the use of electronic health records (EHR) in a primary healthcare setting: The case of university of cape coast hospital. Int. J. Appl. Inf. Syst. (IJAIS) 2020, 12, 27–31. [Google Scholar] [CrossRef]
- Chen, D.-C.; Chen, D.-F.; Huang, S.-M.; Shyr, W.-J. The Investigation of Key Factors in Polypropylene Extrusion Molding Production Quality. Appl. Sci. 2022, 12, 5122. [Google Scholar] [CrossRef]
- Lakens, D.; Caldwell, A.R. Simulation-based power analysis for factorial analysis of variance designs. Adv. Methods Prac. Psychol. Sci. 2021, 4, 2515245920951503. Available online: https://api.semanticscholar.org/CorpusID:232484302 (accessed on 10 December 2023). [CrossRef]
- Mustapha, A.N.; Zhang, Y.; Zhang, Z.; Ding, Y.; Yuan, Q.; Li, Y. Taguchi and ANOVA analysis for the optimization of the microencapsulation of a volatile phase change material. J. Mater. Res. Technol. 2021, 11, 667–680. [Google Scholar] [CrossRef]
- Fahmi, N.K.A.; Bintara, R.D. Optimization Injection Molding Parameters of Polypropylene Materials to Minimize Flash Defects Using the Taguchi Method. Proceeding Int. Conf. Relig. Sci. Educ. 2022, 1, 619–625. Available online: https://sunankalijaga.org/prosiding/index.php/icrse/article/view/845 (accessed on 18 December 2023).
- Hiwa, B.; Ahmed, Y.M.; Rostam, S. Evaluation of tensile properties of Meriz fiber reinforced epoxy composites using Taguchi method. Results Eng. 2023, 18, 101037. [Google Scholar] [CrossRef]
- Alim, A.A.; Roslan, R.; Nadzirah, S.; Saidi, L.K.; Menon, P.S.; Aziah, I.; Fu, D.C.; Sulaiman, S.A.; Murad, N.A.A.; Hamzah, A.A. Geometrical Characterisation of TiO2-rGO Field-Effect Transistor as a Platform for Biosensing Applications. Micromachines 2023, 14, 1664. [Google Scholar] [CrossRef]
- Patel, N.; Parihar, P.L.; Makwana, J.S. Empirical study for Nusselt number optimization for the flow using ANOVA and Taguchi method. Case Stud. Therm. Eng. 2023, 50, 103505. [Google Scholar] [CrossRef]
- Lin, K.-W.; Chang, Y.-C. Use of the Taguchi Method to Optimize an Immunodetection System for Quantitative Analysis of a Rapid Test. Diagnostics 2021, 11, 1179. [Google Scholar] [CrossRef] [PubMed]
- Chen, W.-H.; Uribe, M.C.; Kwon, E.E.; Lin, K.-Y.A.; Park, Y.-K.; Ding, L.; Saw, L.H. A comprehensive review of thermoelectric generation optimization by statistical approach: Taguchi method, analysis of variance (ANOVA), and response surface methodology (RSM). Renew. Sustain. Energy Rev. 2022, 169, 112917. [Google Scholar] [CrossRef]
- Abt, G.; Boreham, C.; Davison, G.; Jackson, R.; Nevill, A.; Wallace, E.; Williams, M. Power, precision, and sample size estimation in sport and exercise science research. J. Sports Sci. 2020, 38, 1933–1935. [Google Scholar] [CrossRef] [PubMed]
- Mohsin, I.; He, K.; Li, Z.; Zhang, F.; Du, R. Optimization of the Polishing Efficiency and Torque by Using Taguchi Method and ANOVA in Robotic Polishing. Appl. Sci. 2020, 10, 824. [Google Scholar] [CrossRef]
- Fei, N.C.; Mehat, N.M.; Kamaruddin, S. Practical application of TAGUCHI optimization methodology to medical facilities: An integrated study. J. Mech. Med. Biol. 2022, 22, 2240025. [Google Scholar] [CrossRef]
- Neag, E.; Stupar, Z.; Varaticeanu, C.; Senila, M.; Roman, C. Optimization of Lipid Extraction from Spirulina spp. by Ultrasound Application and Mechanical Stirring Using the Taguchi Method of Experimental Design. Molecules 2022, 27, 6794. [Google Scholar] [CrossRef] [PubMed]
- Oemar, B.; Chang, W.-C. Taguchi method for optimizing process parameters in the production of activated carbon from rubber seed shell. Int. J. Adv. Manuf. Technol. 2020, 107, 4609–4620. [Google Scholar] [CrossRef]
- Maguluri, N.; Suresh, G.; Rao, K.V. Assessing the effect of FDM processing parameters on mechanical properties of PLA parts using Taguchi method. J. Thermoplast. Compos. Mater. 2023, 36, 1472–1488. [Google Scholar] [CrossRef]
- Minh, P.S.; Dang, H.-S.; Ha, N.C. Optimization of 3D Cooling Channels in Plastic Injection Molds by Taguchi-Integrated Principal Component Analysis (PCA). Polymers 2023, 15, 1080. [Google Scholar] [CrossRef]
- Patnaik, P.K.; Mishra, S.K.; Swain, P.T.R.; Purohit, A.; Parija, S.K.; Panda, S.S. Multi-Objective optimization and experimental analysis of Electro-Discharge Machining parameters via Gray-Taguchi, TOPSIS-Taguchi and PSI-Taguchi methods. Mater. Today Proc. 2022, 62, 6189–6198. [Google Scholar] [CrossRef]
- Chalermthai, B.; Ashraf, M.T.; Bastidas-Oyanedel, J.-R.; Olsen, B.D.; Schmidt, J.E.; Taher, H. Techno-Economic Assessment of Whey Protein-Based Plastic Production from a Co-Polymerization Process. Polymers 2020, 12, 847. [Google Scholar] [CrossRef] [PubMed]
- Huang, W.-T.; Tasi, Z.-Y.; Ho, W.-H.; Chou, J.-H. Integrating Taguchi Method and Gray Relational Analysis for Auto Locks by Using Multiobjective Design in Computer-Aided Engineering. Polymers 2022, 14, 644. [Google Scholar] [CrossRef] [PubMed]
- Pazhamannil, R.V.; Hadidi, H.M.; Edacherian, A.; Puthumana, G. Prediction of the mechanical properties of heat-treated fused filament fabrication thermoplastics using adaptive neuro-fuzzy inference system. J. Thermoplast. Compos. Mater. 2023, 37, 1385–1406. [Google Scholar] [CrossRef]


| Selection of Reference Values for Raw Material Properties | |||
|---|---|---|---|
| Typical Property | Test Method | Unit | Reference Value Range |
| Melt flow rate (230 °C, 2.16 kg) | ASTM D1238 | g/10 min | 1.6 ± 0.2 |
| Density | ASTM D792 | g/cm3 | 0.901 ± 0.001 |
| Tensile strength at yield | ASTM D638 | kg/cm2 | 370 ± 10 |
| Flexural modulus | ASTM D790 | kg/cm2 | 15,500 ± 1000 |
| Rockwell hardness | ASTM D785 | R scale | 100 ± 5 |
| 23 °C Izod impact strength, notched 23 °C | ASTM D256 | kg-cm/cm | 5.0 ± 0.5 |
| Deflection temperature (4.6 kg/cm2) | ASTM D648 | °C | 105 ± 2 |
| Mold shrinkage | ASTM D955 | % | 1.5 ± 0.1 |
| No. | Item | M | Mo | SD | K–S Z-Test |
|---|---|---|---|---|---|
| 1 | PP extruder main screw output pressure control | 4.54 | 5 | 0.499 | 1.941 ** |
| 2 | PP extruder polymer temperature control | 4.46 | 4 | 0.499 | 1.941 ** |
| 3 | T-die lips adjustment depends on sheet thickness | 4.38 | 4 | 0.487 | 2.219 ** |
| 4 | Cooling rolls pressing stability | 4.38 | 4 | 0.487 | 2.219 ** |
| 5 | Cooling rolls temperature stability | 4.31 | 4 | 0.462 | 2.496 ** |
| 6 | Extruder main screw geometric design | 4.23 | 4 | 0.421 | 2.774 ** |
| 7 | Forming heating controller element stability | 4.46 | 4 | 0.499 | 1.941 ** |
| 8 | The deviation of forming heating constant temperature control area | 4.23 | 4 | 0.421 | 2.774 ** |
| 9 | Near to scenic sport or night markets | 4.46 | 4 | 0.499 | 1.941 ** |
| 10 | The maximum clamping force of thermoformer and mould forming area design | 4.23 | 4 | 0.421 | 2.774 ** |
| 1. Degrees of freedom | n: level number |
| 2. Variation | |
| 3. CF | |
| 4. Total sum of squares | |
| 5. Error variation | |
| 6. F significance test |
| Factor | Control Factor Description | Unit | Level 1 | Level 2 | Level 3 |
|---|---|---|---|---|---|
| A | Polypropylene new material ratio | % | 50 | 60 | |
| B | Extrusion screw pressure speed | rpm | 480 | 485 | 490 |
| C | Polymer temperature | °C | 210 | 220 | 230 |
| D | T-die lips adjustment thickness | mm | 0.53 | 0.56 | 0.59 |
| E | Mirror wheel temperature stability | °C | 25 | 30 | 35 |
| F | Molding heating thermostatic control | °C | 235 | 240 | 245 |
| G | Molding vacuum pressure time | seconds | 4.0 | 4.2 | 4.4 |
| H | Forming mold area design | % | 60 | 75 | 90 |
| Exp. | A | B | C | D | E | F | G | H | P1 | P2 | P3 | P4 | P5 | P6 | P7 |
|---|---|---|---|---|---|---|---|---|---|---|---|---|---|---|---|
| % | rpm | °C | mm | °C | °C | sec | % | ||||||||
| 1 | 50 | 480 | 210 | 0.51 | 25 | 235 | 4 | 60 | 3.50 | 3.40 | 3.35 | 3.30 | 3.30 | 3.30 | 3.25 |
| 2 | 50 | 480 | 220 | 0.53 | 30 | 240 | 4.2 | 75 | 3.50 | 3.60 | 3.45 | 3.45 | 3.40 | 3.40 | 3.45 |
| 3 | 50 | 480 | 230 | 0.55 | 40 | 245 | 4.4 | 90 | 3.50 | 3.30 | 3.60 | 3.35 | 3.45 | 3.35 | 3.40 |
| 4 | 50 | 485 | 210 | 0.51 | 30 | 240 | 4.4 | 90 | 3.50 | 3.40 | 3.30 | 3.65 | 3.45 | 3.40 | 3.40 |
| 5 | 50 | 485 | 220 | 0.53 | 40 | 245 | 4 | 60 | 3.50 | 3.45 | 3.40 | 3.35 | 3.50 | 3.40 | 3.45 |
| 6 | 50 | 485 | 230 | 0.55 | 25 | 235 | 4.2 | 75 | 3.50 | 3.30 | 3.30 | 3.20 | 3.25 | 3.50 | 3.40 |
| 7 | 50 | 490 | 210 | 0.53 | 25 | 245 | 4.2 | 90 | 3.50 | 3.30 | 3.25 | 3.30 | 3.30 | 3.30 | 3.60 |
| 8 | 50 | 490 | 220 | 0.55 | 30 | 235 | 4.4 | 60 | 3.50 | 3.50 | 3.50 | 3.50 | 3.50 | 3.40 | 3.35 |
| 9 | 50 | 490 | 230 | 0.51 | 40 | 240 | 4 | 75 | 3.50 | 3.40 | 3.30 | 3.30 | 3.35 | 3.35 | 3.30 |
| 10 | 60 | 480 | 210 | 0.55 | 40 | 240 | 4.2 | 60 | 3.50 | 3.30 | 3.30 | 3.35 | 3.45 | 3.40 | 3.30 |
| 11 | 60 | 480 | 220 | 0.51 | 25 | 245 | 4.4 | 75 | 3.30 | 3.30 | 3.40 | 3.30 | 3.35 | 3.35 | 3.30 |
| 12 | 60 | 480 | 230 | 0.53 | 30 | 235 | 4 | 90 | 3.35 | 3.40 | 3.30 | 3.45 | 3.35 | 3.40 | 3.30 |
| 13 | 60 | 485 | 210 | 0.53 | 40 | 235 | 4.4 | 75 | 3.30 | 3.25 | 3.35 | 3.40 | 3.30 | 3.30 | 3.35 |
| 14 | 60 | 485 | 220 | 0.55 | 25 | 240 | 4 | 90 | 3.30 | 3.35 | 3.40 | 3.35 | 3.30 | 3.25 | 3.35 |
| 15 | 60 | 485 | 230 | 0.51 | 30 | 245 | 4.2 | 60 | 3.30 | 3.40 | 3.30 | 3.25 | 3.30 | 3.30 | 3.30 |
| 16 | 60 | 490 | 210 | 0.55 | 30 | 245 | 4 | 75 | 3.35 | 3.35 | 3.25 | 3.35 | 3.30 | 3.30 | 3.30 |
| 17 | 60 | 490 | 220 | 0.51 | 40 | 235 | 4.2 | 90 | 3.45 | 3.40 | 3.25 | 3.30 | 3.40 | 3.40 | 3.35 |
| 18 | 60 | 490 | 230 | 0.53 | 25 | 240 | 4.4 | 60 | 3.35 | 3.30 | 3.25 | 3.30 | 3.35 | 3.45 | 3.50 |
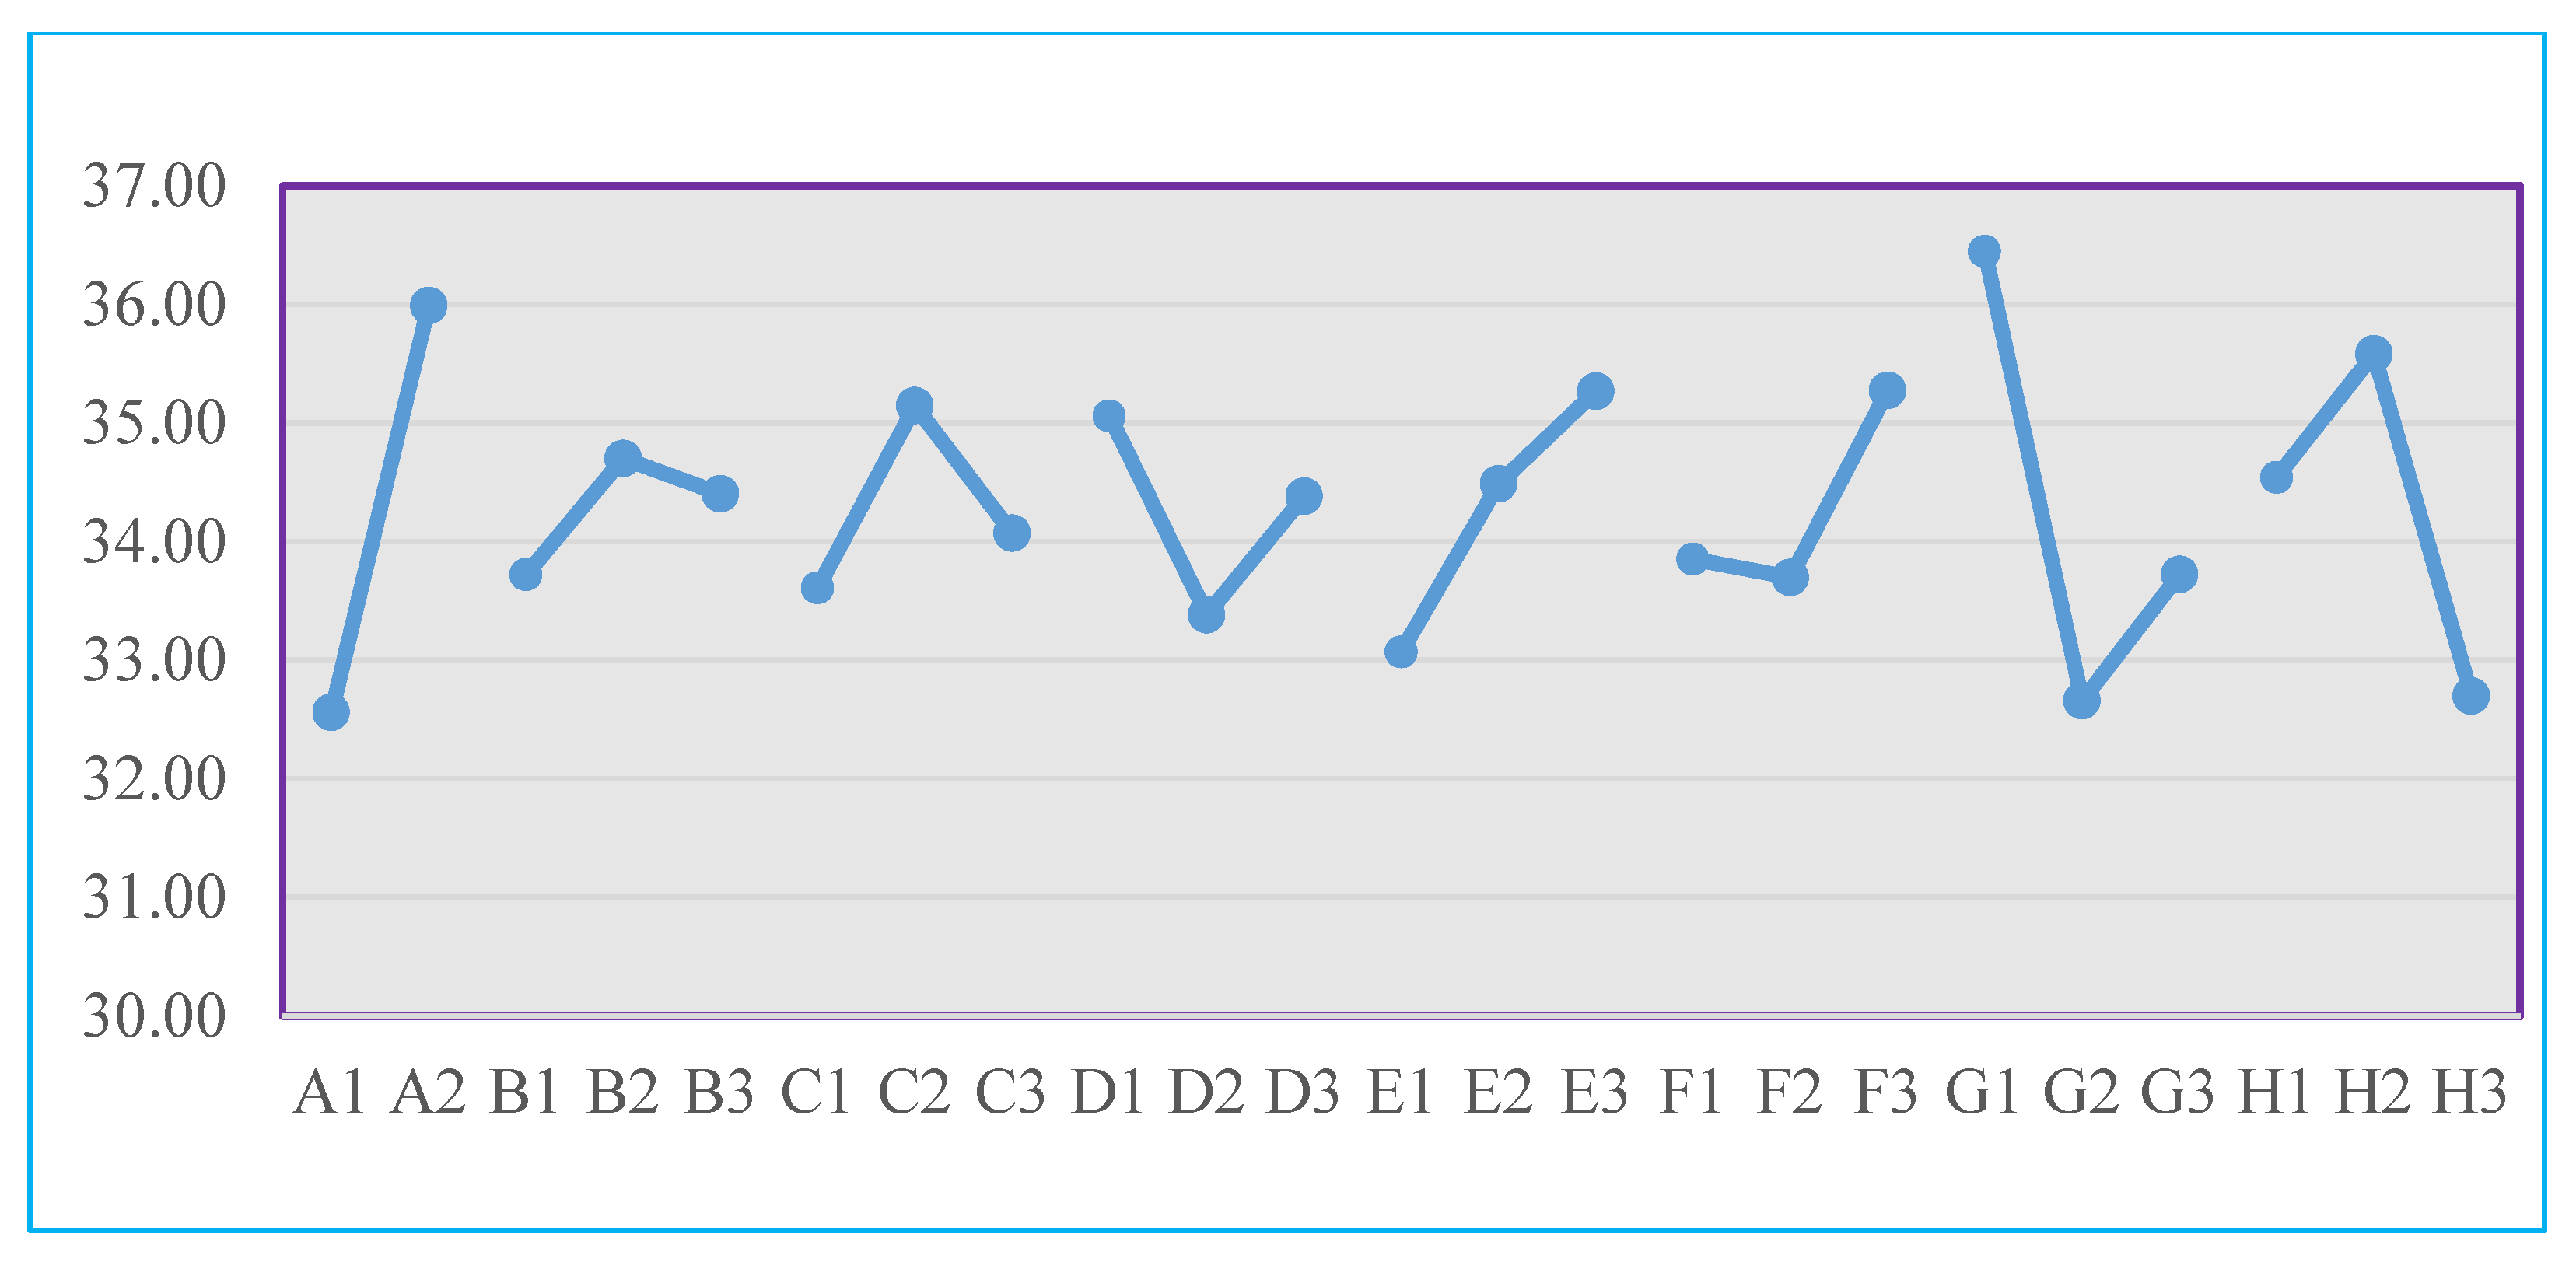
| A | B | C | D | E | F | G | H | |
|---|---|---|---|---|---|---|---|---|
| Level 1 | 32.6 | 33.7 | 33.6 | 35.1 | 33.1 | 33.9 | 36.4 | 34.5 |
| Level 2 | 36.0 | 34.7 | 35.1 | 33.4 | 34.5 | 33.7 | 32.7 | 35.6 |
| Level 3 | 34.4 | 34.1 | 34.4 | 35.3 | 35.3 | 33.7 | 32.7 | |
| E¹→² | 3.4 | 1.0 | 1.5 | −1.7 | 1.4 | −0.2 | −3.8 | 1.0 |
| E²→³ | −0.3 | −1.1 | 1.0 | 0.8 | 1.6 | 1.1 | −2.9 | |
| Range | 3.4 | 1.0 | 1.5 | 1.7 | 2.2 | 1.6 | 3.8 | 2.9 |
| Rank | 2 | 8 | 7 | 5 | 4 | 6 | 1 | 3 |
| Significant? | YES | NO | NO | YES | YES | NO | YES | YES |
| Factor | Control Factor Description | Unit | Level 1 | Level 2 | Level 3 |
|---|---|---|---|---|---|
| A | Polypropylene new material ratio | % | 50 | 60 | |
| B | Extrusion screw pressure speed | rpm | 480 | 485 | 490 |
| C | Polymer temperature | °C | 210 | 220 | 230 |
| D | T-die lips adjustment thickness | mm | 0.53 | 0.56 | 0.59 |
| E | Mirror wheel temperature stability | °C | 25 | 30 | 35 |
| F | Molding heating thermostatic control | °C | 235 | 240 | 245 |
| G | Molding vacuum pressure time | seconds | 4.0 | 4.2 | 4.4 |
| H | Forming mold area design | % | 60 | 75 | 90 |
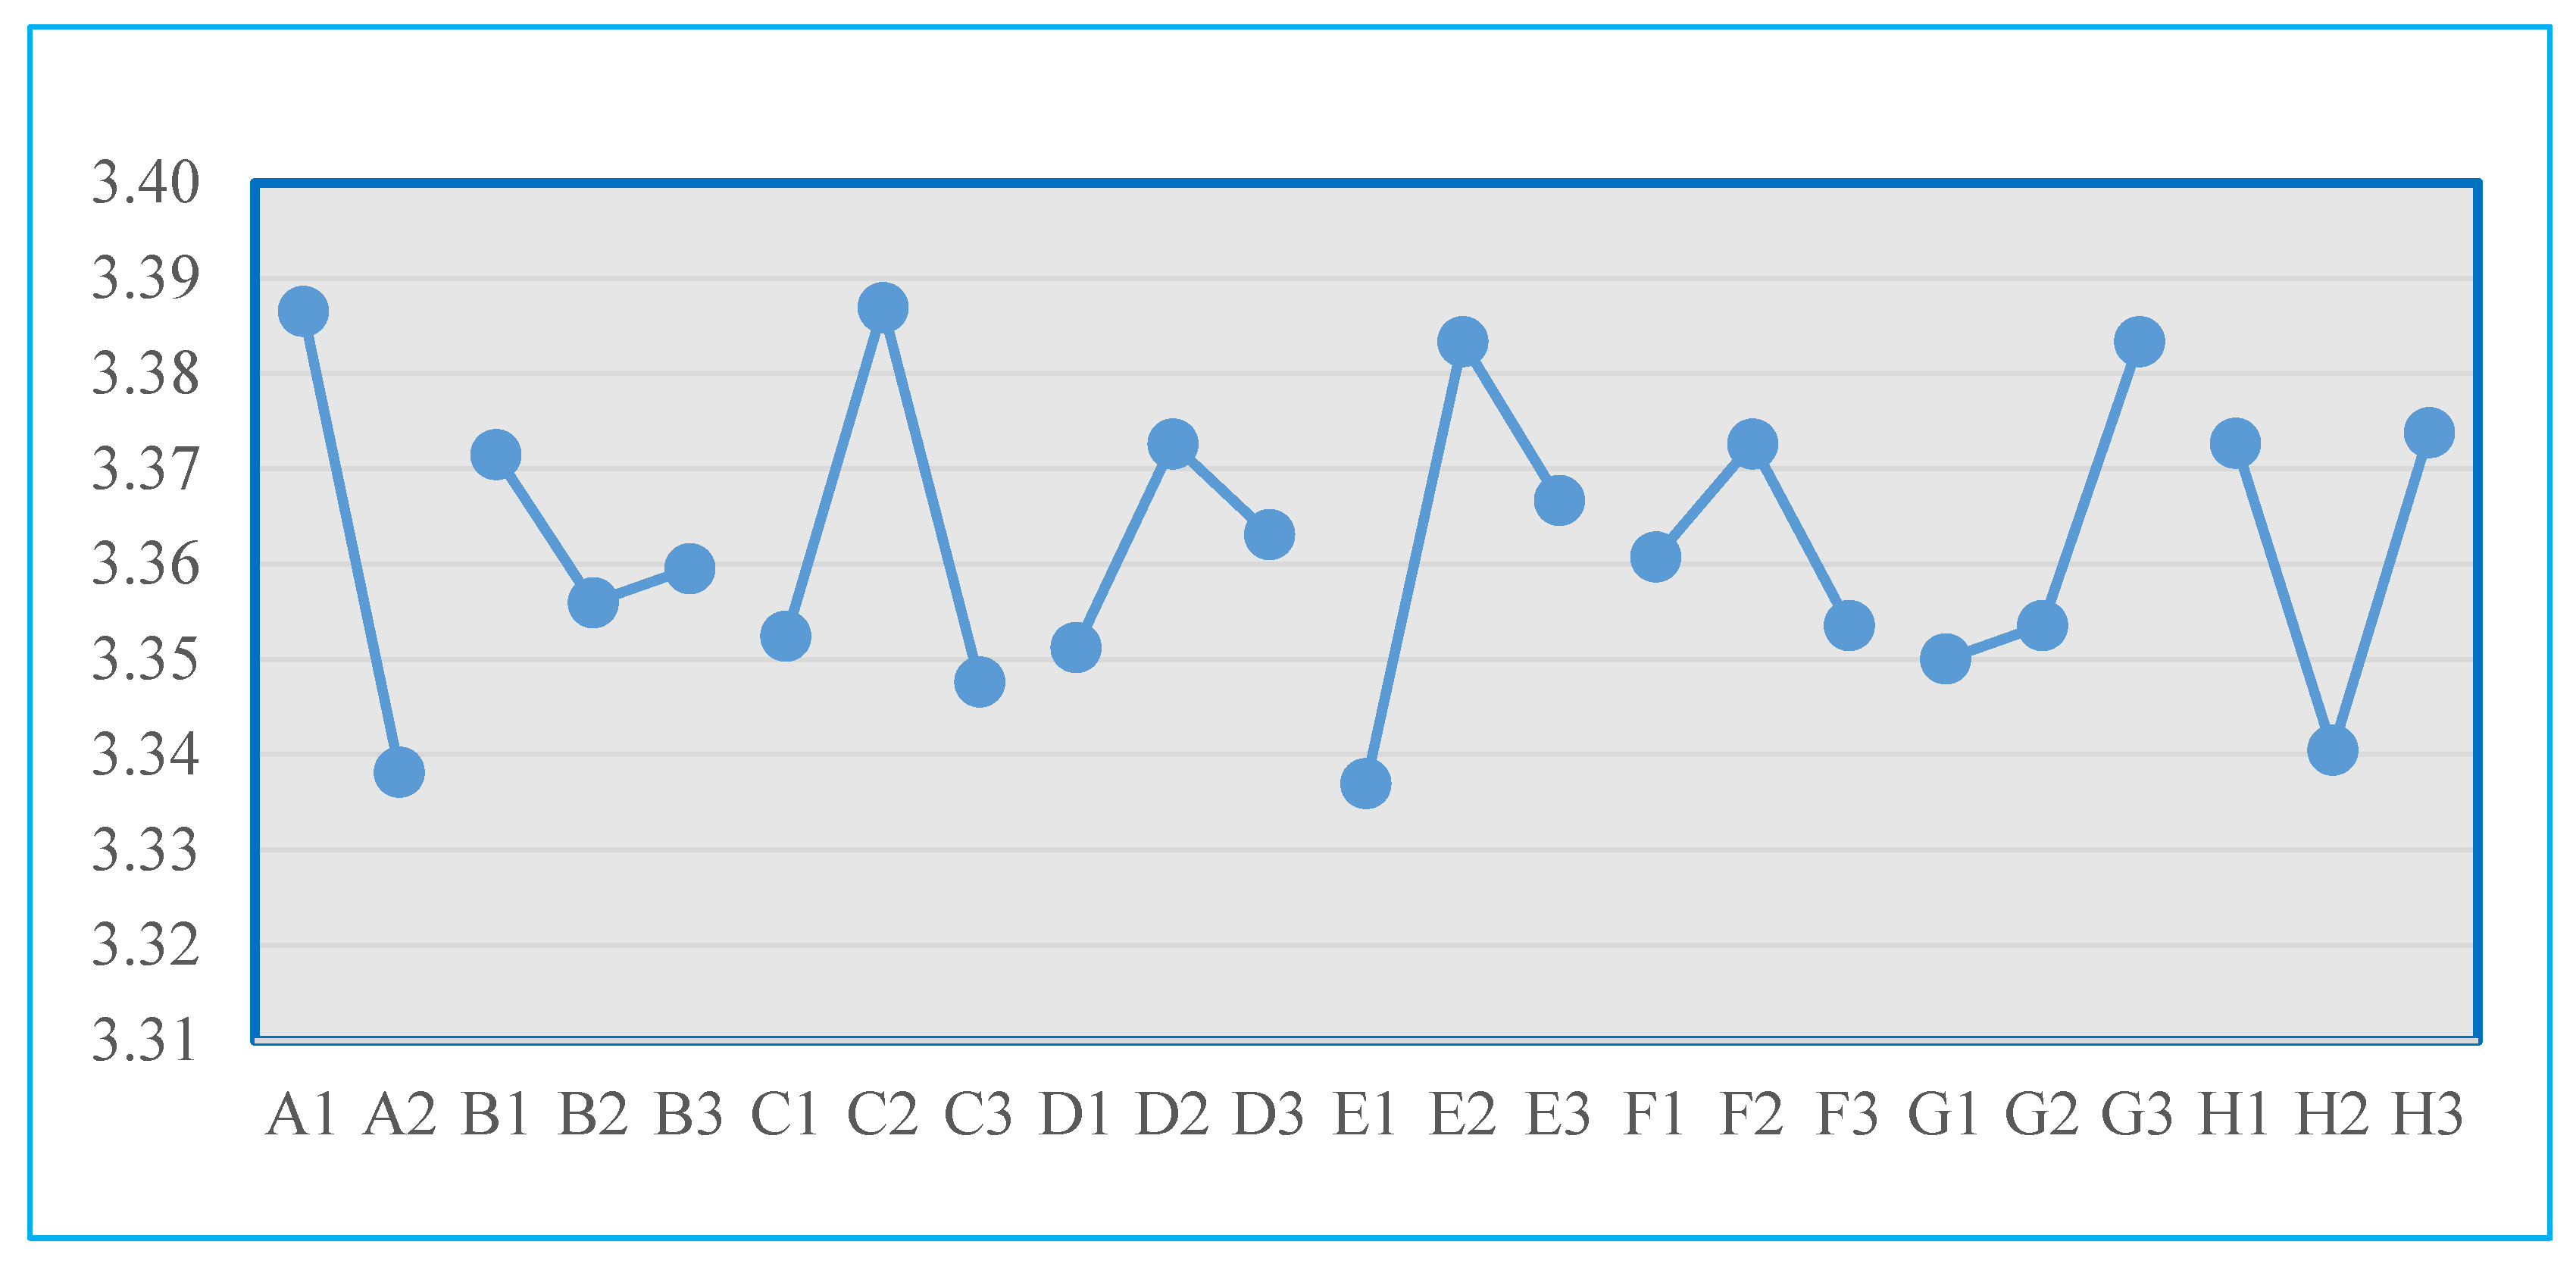
| A | B | C | D | E | F | G | H | |
|---|---|---|---|---|---|---|---|---|
| Level 1 | 3.39 | 3.37 | 3.35 | 3.351 | 3.34 | 3.36 | 3.35 | 3.37 |
| Level 2 | 3.34 | 3.36 | 3.39 | 3.373 | 3.38 | 3.37 | 3.35 | 3.34 |
| Level 3 | 3.36 | 3.35 | 3.363 | 3.37 | 3.35 | 3.38 | 3.37 | |
| E¹→² | −0.05 | −0.02 | 0.03 | 0.021 | 0.05 | 0.01 | 0.00 | −0.03 |
| E²→³ | 0.00 | −0.04 | −0.010 | −0.02 | −0.02 | 0.03 | 0.03 | |
| Range | 0.048 | 0.015 | 0.039 | 0.021 | 0.046 | 0.019 | 0.033 | 0.033 |
| Rank | 1 | 8 | 3 | 6 | 2 | 7 | 4 | 5 |
| Significant? | YES | NO | YES | NO | YES | NO | YES | YES |
| Factor | SS | DOF (n − 1) | Var | F-Value |
|---|---|---|---|---|
| A | 0.0738 | 1 | 0.0738 | 13.4 * |
| B | 0.0055 | 2 | 0.0028 | 0.5 |
| C | 0.0386 | 2 | 0.0193 | 3.5 * |
| D | 0.0097 | 2 | 0.0048 | 0.9 |
| E | 0.0465 | 2 | 0.0232 | 4.2 * |
| F | 0.0078 | 2 | 0.0039 | 0.7 |
| G | 0.0281 | 2 | 0.0141 | 2.5 * |
| H | 0.0300 | 2 | 0.0150 | 2.7 * |
| Error | 0.5971 | 108 | 0.0055 | |
| Total | 0.8484 | 125 | 0.0068 |
| Factor | SS | DOF | Var | F-Value | Confidence | Significance * | Contribution |
|---|---|---|---|---|---|---|---|
| A | 0.074 | 1 | 0.074 | 13.4 | 99.96% | Yes | 8.70% |
| B | 0.006 | 2 | 0.003 | 0.5 | 39.14% | No | 0.65% |
| C | 0.039 | 2 | 0.019 | 3.5 | 96.61% | Yes | 4.55% |
| D | 0.010 | 2 | 0.005 | 0.9 | 58.05% | No | 1.14% |
| E | 0.046 | 2 | 0.023 | 4.2 | 98.25% | Yes | 5.48% |
| F | 0.008 | 2 | 0.004 | 0.7 | 50.28% | No | 0.92% |
| G | 0.028 | 2 | 0.014 | 2.5 | 91.68% | Yes | 3.32% |
| H | 0.030 | 2 | 0.015 | 2.7 | 92.94% | Yes | 3.54% |
| Others | 0.011 | 2 | 0.006 | 1.0 | 63.44% | No | 1.32% |
| Error | 0.597 | 108 | 0.006 | S = 7.44% | 70.38% | ||
| Total | 0.848 | 125 | 0.0068 | * At least 90% confidence | 100.00% | ||
| Factor | Original Design | Optimal Design | ||
|---|---|---|---|---|
| Setting | Effect (dB) | Setting | Effect (dB) | |
| A | A2 | 1.7 | A2 | 1.7 |
| B | (B2) | (B2) | ||
| C | (C2) | (C3) | ||
| D | D2 | −0.9 | D1 | 0.8 |
| E | E2 | 0.2 | E3 | 1.0 |
| F | (F2) | (F3) | ||
| G | G2 | −1.6 | G1 | 2.2 |
| H | H2 | 1.3 | H2 | 1.3 |
| Average | 34.3 | 34.3 | ||
| Predicted by Additive Model | 35.0 | 41.2 | ||
| P1 | P2 | P3 | P4 | P5 | P6 | P7 | Ave. | SD | S/N | ||
|---|---|---|---|---|---|---|---|---|---|---|---|
| Experiment | Predicted | ||||||||||
| Original | 3.35 | 3.50 | 3.45 | 3.35 | 3.40 | 3.40 | 3.35 | 3.41 | 0.06 | 34.9 | 35.0 |
| 3.40 | 3.35 | 3.35 | 3.40 | 3.45 | 3.55 | 3.40 | |||||
| Optimal | 3.30 | 3.28 | 3.30 | 3.32 | 3.30 | 3.36 | 3.32 | 3.32 | 0.03 | 41.1 | 41.2 |
| 3.28 | 3.34 | 3.30 | 3.34 | 3.32 | 3.38 | 3.34 | |||||
| Improvement = | 6.21 | 6.24 | |||||||||
| The Delphi Research Analysis Result | Taguchi Method Quality Control Research Results | |||
|---|---|---|---|---|
| No. | The key factors( ten key subitems) | Factor | Description of important quality control factors | Optimal design parameters |
| 1 | PP extrusion main screw feed pressure control (revised: PP extrusion main screw discharge pressure control) | A | Polypropylene new material ratio | 60% |
| 2 | PP extrusion resin temperature change control | B | Extrusion screw pressure speed | 485 rpm |
| 3 | T-die lips adjustment sheet sta-bility (correction: die lips adjustment depends on sheet thickness) | C | Polymer temperature | 220 °C |
| 4 | mirror wheel pressing stability | D | T-die lips adjustment thickness | 0.53mm |
| 5 | mirror wheel temperature stability | E | Mirror wheel temperature stability | 35 °C |
| 6 | extrusion driving screw geometric design | F | Molding heating thermostatic control | 240 °C |
| 7 | molding heating con-troller element stability | G | Molding vacuum pressure time | 4 sec |
| 8 | molding heating thermostatic control area error value | H | Forming mold area design | 75% |
| 9 | molding vacuum and compressed air system stability | 1. Factors A, D, E, G, H are used to reduce variation. 2. Factors C and F are used to adjust quality characteristics to target values. 3. Factor B can be used to reduce costs. | ||
| 10 | molding machine maximum clamping force and molding area relation-ship design | |||
Disclaimer/Publisher’s Note: The statements, opinions and data contained in all publications are solely those of the individual author(s) and contributor(s) and not of MDPI and/or the editor(s). MDPI and/or the editor(s) disclaim responsibility for any injury to people or property resulting from any ideas, methods, instructions or products referred to in the content. |
© 2024 by the authors. Licensee MDPI, Basel, Switzerland. This article is an open access article distributed under the terms and conditions of the Creative Commons Attribution (CC BY) license (https://creativecommons.org/licenses/by/4.0/).
Share and Cite
Chen, D.-C.; Chen, D.-F.; Huang, S.-M. Applying the Taguchi Method to Improve Key Parameters of Extrusion Vacuum-Forming Quality. Polymers 2024, 16, 1113. https://doi.org/10.3390/polym16081113
Chen D-C, Chen D-F, Huang S-M. Applying the Taguchi Method to Improve Key Parameters of Extrusion Vacuum-Forming Quality. Polymers. 2024; 16(8):1113. https://doi.org/10.3390/polym16081113
Chicago/Turabian StyleChen, Dyi-Cheng, Der-Fa Chen, and Shih-Ming Huang. 2024. "Applying the Taguchi Method to Improve Key Parameters of Extrusion Vacuum-Forming Quality" Polymers 16, no. 8: 1113. https://doi.org/10.3390/polym16081113
APA StyleChen, D.-C., Chen, D.-F., & Huang, S.-M. (2024). Applying the Taguchi Method to Improve Key Parameters of Extrusion Vacuum-Forming Quality. Polymers, 16(8), 1113. https://doi.org/10.3390/polym16081113