Article

Impact of Copolymer Architecture on Demicellization and Cargo Release via Head-to-Tail Depolymerization of Hydrophobic Blocks or Branches

Chemistry Department, University of Ioannina, 45110 Ioannina, Greece
*
Author to whom correspondence should be addressed.
Polymers 2024, 16(8), 1127; https://doi.org/10.3390/polym16081127
Submission received: 19 March 2024 / Revised: 7 April 2024 / Accepted: 13 April 2024 / Published: 17 April 2024
(This article belongs to the Special Issue Polymer Brushes: Synthesis, Characterization and Applications)

Abstract

:
Utilizing molecular dynamics simulations, we explored the demicellization and cargo release dynamics of linear and miktoarm copolymers, featuring one, two, and three hydrophobic blocks or branches, each capable of head-to-tail depolymerization. Our findings revealed that, under stoichiometric trigger molecule concentrations, miktoarms with three branches exhibited consistently faster depolymerization rates than those with two branches and linear copolymers. Conversely, at constant trigger molecule concentrations, the depolymerization rates of copolymers exhibited more complex behaviors influenced by two opposing factors: the excess of trigger molecules, which increased with a decrease in the number of hydrophobic branches or blocks, and simultaneous head-to-tail depolymerization, which intensified with an increasing number of branches. Our study elucidates the intricate interplay between copolymer architecture, trigger molecule concentrations, and depolymerization dynamics, providing valuable insights for the rational design of amphiphilic copolymers with tunable demicellization and cargo release properties.

1. Introduction

Hydrophobic drugs and nucleic acid vectors used in therapeutics face significant challenges, including low stability, in vivo degradation, and difficulties in reaching the target site [1]. Consequently, a robust delivery system is essential to transporting these agents safely and efficiently. In recent years, polymeric micelles have emerged as highly effective cargo carriers, owing to their biocompatibility, facile preparation, tunable size and shape, prolonged stability in blood circulation, and enhanced in vivo retention at the target site [2,3,4,5,6]. Typically, polymeric micelles consist of pre-synthesized diblock copolymer chains, comprising a hydrophilic and a hydrophobic block, or a mixture of double hydrophilic diblock copolymers with neutral and oppositely charged blocks, that become hydrophobic upon complexation [7,8]. The hydrophobic segments form the micelle core, while the hydrophilic ones create the surrounding corona. These micelles are derived from dilute polymer concentrations exceeding the critical micelle concentration (CMC). Recently, innovative assembly models (PISA and PIESA) have allowed micellization at high monomer concentrations, combining diblock copolymer synthesis and micellization in a single process [9,10]. The coassembly of cargo molecules with copolymer chains results in the encapsulation of hydrophobic cargo within the micelle core due to the hydrophobic interactions with the solvent.
Smart polymeric micelles, responsive to the microenvironment of the target site, can be designed by incorporating stimuli-responsive switches, either assembled into micelles or covalently grafted onto copolymer chains. These switches, responsive to pH, light, heat, redox reactions, and enzymes, facilitate efficient drug delivery [11,12,13]. However, challenges may arise in achieving complete cargo release due to the incomplete dissociation of the micelle. A novel and appealing idea for crafting materials with dual characteristics of degradability and responsiveness to stimuli involves end-capped cascade degradable polymers [14,15]. In this approach, polymers consist of a stable backbone while the end-cap remains intact. However, once the end-cap is removed through a specific bond cleavage, a functional group becomes exposed at the polymer’s end. This exposed functionality triggers a series of intramolecular reactions, ultimately leading to the complete depolymerization of the material from end to end. Originally introduced in dendritic systems, this concept showcased the degradation process via an intramolecular cascade, liberating multiple molecules from the periphery of the dendrimer [16]. These systems were subsequently refined to enable the simultaneous release of various drug molecules, the incorporation of targeting elements for tumors, and the inclusion of focal point groups sensitive to either reducing conditions or enzymes. Polymeric micelle carriers with degradable copolymer chains have gained attention for offering controlled yet complete release of cargo molecules and preventing the accumulation of micelles at the target point [17,18,19].
In a noteworthy study, Kim et. al. designed amphiphiles based on poly(benzyl-ether) capable of selective demicellization through head-to-tail depolymerization triggered by hydrophobic fluolid molecules [20]. A labile end-capping unit attached to the end of the hydrophobic block is buried inside the core of the micelle, preventing detachment of the labile units and rendering the demicellization signal specific. Fluolid molecules trigger the detachment of the end-capping unit in the hydrophobic block, after which the entire chain spontaneously and continuously depolymerizes in a head-to-tail manner without the need for additional stimuli. Loading doxorubicin inside the micelles led to their molecular-level degradation, resulting in the controlled and complete release of the cargo molecules.
The depolymerization-induced disassembly mechanism has primarily been explored for amphiphiles with a linear chain architecture carrying one labile end-cap unit. The design of amphiphiles with a different architecture, bearing more labile end-cap units, can further enhance the control of depolymerization and cargo release, which is useful for biological and environmental applications. Due to the lack of such studies, we conducted coarse-grained molecular dynamics simulations of micelles formed by (a) linear AB diblock copolymer with one hydrophilic (A–type) and one hydrophobic (B–type) block, featuring one end-cap unit; (b) miktoarm star copolymer A(B)2 with one hydrophilic and two hydrophobic branches, equipped with two end-cap units; and (c) miktoarm star copolymer A(B)3 with three hydrophobic branches and three end-cap units. We first provide a brief introduction to the coarse-grained model and the interaction parameters used for simulating amphiphilic copolymers under selective solvents. Additionally, we outline the algorithm for depolymerization reactions and describe the Python algorithm employed to study micellization, loading capacity, and cargo release. In the results section, we present calculations of the mass distributions of micelles formed by different copolymers both before and after cargo loading. Furthermore, we analyze the kinetics of head-to-tail depolymerization of hydrophobic blocks or branches, as well as the kinetics of cargo release triggered by hydrophobic small molecules. Finally, we summarize our findings briefly and offer some concluding remarks.

2. Model

2.1. Coarse-Grained Molecular Dynamics Simulation Details

Amphiphilic AB linear diblock copolymers, miktoarm star copolymers, and cargo molecules are modeled as bead-spring chains consisting of Lennard–Jones beads with a diameter σ following the Murat–Grest model [21]. In all simulations, the copolymer chains collectively consist of 30 A–type hydrophilic and 30 B–type hydrophobic beads. In linear AB diblock copolymers, denoted as A30B30, the hydrophilic and hydrophobic beads are distributed in one block each. In miktoarm star copolymers with three and four branches, denoted as A30(B15)2 and A30(B10)3, the thirty hydrophobic beads are distributed into two or three branches, respectively. The free end bead of the hydrophobic block or branch is designated as an end-cap unit. The cargo molecules are linear chains containing three C–type hydrophobic beads, denoted as C3. The trigger molecule consists of a single T–type hydrophobic bead with a diameter σ. All copolymer chains, including those with linear and star architecture, as well as cargo and trigger molecules, are illustrated in Figure 1.
In the current study, simulations were contacted for mixtures comprising (a) A30B30 with C3, (b) A30(B15)2 with C3, and (c) A30(B10)3 with C3, collectively containing 1000 copolymer chains and 2000 or 4000 cargo molecules. In all cases, the total concentration of beads (including copolymer and cargo beads) was maintained at [Φ] = 0.12 where most micelles are formed.
Excluded volume bead-bead interactions were considered to mimic the macroscopic solvent conditions. These interactions were calculated using a truncated Lennard–Jones potential [8,22]:
U L J r i j = 4 ε σ r i j 12 σ r i j 6 σ r c i j 12 + σ r c i j 6 ,   r i j r c i j 0 , r i j > r c i j  
where ε is the well depth and rcij is the cutoff radius. Different beads were connected with finitely extensible nonlinear elastic bonds (FENE). The FENE potential is expressed as [8]
U B o n d r i j = 0.5 k R 0 2 l n 1 r i j R 0 2 ,     r i j R 0 ,                                                                                       r i j > R 0  
where rij is the distance between beads i and j, k = 25 ε / σ 2 and R0 is the maximum extension of the bond [21] ( R 0 = 1.5 σ ) . The solvent molecules are implicitly considered.
Molecular dynamics simulations with a Langevin thermostat were conducted in a cubic box with periodic boundary conditions, using the open-source massive parallel simulator LAMMPS [23]. The reduced temperature of the simulation T* was set to T* = kBT/ε = 1.8 (ε = 1) corresponding to bad solvent conditions [8]. Different cutoff distances and epsilon parameters in the Lennard–Jones potential were employed to describe the interactions between copolymer units. The B–B, B–C, and C–C interactions were considered attractive. Specifically, the B–B interactions consistently corresponded to T* = 1.8 while the B–C and C-C interactions were even more attractive, corresponding to lower temperatures (T* = 1.8, 1.4, and T* = 1.8, 1.6, 1.5 and 1.4, respectively) with a cutoff distance rcij of 2.5σ (εBB = 1, εij = T*/1.8, for i, j ≠ B). Conversely, the A–A, A–B, and A–C interactions were considered repulsive, with a cutoff distance rcij of 21/6σ. In the latter case, the Lennard–Jones potential is shifted by ε. For simplicity, all types of beads were assumed to have the same mass (m = mi =1) and diameter (σ = 1).
Following the Stillinger criterion [24], two chains were considered to reside in the same micelle if the distance between any two nonbonded hydrophobic beads belonging to different chains was found to be within 1.5σ.
We performed 2 million timesteps with an integration step t = 0.006 τ ( τ = m σ 2 ε ) , setting all cutoff radii equal to rcij = 21/6σ to eliminate any bias introduced from the initial conformation. Subsequently, the system was allowed to equilibrate for 30 million timesteps. The simulation was then extended to 300 to 600 million timesteps. The duration of the simulation was evaluated by calculating the tracer autocorrelation function [7]:
C t = N t 0 + t N ( t 0 ) N ( t 0 ) 2 N 2 t 0 N ( t 0 ) 2         ,
where N(t) is the number of molecules in the micelle in which the copolymer resides at time t. We considered all copolymers as tracers, with each time step serving as the time origin t0. The characteristic relaxation time trelax is defined as the time required for C(t) to reach the value [7,8] of 1/e = 0.37. Each simulation was conducted for a minimum of 10trelax to ensure 10 independent conformations. The properties of interest were calculated as averages from 4000 snapshots using the block average method with ten blocks.

2.2. Depolymerization and Cluster Analysis

The stochastic depolymerization of the hydrophobic monomers of amphiphilic copolymers, as depicted in Figure 2, utilized the “bond/react” functionality of LAMMPS. This feature allows the breaking of bonds between beads based on distance-dependent probabilistic criteria. Topology changes are specified in pre- and post-reaction molecule templates. Two distinct depolymerization steps were undertaken: (a) the breaking of bonds between the hydrophobic end-cap and B–type beads, triggered by the presence of T–type molecule within Rcutoff = 1σ from the end-cap bead, with a predetermined reaction probability (RP) (Figure 2a); (b) the spontaneous propagation of depolymerization of hydrophobic beads with a predetermined RP occurring without any external stimuli (Figure 2b). RPs are adjustable parameters.
We utilized graph clustering analysis to analyze the simulation data. Initially, we identified micelles employing the data clustering algorithm DBSCAN implemented in the Python library Sklearn [25], with a maximum allowable neighborhood radius of 1.5σ. For a point (bead) to be classified as a core point, a minimum of two points (including the point itself) must be within the neighborhood. A precomputed neighbor sparse array was utilized as the input for the DBSCAN algorithm. To construct this array, the KDTree neighbor data structure from the Python library SciPy [26] was employed, specifically the Sparse Distance Matrix algorithm with a maximum distance of 1.5σ between two points. It is worth noting that the distance matrix algorithm disregards points with a distance greater than the maximum distance parameter. The KDTree neighbor data structure takes periodic boundary conditions into account, ensuring that the clustering analysis includes the periodic images.
For the identification of polymer chains, we employed the Python NetworkX library [27]. In this context, beads were represented as nodes, and bonds were represented as edges. From the graph created by this library, we extracted the polymer chains using the “Connected/Components” algorithm. This algorithm generates connected components from a graph, corresponding to bead spring chains in our case. Subsequently, the polymer chains were assigned to micelles based on the previous steps. To compute properties such as the radius of gyration of the micelles (core, corona, and total) and the shape anisotropy parameter κ2, we utilized the outbox coordinates. To achieve this, micelles that split due to the periodic conditions (inbox coordinates) were identified and consolidated using the data clustering algorithm DBSCAN, the KDTree neighbor data structure, and the Sparse Distance Matrix algorithm without periodic conditions. Our testing, employing 250, 500, and 750 copolymer chains, revealed varying aggregation numbers of micelles formed by linear copolymers with identical interaction energy parameters. However, with 1000 and 1250 copolymer chains, consistent results were consistently achieved, indicating that 1000 chains represent the threshold where finite size effects dissipate. Consequently, employing all-atom simulations for such large systems is prohibited.

3. Results and Discussion

3.1. Micellization and Cargo Encapsulation

The micellization of amphiphilic linear A30B30, miktoarm star A30(B15)2, and A30(B10)3 copolymers was studied prior to cargo encapsulation at T* = 1.8 and [Φ] = 0.12. We calculated the aggregate mass distribution, the gyration radius, and the shape anisotropy of micelles. In Figure 3, the mass distribution of the aggregates is depicted. Peak values corresponding to the preferential aggregation number Np are higher for linear copolymers and decrease as the number of arms in miktoarm copolymers increases, aligning with previous simulation results [28,29].
The encapsulation of cargo molecules was examined for different interaction parameters between hydrophobic C–C and B–C beads. Simulations of mixtures containing 1000 copolymer chains with 2000 or 4000 cargo molecules C3 were contacted at [Φ] = 0.12, and the results are presented in Table S1. For linear A30B30 copolymers, an increase in the strength of attractions between C–C beads from T*C–C =1.8 to 1.4 had a minimal effect on the percentage of encapsulated cargo molecules (41% to 43%). In contrast, a similar increase in the strength of attractions between B–C beads (T*B–B = 1.8 and TB–C = T*C–C = 1.4) dramatically increased the percentage of encapsulated molecules to 83%, aligning with previous findings [30]. The copolymer architecture did not influence the encapsulation of cargo molecules, as the driving force for this process is the hydrophobicity between B and C beads. In a mixture of A30B30 with 4000 C3 molecules and attractive interactions corresponding to T*B–B = 1.8 and T*B–C = T*C–C = 1.4, the percentage of encapsulated cargo molecules remained constant at 82%. Free cargo molecules were in dynamic equilibrium with the encapsulated ones. The loading capacity [20] (LC) of the micelle, defined as the w/w percentage of the cargo accommodated in the loaded micelle carrier for the two different cargo concentrations, was found to be 7.6% and 14.1%, respectively. The encapsulation of hydrophobic molecules in the micelle core altered the hydrophilic/hydrophobic balance, triggering the association of free copolymer chains into the micelles and resulting in a higher aggregation number for all copolymer architectures (Figure 3 and Table S2). The Np of loaded micelles with LC = 7.6% increased by approximately 16%, 30%, and 35% for the linear A30B30, miktoarm star A30(B15)2, and A30(B10)3 copolymer mixtures, respectively. This higher increase in Np in miktoarm copolymers reflects the more efficient packing of B and C beads in the micelle core, facilitating the decrease in free energy. The autocorrelation function indicates that the micelles of A30B30 copolymers with LC = 14.1% were kinetically frozen even after 600 million timesteps and were not further studied.
The mean squared radius of gyration <Rg2>, serves as a measure expressing the size of both ‘empty’ and loaded micelles. The calculation of <Rg2> focused solely on copolymer beads to maintain consistent molecular weight in micelles sharing the same aggregation number N. In the case of preferential micelles, <Rg2> was observed to be higher in loaded micelles by approximately 9%, 16%, and 16% for A30B30, A30(B15)2, and A30(B10)3 copolymers, respectively. This elevation can be attributed to the increased Np of loaded micelles, with the disparity in Np becoming more pronounced in miktoarm star copolymers. Figure 4 illustrates the results for <Rg2> for both types of micelles with the same Np. For A30B30 copolymers, <Rg2> is marginally higher in loaded micelles, a consequence of cargo molecules enlarging the micelle core and leading to a slight increase in <Rg2>. A similar trend is observed in micelles formed by A30(B15)2 and A30(B10)3 copolymers up to N = 40 and 27, respectively. However, for higher N values, the <Rg2> of ‘empty’ micelles surpasses that of loaded ones. The anisotropy shape parameter [29,31] κ2 values depicted in Figure 5 reveal that ‘empty’ micelles exhibit an elongated shape in contrast to the more spherical-shaped loaded micelles. This distinction arises from the improved packing of hydrophobic content in the micelle core, leading to higher <Rg2> values for ‘empty’ micelles compared to the loaded ones. Notably, A30B30 copolymers form very spherical micelles in both ‘empty’ and loaded states, while the differences in κ2 values for A30(B15)2 and A30(B10)3 copolymers increase with the number of hydrophobic arms.

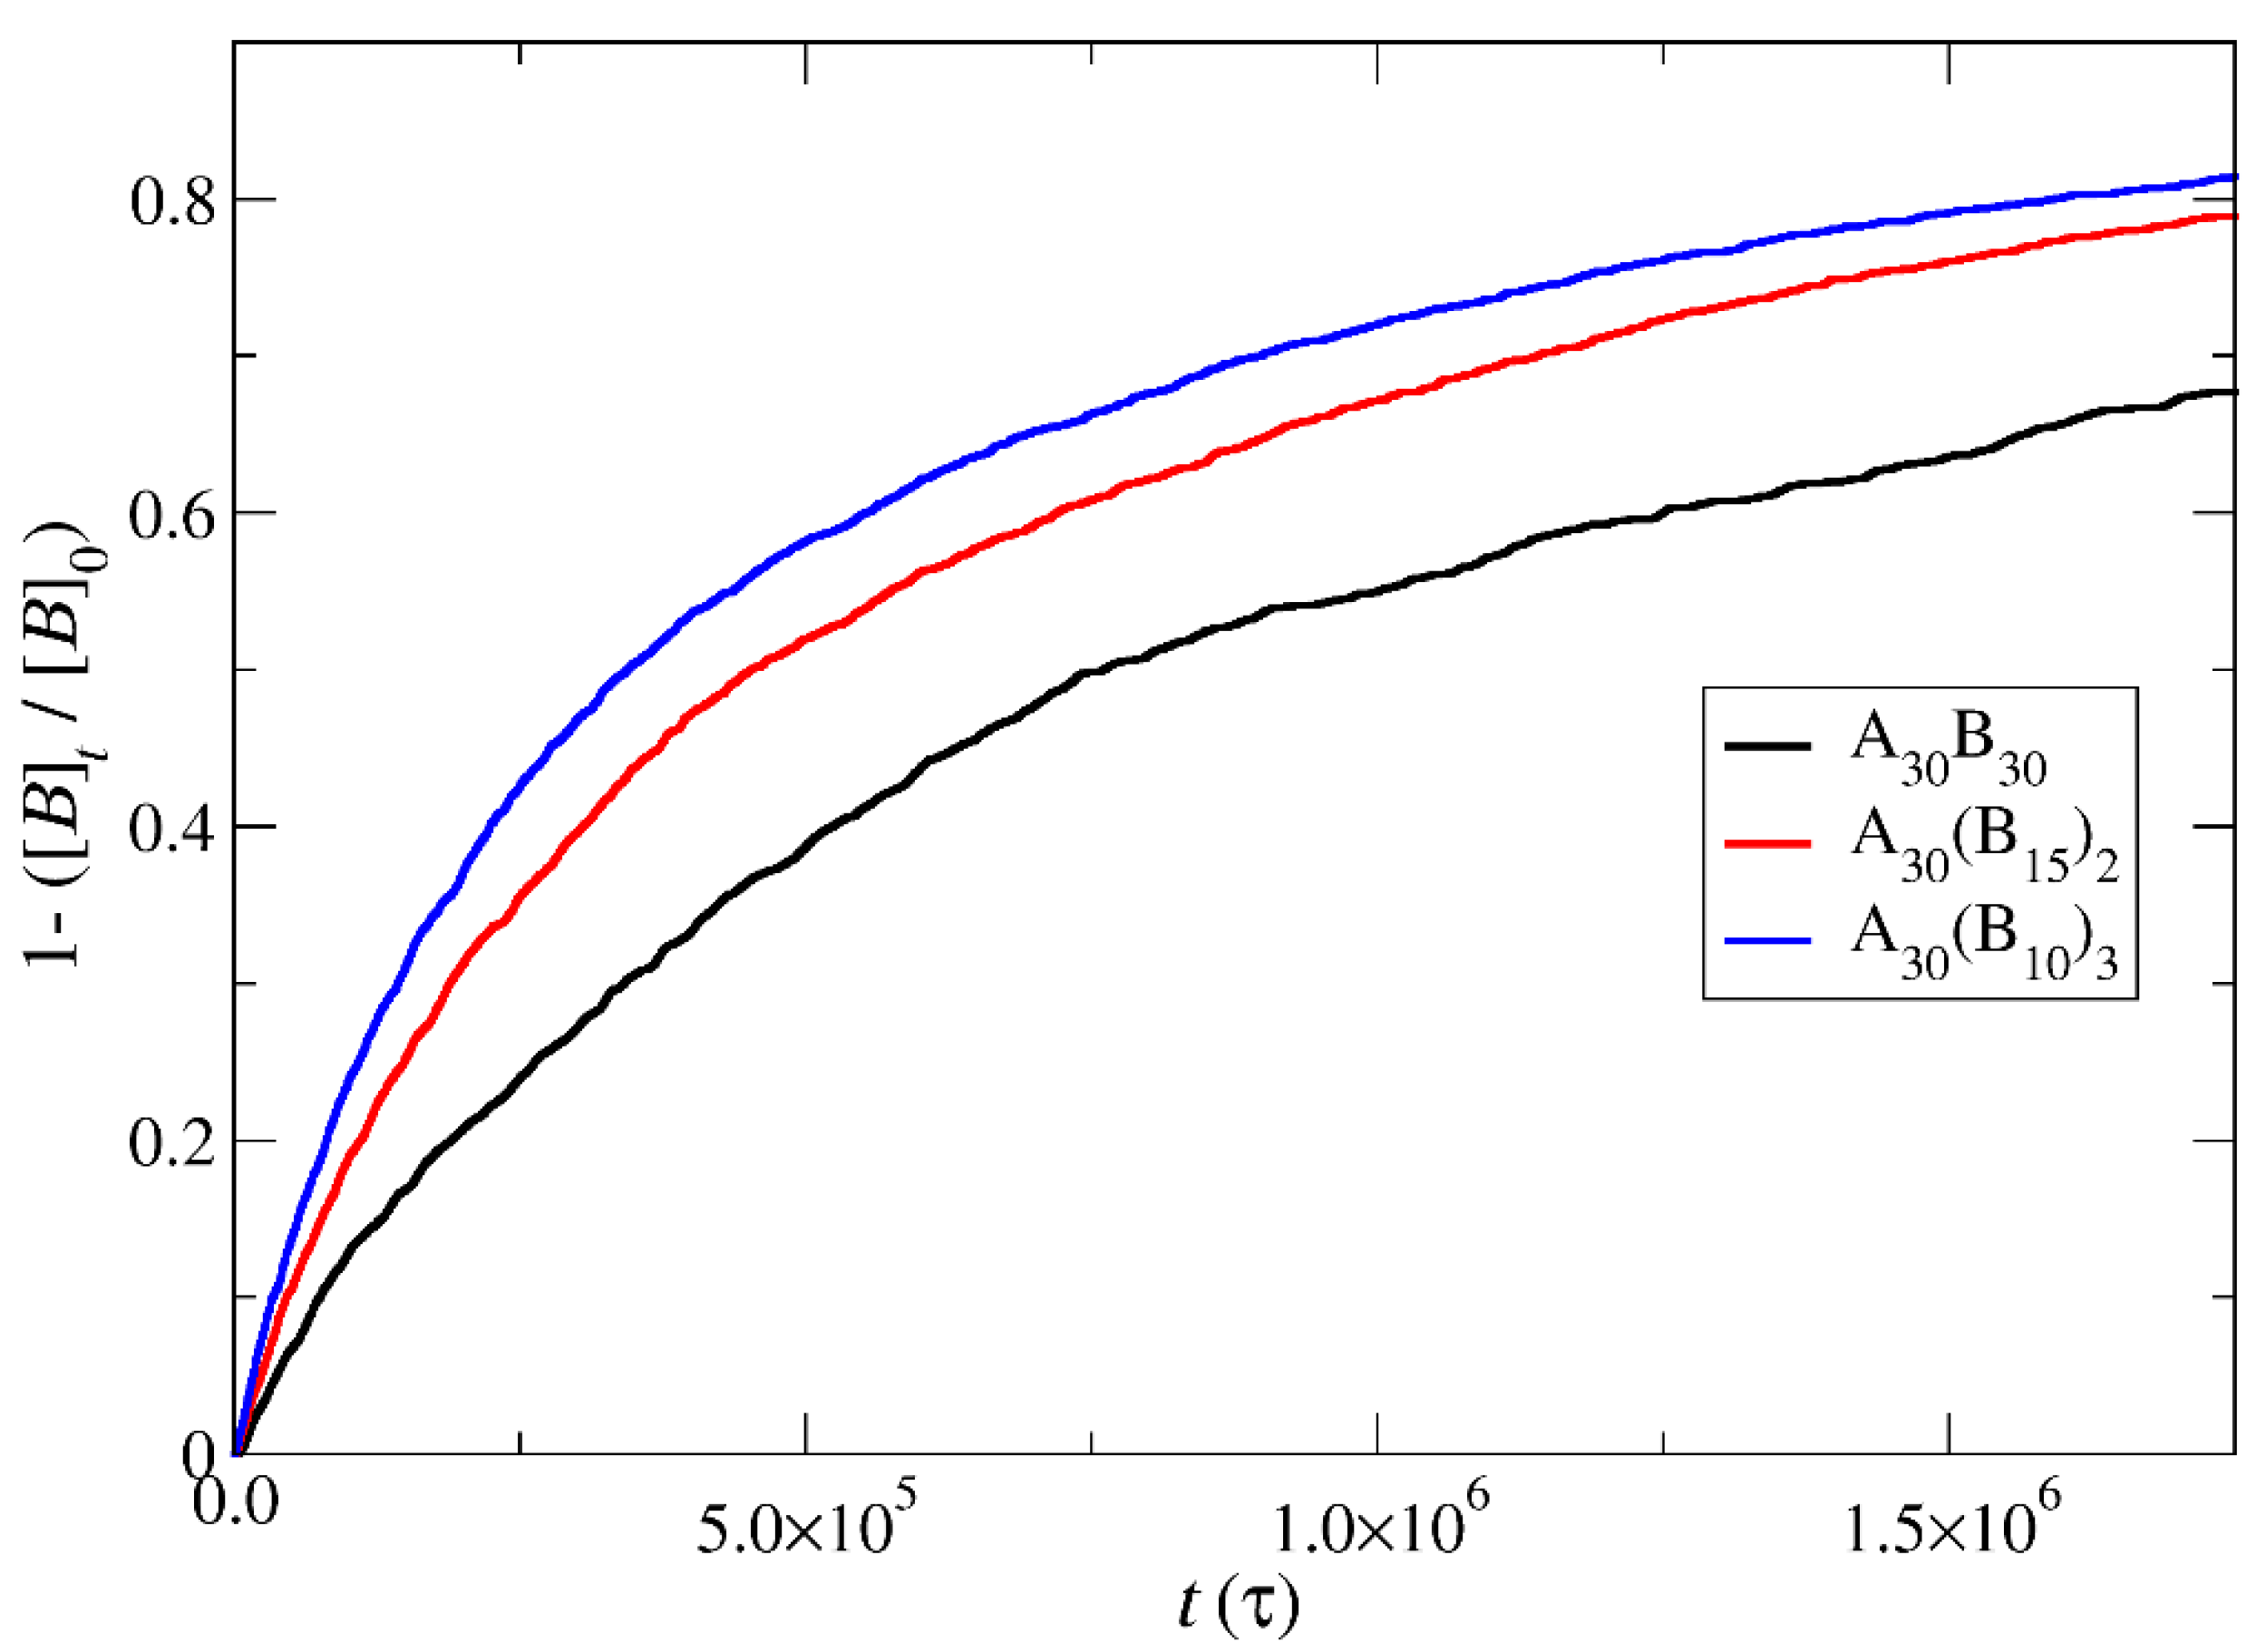
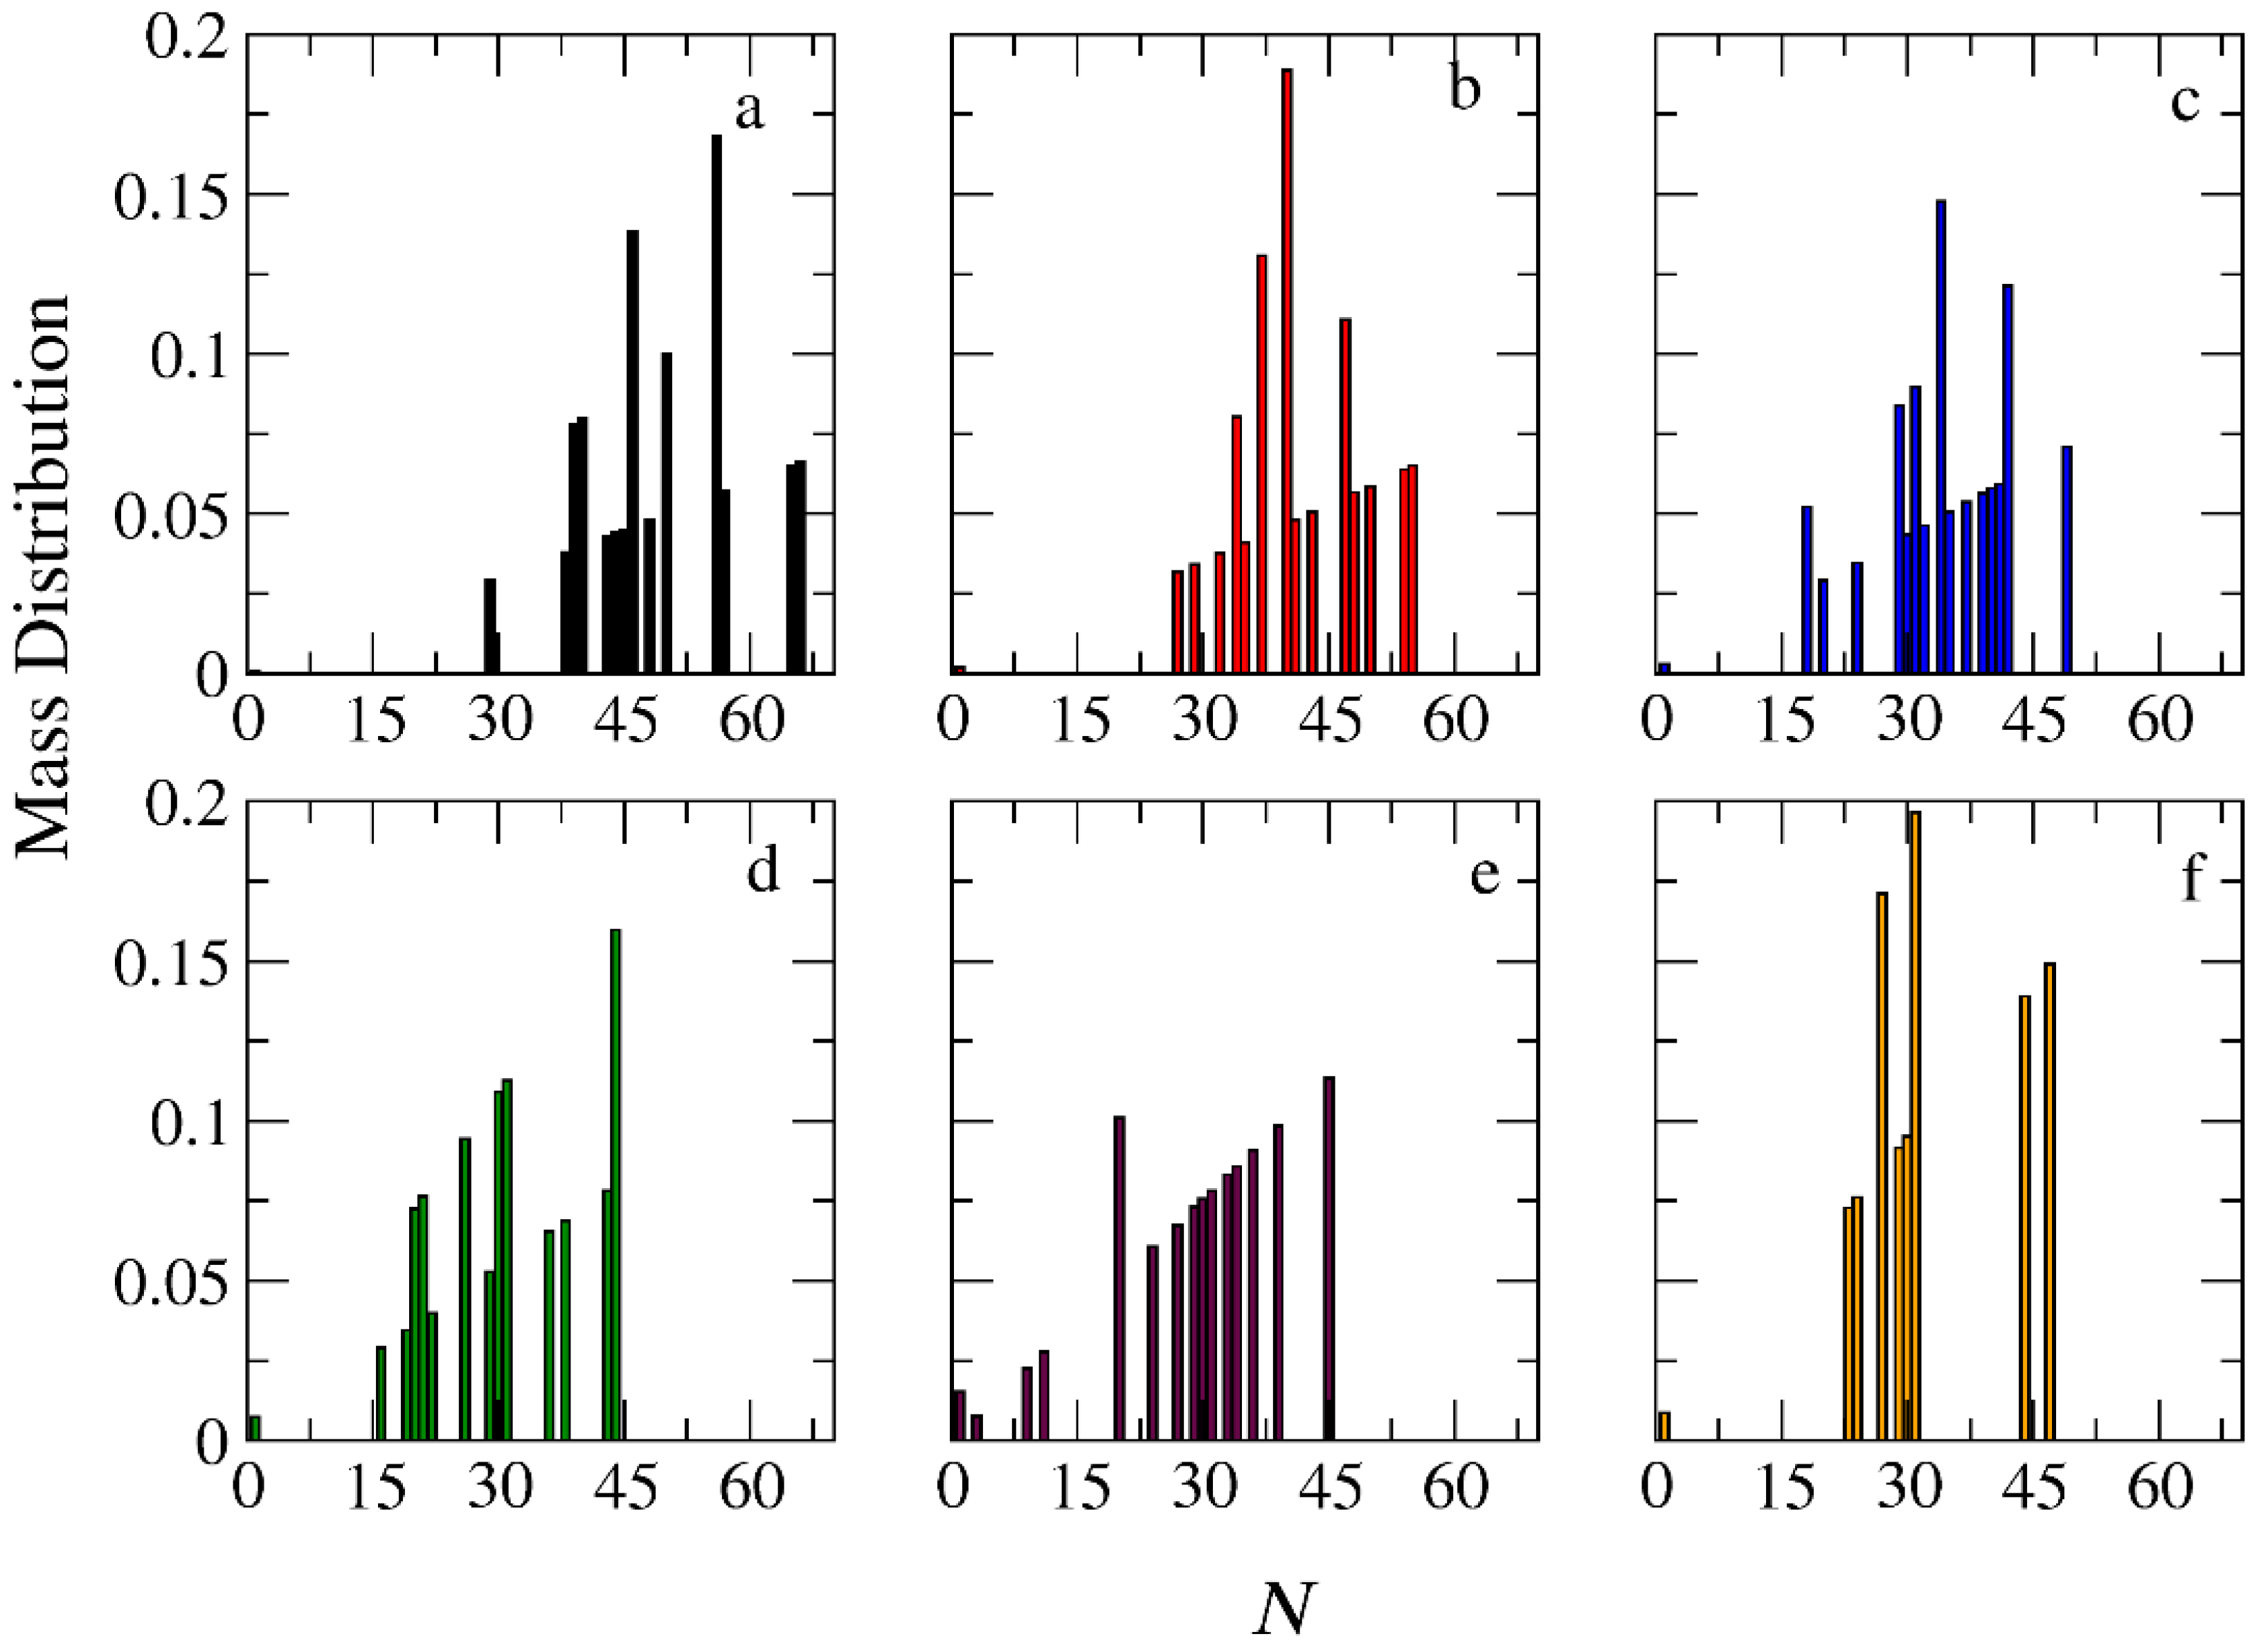
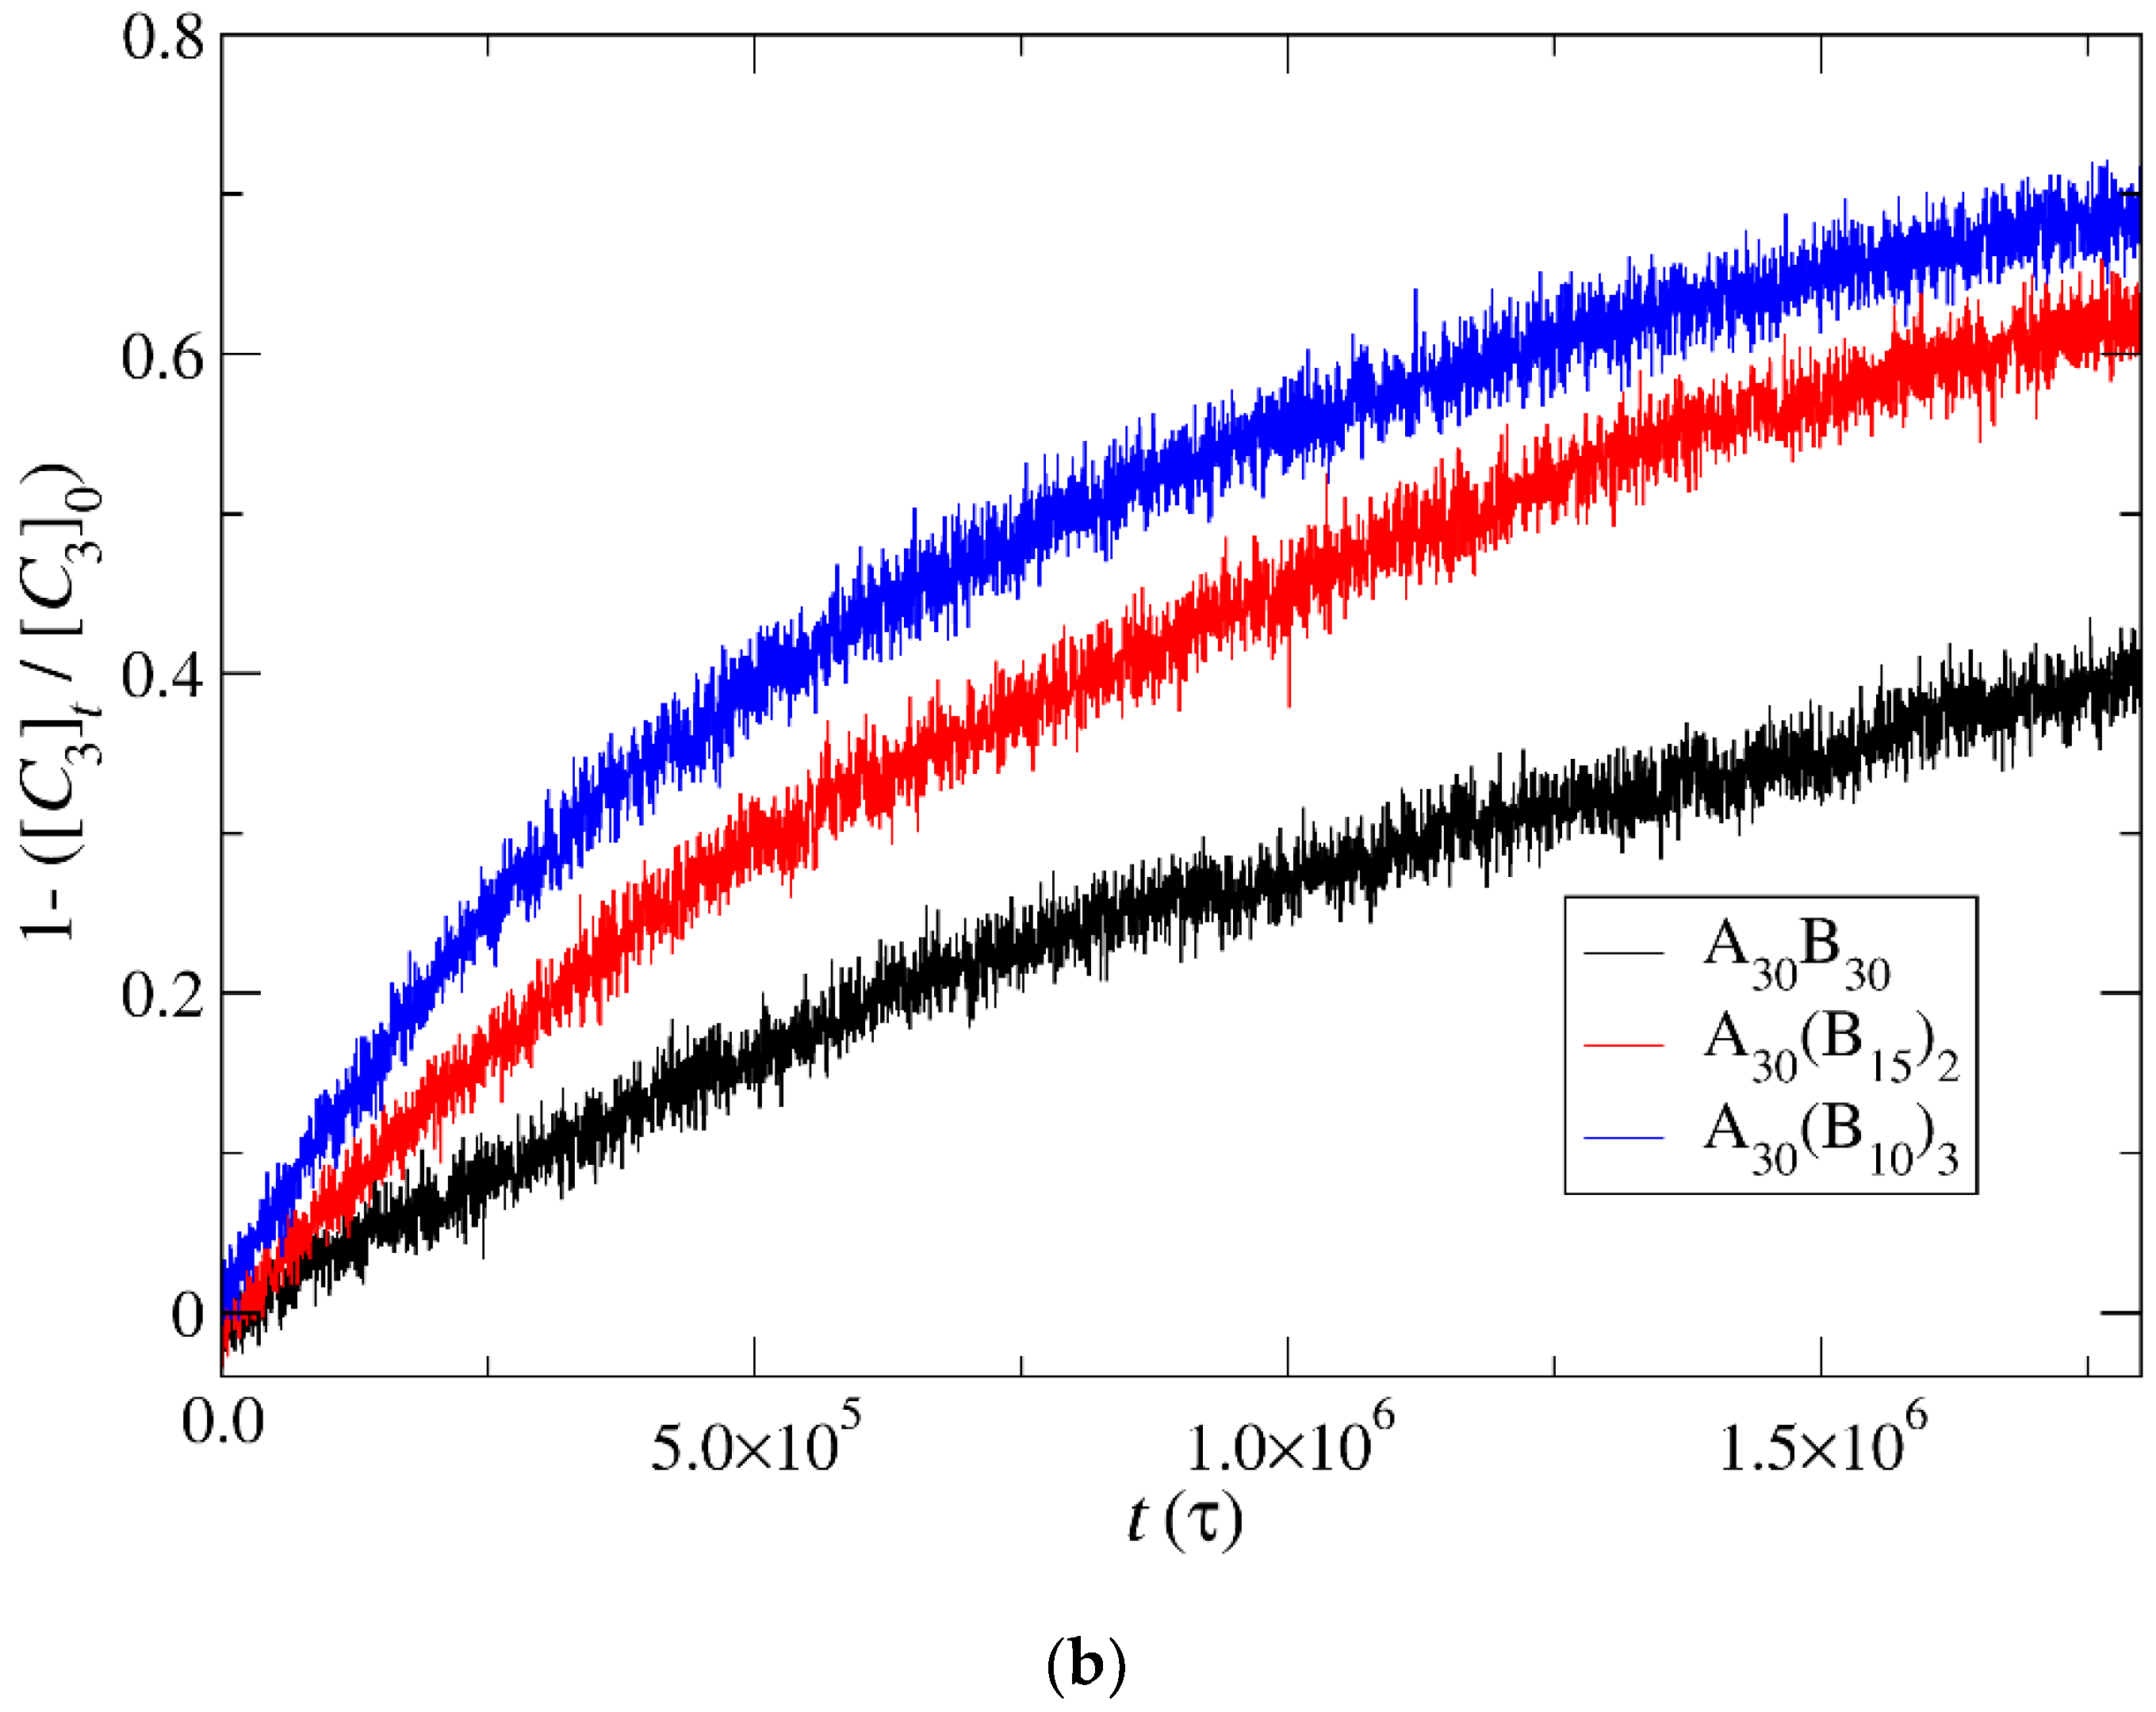
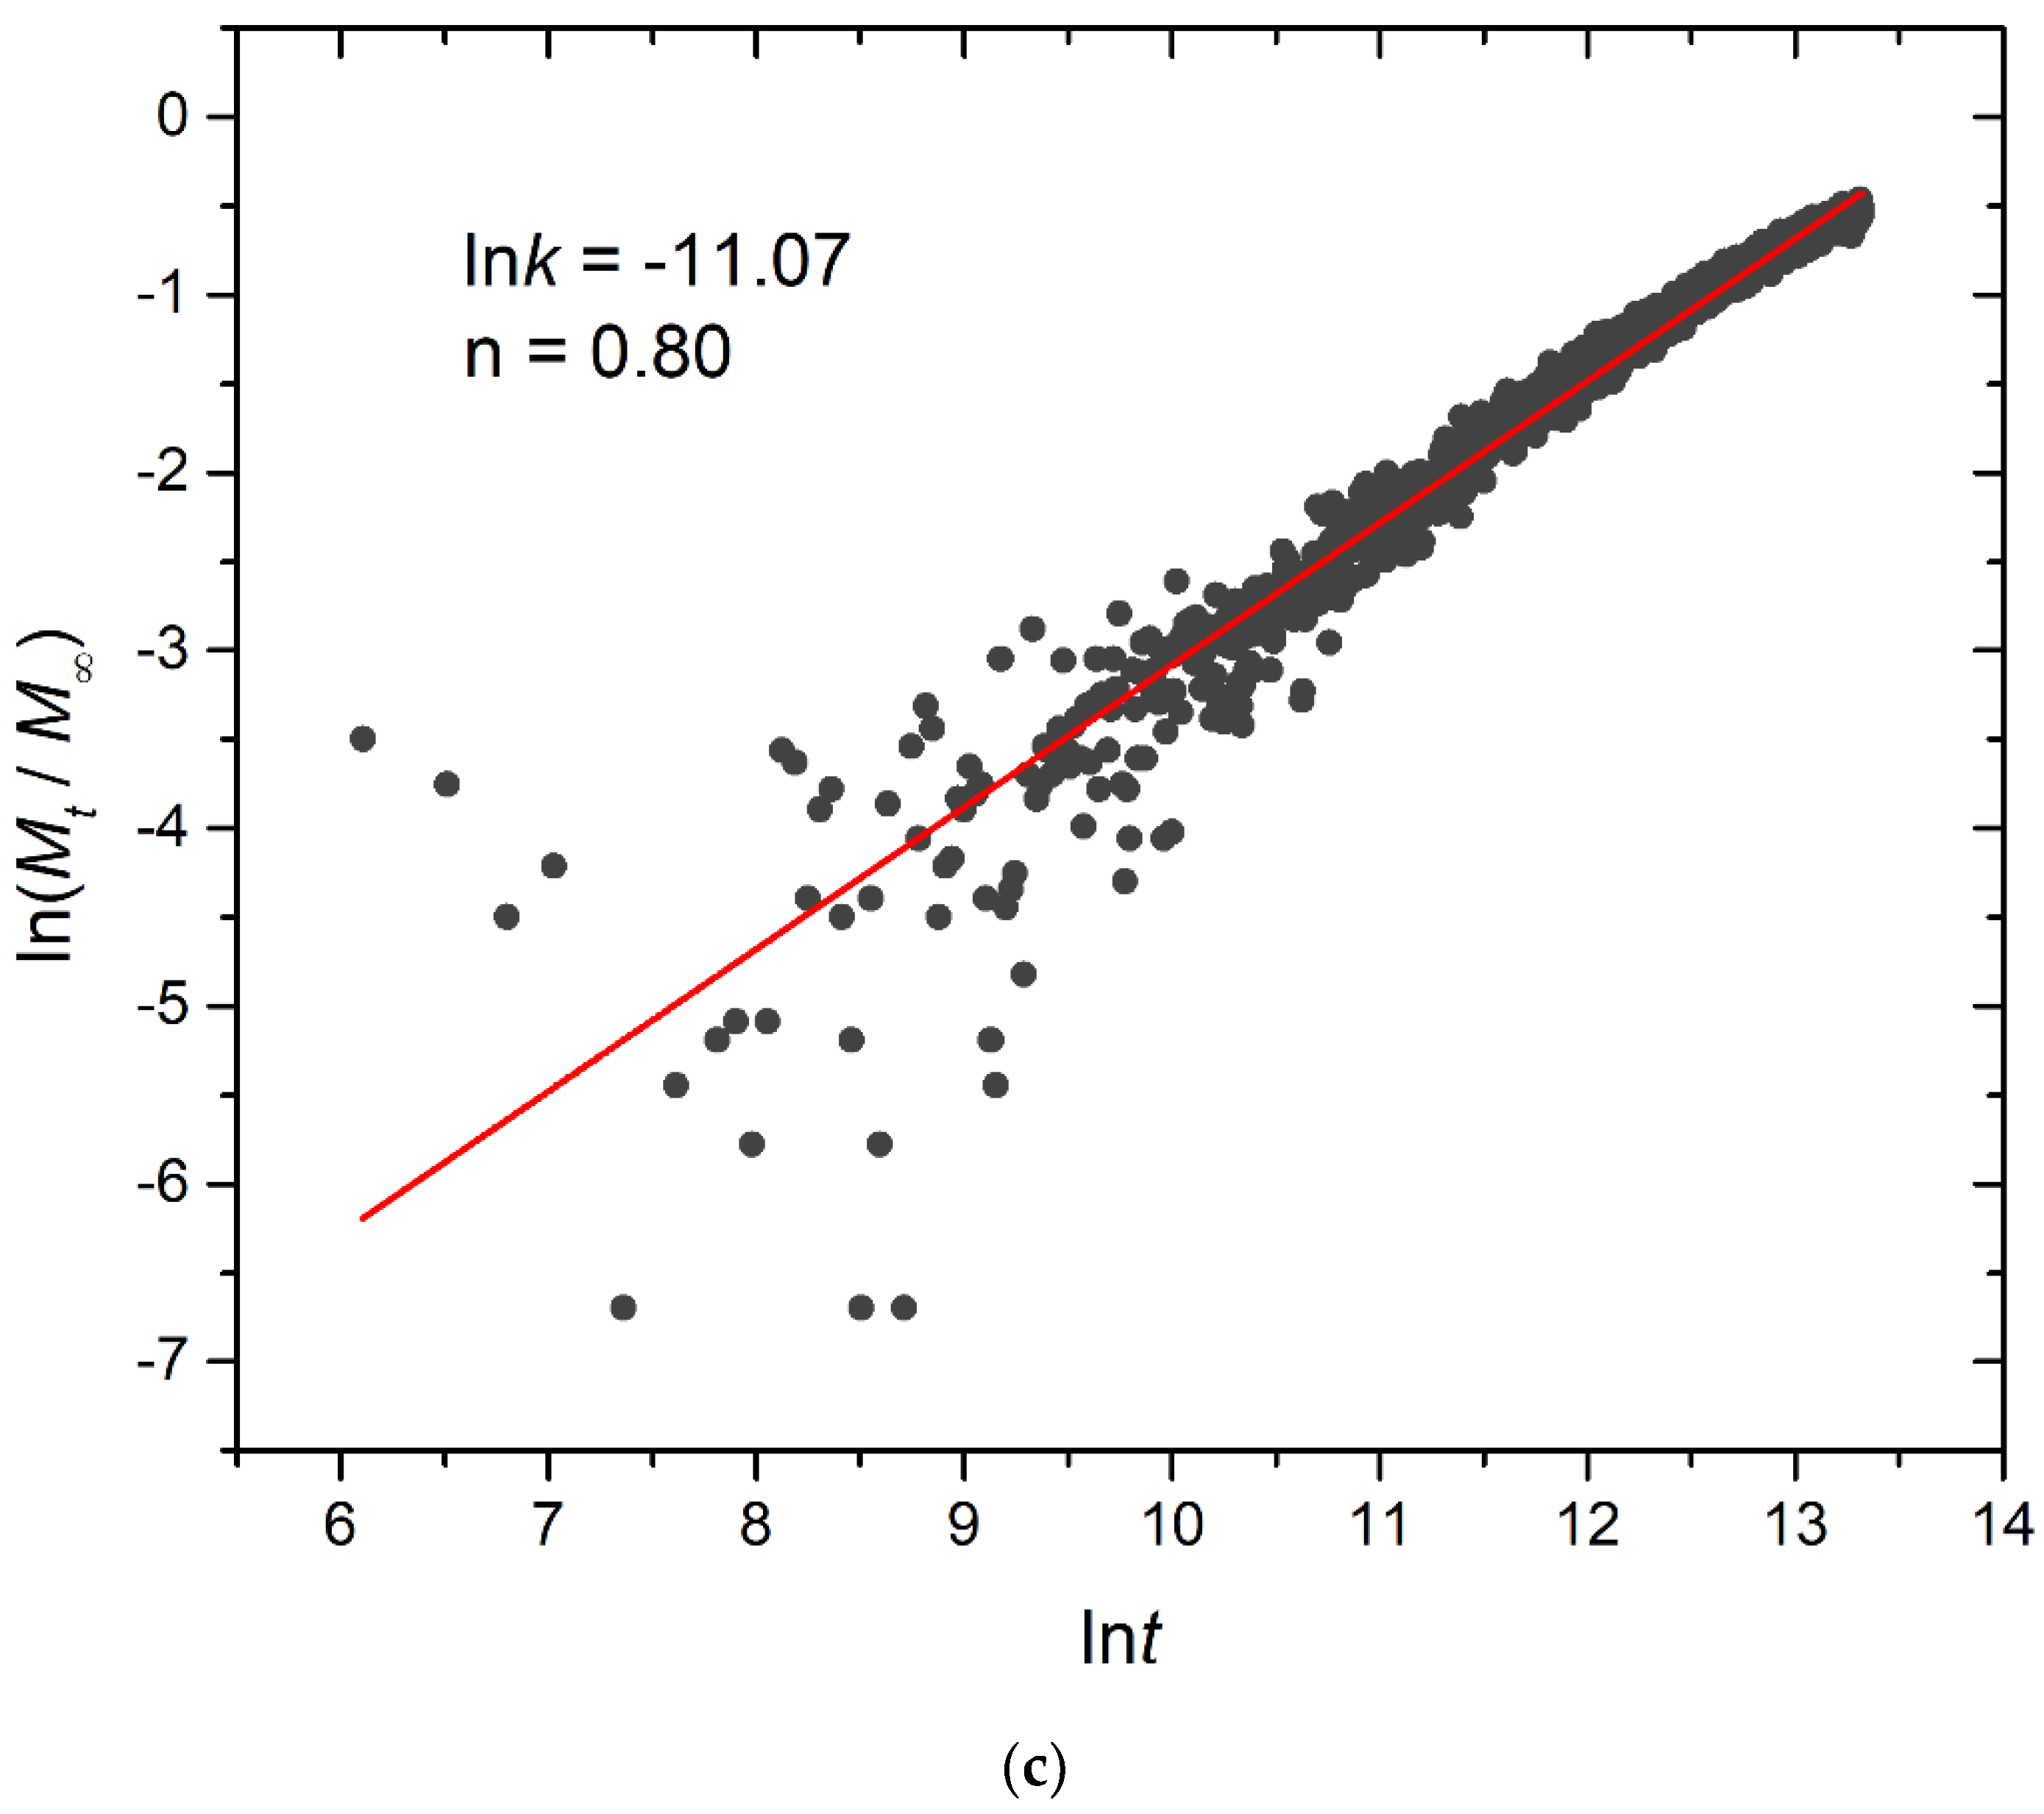
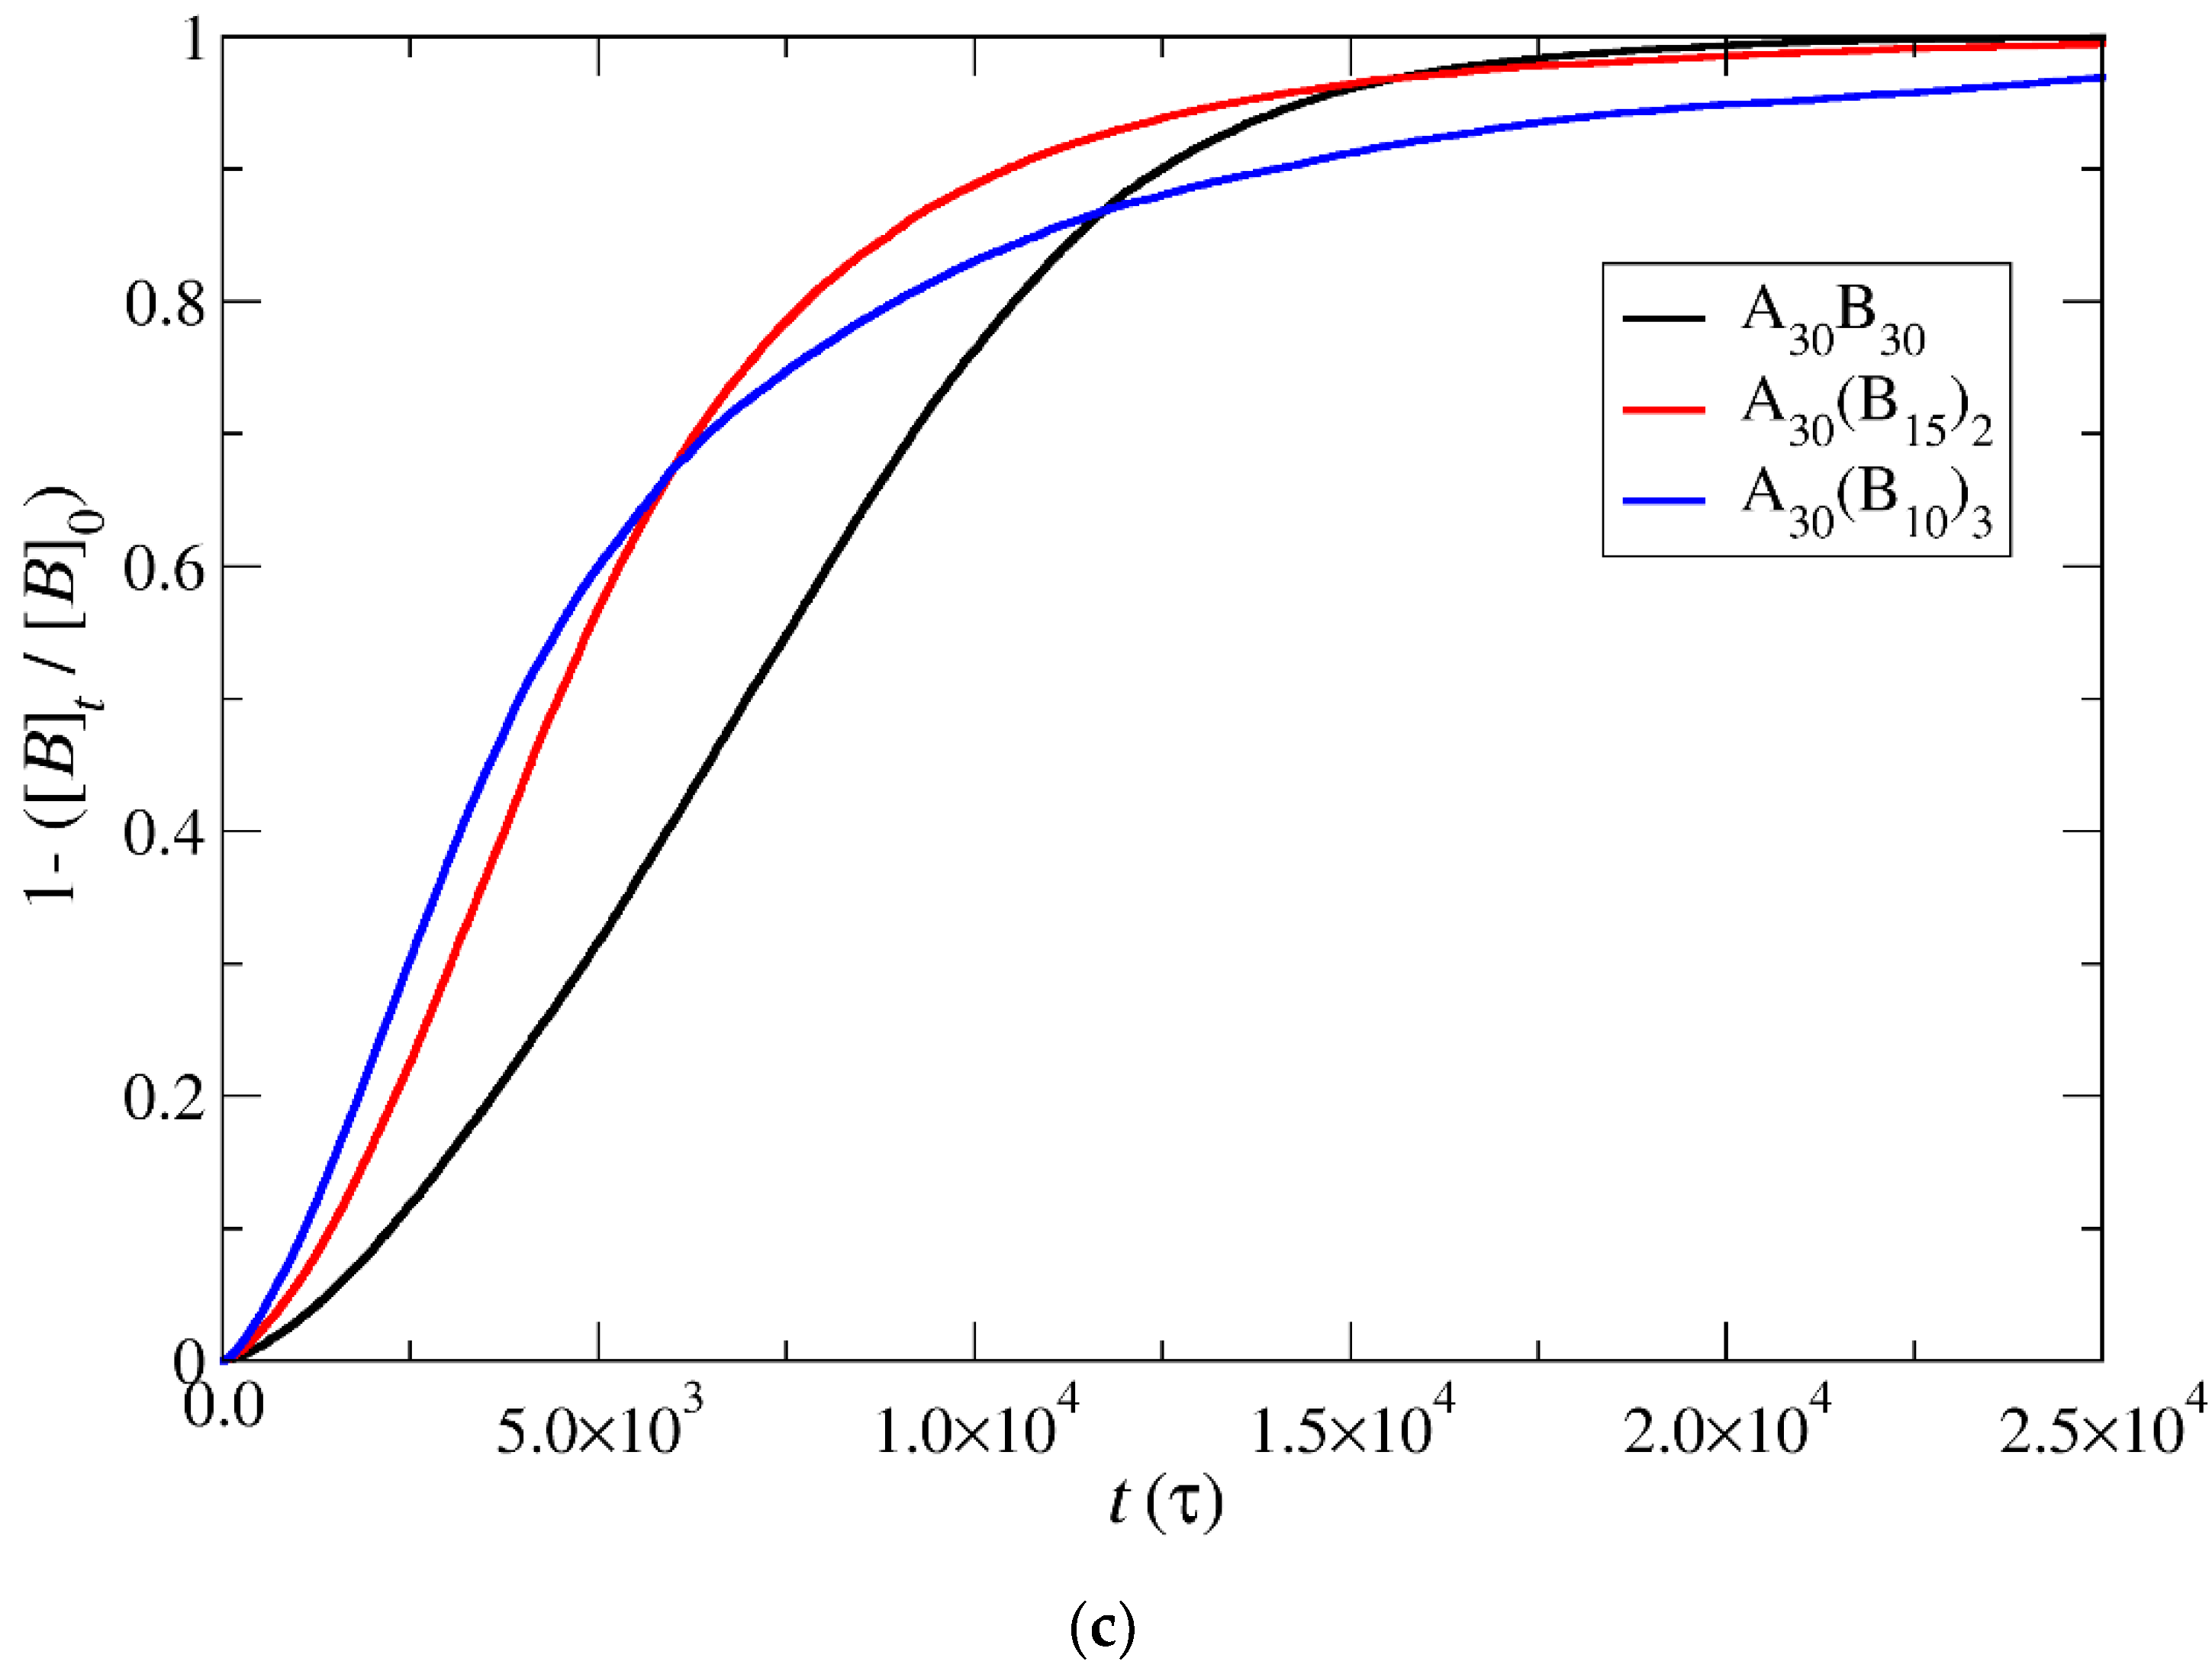
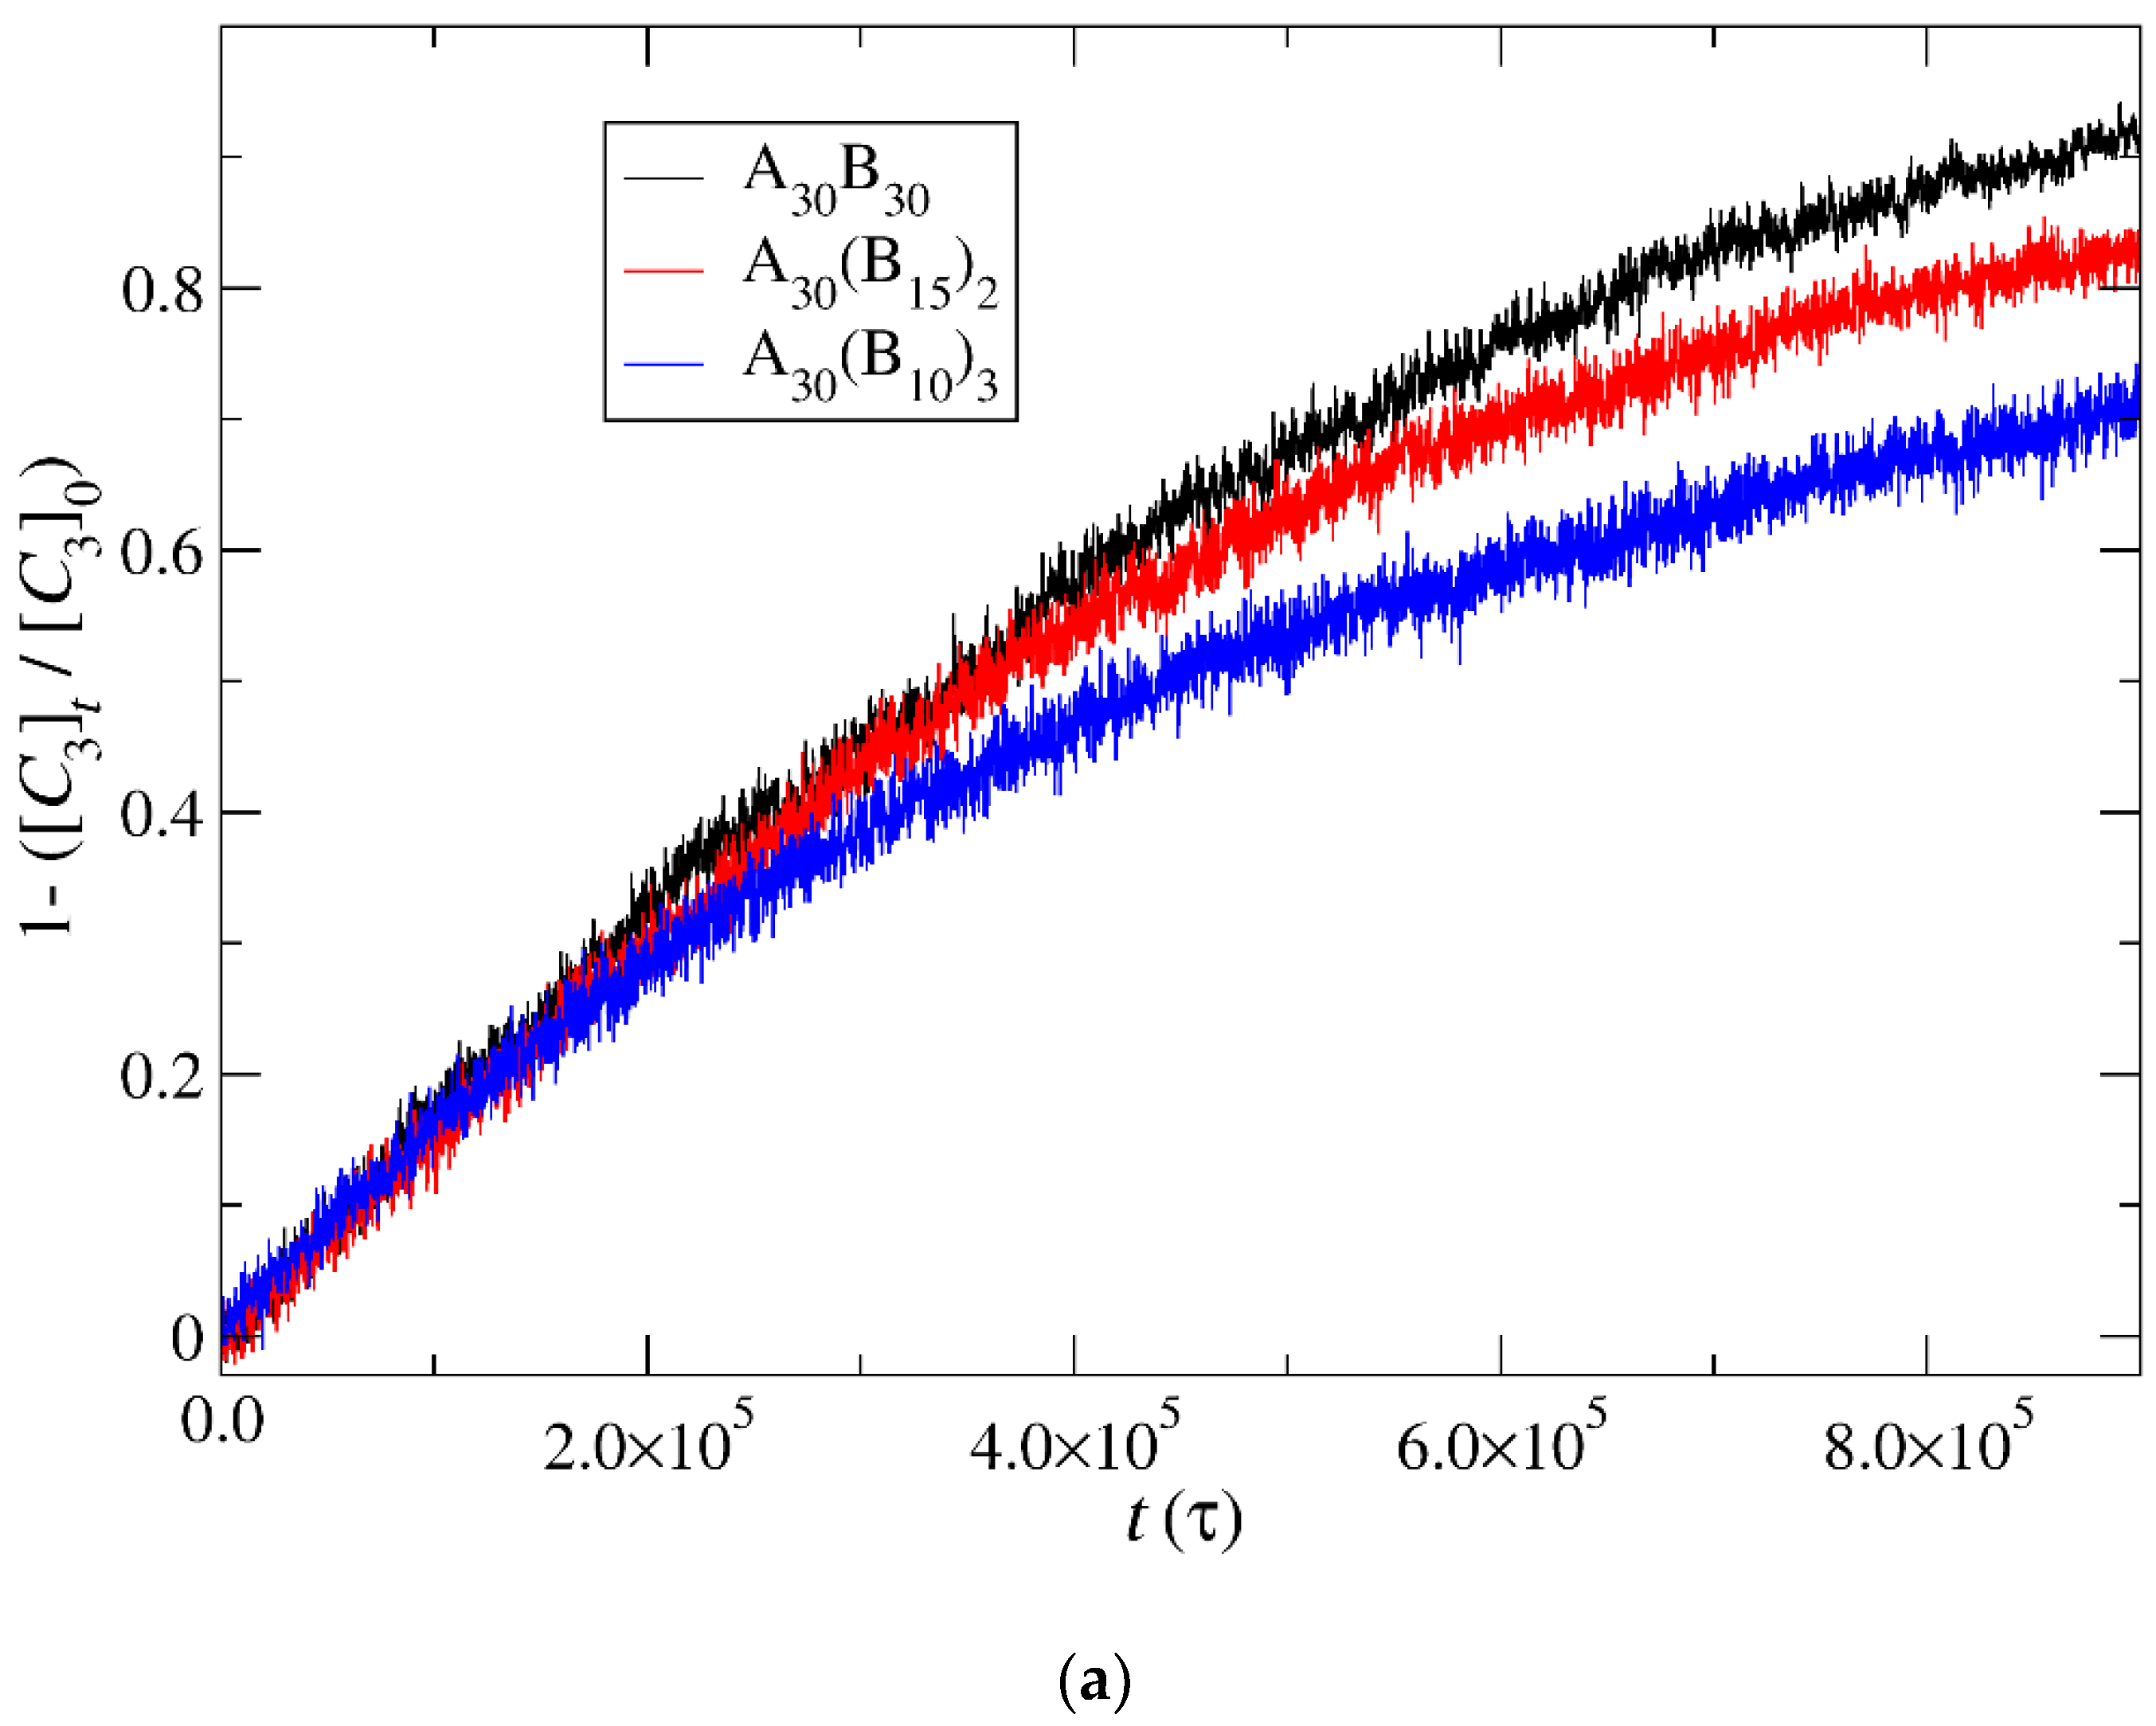
3.2. Kinetics of Depolymerization

The depolymerization and subsequent degradation of loaded micelles were carried out using two distinct concentrations of hydrophobic trigger molecules. The first concentration aligns with the stoichiometry of the total end-cap beads in A30B30, A30(B15)2, and A30(B10)3 copolymer solutions, accounting for 1000, 2000, and 3000 T–type molecules, respectively. The second concentration is maintained at a constant level, with 4000 T–type molecules applied to all copolymer solutions. These trigger molecules were randomly inserted into the simulation box, representing the final snapshot of the trajectory of copolymer comicellization involving cargo C3 molecules. This configuration served as the initial state for the depolymerization process. The introduction of trigger molecules led to an adjustment in overall solution concentration, reaching up to [Φ] = 12.6. The attractive interactions between T–T, B–T, and T–C beads consistently corresponded to T* = 1.8, while the T–A interactions were considered repulsive.
When T–type molecules infiltrate the hydrophobic core of the micelle, they can initiate the rapture of bonds between the hydrophobic end-cap and B–type beads if the distance of T–type molecules is within Rcutoff = 1σ from the end-cap bead, governed by a predetermined reaction probability, RPT. Subsequently, spontaneous head-to-tail depolymerization of hydrophobic B–type beads may occur, guided by a predetermined reaction probability, RPB, and this process takes place without any external stimuli. Simulations were conducted to explore scenarios where the end-cap bond-breaking occurs more easily, equivalently, or more difficultly than the B–B bond (with RPB values of 10−3, 10−4, and RPT values of 10−2, 10−3, and 10−4).
The results depicting the fraction of end-cap bonds broken with RPT = 10−4 and RPB = 10−3 are showcased in Figure 6 for both stoichiometric and constant concentrations of trigger molecules. Notably, the depolymerization of end-cap beads in A30(B10)3 copolymers at a stoichiometric concentration of trigger molecules surpasses the rates observed in A30(B15)2 and A30B30 copolymers. This heightened efficacy is attributed to the doubled and tripled presence of T–type molecules in A30(B10)3 mixtures compared to their counterparts in A30(B15)2 and A30B30 mixtures, thereby increasing the probability of infiltration into the hydrophobic core. Furthermore, the elongated sphere scheme (depicted in Figure 5) of A30(B10)3 micelles contribute to a larger core surface exposed to the solvent compared to other copolymers. This structural characteristic facilitates the penetration of trigger molecules, contributing to the observed faster depolymerization in A30(B10)3 copolymers. Conversely, contrasting trends are noted in the depolymerization process under constant T–type molecule concentration (Figure 6b). The excess of trigger molecules is fourfold, twofold, and 1.5 times higher than the stoichiometric case for A30B30, A30(B15)2, and A30(B10)3 mixtures, respectively, leading to quicker penetration of trigger molecules and depolymerization of linear copolymers followed by miktoarm star copolymers. Various factors, including micelle corrosion, also influence the penetration of trigger molecules into the micelle core and, subsequently, the breaking of the end-cap bonds with B–type beads. Higher values of RPT simply reduce the time for the completion of end-cap removal without affecting the order of copolymer depolymerization in both stoichiometric and constant concentration cases (Figure S1). Similarly, an increase by x times in the T–type molecule concentrations in all copolymer mixtures results in faster end-cap removal without altering the order of copolymer depolymerization (Figure S2).
Under constant and stoichiometric concentrations of trigger molecules, the rate of depolymerization is determined by the slope of the depolymerization curves. When the breaking of the end-cap bond with the B–type bead is more challenging than the bond between B–type beads (RPT = 10−4, RPB = 10−3), the rate of depolymerization for hydrophobic beads is governed by the slower step. Consequently, the depolymerization trends among copolymer architectures align with those observed in the end-cap bond break. Specifically, A30B30 exhibits faster depolymerization, followed by A30(B15)2 and A30(B10)3 mixtures (Figure 7a) for the same reasons outlined earlier. However, at RPT = 10−2 and RPB = 10−3, where the breakage of the bond between B–type beads becomes the slower reaction step, the branching architecture significantly influences the depolymerization process. The head-to-tail depolymerization of B–type beads occurs simultaneously in all branches, resulting in faster depolymerization in A30(B10)3 with three branches, followed by A30(B15)2 and A30B30 with two and one branches, respectively. Notably, when 65% of the total bonds of hydrophobic beads are broken, the depolymerization rate of A30(B15)2 copolymers surpasses that of A30(B10)3 copolymers (Figure 7b). This is attributed to the higher excess of trigger molecules in A30(B15)2 mixtures, which facilitates the faster removal of end-cap beads from the hydrophobic branch. Similarly, the depolymerization rate of A30B30 copolymers exceeds that of A30(B10)3 and A30(B15)2 copolymers when the fraction of total bond breakage reaches 0.85 and 0.95, respectively. Beyond these values, the order of depolymerization rates reverts to the pattern observed at RPT = 10−4 and RPB = 10−3. In actuality, the reversal in the depolymerization order occurs in the cases of RPT = 10−4 and RPB = 10−3, but the crossovers between the depolymerization rates are confined to a narrow range, specifically between 0.03 and 0.06. When RPT = RPB = 10−3, the depolymerization rate of hydrophobic beads for different architectures is determined by two opposite factors: the excess of trigger molecules, which increases as the number of hydrophobic branches or blocks decreases, and the simultaneous head-to-tail depolymerization of beads, which intensifies with an increasing number of branches. As depicted in Figure 7c, the crossover of depolymerization curves occurs within the range of 0.20 to 0.55. Beyond this fraction, A30B30 exhibits faster depolymerization, followed by A30(B15)2 and A30(B10)3 mixtures.
In the case of depolymerization of hydrophobic beads under stoichiometric concentration of T–type molecules with the end-cap beads (Figure 8), the rate of depolymerization is consistently faster in A30(B10)3 followed by A30(B15)2 and A30B30 mixtures. This can be attributed to the same factors explained earlier in the context of end-cap depolymerization, coupled with the higher number of branches that are potentially subject to simultaneous head-to-tail depolymerization of B–type beads.

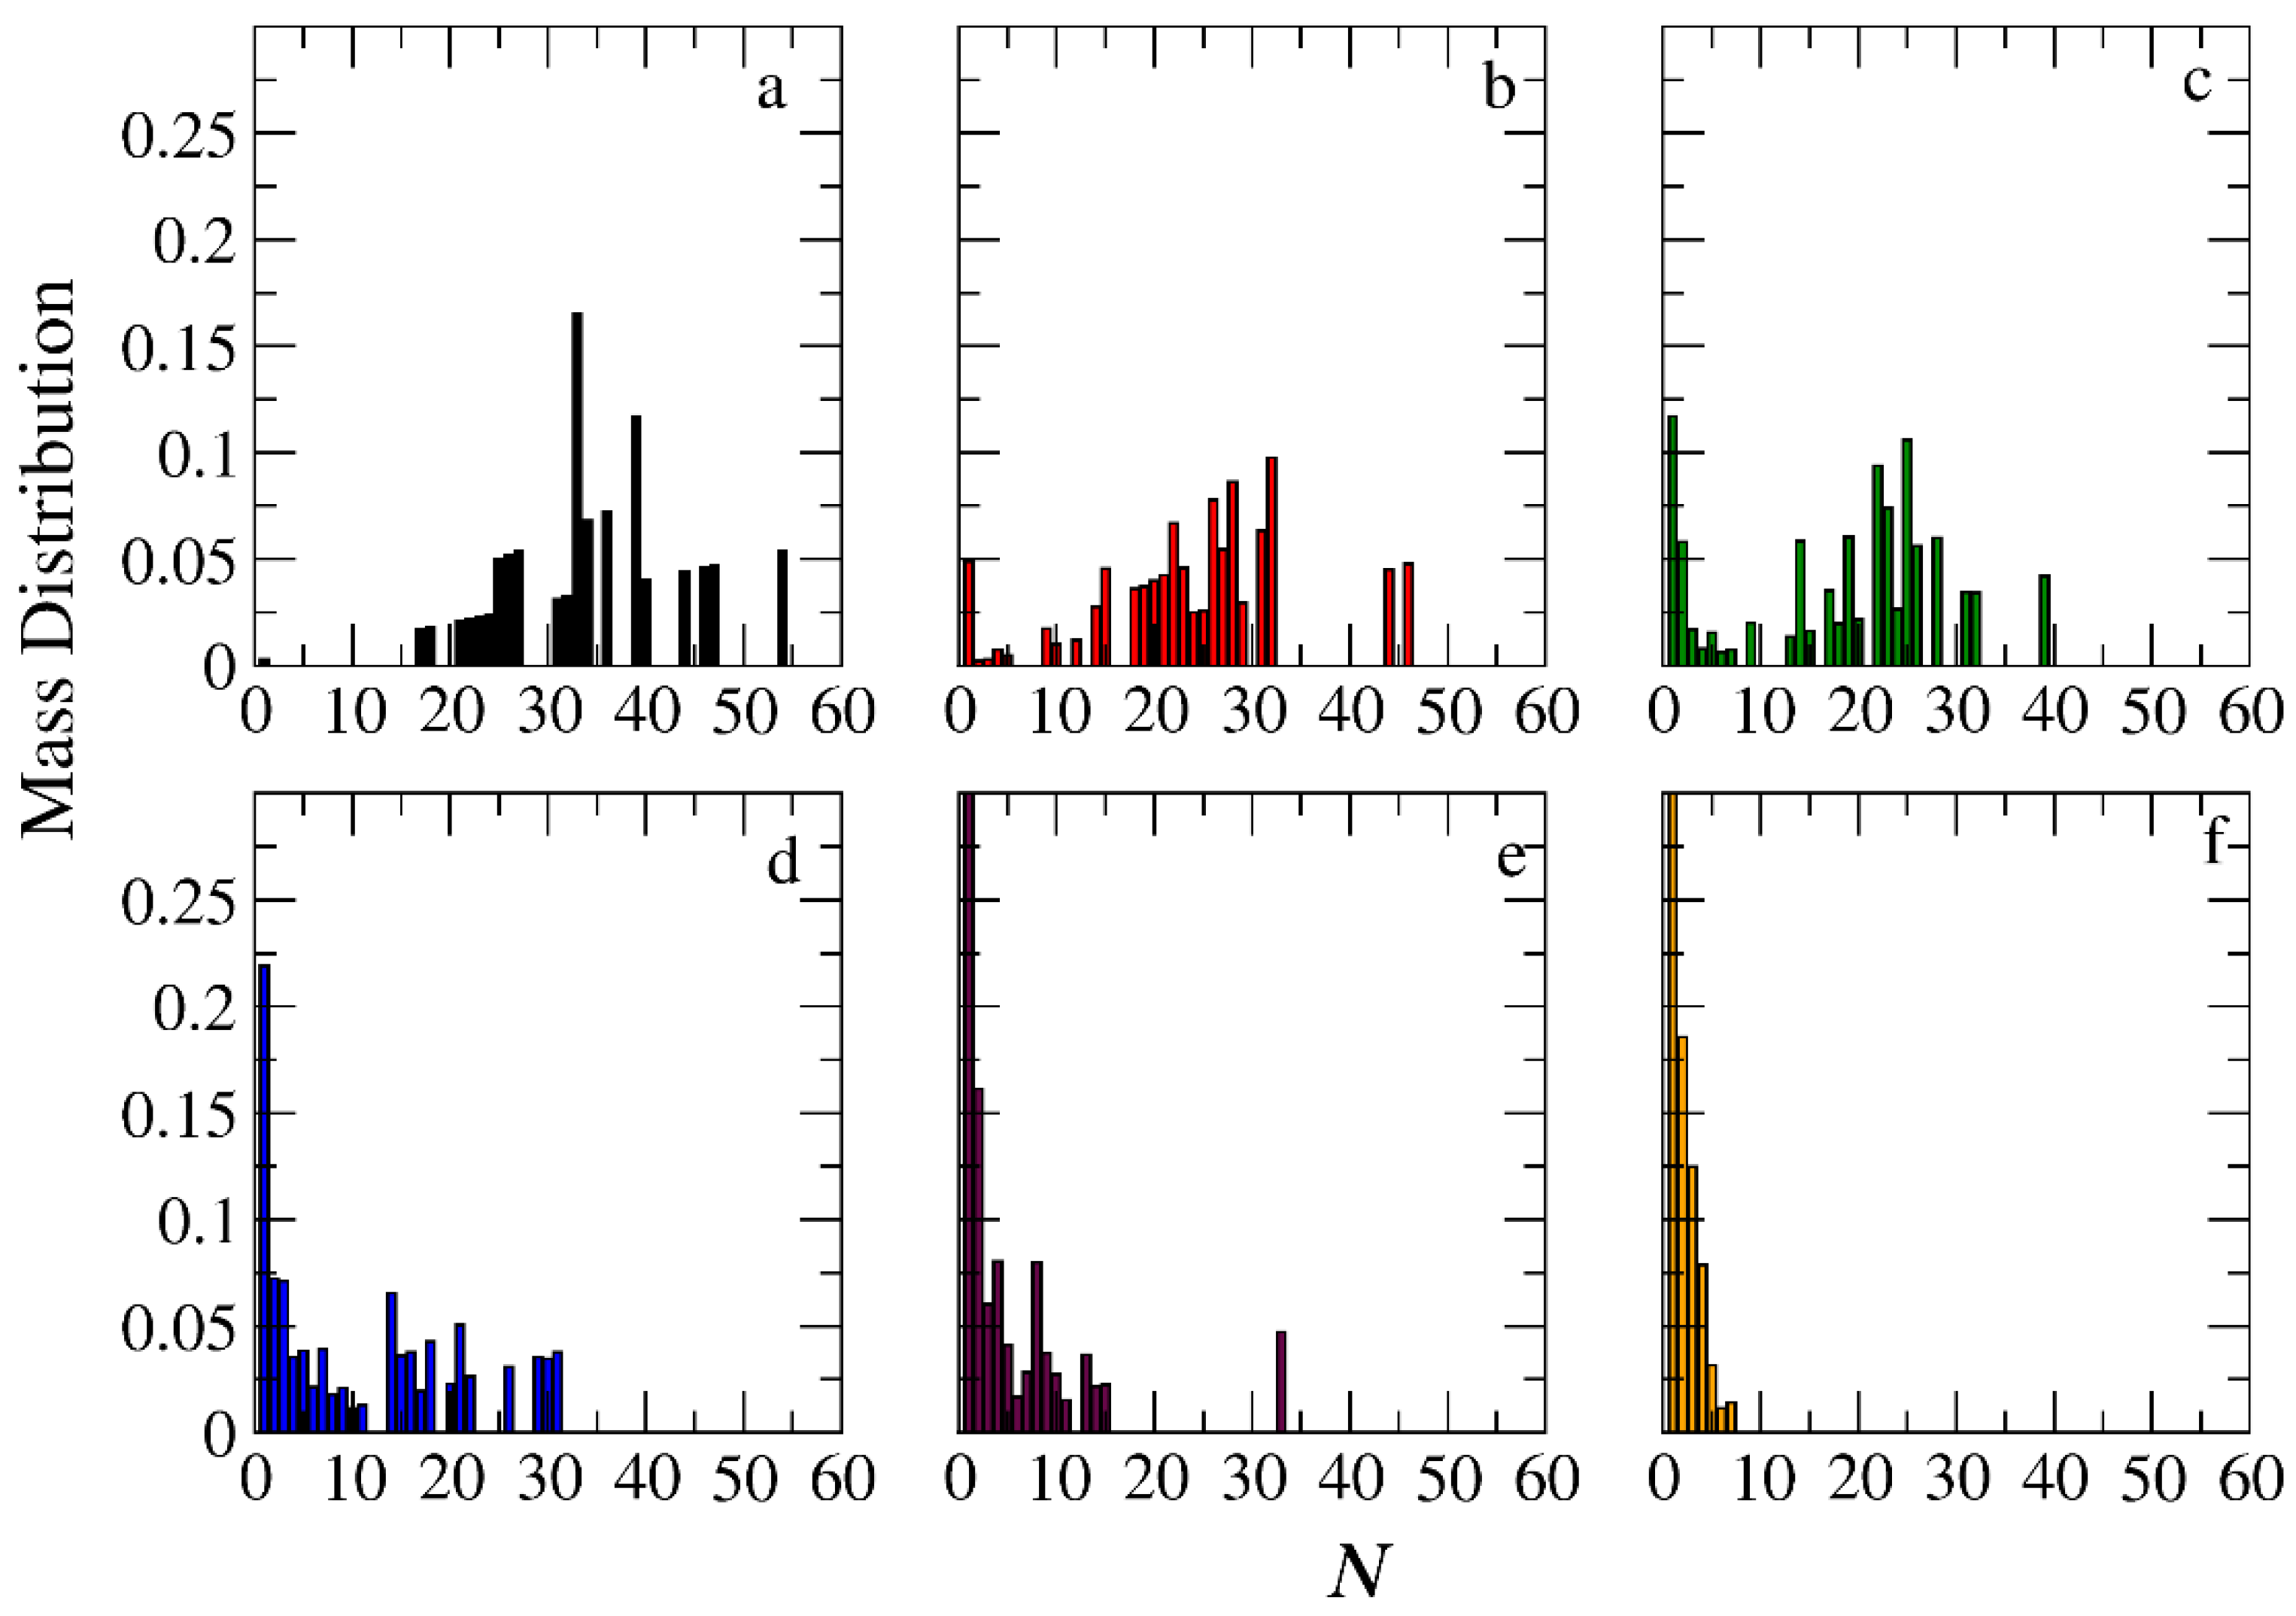
3.3. Demicellization

The depolymerization of hydrophobic blocks or branches in a head-to-tail fashion results in copolymer chains that are either shorter or lack hydrophobic blocks or branches. The reduction in hydrophobic content within the copolymer corresponds to an increase in the critical micelle concentration. Consequently, these chains migrate into the solution, triggering the gradual demicellization of the mixtures. Figure 9, Figure 10 and Figure 11 and Figures S3–S8 present the results regarding the micelle mass distribution at various fractions of bond breakage between hydrophobic beads (approximately 0, 0.15, 0.30, 0.45, 0.60, and 0.75) for stochiometric and constant concentrations of trigger molecules. Micelle mass distributions were computed from a single snapshot, and their normalization is based on the total micelle content at the specific snapshot. Copolymer chains devoid of B–type beads lose the ability to participate in micelles and are excluded from the count as single chains in the micelle distribution. Across all figures, it is evident that the aggregation number of micelles (N) progressively decreases with simulation time. This decline signifies the gradual loss of copolymer chains from micelles without micelle breaking.
In the case of A30B30 copolymers with stoichiometric mixtures of trigger molecules and the end-cap beads (RPT = 10−4 and RPB = 10−3), Figure 9 illustrates that all chains leaving the micelles consist solely of A–type beads. This is attributed to the faster depolymerization of B–type beads in the B–type block of a copolymer chain due to the higher RPB compared to RPT. Conversely, in the case of single miktoarm copolymers, the chains exiting the micelles are composed of B–type branches, characterized by a reduced content of B–type beads (Figure 10 and Figure 11). At a bond break fraction of 0.68, the aggregation number of A30B30 copolymer micelles remains substantial. However, in A30(B15)2 and even more so in A30(B10)3 copolymers, the aggregation numbers diminish at a similar bond break fraction.
The same trends are observed in the micelle mass distribution for mixtures with a constant concentration of trigger molecules (Figures S3–S5). However, at the same bond break fraction, the aggregation numbers are noticeably smaller. When reaction probabilities for both reactions are equal (RPT = RPB = 10−3), micelles and single corroded copolymer chains are in equilibrium, but the aggregation number of micelles is smaller compared to the case with RPT = 10−4 and RPB = 10−3 at the same constant concentration. Increasing the reaction probability of end-cap bonds (RPT = 10−2 and RPB = 10−3) leads to even smaller aggregation numbers for micelles of all architectures. Nonetheless, A30B30 micelles consistently exhibit higher aggregation numbers than A30(B15)2 and A30(B10)3 for the same bond break fraction (Figures S6–S8).

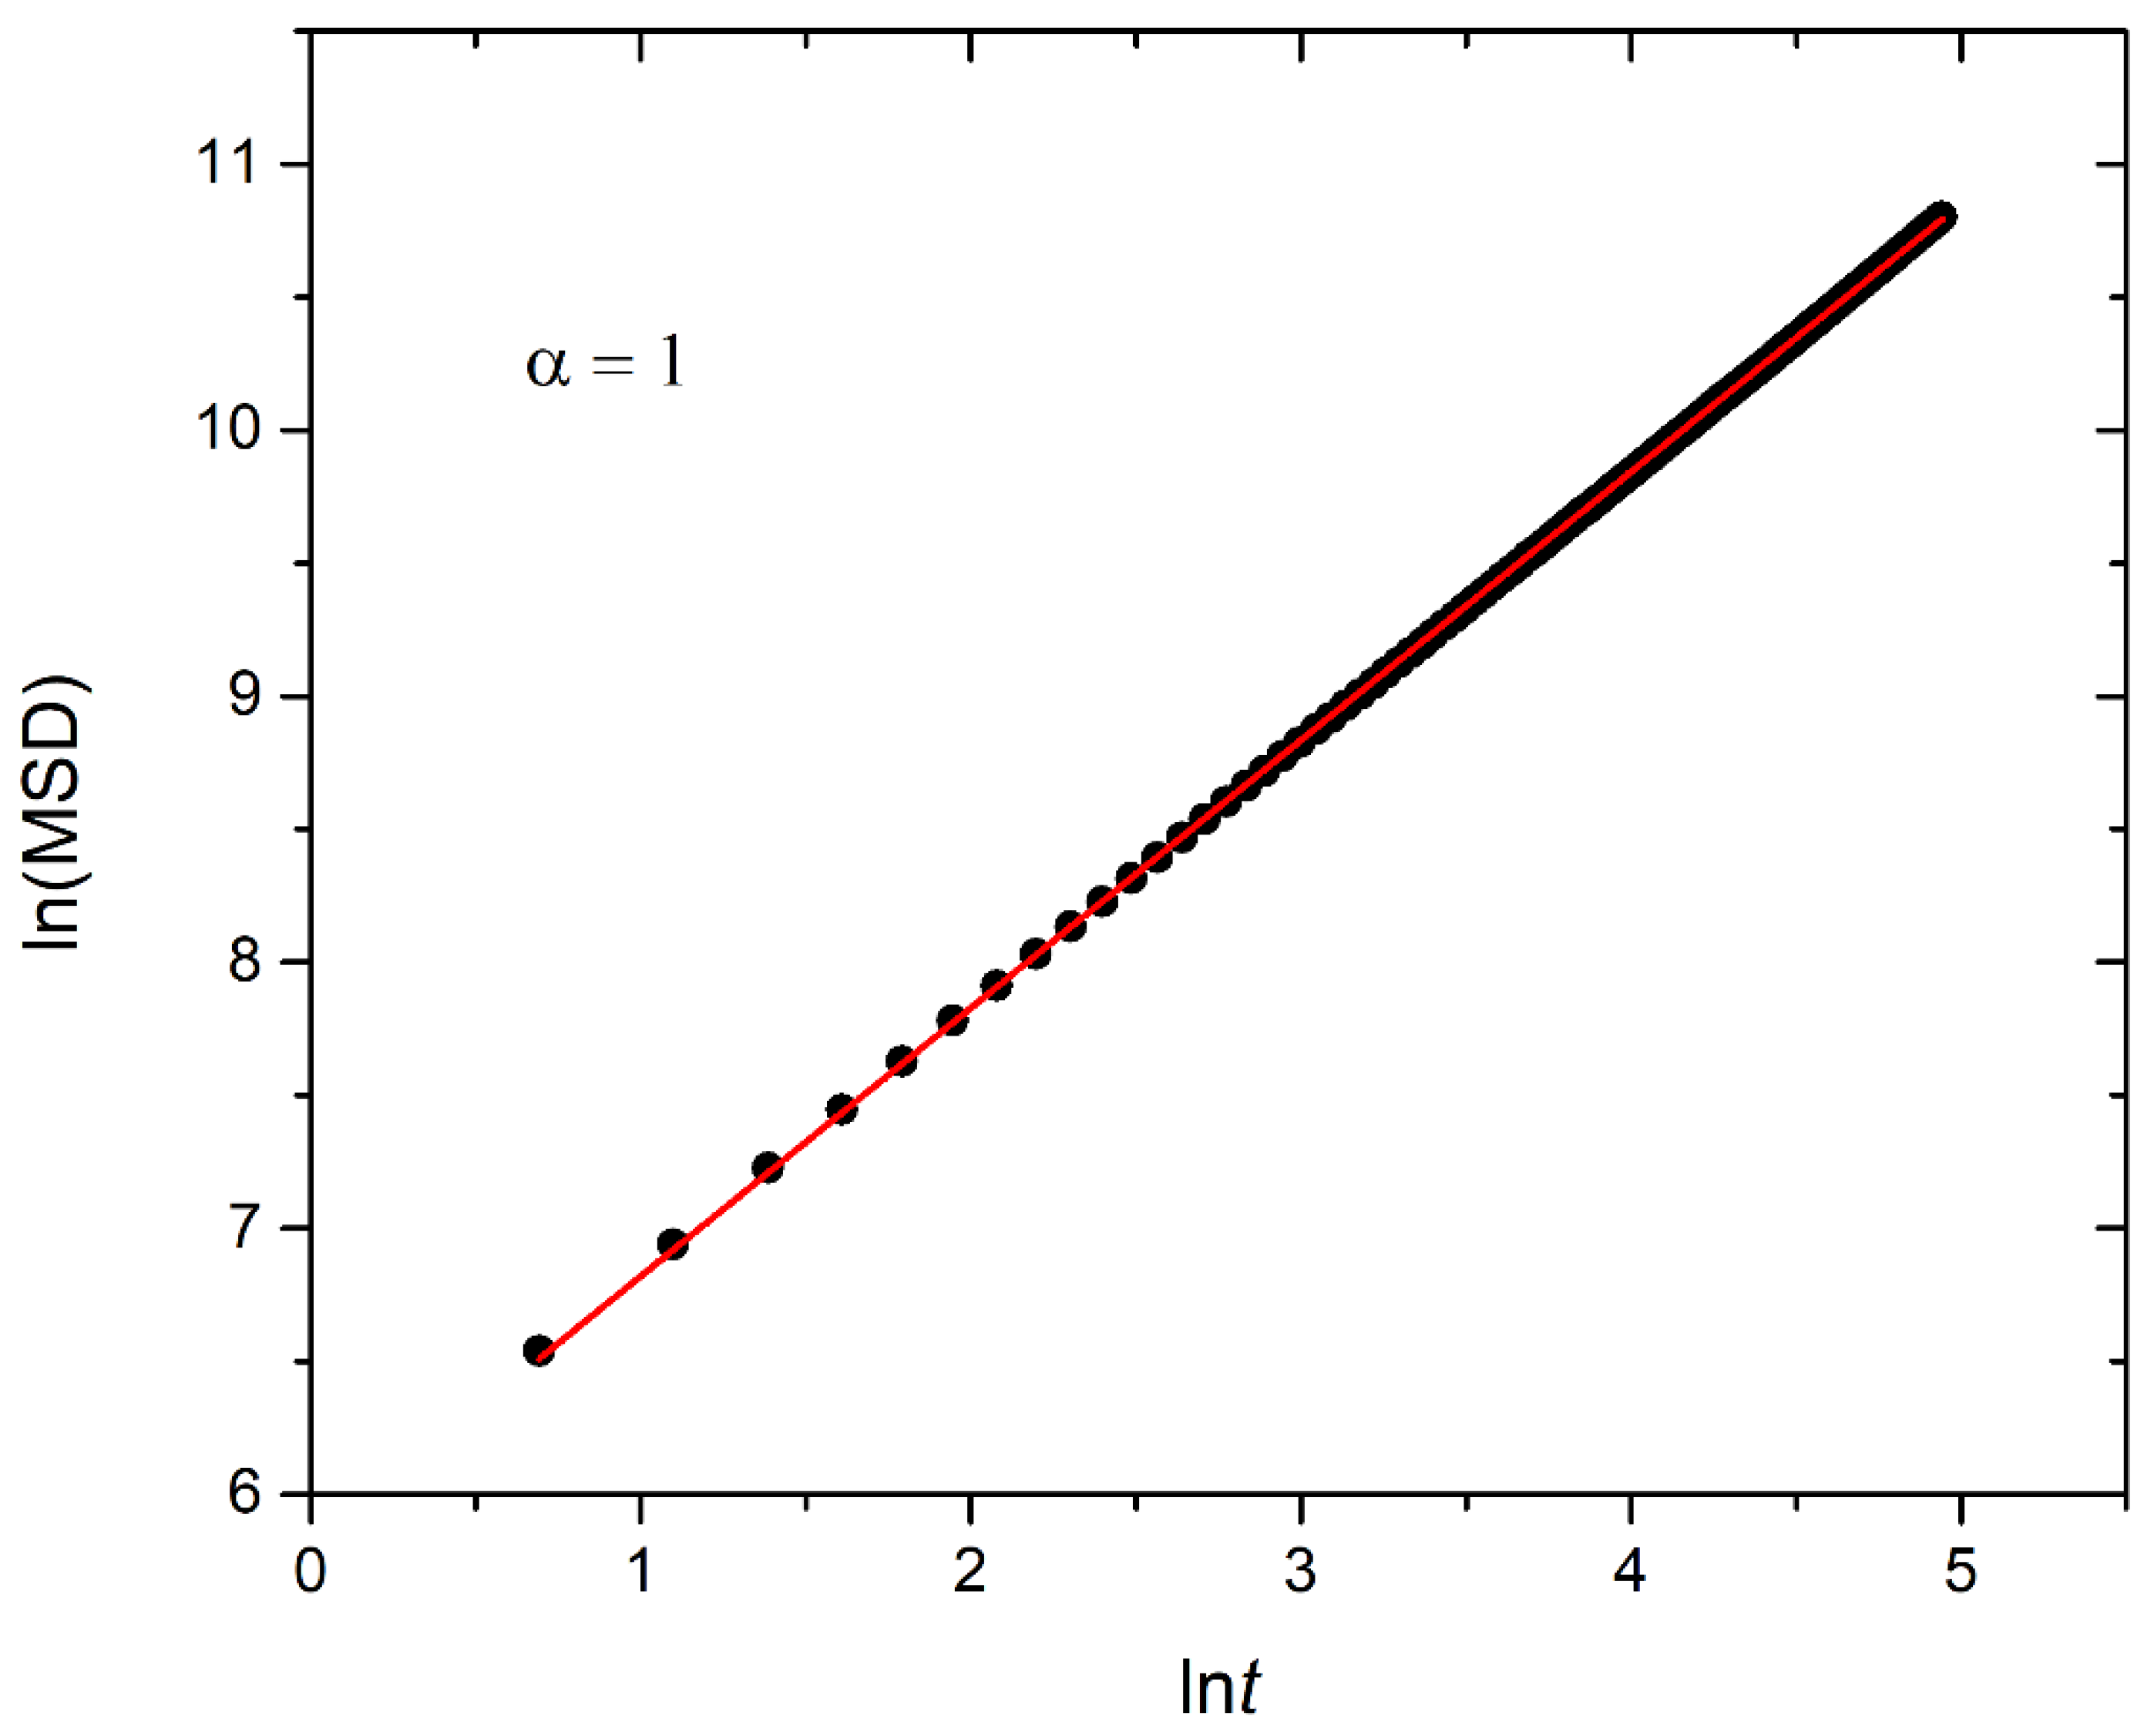
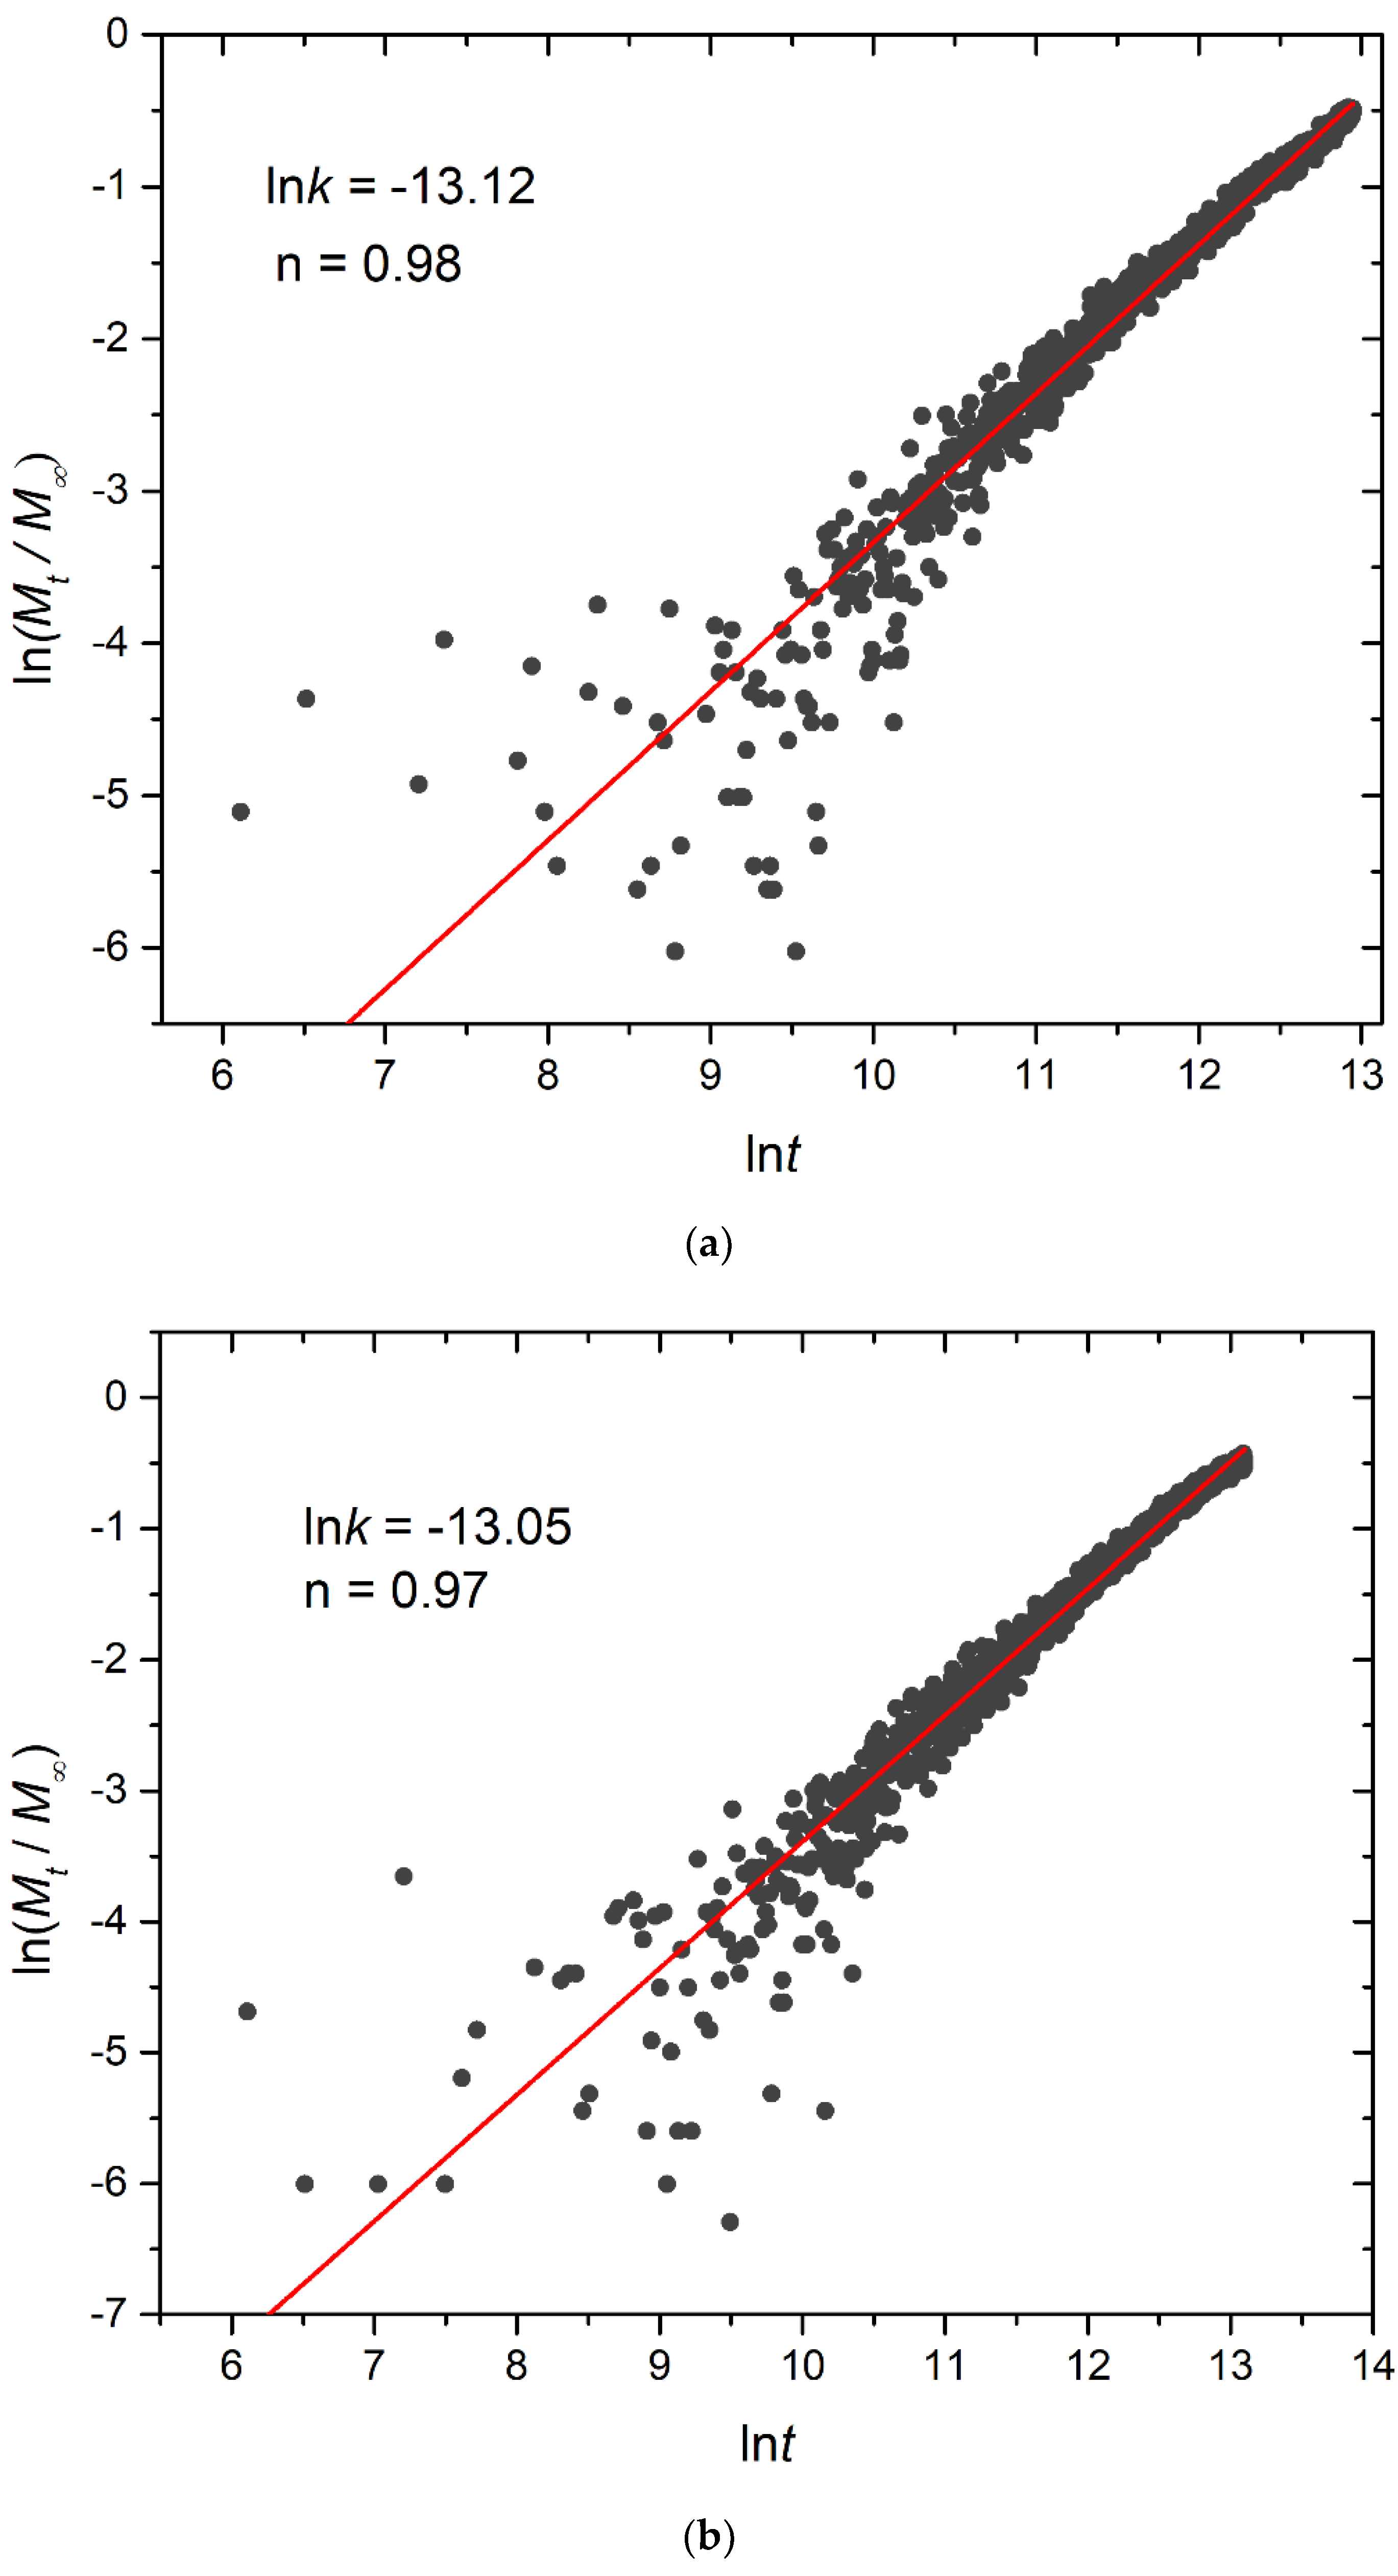
3.4. Kinetics of Cargo Release

In this section, the mobility of cargo molecules was investigated through the calculation of their mean squared displacement (MSD) as a function of time. The study utilized 90 cargo molecules residing within a micelle formed by A30B30 copolymers with N = 50 for mixtures with RPT = 10−4 and RPB = 10−3, maintaining a constant concentration of trigger molecules. The results for MSD were averaged across the cargo tracers and are depicted in Figure 12. The exponent α corresponding to the scaling behavior of time was determined to be unity, suggesting normal diffusion in the release of cargo molecules. Notably, even before demicellization occurred in the tracer micelle, a substantial exchange of cargo molecules with different micelles and the solution was observed. Approximately, 18% of tracer molecules left the tracer micelle, while others were inserted, maintaining the number of encapsulation cargo molecules nearly constant. As the micelles underwent depolymerization and corrosion, the number of encapsulated cargo molecules decreased, while the number of molecules released into the solution increased. The fraction ratio of released cargo molecules to the initially encapsulated ones in all micelles in the mixture is illustrated as a function of time in Figure 13 and Figure S9. The observed noise in the curves is a result of released cargo molecules or others from the solution being inserted into other micelles. In general, the cargo release rates mirror the depolymerization rates of copolymers. Specifically, at a constant concentration of trigger molecules and RPT = 10−4, RPB = 10−3, the release of cargo molecules is faster in linear A30B30 followed by A30(B15)2 and A30(B10)3 miktoarm copolymers. Conversely, for stoichiometric concentrations of trigger molecules with the end-cap beads, the release of cargo molecules is faster in A30(B10)3 followed by A30(B15)2 and linear A30B30 copolymers. This trend aligns with the decreasing hydrophobic content of B–type beads in micelles due to depolymerization and demicellization, allowing fewer hydrophobic cargo molecules to be accommodated. However, the fraction of cargo molecules released to the solution is not directly proportional to the fraction of depolymerized B–type beads. For a 0.60 degradation of hydrophobic beads, the fraction of cargo release is approximately 0.34, 0.39, and 0.43 for A30B30, A30(B15)2, and A30(B10)3, respectively, at both stoichiometric and constant concentrations of trigger molecules with RPT = 10−4 and RPB = 10−3. This is attributed to the existence of micelles with higher N in A30B30 than in the miktoarm copolymer mixtures, allowing them to accommodate a larger number of cargo molecules (Figure 9, Figure 10 and Figure 11).
To quantitatively analyze the release of cargo molecules, the non-linear Korsmeyer–Peppas equation was employed [32,33]:
Μ t Μ = k t n
In this equation, Mt/Μ signifies the fraction of released cargo molecules, t denotes the release time, k is the kinetic constant (with dimensions of τ−1), and n is the diffusional exponent for cargo release (dimensionless). The kinetic constant k primarily conveys information about the drug formulation’s characteristics, particularly those related to micelles, whereas n is related to the drug release mechanism. For 0.45 < n < 1, the release is non-Fickian, and both diffusion and micelle relaxation–corrosion contribute to the release of the mechanism [33]. The analysis focused on the initial 60% of the release curve. Plots for constant and stoichiometric trigger molecule concentrations (RPT = 10−4 and RPB = 10−3) are presented in Figure 14 and Figure S10, respectively. Notably, for constant trigger molecule concentrations, n values exhibit a decreasing trend from 0.98 to 0.97 to 0.80 as the number of hydrophobic blocks or branches increases, whereas the constant k values manifest the opposite trend. For stoichiometric mixtures, the variation of n is non-monotonic, with values ranging from 0.79 for A30B30, 1.18 for A30(B15)2, to 0.79 for A30(B10)3, respectively, and similarly for k. Consequently, our findings strongly suggest that the release of cargo from degradable micelles follows a non-Fickian pattern, where both diffusion and corrosion mechanisms contribute to the release process. This observation aligns with the consistent n values obtained in a previous study involving the cationic drug release from four-arm starblock copolymers, where the release behavior was dominated by chain relaxation–erosion induced by ion exchange that was dependent on pH [34]. A preview of the simulation box demonstrating depolymerization and cargo release is showcased in Videos S1 and S2.
Our results provide a qualitative description of the impact of copolymer architectures on demicellization and cargo release through head-to-tail depolymerization. However, for a quantitative analysis and comparison with experimental data, the MARTINI coarse-grained force field [35] proves to be more suitable. Therefore, such an investigation will be the focus of our future research in this field.

4. Conclusions

Our study aimed to investigate how the architecture of copolymers impacts demicellization and cargo release through head-to-tail depolymerization triggered by specific stimuli. Using comprehensive molecular dynamics simulations, we analyzed linear A30B30 copolymers and miktoarm star copolymers A30(B15)2 and A30(B10)3, differing in the number of hydrophobic arms and end-caps. The depolymerization process involved two steps: the rupture of bonds between hydrophobic end-caps and B–type beads initiated by T–type molecules (with predefined reaction probability RPT), followed by depolymerization in the absence of stimuli (with reaction probability RPB). Our investigation spanned various concentrations of trigger molecules relative to end-cap beads, exploring a range of RPT and RPB values.
Our findings demonstrated that micelle aggregation numbers (Np) were higher for linear copolymers and decreased with an increase in the number of arms in miktoarm copolymers. Although copolymer architecture did not affect the micelle loading capacity (LC), loaded micelles exhibited increased Np and radius of gyration with higher numbers of hydrophobic branches. The depolymerization rate of hydrophobic beads was consistently faster in A30(B10)3 copolymers, followed by A30(B15)2 and A30B30 mixtures. This rate depended on the excess of trigger molecules and simultaneous head-to-tail depolymerization, with different copolymer compositions exhibiting varying trends. Cargo release rates generally mirrored depolymerization rates, but the fraction of released cargo was not directly proportional to depolymerized B–type beads. Utilizing the non-linear Korsmeyer–Peppas equation, our results indicated a non-Fickian release pattern where both diffusion and corrosion mechanisms contributed. These insights into copolymer behavior can guide the design of chains with more triggering groups, facilitating the development of delivery vehicles for diverse applications in biomedicine and environmental science.

Supplementary Materials

The following supporting information can be downloaded at: https://www.mdpi.com/article/10.3390/polym16081127/s1, Table S1: The number of encapsulated cargo molecules in micelles; Table S2: The preferential aggregation number (Np), the mean squared radius and gyration (<Rg2>), and the shape asymmetry parameter (κ2) of micelles; Figure S1: Depolymerization fraction of end cap beads for constant trigger molecules concentration; Figure S2: Depolymerization fraction of end cap (ec) beads for 10 times the stoichiometric trigger molecules concentration; Figure S3: Mass distribution of micelles formed by linear A30B30 copolymers across various time points; Figure S4: Mass distribution of micelles formed by miktoarm A30(B15)2 copolymers across various time points; Figure S5: Mass distribution of micelles formed by miktoarm A30(B10)3 copolymers across various time points; Figure S6: Mass distribution of micelles formed by linear A30B30 copolymers across various time points (RPT = 10−2 and RPB = 10−3); Figure S7: Mass distribution of micelles formed by miktoarm A30(B15)2 copolymers across various time points (RPT = 10−2 and RPB = 10−3); Figure S8: Mass distribution of micelles formed by miktoarm A30(B10)3 copolymers across various time points (RPT = 10−2 and RPB = 10−3); Figure S9: Cargo molecules release fraction from A30B30, A30(B15)2, and A30(B10)3 copolymer mixtures plotted against time; Figure S10: Plot depicting the fraction of released cargo molecules against time for (a) linear A30B30, (b) miktoarm A30(B15)2, and (c) miktoarm A30(B10)3 copolymers; Video S1: A preview of simulation box showing the depolymerization of hydrophobic (red) beads in A30B30 copolymer mixtures; Video S2: A preview of simulation box showing the release of cargo molecules (green) in A30B30 copolymer mixtures.

Author Contributions

Conceptualization, C.V.; Software, C.G. and A.G.; Formal analysis, C.G.; Data curation, C.G.; Writing—original draft, C.V.; Supervision, C.V.; Project administration, C.V. All authors have read and agreed to the published version of the manuscript.

Funding

This work was supported (a) by computational time granted from the Greek Research & Technology Network (GRNET) in the National HPC facility ARIS under project ID pr014023–PISSA_Depolymerization. (b) by project “Dioni: Computing Infrastructure for Big-Data Processing and Analysis” (MIS No. 5047222), co-funded by the European Union (ERDF) and Greece through the Operational Program “Competitiveness, Entrepreneurship and Innovation”, NSRF 2014-2020.

Institutional Review Board Statement

Not applicable.

Data Availability Statement

Data are contained within the article.

Conflicts of Interest

The authors declare no conflicts of interest.

References

  1. Kulkarni, J.A.; Witzigmann, D.; Thomson, S.B.; Chen, S.; Leavitt, B.R.; Cullis, P.R.; van der Meel, R. The Current Landscape of Nucleic Acid Therapeutics. Nat. Nanotechnol. 2021, 16, 630–643. [Google Scholar] [CrossRef] [PubMed]
  2. Sinani, G.; Durgun, M.E.; Cevher, E.; Özsoy, Y. Polymeric-Micelle-Based Delivery Systems for Nucleic Acids. Pharmaceutics 2023, 15, 2021. [Google Scholar] [CrossRef] [PubMed]
  3. Tanbour, R.; Martins, A.M.; Pitt, W.G.; Husseini, G.A. Drug Delivery Systems Based on Polymeric Micelles and Ultrasound: A Review. Curr. Pharm. Des. 2016, 22, 2796–2807. [Google Scholar] [CrossRef] [PubMed]
  4. Negut, I.; Bita, B. Polymeric Micellar Systems—A Special Emphasis on “Smart” Drug Delivery. Pharmaceutics 2023, 15, 976. [Google Scholar] [CrossRef] [PubMed]
  5. Li, Z.; Liu, M.; Ke, L.; Wang, L.J.; Wu, C.; Li, C.; Li, Z.; Wu, Y.L. Flexible Polymeric Nanosized Micelles for Ophthalmic Drug Delivery: Research Progress in the Last Three Years. Nanoscale Adv. 2021, 3, 5240–5254. [Google Scholar] [CrossRef] [PubMed]
  6. Sun, C.; Lu, J.; Wang, J.; Hao, P.; Li, C.; Qi, L.; Yang, L.; He, B.; Zhong, Z.; Hao, N. Redox-Sensitive Polymeric Micelles with Aggregation-Induced Emission for Bioimaging and Delivery of Anticancer Drugs. J. Nanobiotechnol. 2021, 19, 14. [Google Scholar] [CrossRef] [PubMed]
  7. Gioldasis, C.; Gergidis, L.N.; Vlahos, C. Micellization through Complexation of Oppositely Charged Diblock Copolymers: Effects of Composition, Polymer Architecture, Salt of Different Valency, and Thermoresponsive Block. J. Polym. Sci. 2021, 59, 191–204. [Google Scholar] [CrossRef]
  8. Suek, N.W.; Lamm, M.H. Computer Simulation of Architectural and Molecular Weight Effects on the Assembly of Amphiphilic Linear-Dendritic Block Copolymers in Solution. Langmuir 2008, 24, 3030–3036. [Google Scholar] [CrossRef] [PubMed]
  9. Ding, Y.; Zhao, Q.; Wang, L.; Huang, L.; Liu, Q.; Lu, X.; Cai, Y. Polymerization-Induced Self-Assembly Promoted by Liquid-Liquid Phase Separation. ACS Macro Lett. 2019, 8, 943–946. [Google Scholar] [CrossRef]
  10. György, C.; Armes, S.P. Recent Advances in Polymerization-Induced Self-Assembly (PISA) Syntheses in Non-Polar Media. Angew. Chem. Int. Ed. 2023, 62, e202308372. [Google Scholar] [CrossRef]
  11. Kim, J.H.; Li, Y.; Kim, M.S.; Kang, S.W.; Jeong, J.H.; Lee, D.S. Synthesis and Evaluation of Biotin-Conjugated PH-Responsive Polymeric Micelles as Drug Carriers. Int. J. Pharm. 2012, 427, 435–442. [Google Scholar] [CrossRef] [PubMed]
  12. Yadav, S.; Ramesh, K.; Reddy, O.S.; Karthika, V.; Kumar, P.; Jo, S.H.; Yoo, S.I.I.; Park, S.H.; Lim, K.T. Redox-Responsive Comparison of Diselenide and Disulfide Core-Cross-Linked Micelles for Drug Delivery Application. Pharmaceutics 2023, 15, 1159. [Google Scholar] [CrossRef] [PubMed]
  13. Alvarez-Lorenzo, C.; Bromberg, L.; Concheiro, A. Light-Sensitive Intelligent Drug Delivery Systems. Photochem. Photobiol. 2009, 85, 848–860. [Google Scholar] [CrossRef] [PubMed]
  14. DeWit, M.A.; Gillies, E.R. A Cascade Biodegradable Polymer Based on Alternating Cyclization and Elimination Reactions. J. Am. Chem. Soc. 2009, 131, 18327–18334. [Google Scholar] [CrossRef] [PubMed]
  15. Phillips, S.T.; Dilauro, A.M. Continuous Head-to-Tail Depolymerization: An Emerging Concept for Imparting Amplified Responses to Stimuli-Responsive Materials. ACS Macro Lett. 2014, 3, 298–304. [Google Scholar] [CrossRef] [PubMed]
  16. Amir, R.J.; Pessah, N.; Shamis, M.; Shabat, D. Self-Immolative Dendrimers. Angew. Chem.-Int. Ed. 2003, 42, 4494–4499. [Google Scholar] [CrossRef] [PubMed]
  17. Park, J.; Jo, S.; Lee, Y.M.; Saravanakumar, G.; Lee, J.; Park, D.; Kim, W.J. Enzyme-Triggered Disassembly of Polymeric Micelles by Controlled Depolymerization via Cascade Cyclization for Anticancer Drug Delivery. ACS Appl. Mater. Interfaces 2021, 13, 8060–8070. [Google Scholar] [CrossRef]
  18. Sirianni, Q.E.A.; Liang, X.; Such, G.K.; Gillies, E.R. Polyglyoxylamides with a PH-Mediated Solubility and Depolymerization Switch. Macromolecules 2021, 54, 10547–10556. [Google Scholar] [CrossRef]
  19. Liu, G.; Wang, X.; Hu, J.; Zhang, G.; Liu, S. Self-Immolative Polymersomes for High-Efficiency Triggered Release and Programmed Enzymatic Reactions. J. Am. Chem. Soc. 2014, 136, 7492–7497. [Google Scholar] [CrossRef] [PubMed]
  20. Kim, J.W.; Kim, H.J.; Park, J.; Chae, J.A.; Song, H.W.; Choi, E.; Kim, H. Self-Immolative and Amphiphilic Poly(Benzyl Ether)-Based Copolymers: Synthesis and Triggered Demicellization via Head-to-Tail Depolymerization. Macromolecules 2022, 55, 6140–6149. [Google Scholar] [CrossRef]
  21. Murat, M.; Grest, G.S. Molecular Dynamics Study of Dendrimer Molecules in Solvents of Varying Quality. Macromolecules 1996, 29, 1278–1285. [Google Scholar] [CrossRef]
  22. Miliou, K.; Gergidis, L.N.; Vlahos, C. Polyelectrolyte Micelles in Salt-Free Solutions: Micelle Size and Electrostatic Potential. J. Polym. Sci. B Polym. Phys. 2018, 56, 924–934. [Google Scholar] [CrossRef]
  23. Plimpton, S. Fast Parallel Algorithms for Short-Range Molecular Dynamics. J. Comput. Phys. 1995, 117, 1–19. [Google Scholar] [CrossRef]
  24. Stillinger, F.H. Rigorous Basis of the Frenkel-Band Theory of Association Equilibrium. J. Chem. Phys. 1963, 38, 1486–1494. [Google Scholar] [CrossRef]
  25. Pedregosa, F.; Varoquaux, G.; Gramfort, A.; Michel, V.; Thirion, B.; Grisel, O.; Blondel, M.; Prettenhofer, P.; Weiss, R.; Dubourg, V.; et al. Scikit-Learn: Machine Learning in Python. J. Mach. Learn. Res. 2011, 12, 2825–2830. [Google Scholar]
  26. Virtanen, P.; Gommers, R.; Oliphant, T.E.; Haberland, M.; Reddy, T.; Cournapeau, D.; Burovski, E.; Peterson, P.; Weckesser, W.; Bright, J.; et al. SciPy 1.0: Fundamental Algorithms for Scientific Computing in Python. Nat. Methods 2020, 17, 261–272. [Google Scholar] [CrossRef]
  27. Hagberg, A.A.; Schult, D.A.; Swart, P.J. Exploring Network Structure, Dynamics, and Function Using NetworkX. In Proceedings of the 7th Python in Science Conference (SciPy 2008), Pasadena, CA, USA, 19–24 August 2008. [Google Scholar]
  28. Cheng, L.; Cao, D. Effect of Tail Architecture on Self-Assembly of Amphiphiles for Polymeric Micelles. Langmuir 2009, 25, 2749–2756. [Google Scholar] [CrossRef]
  29. Georgiadis, C.; Moultos, O.; Gergidis, L.N.; Vlahos, C. Brownian Dynamics Simulations on the Self-Assembly Behavior of AB Hybrid Dendritic-Star Copolymers. Langmuir 2011, 27, 835–842. [Google Scholar] [CrossRef]
  30. Hwang, D.; Ramsey, J.D.; Kabanov, A.V. Polymeric Micelles for the Delivery of Poorly Soluble Drugs: From Nanoformulation to Clinical Approval. Adv. Drug Deliv. Rev. 2020, 156, 80–118. [Google Scholar] [CrossRef]
  31. Theodorou, D.N.; Suter, U.W. Shape of Unperturbed Linear Polymers: Polypropylene. Macromolecules 1985, 18, 1206–1214. [Google Scholar] [CrossRef]
  32. Peppas, N.A.; Sahlin, J.J. A Simple Equation for the Description of Solute Release. III. Coupling of Diffusion and Relaxation. Int. J. Pharm. 1989, 57, 169–172. [Google Scholar] [CrossRef]
  33. Ritger, P.L.; Peppas, N.A. A Simple Equation for Description of Solute Release II. Fickian and Anomalous Release from Swellable Devices. J. Control. Release 1987, 5, 37–42. [Google Scholar] [CrossRef]
  34. He, E.; Yue, C.Y.; Tam, K.C. Binding and Release Studies of a Cationic Drug from a Star-Shaped Four-Arm Poly(Ethylene Oxide)-b-Poly(Methacrylic Acid). J. Pharm. Sci. 2010, 99, 782–793. [Google Scholar] [CrossRef] [PubMed]
  35. Marrink, S.J.; Monticelli, L.; Melo, M.N.; Alessandri, R.; Tieleman, D.P.; Souza, P.C.T. Two Decades of Martini: Better Beads, Broader Scope. Wiley Interdiscip. Rev. Comput. Mol. Sci. 2023, 13, e1620. [Google Scholar] [CrossRef]
Figure 1. Cartoon representations of (a) linear diblock copolymer A6B6, (b) miktoarm star copolymer A6(B3)2, and (c) miktoarm star copolymer A6(B2)3 with one, two, and three end-cap beads (orange) are presented. T–type trigger molecules (purple) and cargo molecules (green) C2 are also depicted. Hydrophilic A–type beads and hydrophobic B–type beads are shown in blue and red, respectively.
Polymers 16 01127 g001
Figure 2. Cartoon representation of the depolymerization algorithm: (a) the breaking of a bond between the end-cap (orange) and B–type bead (red) triggered by a T–type molecule (purple); (b) the head-to-tail breaking of a bond between two B–type beads (red) without stimuli. Hydrophilic A–type beads are shown in blue.
Polymers 16 01127 g002
Figure 3. Mass distribution of micelles as a function of the aggregation number N formed by (a) A30B30, (b) A30(B15)2, and (c) A30(B10)3 copolymers. ibid. for mixtures: (d) A30B30 and C3, (e) A30(B15)2 and C3, and (f) A30(B10)3 and C3. In all simulations, [Φ] = 0.12.
Polymers 16 01127 g003
Figure 4. The mean squared radius of gyration for ‘empty’ micelles formed by A30B30, A30(B15)2, and A30(B10)3 copolymers (solid lines), and for loaded micelles formed by mixtures with 2000 C3 cargo molecules (dashed lines) plotted against N. Standard deviation is indicated by the error bars.
Polymers 16 01127 g004
Figure 5. The mean shape anisotropy parameter κ2 for ‘empty’ micelles formed by A30B30, A30(B15)2, and A30(B10)3 copolymers (solid lines), and for loaded micelles formed by mixtures with 2000 C3 cargo molecules (dashed lines) plotted against N. Standard deviation is indicated by the error bars.
Polymers 16 01127 g005
Figure 6. Depolymerization fraction of end-cap beads of A30B30, A30(B15)2, and A30(B10)3 copolymers as a function of time for (a) stoichiometric trigger molecule concentration and (b) constant trigger molecule concentration. RPT = 10−4, RPB = 10−3. [ec]0 is the initial end-cap beads concentration; [ec]t is the end-cap concentration.
Polymers 16 01127 g006aPolymers 16 01127 g006b
Figure 7. Depolymerization fraction of all hydrophobic beads of A30B30, A30(B15)2, and A30(B10)3 copolymers plotted against time for constant trigger molecule concentration: (a) RPT = 10−4 and RPB = 10−3, (b) RPT = 10−2 and RPB = 10−3, and (c) RPT = 10−3 and RPB = 10−3. [B]0 is the initial hydrophobic beads concentration; [B]t is the hydrophobic beads concentration.
Polymers 16 01127 g007aPolymers 16 01127 g007b
Figure 8. Depolymerization fraction of all hydrophobic beads of A30B30, A30(B15)2, and A30(B10)3 copolymers plotted against time for stoichiometric trigger molecules concentration. RPT = 10−4; RPB = 10−3. [B]0 is the initial hydrophobic beads concentration; [B]t is the hydrophobic beads concentration.
Polymers 16 01127 g008
Figure 9. Mass distribution of micelles formed by linear A30B30 copolymers across various time points and depolymerization fractions of all hydrophobic beads: (a) t = 0, 0, (b) t = 135,000τ, 0.15, (c) t = 360,000τ, 0.31, (d) t = 630,000τ, 0.45, (e) t = 1,260,000τ, 0.60, and (f) t = 1,800,000τ, 0.68. The trigger molecule concentration is maintained stoichiometric for end-cap beads in all cases. RPT = 10−4 and RPB = 10−3.
Polymers 16 01127 g009
Figure 10. Mass distribution of micelles formed by miktoarm A30(B15)2 copolymers across various time points and depolymerization fractions of all hydrophobic beads: (a) t = 0, 0, (b) t = 90,000τ, 0.17, (c) t = 180,000τ, 0.29, (d) t = 360,000τ, 0.44, (e) t = 720,000τ, 0.60, and (f) t = 1,440,000τ, 0.75. The trigger molecule concentration is maintained stoichiometric for end-cap beads in all cases. RPT = 10−4 and RPB = 10−3.
Polymers 16 01127 g010
Figure 11. Mass distribution of micelles formed by miktoarm A30(B10)3 copolymers across various time points and depolymerization fractions of all hydrophobic beads: (a) t = 0, 0, (b) t = 45,000τ, 0.13, (c) t = 135,000τ, 0.29, (d) t = 270,000τ, 0.44, (e) t = 540,000τ, 0.59, and (f) t = 1,170,000τ, 0.75. The trigger molecule concentration is maintained stoichiometric for end-cap beads in all cases. RPT = 10−4 and RPB = 10−3.
Polymers 16 01127 g011
Figure 12. Plot illustrating the mean squared displacement calculated from 90 cargo molecules within an A30B30 micelle with N = 50, against time for stoichiometric trigger molecule concentration with end-cap beads and RPT = 10−4 and RPB = 10−3. The exponent α corresponds to the scaling behavior of t.
Polymers 16 01127 g012
Figure 13. Cargo molecules release fraction from A30B30, A30(B15)2, and A30(B10)3 copolymer mixtures plotted against time for (a) constant trigger molecule concentration and (b) stoichiometric trigger molecule concentration with end-cap beads. RPT = 10−4 and RPB = 10−3. [C3]0 is the initial cargo molecule concentration; [C3]t is the cargo molecule concentration.
Polymers 16 01127 g013aPolymers 16 01127 g013b
Figure 14. Plot depicting the fraction of released cargo molecules against time for (a) linear A30B30, (b) miktoarm A30(B15)2, and (c) miktoarm A30(B10)3 copolymers. Fitting lines, k and n, correspond to the Korsmeyer–Peppas equation. Trigger molecule concentration is maintained constant in all cases. RPT = 10−4 and RPB = 10−3.
Polymers 16 01127 g014aPolymers 16 01127 g014b
Disclaimer/Publisher’s Note: The statements, opinions and data contained in all publications are solely those of the individual author(s) and contributor(s) and not of MDPI and/or the editor(s). MDPI and/or the editor(s) disclaim responsibility for any injury to people or property resulting from any ideas, methods, instructions or products referred to in the content.

