

The Impact of Mechanical Recycling on Ligno-Cellulose Fibre Containing PLA Biocomposite

Abstract
:1. Introduction
2. Experimental
2.1. Materials
2.2. PLA-BSKPF and PLA-UBSKPF Biocomposite Processing
2.3. Characterization
2.3.1. Melt Flow Index
2.3.2. Scanning Electron Microscope
2.3.3. Size Exclusion Chromatography
2.3.4. Microtomography
2.3.5. Differential Scanning Chromatography (DSC)
2.3.6. Fibre Analysis
2.3.7. Charpy Impact Strength
2.3.8. Tensile Strength
3. Results and Discussion
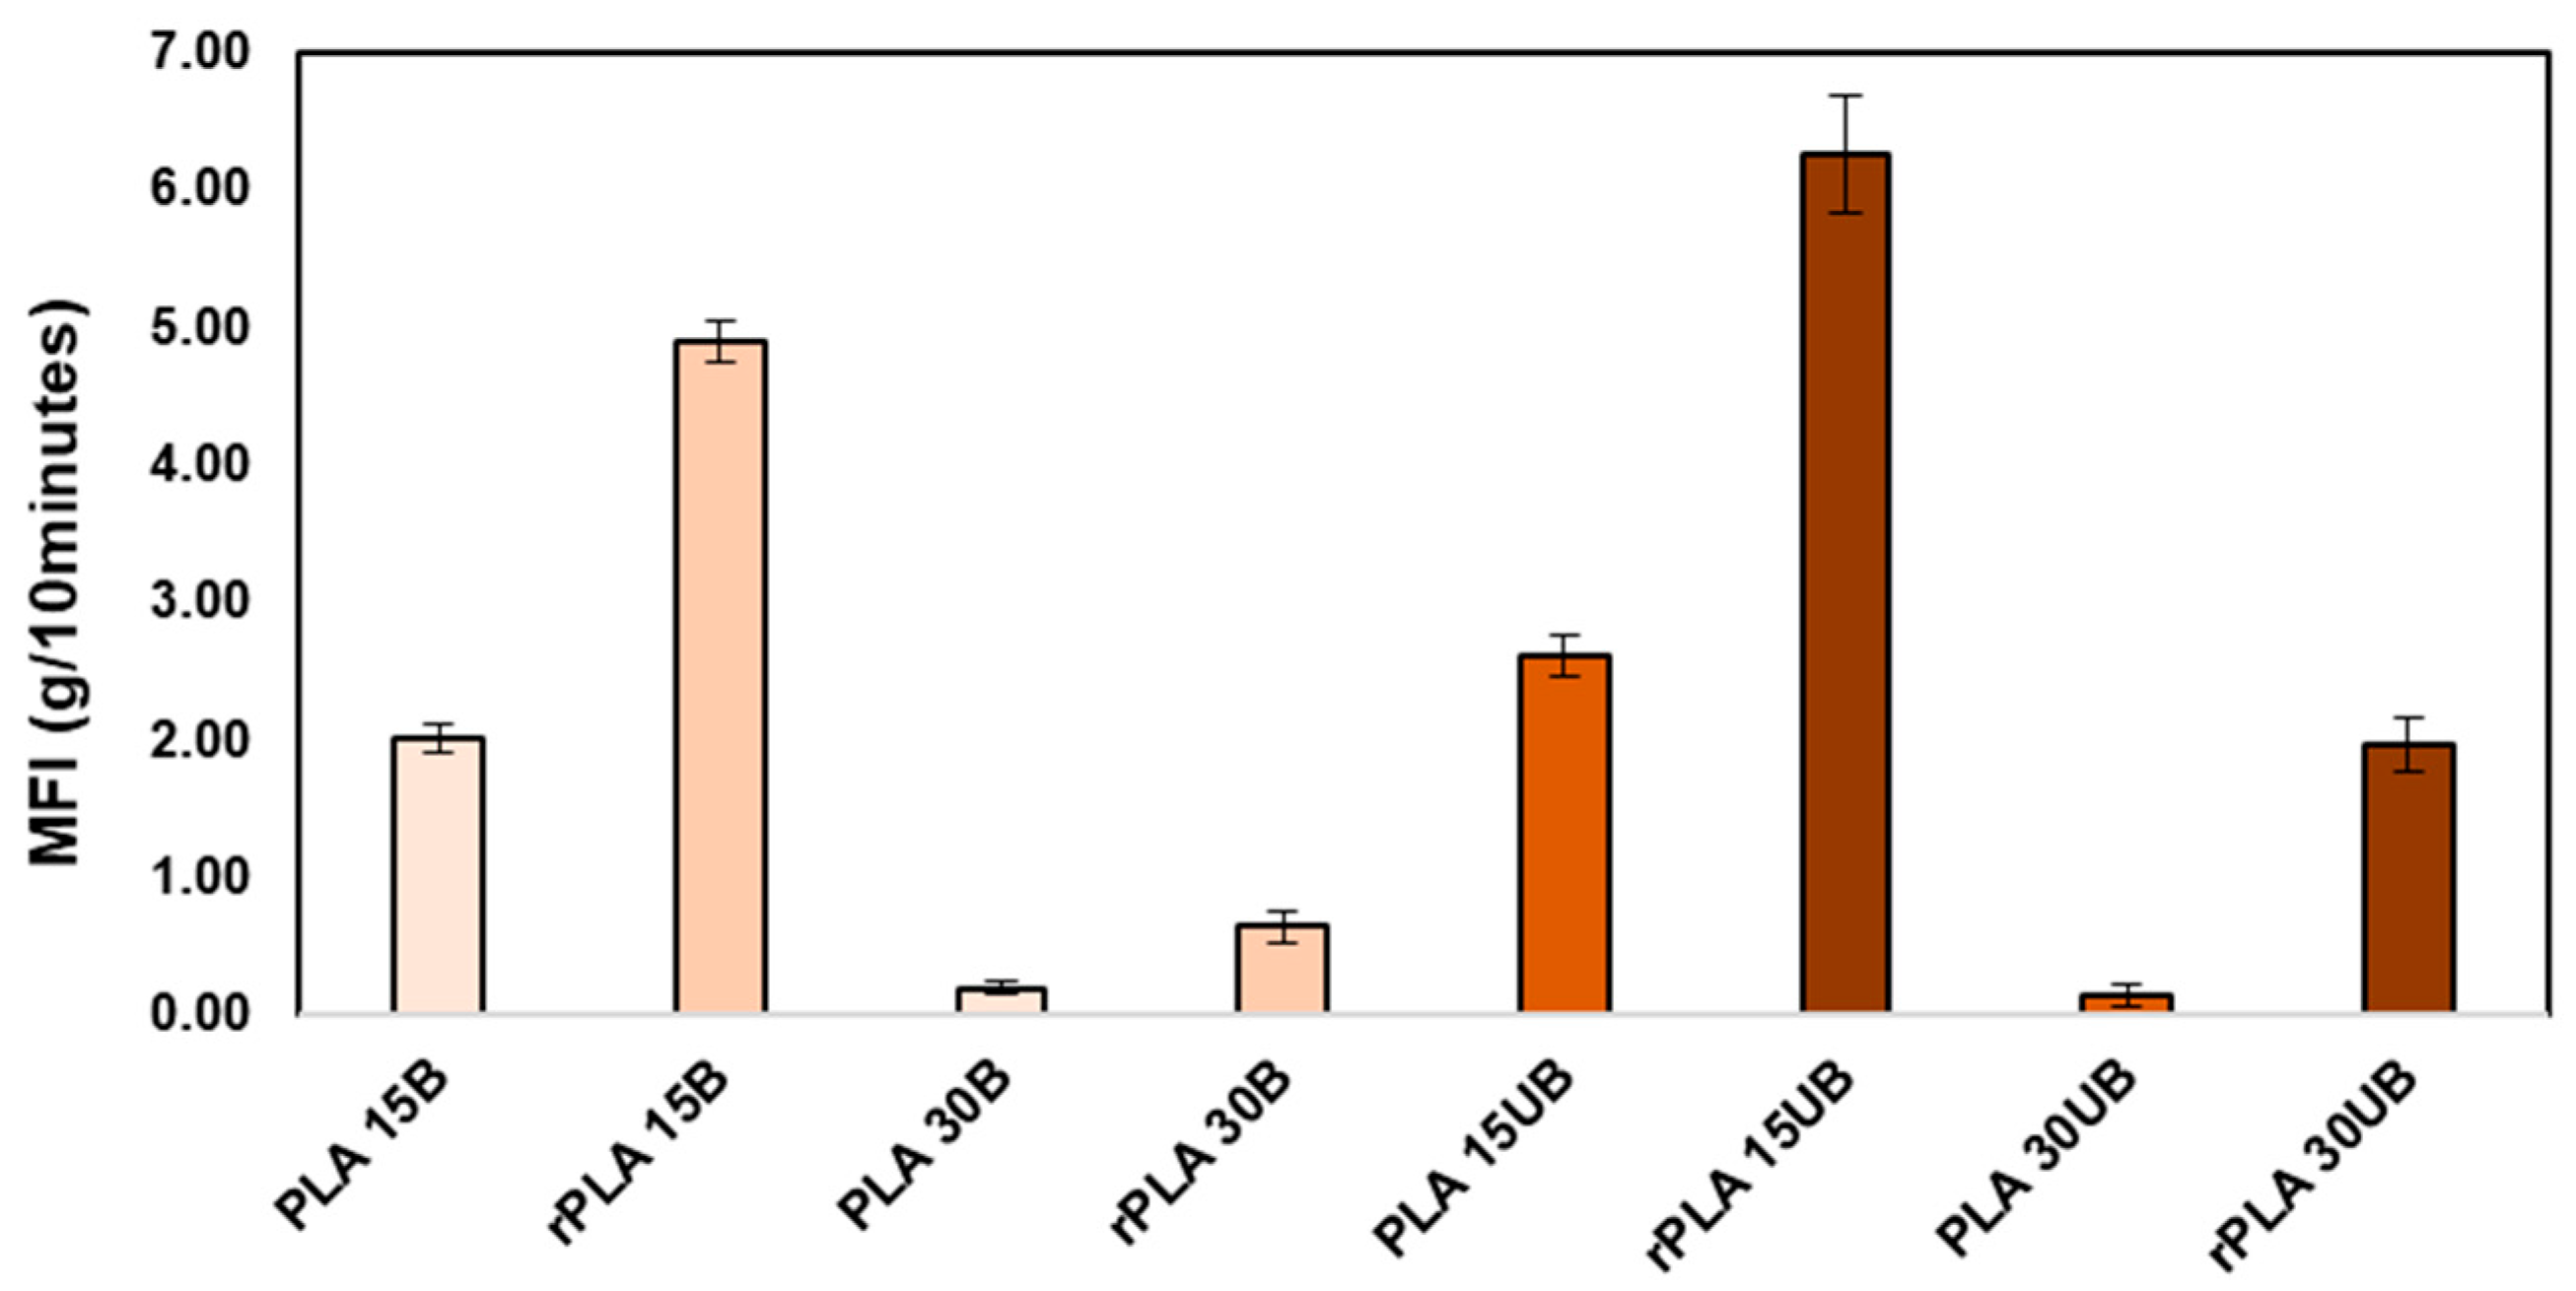
3.1. Melt Flow Index
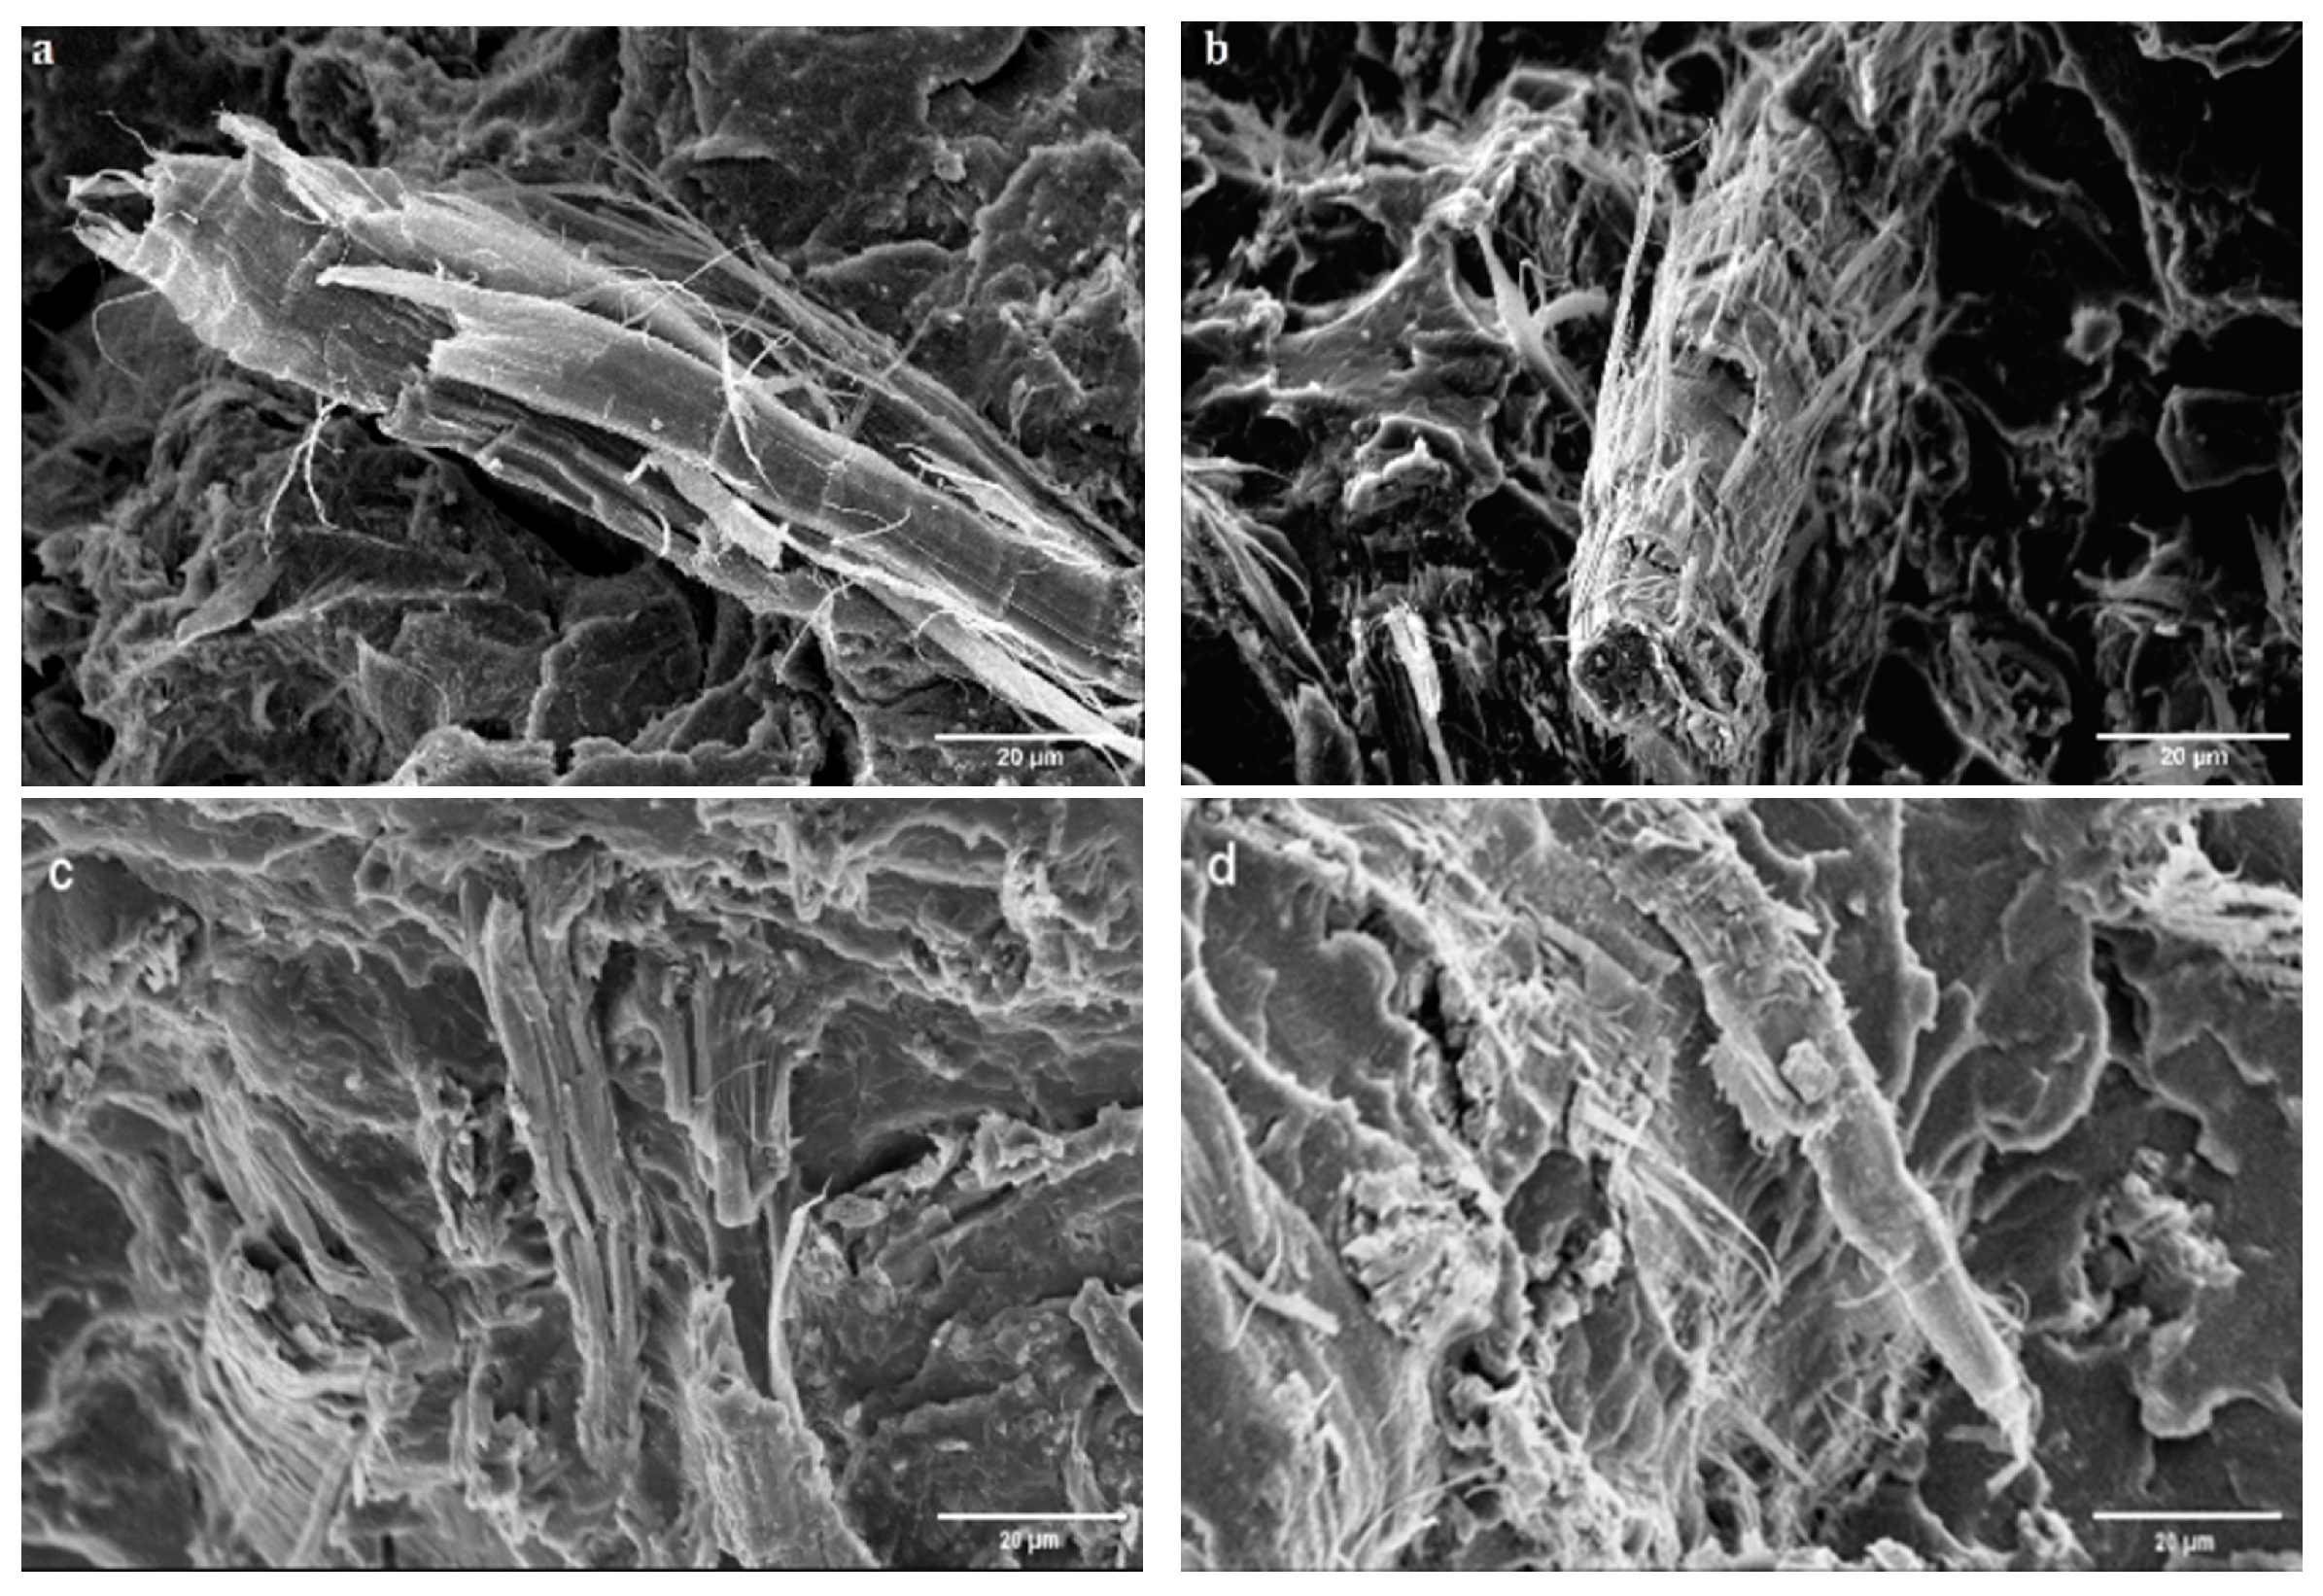
3.2. Scanning Electron Microscope
3.3. Size Exclusion Chromatography
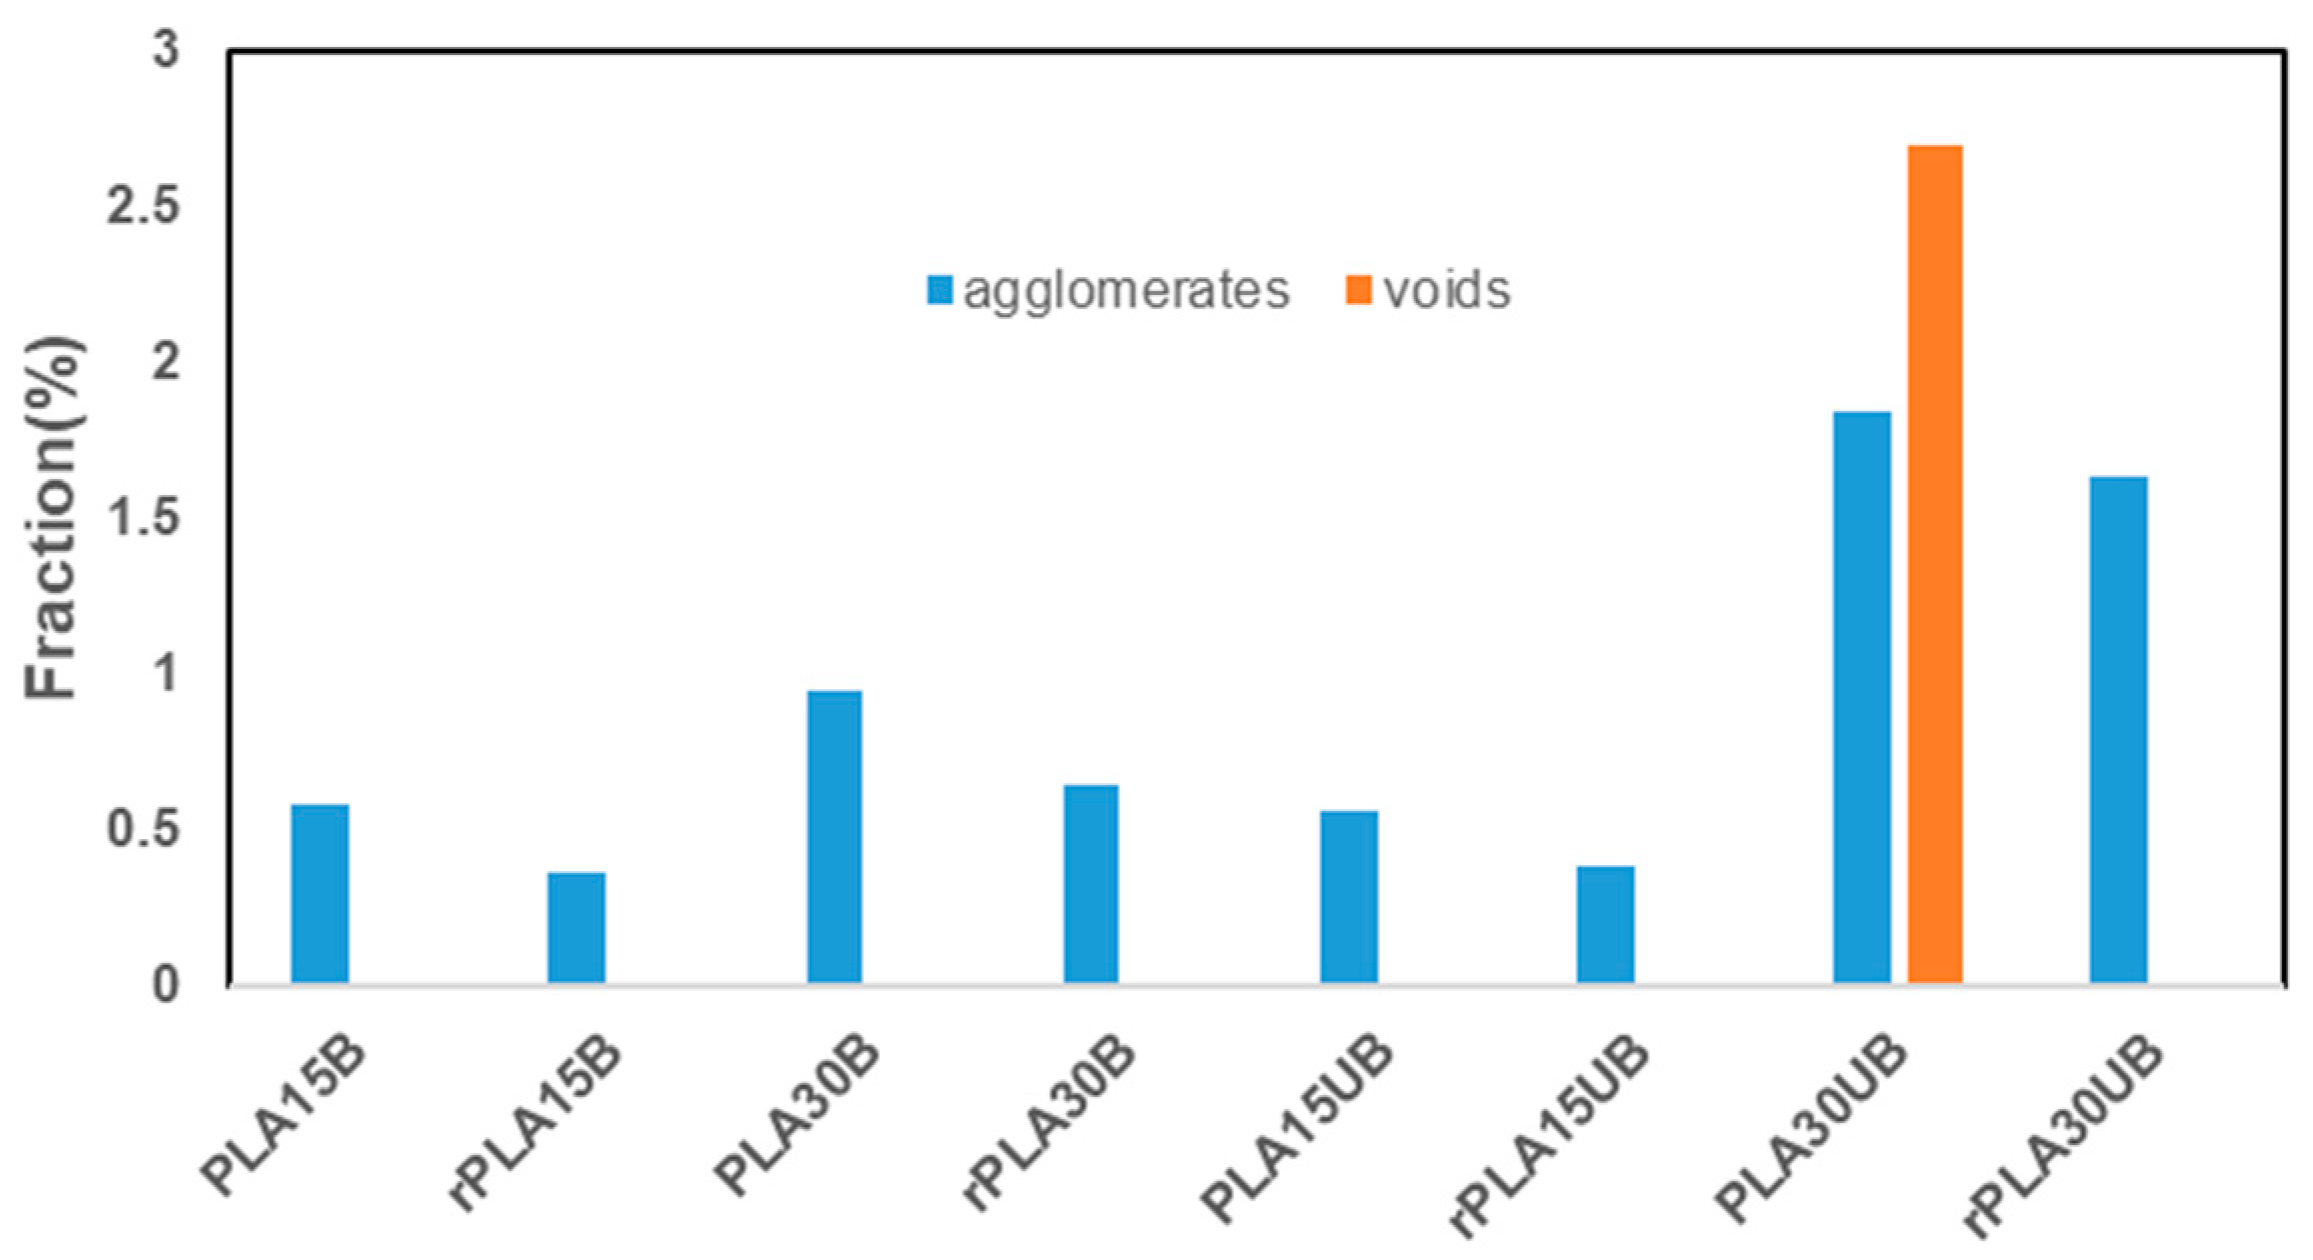
3.4. Microtomography (µCT)
3.5. Differential Scanning Calorimetry
3.6. Fibre Behaviour
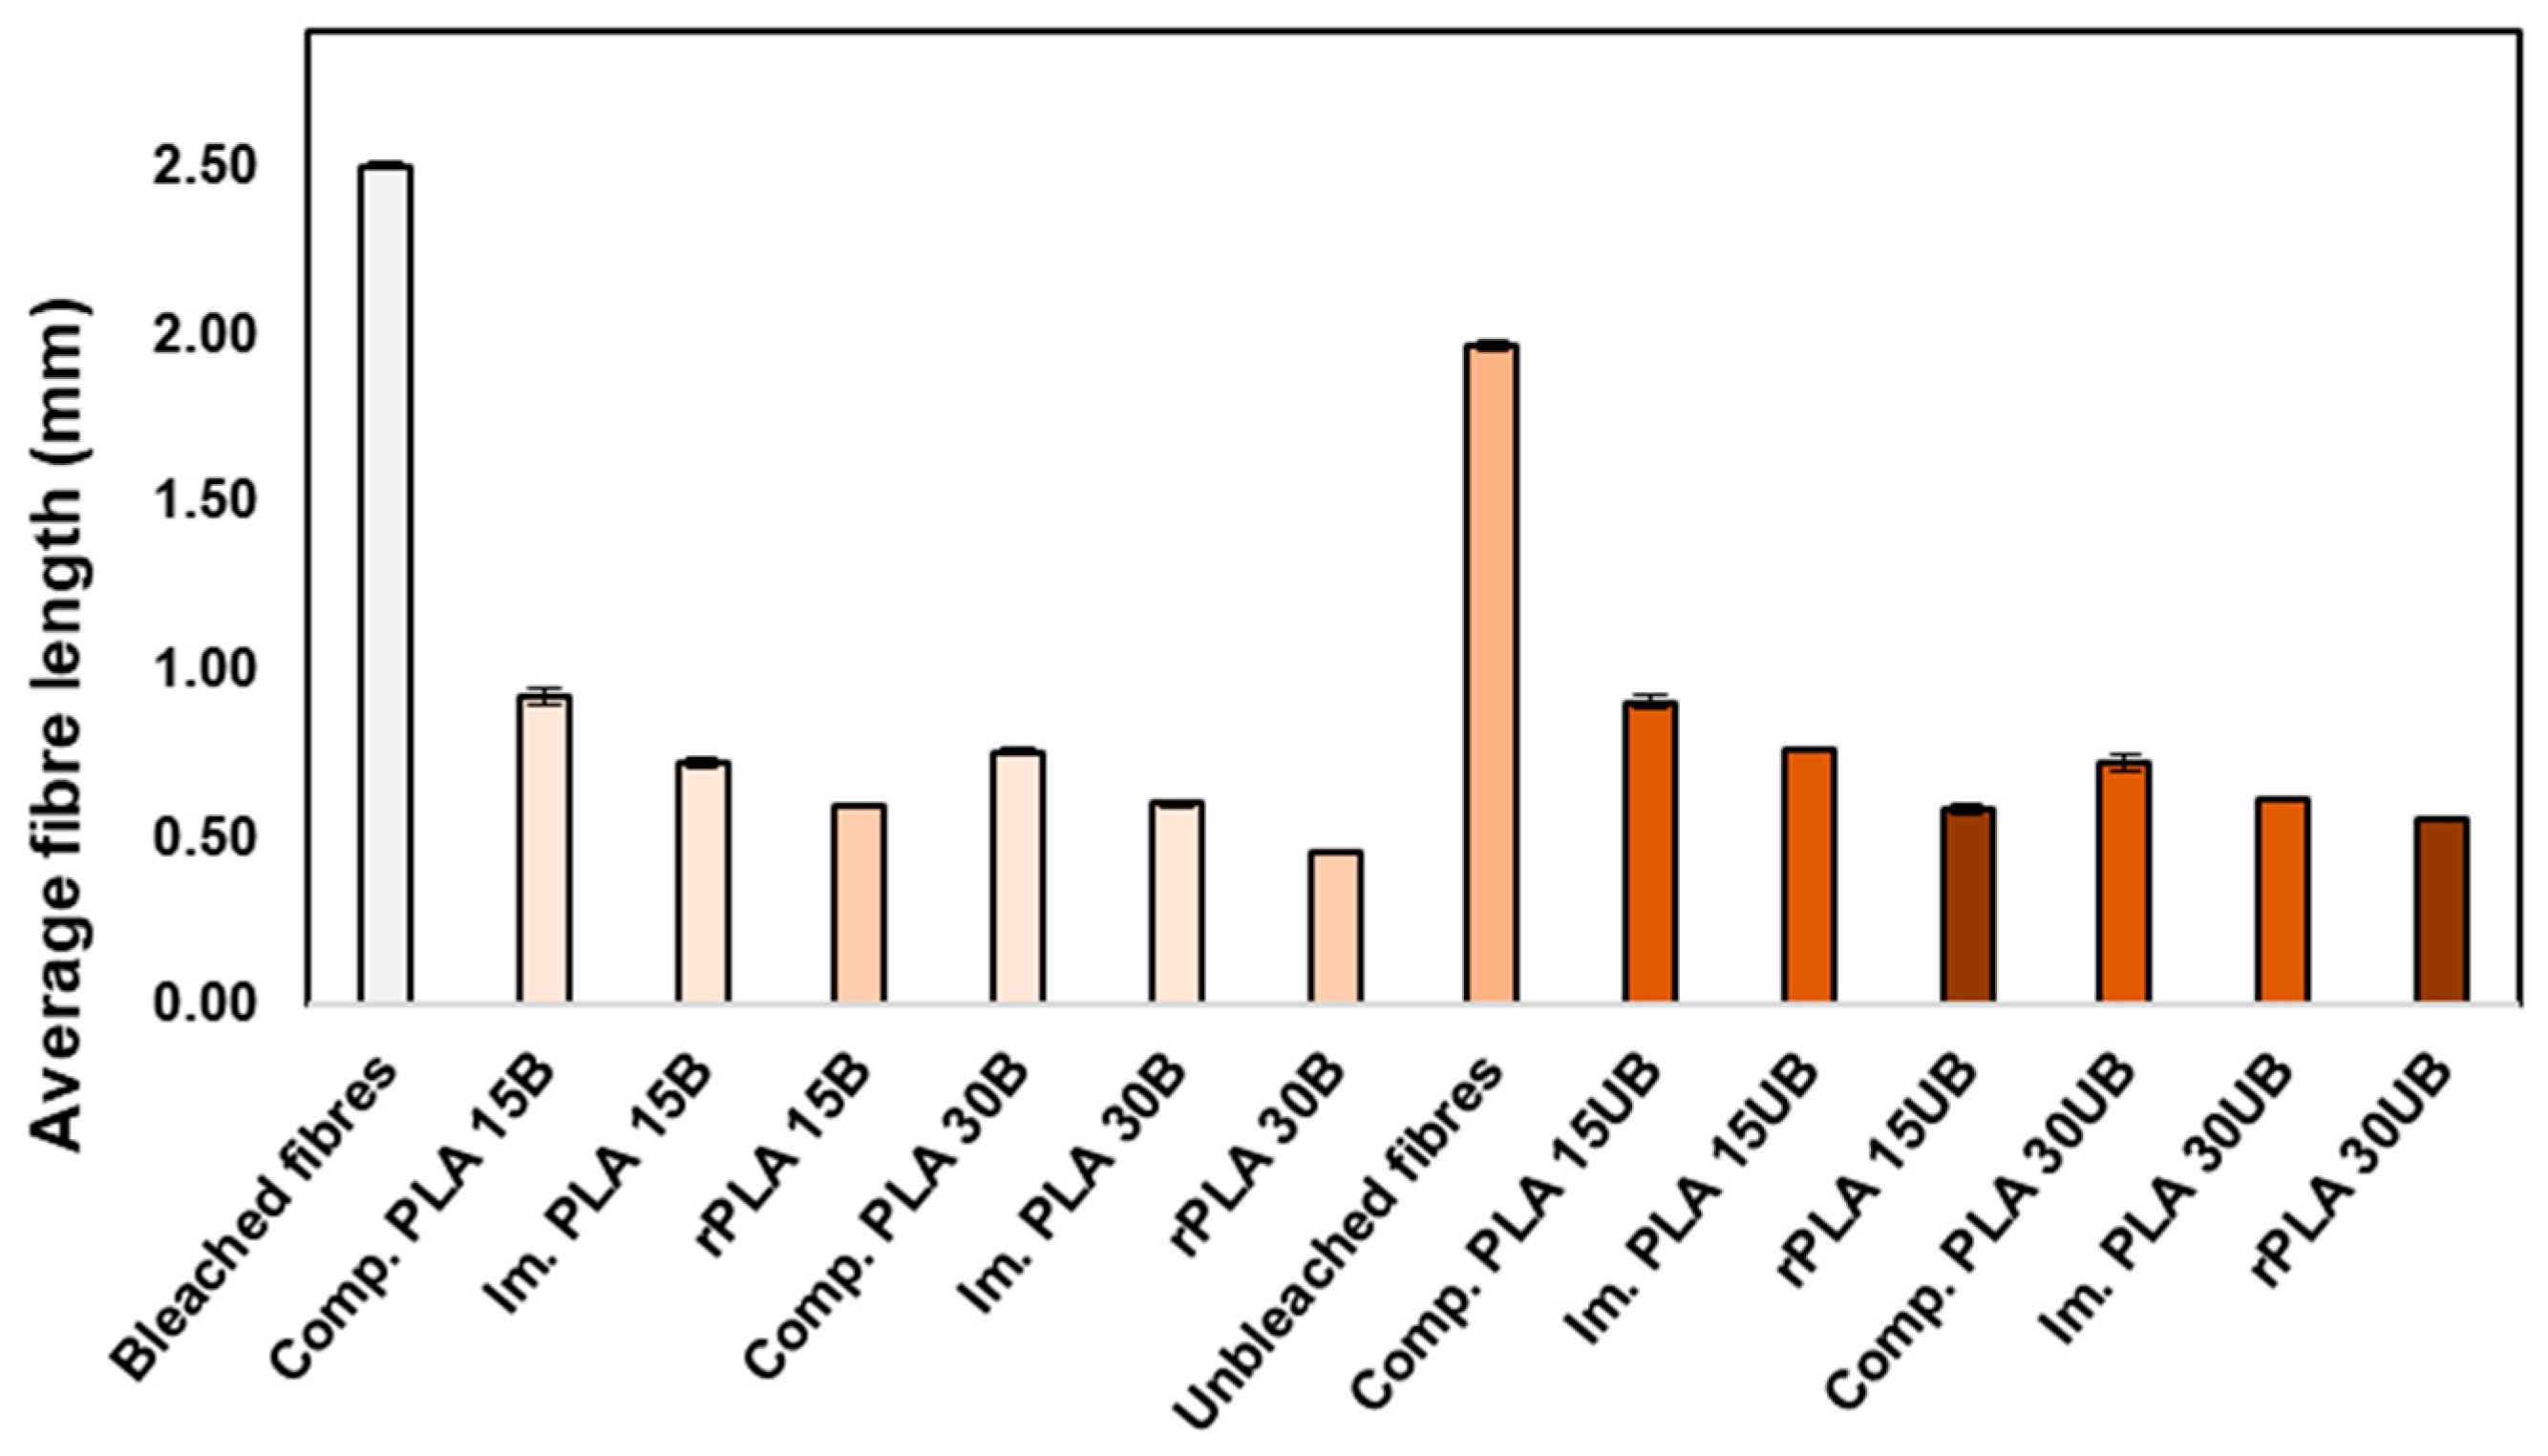
3.6.1. Average Fibre Length
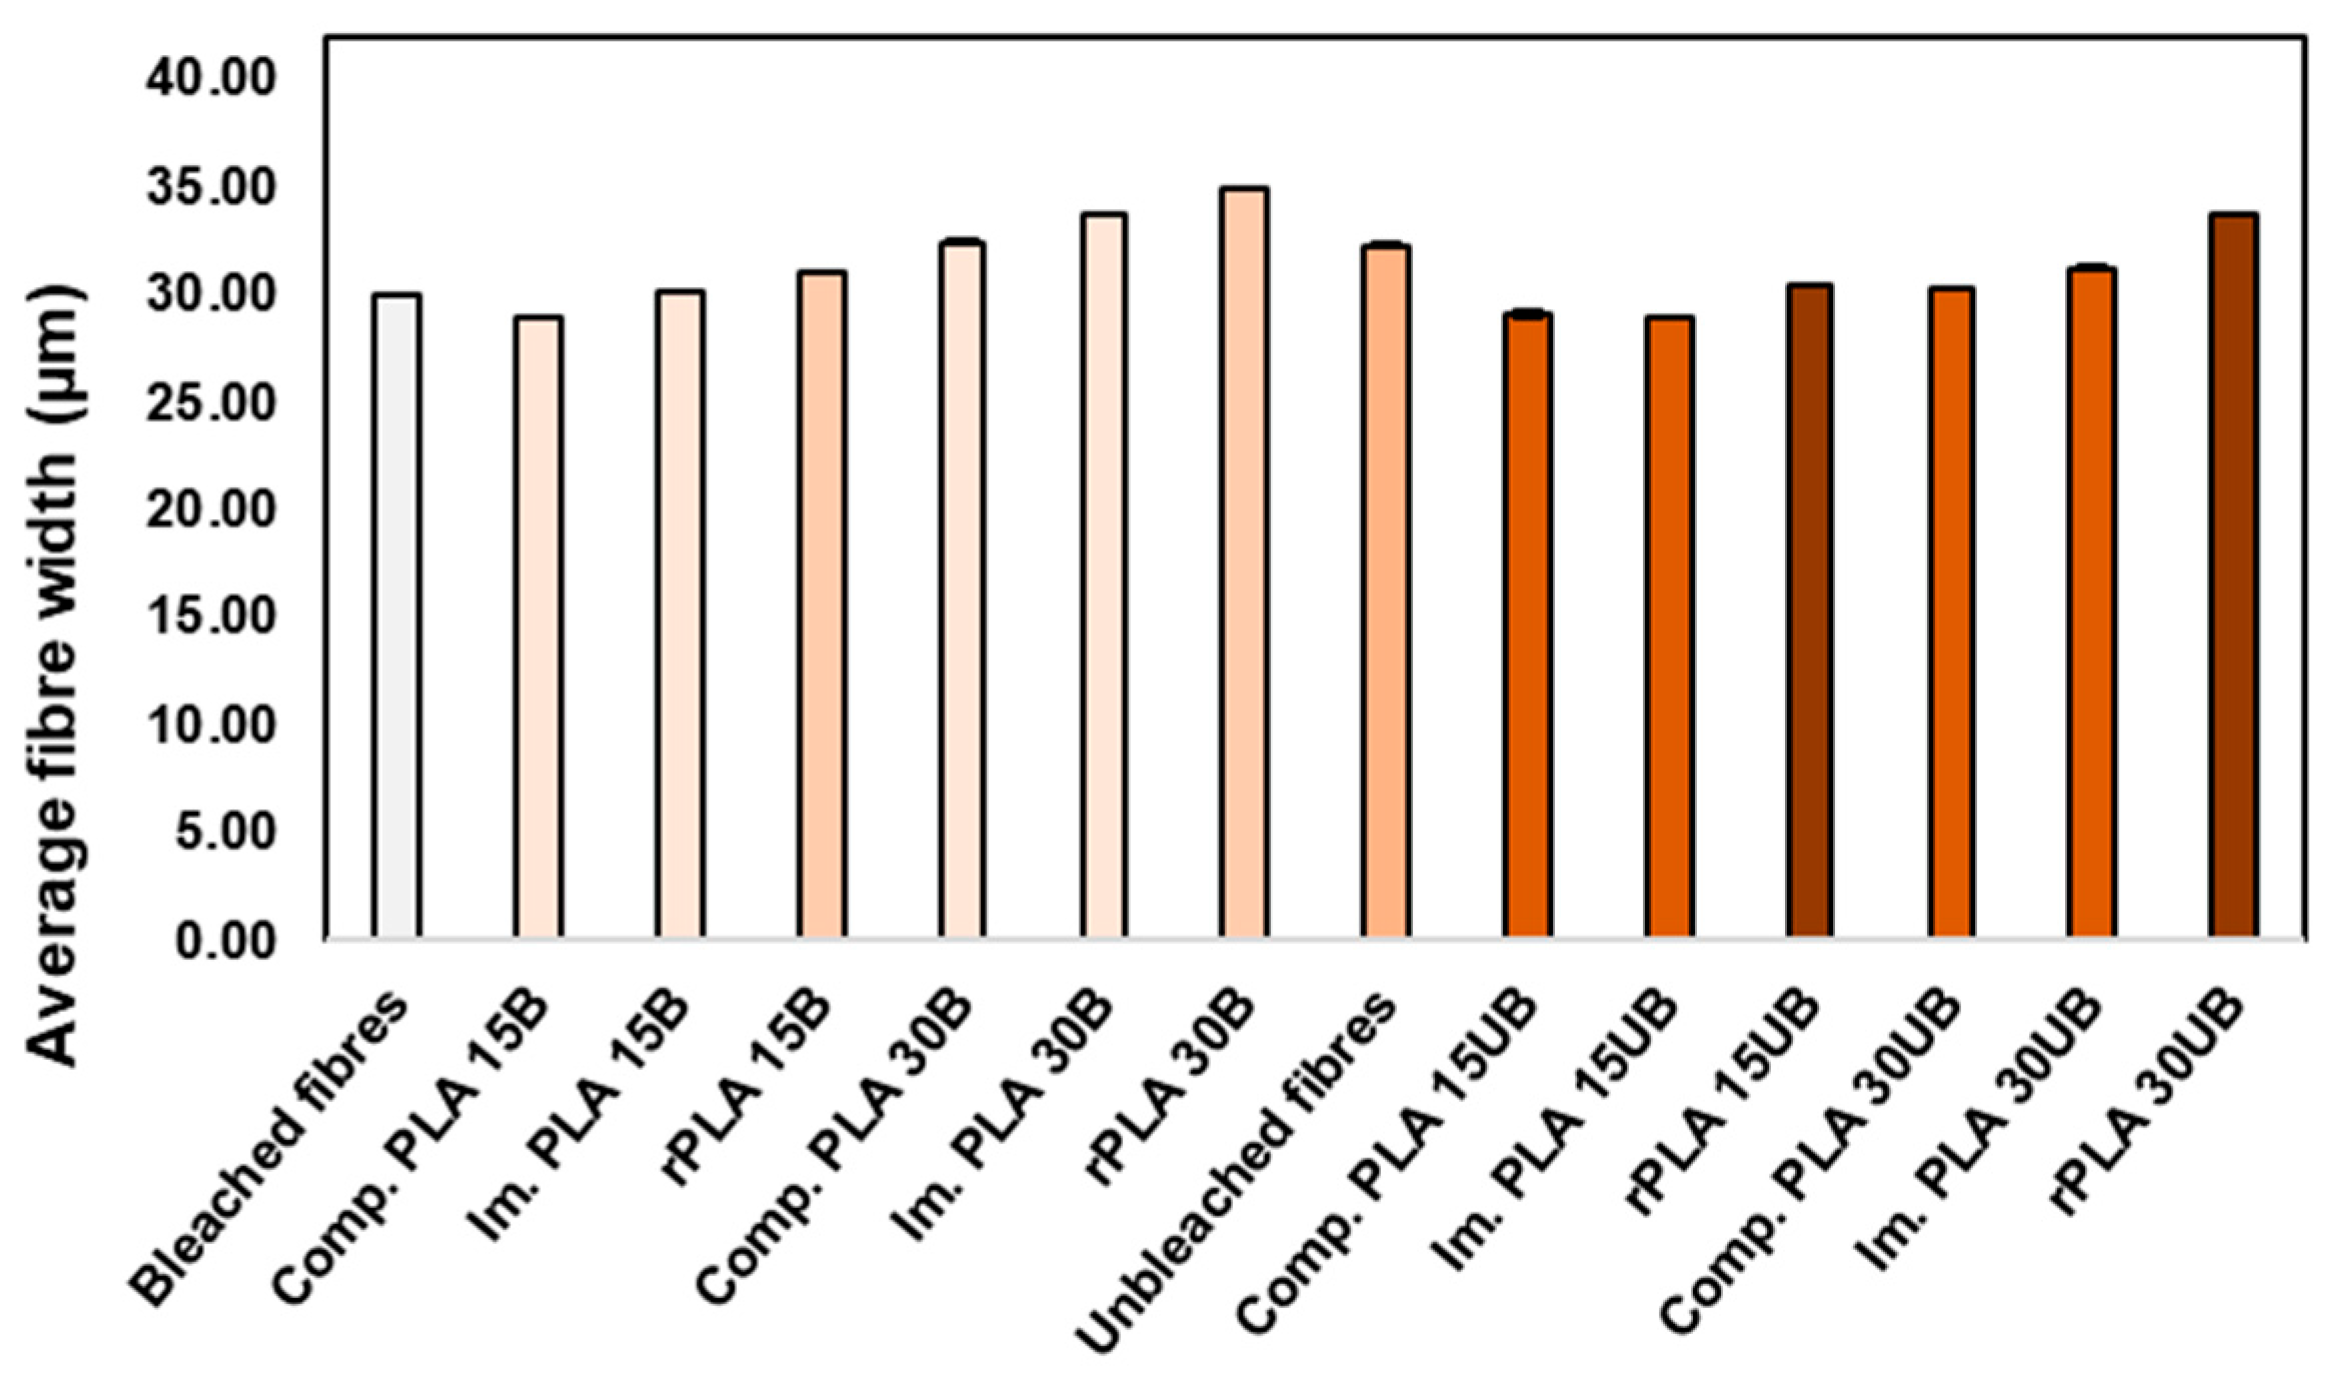
3.6.2. Average Fibre Width
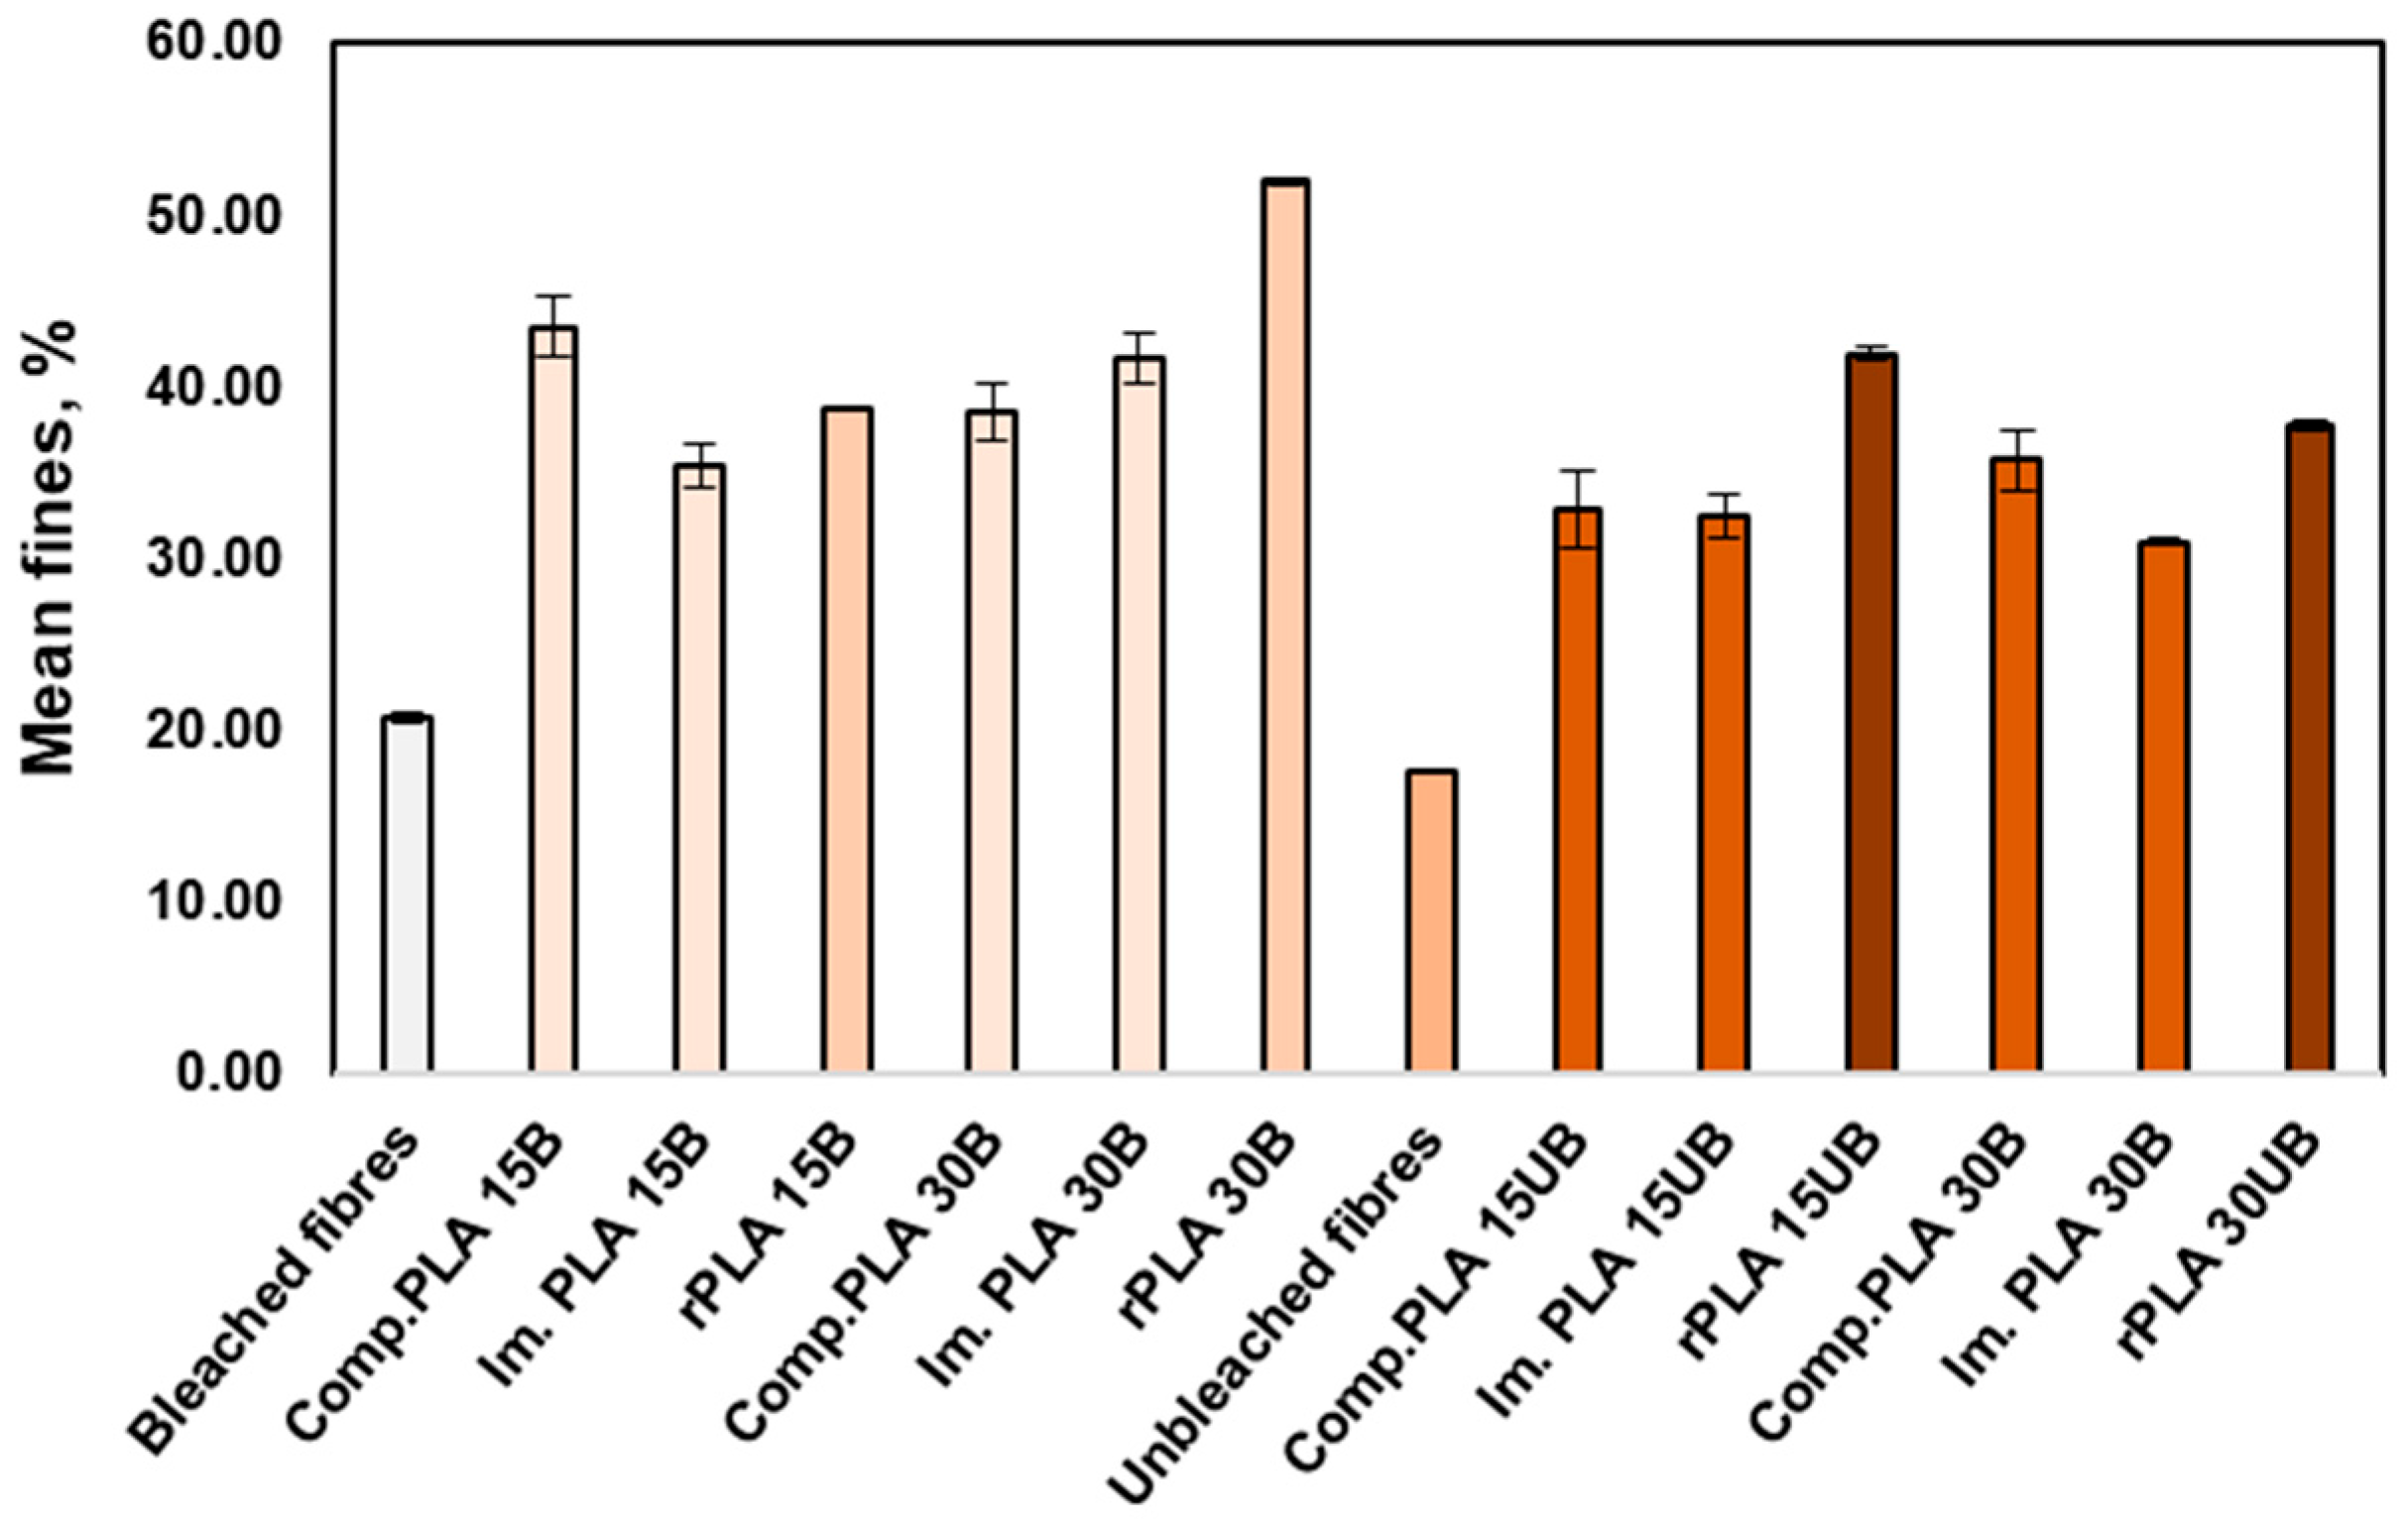
3.6.3. Mean Fibre Fines Percentage
3.7. Mechanical Properties
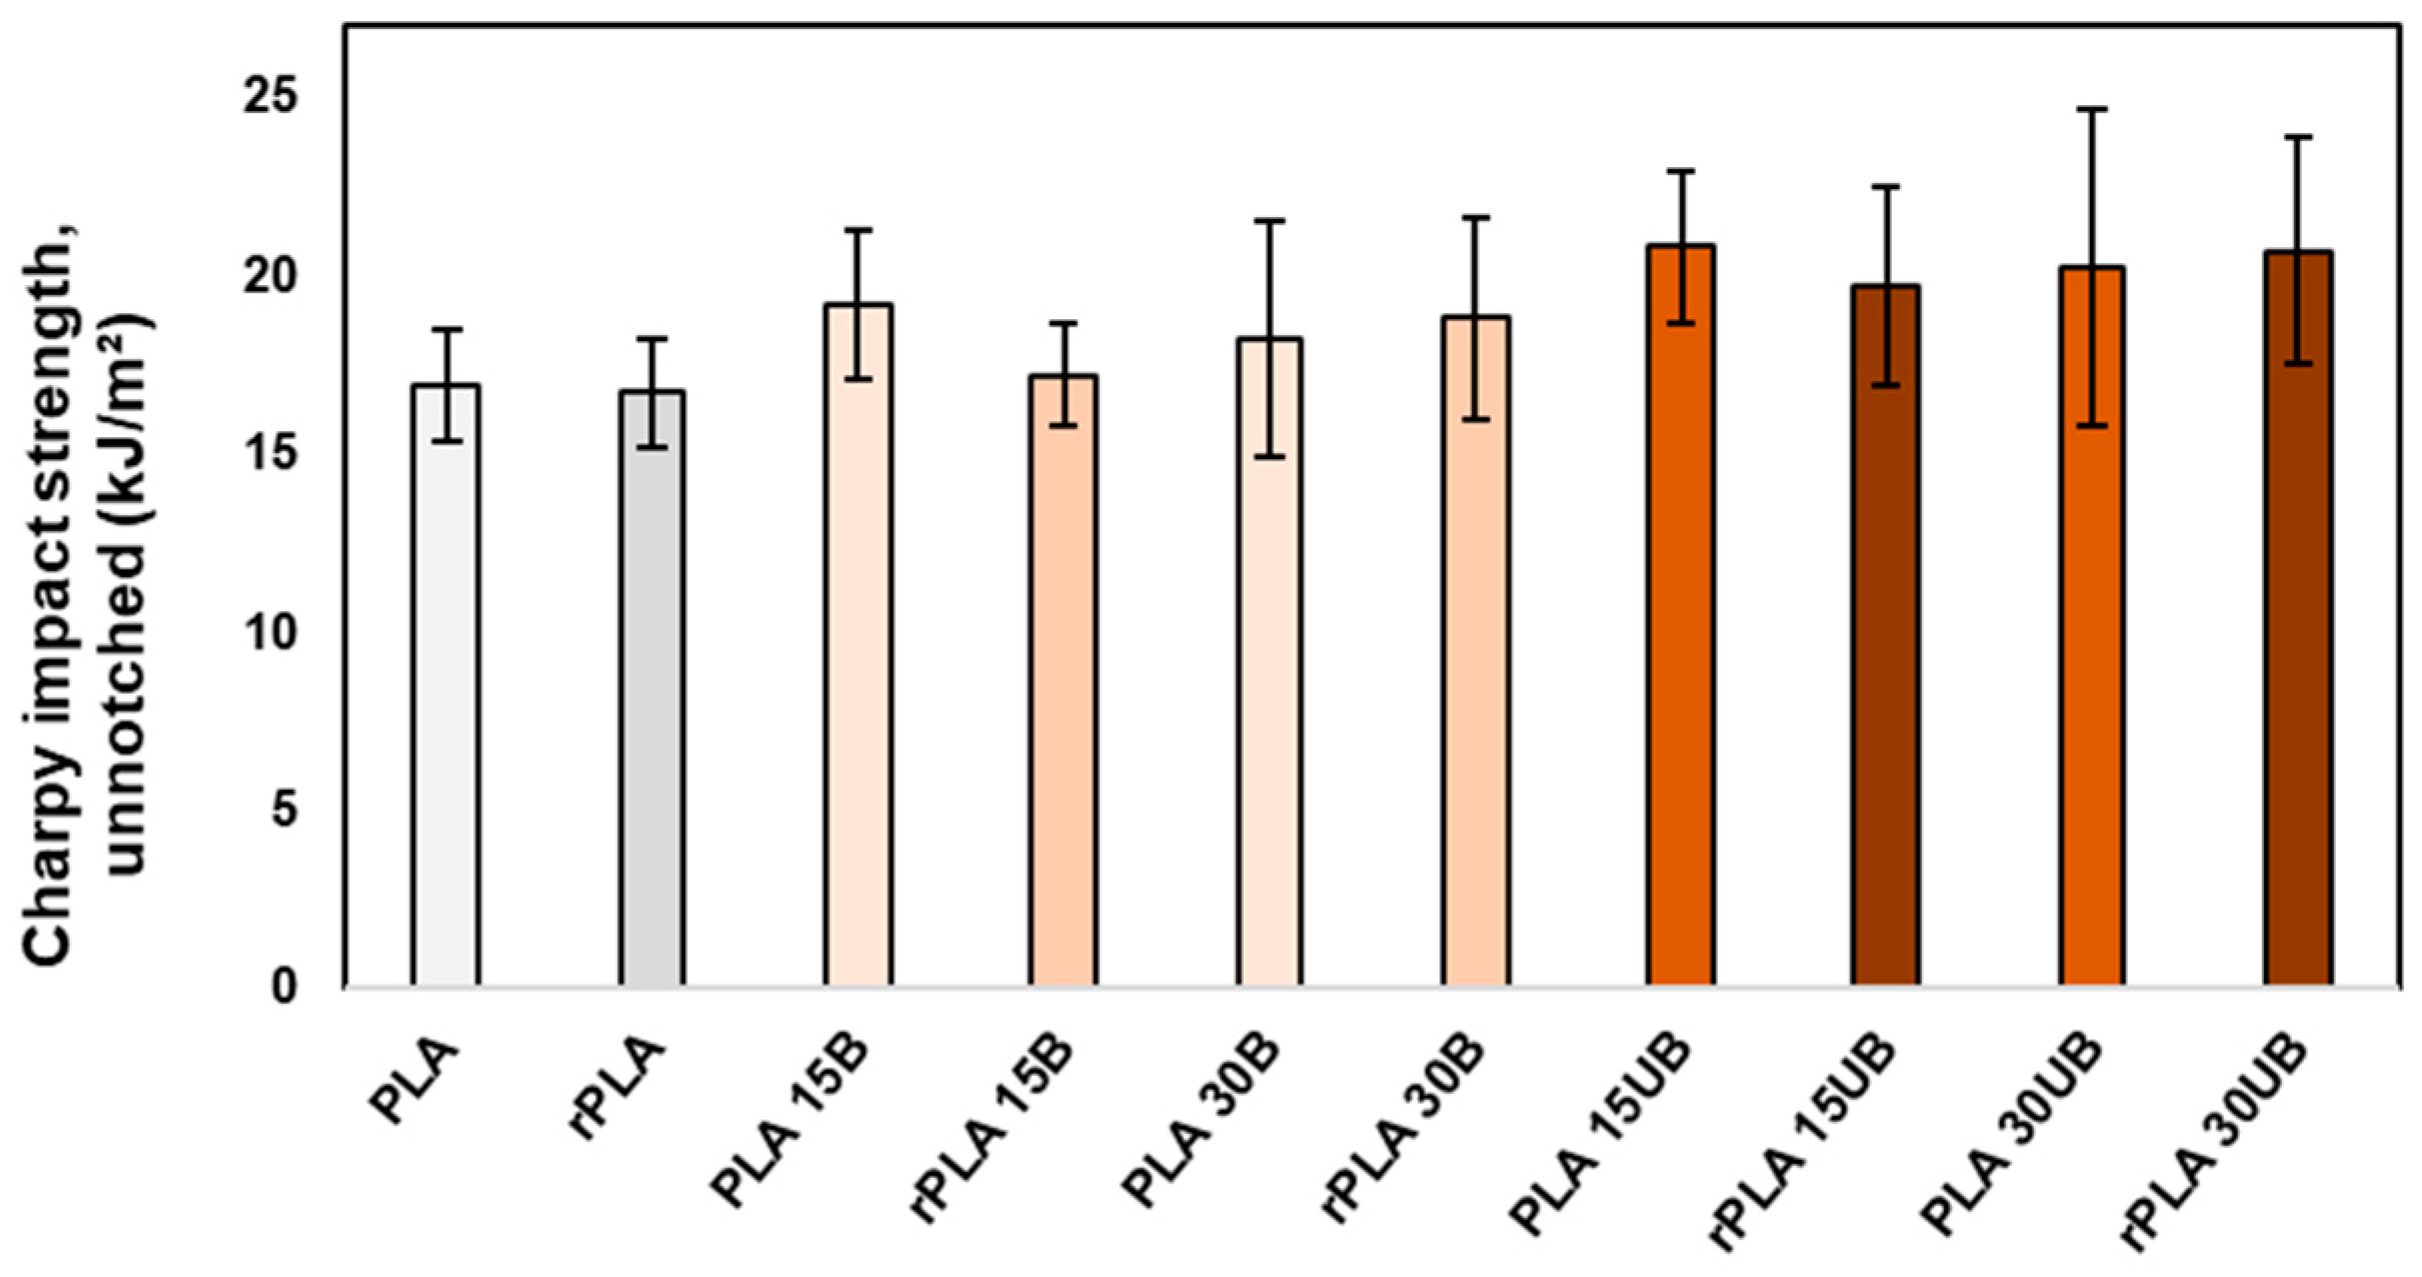
3.7.1. Charpy Impact Strength
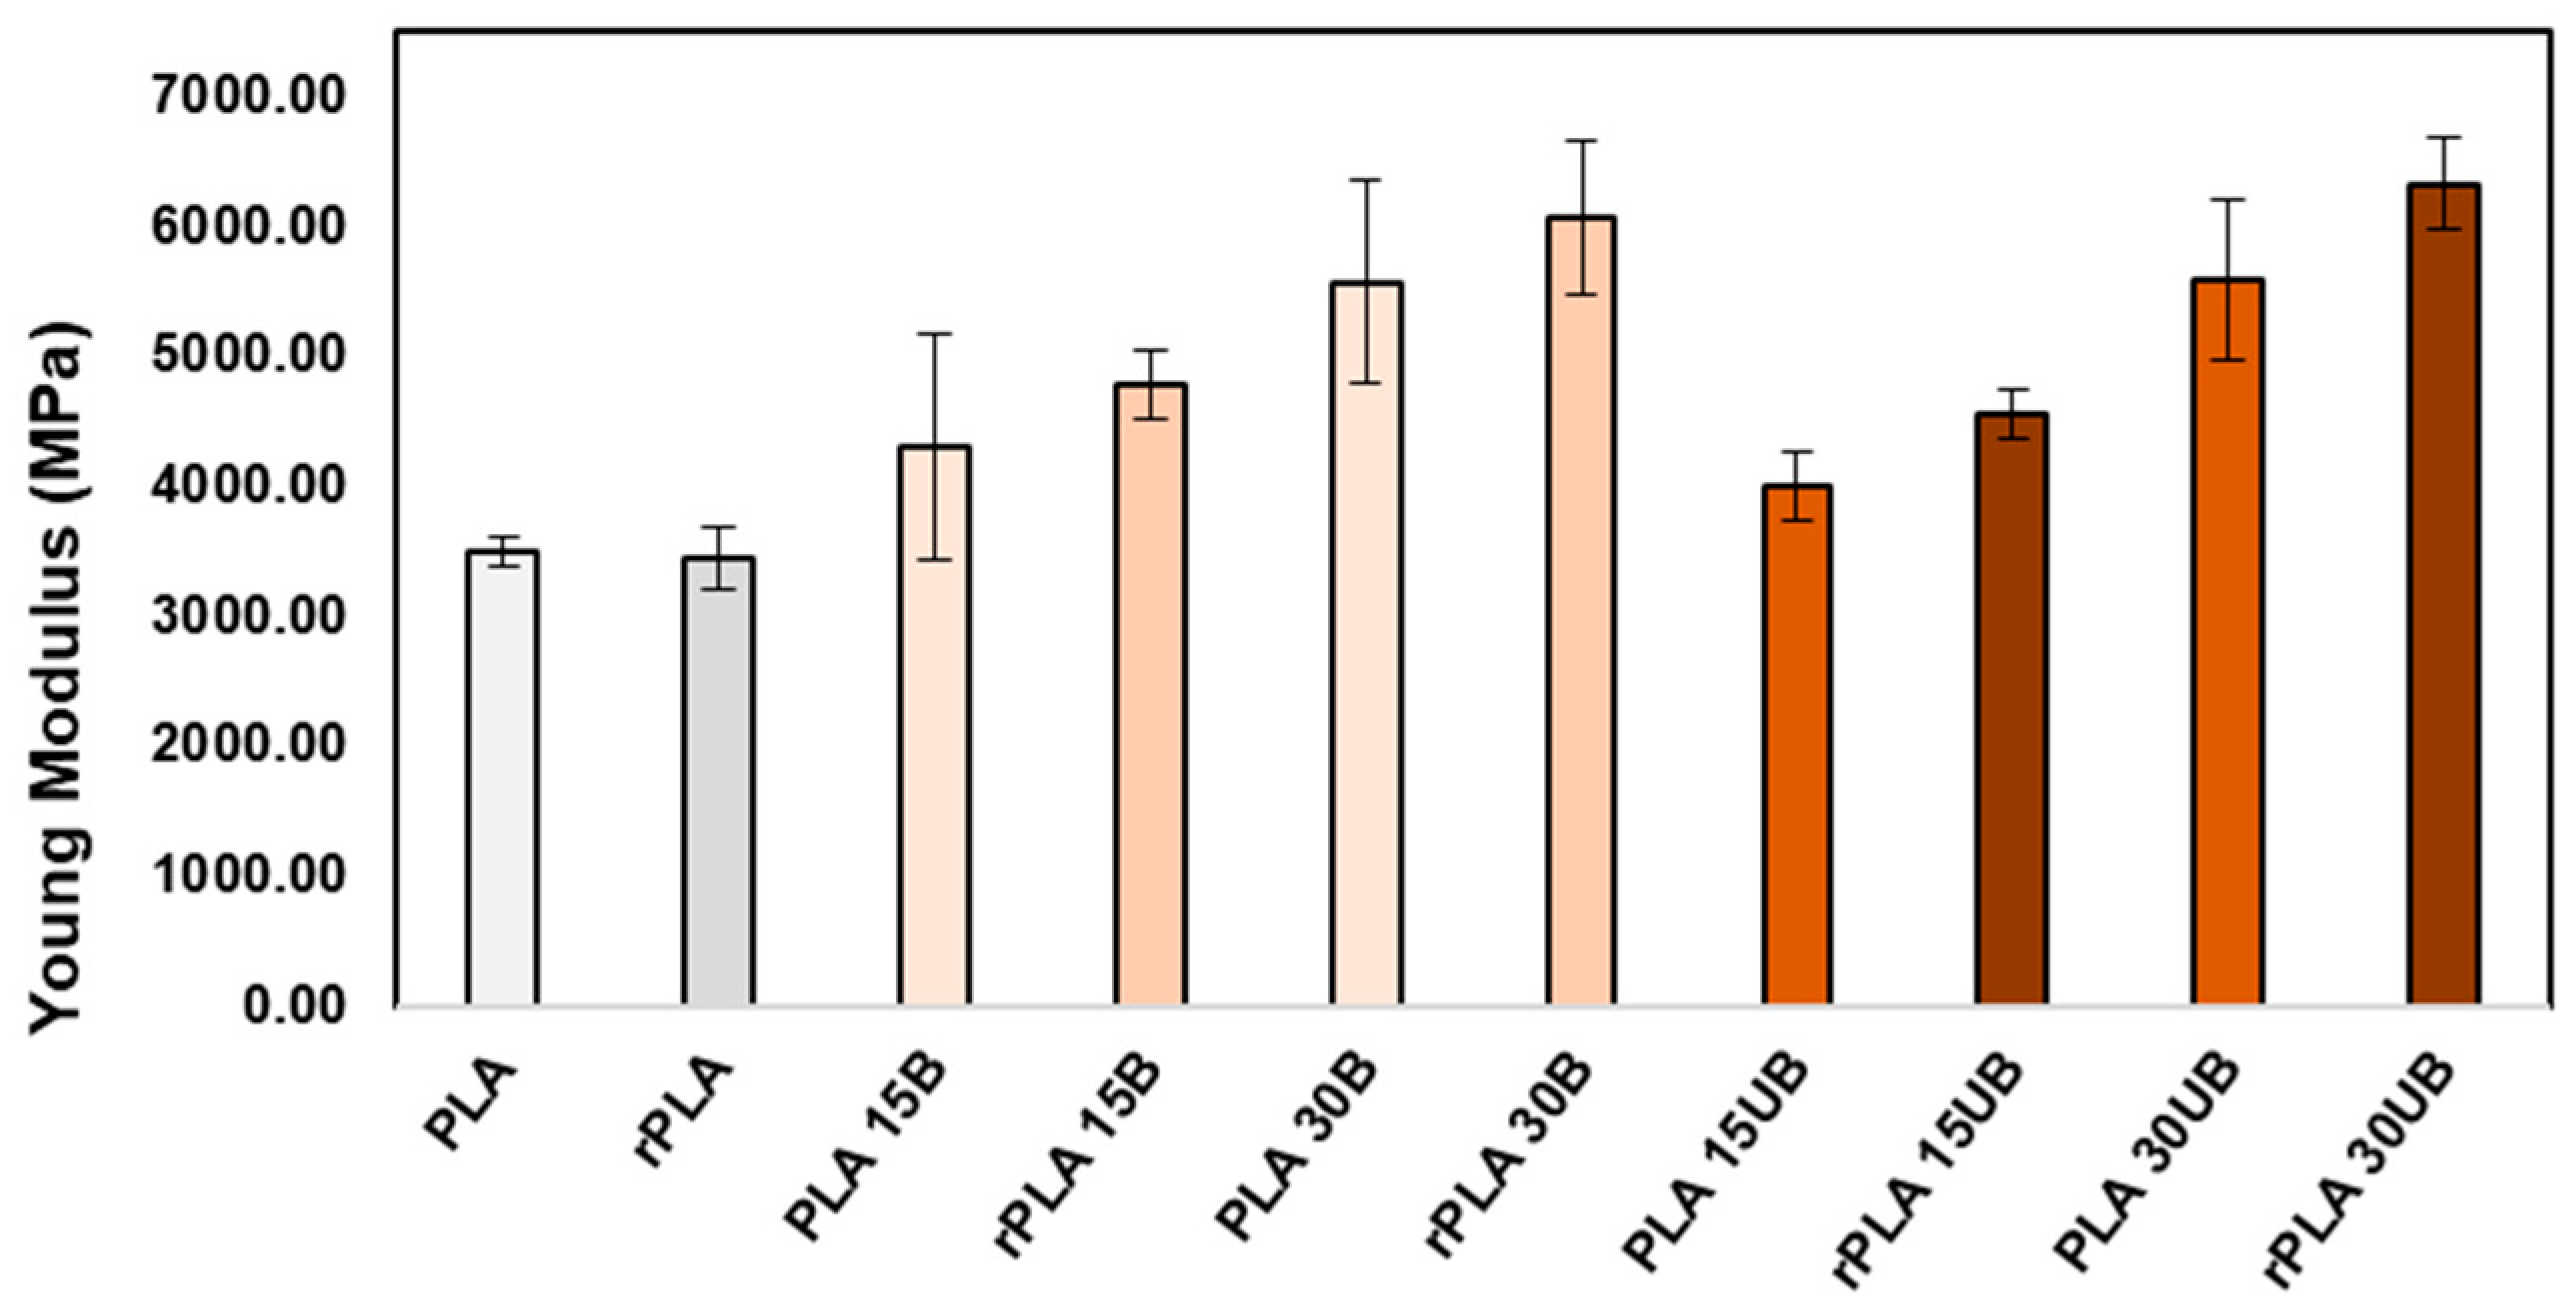
3.7.2. Young’s Modulus
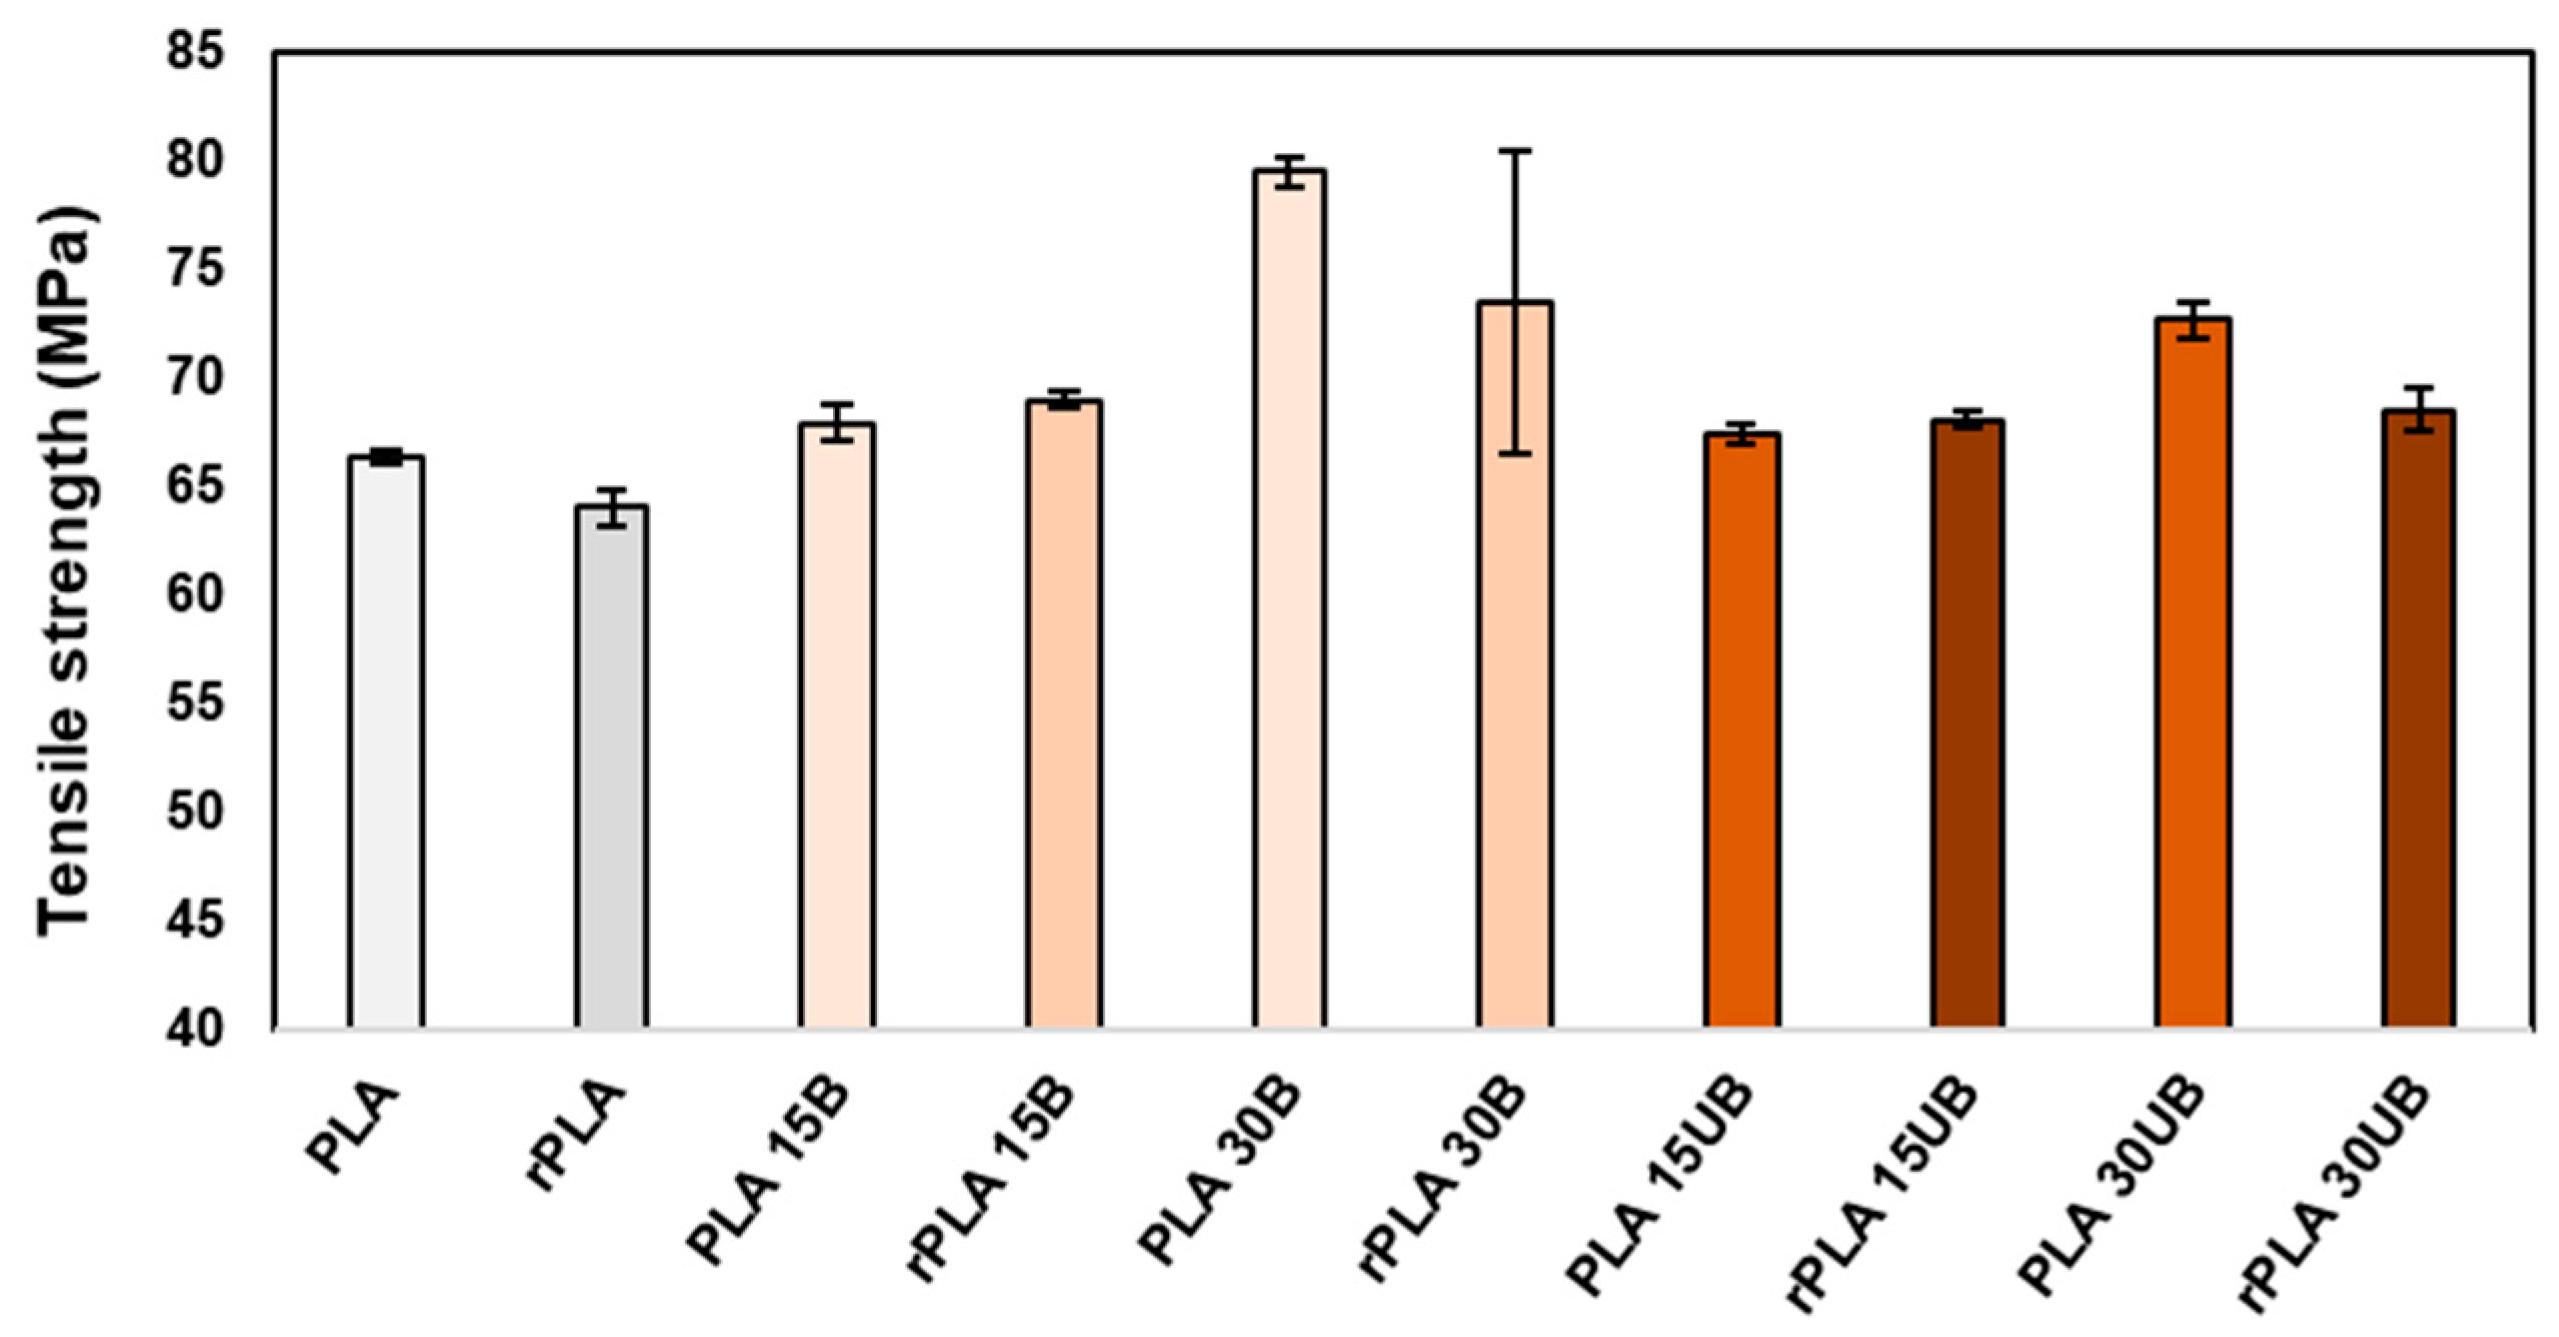
3.7.3. Tensile Strength
4. Conclusions
- Single-stage mechanical recycling of PLA–cellulosic fibre composites does not compromise the impact strength of the biocomposites and improves the Young’s modulus by 11–13%.
- For fibre content of 15 wt%, the tensile properties of the PLA biocomposite material remained intact, while for PLA with 30 wt% fibre, the tensile strength decreased by up to about 6–8% after mechanical recycling.
- The mechanical recycling of PLA–cellulose fibre composites improved fibre dispersion by reducing agglomeration by 11–37%.
- The mechanical recycling of PLA–cellulose fibre composites resulted in a notable degradation of 5–23% in PLA.
- The effect of PLA degradation can be compensated by adding a virgin polymer during recycling or using chain extenders, which is a typical method to maintain polymer chain length during recycling.
- Further research is needed on multiple mechanical recycling steps to evaluate the impact of mechanical recycling on PLA softwood fibre biocomposites.
Author Contributions
Funding
Institutional Review Board Statement
Data Availability Statement
Acknowledgments
Conflicts of Interest
References
- Arora, N.K.; Fatima, T. Environmental sustainability and biotechnology: Opportunities and challenges. Environ. Sustain. 2024, 7, 115–119. [Google Scholar] [CrossRef]
- Narayanan, D.; Giffin, M.T.; Neetha, P.S.; Jose, C.; Thomas, S. Natural Fiber-Reinforced Biopolymers as Construction Materials. In Handbook of Biopolymers; Thomas, S., Ar, A., Chirayil, C.J., Thomas, B., Eds.; Springer Nature Singapore: Singapore, 2023; pp. 1173–1193. [Google Scholar] [CrossRef]
- Zamora-Mendoza, L.; Gushque, F.; Yanez, S.; Jara, N.; Álvarez-Barreto, J.F.; Zamora-Ledezma, C.; Dahoumane, S.A.; Alexis, F. Plant Fibers as Composite Reinforcements for Biomedical Applications. Bioengineering 2023, 10, 804. [Google Scholar] [CrossRef] [PubMed]
- Pokharel, A.; Falua, K.J.; Babaei-Ghazvini, A.; Acharya, B. Biobased Polymer Composites: A Review. J. Compos. Sci. 2022, 6, 255. [Google Scholar] [CrossRef]
- Taib, N.A.A.B.; Rahman, M.R.; Huda, D.; Kuok, K.K.; Hamdan, S.; Bakri, M.K.B.; Julaihi, M.R.M.B.; Khan, A. A review on poly lactic acid (PLA) as a biodegradable polymer. Polym. Bull. 2023, 80, 1179–1213. [Google Scholar] [CrossRef]
- Cakmak, O.K. Biodegradable Polymers—A Review on Properties, Processing, and Degradation Mechanism. Circ. Econ. Sustain. 2023, 4, 339–362. [Google Scholar] [CrossRef]
- Bavaliya, K.J.; Vala, N.S.; Raj, M.; Raj, L. A review on biodegradable composites based on poly (lactic acid) with various bio fibers. Chem. Pap. 2024, 78, 2695–2728. [Google Scholar] [CrossRef]
- Oksman, K.; Skrifvars, M.; Selin, J.F. Natural fibres as reinforcement in polylactic acid (PLA) composites. Compos. Sci. Technol. 2003, 63, 1317–1324. [Google Scholar] [CrossRef]
- Haylock, R.; Rosentrater, K.A. Cradle-to-Grave Life Cycle Assessment and Techno-Economic Analysis of Polylactic Acid Composites with Traditional and Bio-Based Fillers. J. Polym. Environ. 2018, 26, 1484–1503. [Google Scholar] [CrossRef]
- Uitterhaegen, E.; Parinet, J.; Labonne, L.; Mérian, T.; Ballas, S.; Véronèse, T.; Merah, O.; Talou, T.; Stevens, C.V.; Chabert, F.; et al. Performance, durability and recycling of thermoplastic biocomposites reinforced with coriander straw. Compos. Part Appl. Sci. Manuf. 2018, 113, 254–263. [Google Scholar] [CrossRef]
- Beigbeder, J.; Soccalingame, L.; Perrin, D.; Bénézet, J.-C.; Bergeret, A. How to manage biocomposites wastes end of life? A life cycle assessment approach (LCA) focused on polypropylene (PP)/wood flour and polylactic acid (PLA)/flax fibres biocomposites. Waste Manag. 2019, 83, 184–193. [Google Scholar] [CrossRef]
- Bhattacharjee, S.; Bajwa, D.S. Feasibility of Reprocessing Natural Fiber Filled Poly(lactic acid) Composites: An In-Depth Investigation. Adv. Mater. Sci. Eng. 2017, 2017, 1430892. [Google Scholar] [CrossRef]
- Chaitanya, S.; Singh, I.; Song, J.I. Recyclability analysis of PLA/Sisal fiber biocomposites. Compos. Part B Eng. 2019, 173, 106895. [Google Scholar] [CrossRef]
- Rao, G.S.; Debnath, K.; Mahapatra, R.N. Recycling and degradation behaviour of the bamboo fibre reinforced green composite fabricated by injection moulding. Sustain. Mater. Technol. 2024, 39, e00865. [Google Scholar] [CrossRef]
- Nadali, E.; Naghdi, R. Effects of multiple extrusions on structure–property relationships of hybrid wood flour/poly (vinyl chloride) composites. J. Thermoplast. Compos. Mater. 2022, 35, 1076–1093. [Google Scholar] [CrossRef]
- Zhou, H.; Li, W.; Hao, X.; Zong, G.; Yi, X.; Xu, J.; Ou, R.; Wang, Q. Recycling end-of-life WPC products into ultra-high-filled, high-performance wood fiber/polyethylene composites: A sustainable strategy for clean and cyclic processing in the WPC industry. J. Mater. Res. Technol. 2022, 18, 1–14. [Google Scholar] [CrossRef]
- Finnerty, J.; Rowe, S.; Howard, T.; Connolly, S.; Doran, C.; Devine, D.M.; Gately, N.M.; Chyzna, V.; Portela, A.; Bezerra, G.S.N.; et al. Effect of Mechanical Recycling on the Mechanical Properties of PLA-Based Natural Fiber-Reinforced Composites. J. Compos. Sci. 2023, 7, 141. [Google Scholar] [CrossRef]
- Sivonen, E.; Valta, K. ‘Seulalevypuristin’, FI127057, 18 June 2012. Available online: https://cris.vtt.fi/en/publications/seulalevypuristin-siktkvarn (accessed on 10 July 2024).
- ISO 1133-1; Plastics—Determination of the Melt Mass-Flow Rate (MFR) and Melt Volume Flow Rate (MVR) of Thermoplastics—Part 1: Standard Method. International Organization for Standardization: Geneva, Switzerland, 2011.
- Virtanen, P.; Gommers, R.; Oliphant, T.E.; Haberland, M.; Reddy, T.; Cournapeau, D.; Burovski, E.; Peterson, P.; Weckesser, W.; Bright, J.; et al. SciPy 1.0: Fundamental algorithms for scientific computing in Python. Nat. Methods 2020, 17, 261–272. [Google Scholar] [CrossRef]
- Van der Walt, S.; Schönberger, J.L.; Nunez-Iglesias, J.; Boulogne, F.; Warner, J.D.; Yager, N.; Gouillart, E.; Yu, T. scikit-image: Image processing in Python. PeerJ 2014, 2, e453. [Google Scholar] [CrossRef]
- Mohapatra, A.K.; Mohanty, S.; Nayak, S.K. Effect of PEG on PLA/PEG blend and its nanocomposites: A study of thermo-mechanical and morphological characterization. Polym. Compos. 2014, 35, 283–293. [Google Scholar] [CrossRef]
- TAPPI Standard Method T271; Fiber Length Of Pulp And Paper By Automated Optical Analyzer Using Polarized Light. TAPPI: Peachtree Corners, GA, USA, 2012.
- ISO-179-2; Plastics—Determination of Charpy Impact Properties—Part 2: Instrumented Impact Test. International Organization for Standardization: Geneva, Switzerland, 1997.
- ISO-527-2; Plastics—Determination of Tensile Properties—Part 2: Test Conditions for Moulding and Extrusion Plastics. International Organization for Standardization: Geneva, Switzerland, 2012.
- Ramos-Hernández, T.; Robledo-Ortíz, J.R.; Del Campo, A.S.M.; Rodrigue, D.; Cano, A.; Pérez-Fonseca, A.A. Mechanical recycling of poly(lactic acid)/agave fiber biocomposites. J. Reinf. Plast. Compos. 2024, 43. [Google Scholar] [CrossRef]
- Park, C.W.; Youe, W.J.; Namgung, H.W.; Han, S.Y.; Seo, P.N.; Chae, H.M.; Lee, S.H. Effect of lignocellulose nanofibril and polymeric methylene diphenyl diisocyanate addition on plasticized lignin/polycaprolactone composites. BioResources 2018, 13, 6802–6817. [Google Scholar] [CrossRef]
- Domínguez-Robles, J.; Larrañeta, E.; Fong, M.L.; Martin, N.K.; Irwin, N.J.; Mutjé, P.; Tarrés, Q.; Delgado-Aguilar, M. Lignin/poly(butylene succinate) composites with antioxidant and antibacterial properties for potential biomedical applications. Int. J. Biol. Macromol. 2020, 145, 92–99. [Google Scholar] [CrossRef] [PubMed]
- Pérez-Fonseca, A.A.; González-López, M.E.; Robledo-Ortíz, J.R. Reprocessing and Recycling of Poly(Lactic Acid): A Review. J. Polym. Environ. 2023, 31, 4143–4159. [Google Scholar] [CrossRef]
- Peltola, H.; Immonen, K.; Johansson, L.; Virkajärvi, J.; Sandquist, D. Influence of pulp bleaching and compatibilizer selection on performance of pulp fiber reinforced PLA biocomposites. J. Appl. Polym. Sci. 2019, 136, 47955. [Google Scholar] [CrossRef]
- Asad, F.; Immonen, K.; Kiiskinen, T.; Sarlin, E. Effect of unbleached and bleached softwood cellulose pulp fibers on poly(lactic acid) properties. BioResources 2024, 19, 5338–5351. [Google Scholar] [CrossRef]
- Hidalgo-Carvajal, D.; Muñoz, Á.H.; Garrido-González, J.J.; Carrasco-Gallego, R.; Montero, V.A. Recycled PLA for 3D Printing: A Comparison of Recycled PLA Filaments from Waste of Different Origins after Repeated Cycles of Extrusion. Polymers 2023, 15, 3651. [Google Scholar] [CrossRef]
- Velghe, I.; Buffel, B.; Vandeginste, V.; Thielemans, W.; Desplentere, F. Review on the Degradation of Poly(lactic acid) during Melt Processing. Polymers 2023, 15, 2047. [Google Scholar] [CrossRef]
- Rydz, J.; Sikorska, W.; Kyulavska, M.; Christova, D. Polyester-Based (Bio)degradable Polymers as Environmentally Friendly Materials for Sustainable Development. Int. J. Mol. Sci. 2014, 16, 564–596. [Google Scholar] [CrossRef]
- Kim, J.S.; Cheon, C.I. Crystallization and void formation in ZnO–B2O3–SiO2–MgO sintered solder glasses. J. Mater. Sci. 1997, 32, 1575–1579. [Google Scholar] [CrossRef]
- Lagazzo, A.; Moliner, C.; Bosio, B.; Botter, R.; Arato, E. Evaluation of the Mechanical and Thermal Properties Decay of PHBV/Sisal and PLA/Sisal Biocomposites at Different Recycle Steps. Polymers 2019, 11, 1477. [Google Scholar] [CrossRef]


| Sample | Cellulose (%) | Hemicellulose (%) | Lignin (%) |
|---|---|---|---|
| BSKPF | 85 | 15 | - |
| UBSKPF | 77 | 16 | 7 |
| Composition | Sample Code | Screw Speed (rpm) | Zone Temperature (°C) |
|---|---|---|---|
| PLA 85 wt.% + BSKPF 15 wt.% | PLA 15B | 150–175 | 165–175–185–190–190–190–190–185 |
| PLA 70 wt.% + BSKPF 30 wt.% | PLA 30B | 150–175 | 165–175–185–190–190–190–190–185 |
| PLA 85 wt.% + UBSKPF 15 wt.% | PLA 15UB | 150–175 | 165–175–185–190–190–190–190–185 |
| PLA 70 wt.% + UBSKPF 30 wt.% | PLA 30UB | 150–175 | 165–175–185–190–190–190–190–185 |
| Sample | Tg (°C) | Tc (°C) | ΔHc (J/g) | Tm (°C) | ΔHm (J/g) | Degree of Crystallization (%) |
|---|---|---|---|---|---|---|
| PLA | 61.1 | 100.9 | 28.6 | 170.4 | 39.6 | 11.8 |
| rPLA | 60.3 | 100.3 | 29.9 | 169.8 | 37.9 | 8.5 |
| PLA 15B | 62.5 | 98.9 | 24.3 | 168.4 | 48.0 | 25.4 |
| rPLA 15B | 62.4 | 96.4 | 17.7 | 168.6 | 40.6 | 24.6 |
| PLA 30B | 62.7 | 95.5 | 12.6 | 168.5 | 36.2 | 25.3 |
| rPLA 30B | 62.3 | 93.4 | 18.8 | 168.0 | 36.1 | 18.5 |
| PLA 15UB | 62.2 | 99.1 | 19.6 | 168.1 | 41.4 | 23.4 |
| rPLA 15UB | 61.4 | 99.1 | 18.7 | 168.5 | 35.3 | 17.8 |
| PLA 30UB | 60.0 | 98.1 | 12.6 | 168.7 | 24.3 | 14.2 |
| rPLA 30UB | 61.1 | 96.0 | 18.1 | 167.9 | 39.8 | 23.2 |
Disclaimer/Publisher’s Note: The statements, opinions and data contained in all publications are solely those of the individual author(s) and contributor(s) and not of MDPI and/or the editor(s). MDPI and/or the editor(s) disclaim responsibility for any injury to people or property resulting from any ideas, methods, instructions or products referred to in the content. |
© 2025 by the authors. Licensee MDPI, Basel, Switzerland. This article is an open access article distributed under the terms and conditions of the Creative Commons Attribution (CC BY) license (https://creativecommons.org/licenses/by/4.0/).
Share and Cite
Asad, F.; Immonen, K.; Kiiskinen, T.; Mikkelson, A.; Sarlin, E. The Impact of Mechanical Recycling on Ligno-Cellulose Fibre Containing PLA Biocomposite. Polymers 2025, 17, 732. https://doi.org/10.3390/polym17060732
Asad F, Immonen K, Kiiskinen T, Mikkelson A, Sarlin E. The Impact of Mechanical Recycling on Ligno-Cellulose Fibre Containing PLA Biocomposite. Polymers. 2025; 17(6):732. https://doi.org/10.3390/polym17060732
Chicago/Turabian StyleAsad, Faizan, Kirsi Immonen, Titta Kiiskinen, Atte Mikkelson, and Essi Sarlin. 2025. "The Impact of Mechanical Recycling on Ligno-Cellulose Fibre Containing PLA Biocomposite" Polymers 17, no. 6: 732. https://doi.org/10.3390/polym17060732
APA StyleAsad, F., Immonen, K., Kiiskinen, T., Mikkelson, A., & Sarlin, E. (2025). The Impact of Mechanical Recycling on Ligno-Cellulose Fibre Containing PLA Biocomposite. Polymers, 17(6), 732. https://doi.org/10.3390/polym17060732