Article

Effects of Molecular Structure on the Physical Properties of Fully Substituted Cellulose Esters of Aliphatic Acids

1
Biomass Innovation Center, R&D Headquarters, Daicel Corporation, Kakuma-machi, Kanazawa-shi 920-1192, Ishikawa, Japan
2
Graduate School of Natural Science and Technology, Kanazawa University, Kakuma-machi, Kanazawa-shi 920-1192, Ishikawa, Japan
3
Life Sciences R&D Center, PharmaTek BU, Life Sciences SBU, Arai Plant, Daicel Corporation, Myoko-shi 944-8550, Niigata, Japan
4
Business Development Center, R&D Headquarters, Daicel Corporation, Minato-ku, Tokyo 108-8230, Japan
*
Author to whom correspondence should be addressed.
Polymers 2025, 17(8), 1053; https://doi.org/10.3390/polym17081053
Submission received: 6 January 2025 / Revised: 4 April 2025 / Accepted: 9 April 2025 / Published: 14 April 2025
(This article belongs to the Section Biobased and Biodegradable Polymers)

Abstract

:
According to the literature, mainly in relation to mixed cellulose esters (MCEs) with two types of acyl group, the solubility parameter (SP) is a measure of certain physical properties of MCE that is helpful for property prediction; contrary to expectations, it has been implied by different studies that simple cellulose esters (SCEs) with only one type of acyl group do not altogether follow the empirical relationship. In this study, MCE and SCE were systematically prepared to verify the SP—property relationship. It was revealed that the correlation between SP and physical properties exists only for MCE. Thermal analysis revealed that MCEs possess remarkable unidentified endothermic transition depending on the ratio of two acyl groups, suggesting that the formation of such a stable structure could contribute to the difference between MCE and SCE. It was also revealed that, even for MCE, the empirical relationship involving SP varies from acyl group to acyl group; there is no universal relationship. In spite of aforementioned limitation, the empirical relationship with SP was verified to be useful for the property prediction of MCE. We demonstrated that the Fox equation and Voigt model are also useful for this prediction.

Graphical Abstract

1. Introduction

According to the Organisation for Economic Co-operation and Development projections for 2060, there will be a substantial increase in the volume of global plastic waste driven by economic growth in developing countries. Global plastic consumption is expected to triple between 2019 and 2060 if no new policies are introduced [1]. By 2022, global plastic production was estimated to reach 400.3 million tons, with fossil-based plastics accounting for 362.3 million tons, or 90.6% of the total, while bio-based plastics contribute only 2.3 million tons (0.5% of the total) [2]. This context highlights the urgent need to shift toward renewable and potentially biodegradable bio-based plastics, given the finite nature of fossil resources and the environmental impacts associated with greenhouse gas (GHG) emissions during the production, disposal, and release of plastics into the environment [3,4]. Cellulose, the primary component of woody biomass, is the most abundant biomaterial on Earth, with an estimated annual production of 700 billion tons [5]. However, only a small fraction is utilized in cellulosic materials, such as regenerated cellulose and cellulose derivatives [6]. This limited usage is primarily due to cellulose’s strong intra- and intermolecular hydrogen bonding, which results in insolubility in most organic solvents and lack of melt processability [7].
Esterification, which uses the hydroxyl groups of cellulose as reactive sites, is a possible method for modifying the intrinsic properties of cellulose and introducing new functionalities, leading to the formation of cellulose esters (CEs) [8,9,10]. A prominent industrial example of esterification is cellulose acetate, where acetic acid is chemically bonded to cellulose via an ester linkage [11]. Cellulose acetate has become an indispensable industrial material, widely used in the production of fibers, cigarette filters, membranes, and various other applications owing to its unique properties [12]. However, cellulose acetate does not exhibit thermoplastic properties because it decomposes before melting [13]. Consequently, cellulose acetate resins have been developed by blending cellulose acetate with plasticizers [14,15]. Other commercially available CEs, such as cellulose acetate propionate and cellulose acetate butyrate, display a lower melt processability than petroleum-based plastics, necessitating the use of plasticizers in bioplastic applications [16]. Plasticizers incorporated into CEs, defined in this study as “external plasticizers,” generally have a low molecular weight, which poses limitations in the application of the resultant plastics. The addition of external plasticizers not only leads to leaching over time, resulting in the deterioration of mechanical properties [17], but also causes the release of volatile compounds that are harmful to humans and the environment during the molding process [18,19]. Chemical modification with flexible substituents on the cellulosic backbone has been implemented as an internal plasticization strategy to address issues associated with external plasticization [20,21]. Although simple CEs (SCEs) modified with long-chain aliphatic acids as internal plasticizers have been extensively studied [22,23,24,25], they have not been commercially utilized. From our point of view, this is due to two primary reasons: (1) an economical manufacturing process has yet to be established and (2) guidelines for designing CEs as plasticizer-free thermoplastics with the desired properties have not been fully developed. This study focused on the molecular design of such CEs.
Appropriately adjusting physical properties such as thermal stability and mechanical strength is essential when considering alternatives to petroleum-derived plastics. Mixed esterification of cellulose with both short and long alkyl moieties is an effective strategy for tuning the physical properties of CEs over a broad range because these properties are significantly influenced by the introduced substituents and the degree of substitution (DS) [26,27,28,29,30,31]. Edgar et al. investigated MCEs involving the two substituents, acetyl and acyl (propyl, butyl, hexyl, or nonanoyl) groups, and found liner correlations between the solubility parameter (SP) and the Tg, logarithmic melt viscosity, or flexural modulus, drawing a conclusion that the properties of CE may be predicted with confidence without laboratory efforts [27]. The SP–physical property relationships established in the literature are indeed useful within the materials studied there. However, before extending the empirical relationship to any CEs, there is a serious question to address; as far as the melting points of a series of SCEs from other studies [22,23] are concerned, SCEs do not follow an empirical linear relationship involving SP (Figure 1).
In this study, we aim to investigate whether or not MCE and SCE are different in terms of SP–physical property relationships and to discuss better property predictions. To this end, a series of SCEs and MCEs were systematically prepared for the evaluation of physical properties, while the corresponding SP values were calculated by means of group contribution methods established by a few different groups with a view to assessing empirical relationships involving SP.

2. Materials and Methods

2.1. Materials

Lyocell fibers (Tencel, Lenzing AG, Lensing, Austria) cut into 5 mm long pieces were used as the starting material for the preparation of CEs. Lithium chloride (LiCl; 99%), N,N-dimethylacetamide (DMAc; ultra-hydrated, 99.5%), tetrahydrofuran (THF; 99.5%), and methanol (99.8%) were obtained from FUJIFILM Wako Pure Chemical Corporatio, Osaka, Japan. 4-Dimethylaminopyridine (DMAP; 99%), acetyl chloride (98%), hexanoyl chloride (98%), lauroyl chloride (98%), myristoyl chloride (98%), palmitoyl chloride (97%), and stearoyl chloride (96%) were sourced from Tokyo Chemical Industry Co., Ltd., Tokyo, Japan. All raw materials and solvents were used as received, without further purification or treatment.

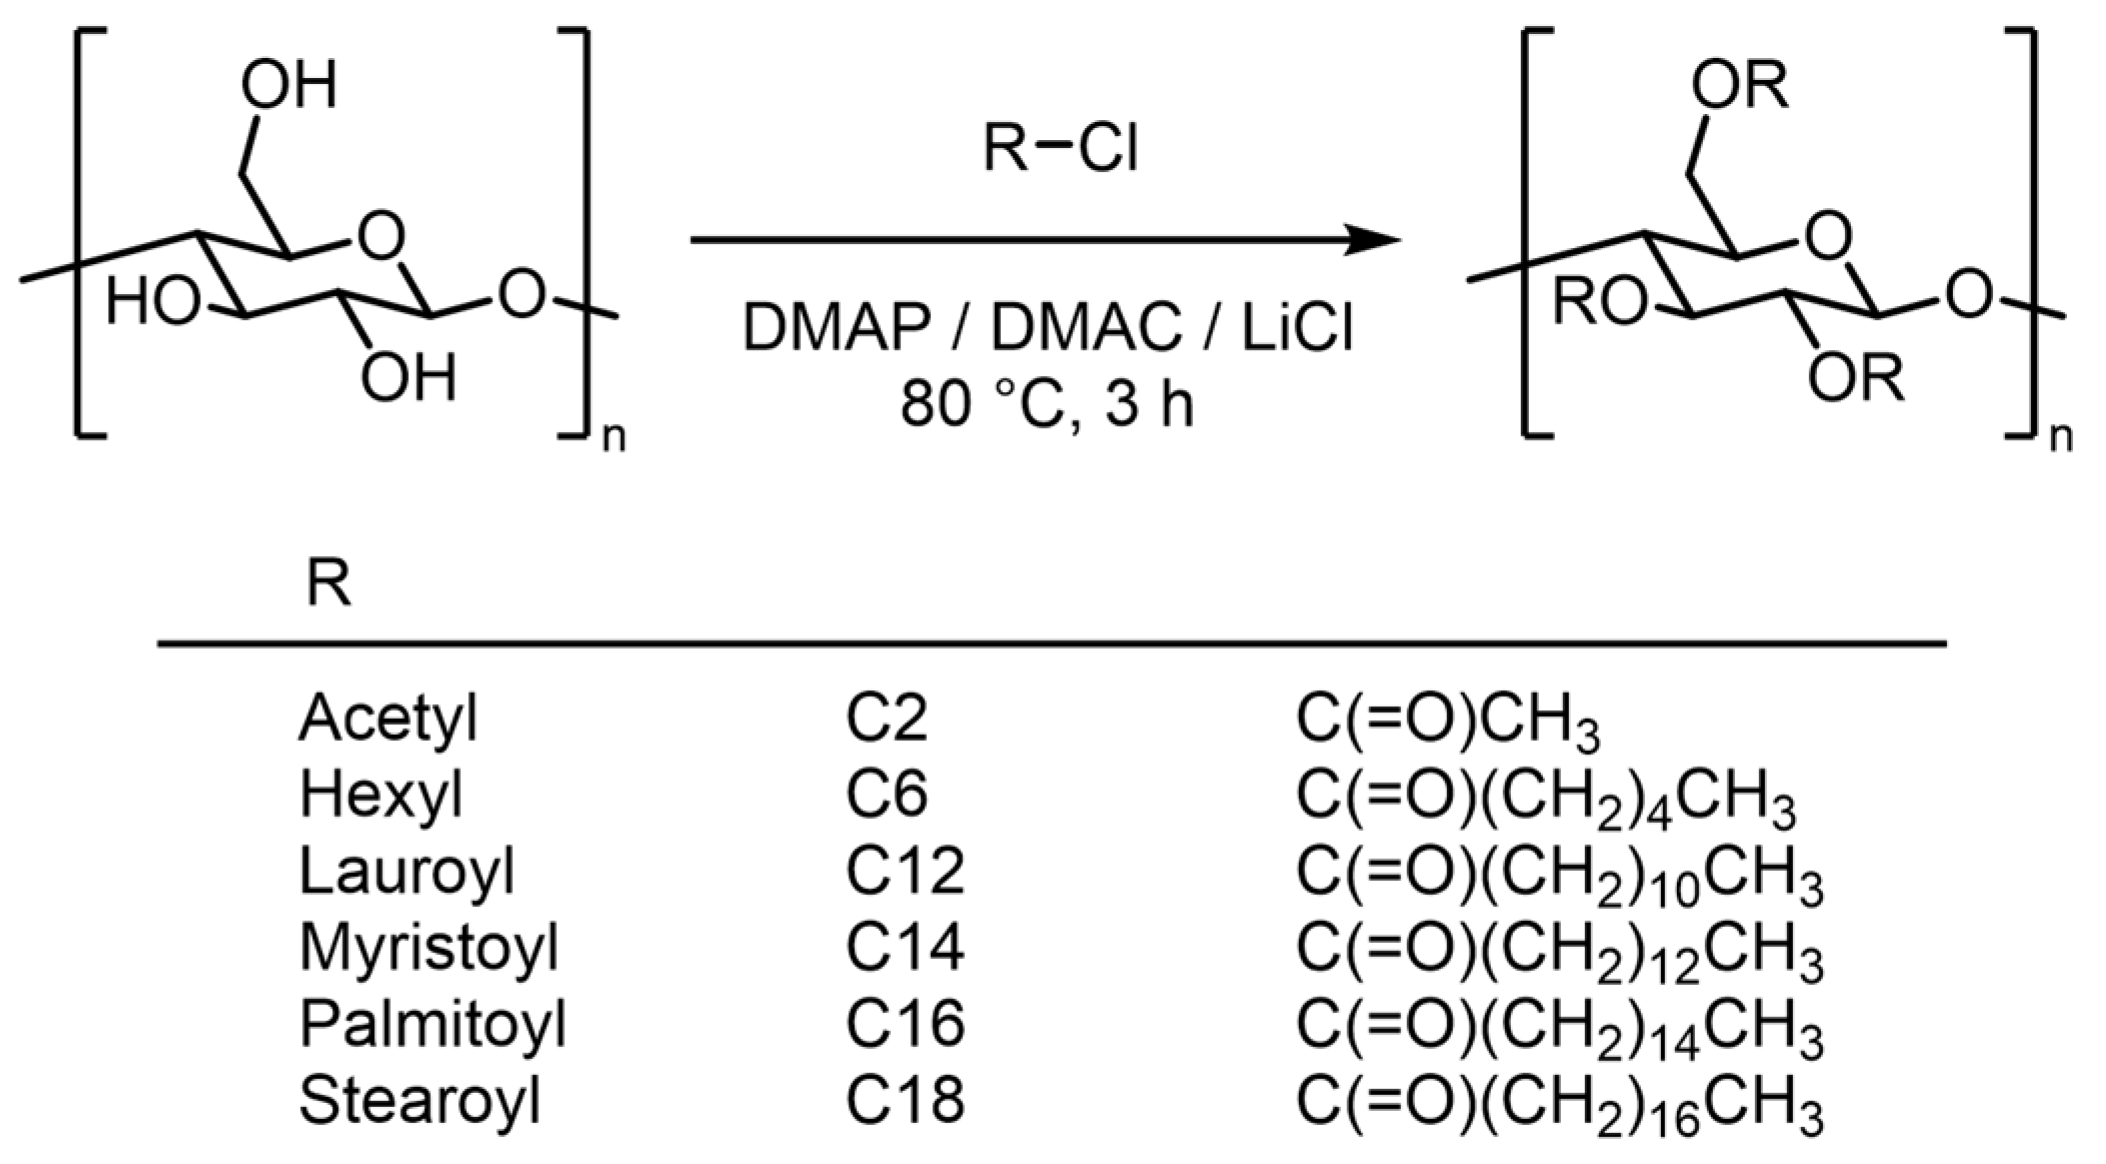
2.2. Preparation of SCEs

The reaction is illustrated in Scheme 1 and preparation parameters such as total acid chlorides, catalyst level, cellulose consistency, temperature, and time were determined considering previous works in relation to similar reaction systems [33,34,35,36,37,38,39]. First, 0.40 g (2.5 mmol, based on anhydrous glucose units) of cellulose (Tencel) was weighed into a test tube. Next, 15.04 g of dehydrated DMAc was added under a nitrogen atmosphere. The mixture was heated to 130 °C with continuous stirring for 2 h. Next, the mixture was allowed to cool to 25 °C, and 1.07 g of LiCl was added. The temperature then increased to 150 °C at a controlled rate of 20 °C every 10 min. The mixture was held at 150 °C for an additional 20 min. After confirming complete dissolution, 0.90 g (7.4 mmol) of DMAP was added, and the temperature was raised to 80 °C. Once DMAP was fully dissolved, acid chloride (22.5 mmol, corresponding to the target SCE) was added dropwise. The reaction proceeded at 80 °C for 3 h to ensure complete acylation. Methanol was then added to quench any unreacted acyl chloride. A substantial volume of methanol was subsequently added to precipitate the product, which was then filtered and washed with methanol to remove impurities. For further purification, the obtained product was dissolved in THF and re-precipitated by adding methanol. The resultant solid was collected by filtration, washed again with methanol, and vacuum-dried at 50 °C overnight. This process yielded the target SCEs, successfully completing their preparation.

2.3. Preparation of MCEs

A homogeneous solution was prepared following the same method as that used for SCEs. Before the addition of acid chlorides, acetyl chloride and lauroyl chloride were combined at molar ratios of 7.5/1.5, 6.0/3.0, 4.5/4.5, 3.0/6.0, and 1.5/7.5, totaling 22.2 mmol. This mixture was then added dropwise and allowed to react at 80 °C for 3 h. After the reaction was complete, methanol was added to quench any unreacted acyl chloride. A substantial volume of methanol or methanol aqueous solution was subsequently added to precipitate the product. The following steps in the preparation of SCEs were performed, resulting in the isolation of MCEs.

2.4. Chemical Characterization

A total of 10 mg of CE was dissolved in 1 g of deuterated chloroform (CDCl3) or deuterated dimethyl sulfoxide (DMSO-d6) to determine the DS, and 1H nuclear magnetic resonance (NMR) spectroscopy was conducted at 40 °C for CDCl3 or 80 °C for DMSO-d6 using a JNM-ECZL600R FT NMR spectrometer (JEOL Ltd., Tokyo, Japan). The DS was calculated using an integration method. The molecular weights of the CEs were measured by gel permeation chromatography (GPC) using a Prominence GPC system (Shimadzu Corporation, Kyoto, Japan) equipped with an RID-20A refractive index detector and two LF-804 columns (8.0 mm × 30 cm, Shodex, Tokyo, Japan). The eluent was either THF without a stabilizer or 20 mM LiBr/DMAc, with polystyrene used as the standard. GPC was performed at an oven temperature of 40 °C in THF or 50 °C in 20 mM LiBr/DMAc.

2.5. Thermal Properties

The thermal decomposition of the CEs was analyzed by thermogravimetric differential thermal analysis (TG-DTA) under a nitrogen atmosphere using a NEXTA STA200RV thermogravimetric analyzer (Hitachi High-Tech Analysis Corporation, Tokyo, Japan). The samples were heated from 30 to 550 °C at a rate of 20 °C/min, and the temperature at 5% weight loss (Td5%) was used as an index of thermal decomposition.
The glass transition temperature (Tg) was determined by differential scanning calorimetry (DSC) under a nitrogen atmosphere using a NEXTA DSC600 differential scanning calorimeter (Hitachi High-Tech Analysis Corporation, Tokyo, Japan). The samples were first heated from room temperature to 240 °C at a rate of 10 °C/min and held at 240 °C for 5 min (first heating scan), followed by cooling from 240 to −80 °C at the same rate. Tg was estimated from the thermogram of the second heating scan, obtained by reheating the samples to 240 °C at the same rate.

2.6. Preparation of Hot-Pressed Films

The hot-pressed films of the CEs were prepared using an MP-SNL mini test press (Toyo Seiki Seisaku-sho, Ltd., Tokyo, Japan). The press molding of the CEs was performed at 200 °C under a pressure of 15 MPa between aluminum sheets, and the pressed films were rapidly cooled by flushing the press plates with water at 25 °C after heating. The films had an area of 25 cm2 and an average thickness of 500 μm.

2.7. Mechanical Properties

The mechanical properties of the CEs were measured using a Tensilon RTF-1350 system (A&D Company, Ltd., Tokyo, Japan) under conditions of 23 °C and 50% relative humidity. The tensile tests were conducted on the hot-pressed films processed into a dumbbell shape (film thickness = 500 μm, initial gauge length = 20 mm), with more than ten specimens tested for each CE. The tensile modulus was calculated from the initial linear slope of the stress–strain curve obtained at a tensile speed of 5 mm/min according to relevant ISO [40].

3. Results and Discussion

3.1. Esterification of Cellulose and Determination of DS

Table 1 enumerates representative samples of SCE and MCE systematically prepared in this study. The sample preparation was systematic in terms of the selection of acyl groups and substituent ratio of MCE. The preparation parameters were determined with reference to the literature [33,34,35,36,37,38,39]. The parameter settings for sample preparations were the same except for the type of acylation agent. As shown in Table 1, the total degree of substitution (DStotal) was 3.0 for the samples. The apparent weight-average degree of polymerization (DPw) expressed as the polystyrene standard decreased as the carbon number increased. Malm et al. reported that, for a series of SCEs with a similar absolute degree of polymerization, the apparent intrinsic viscosity (limiting viscosity number) decreases as the carbon number increases [41]. Therefore, the systematic difference in SCEs in apparent DPw observed in this study must be smaller or negligible if expressed in absolute DPw. The DS of the CEs was determined by 1H NMR spectroscopy. As an example, the NMR spectra of the CL3.0 (DSLa3.0) and CAL1.6 (DSLa1.6) are shown in Figure 2. The degree of substitution by the lauroyl group (DSLa) was determined from the peak observed at 0.8–1.0 ppm, corresponding to the terminal methyl group (Equation (1)). The degree of substitution by the acetyl group (DSAc) was calculated using Equation (2) because of the overlap of the acetyl peak (peak f in Figure 2B).
D S L a = 7.06 × I e ( δ 0.88 ) 3.02 × I a ( δ 3.0 5.5 )
D S A c = 7.06 × I f , b ( δ 1.8 2.5 ) 2.06 × D S L a × I a ( δ 3.0 5.5 ) 3.02 × I a ( δ 3.0 5.5 ) .
The DS, molar mass, and degree of polymerization of the SCEs and MCEs prepared in this study are listed in Table 1. In Table 1, DSx/DSTotal is defined as the substituent ratio, representing the fraction of the longer substituent. Further data regarding the preparation are shown in Table S1 and Figure S1.

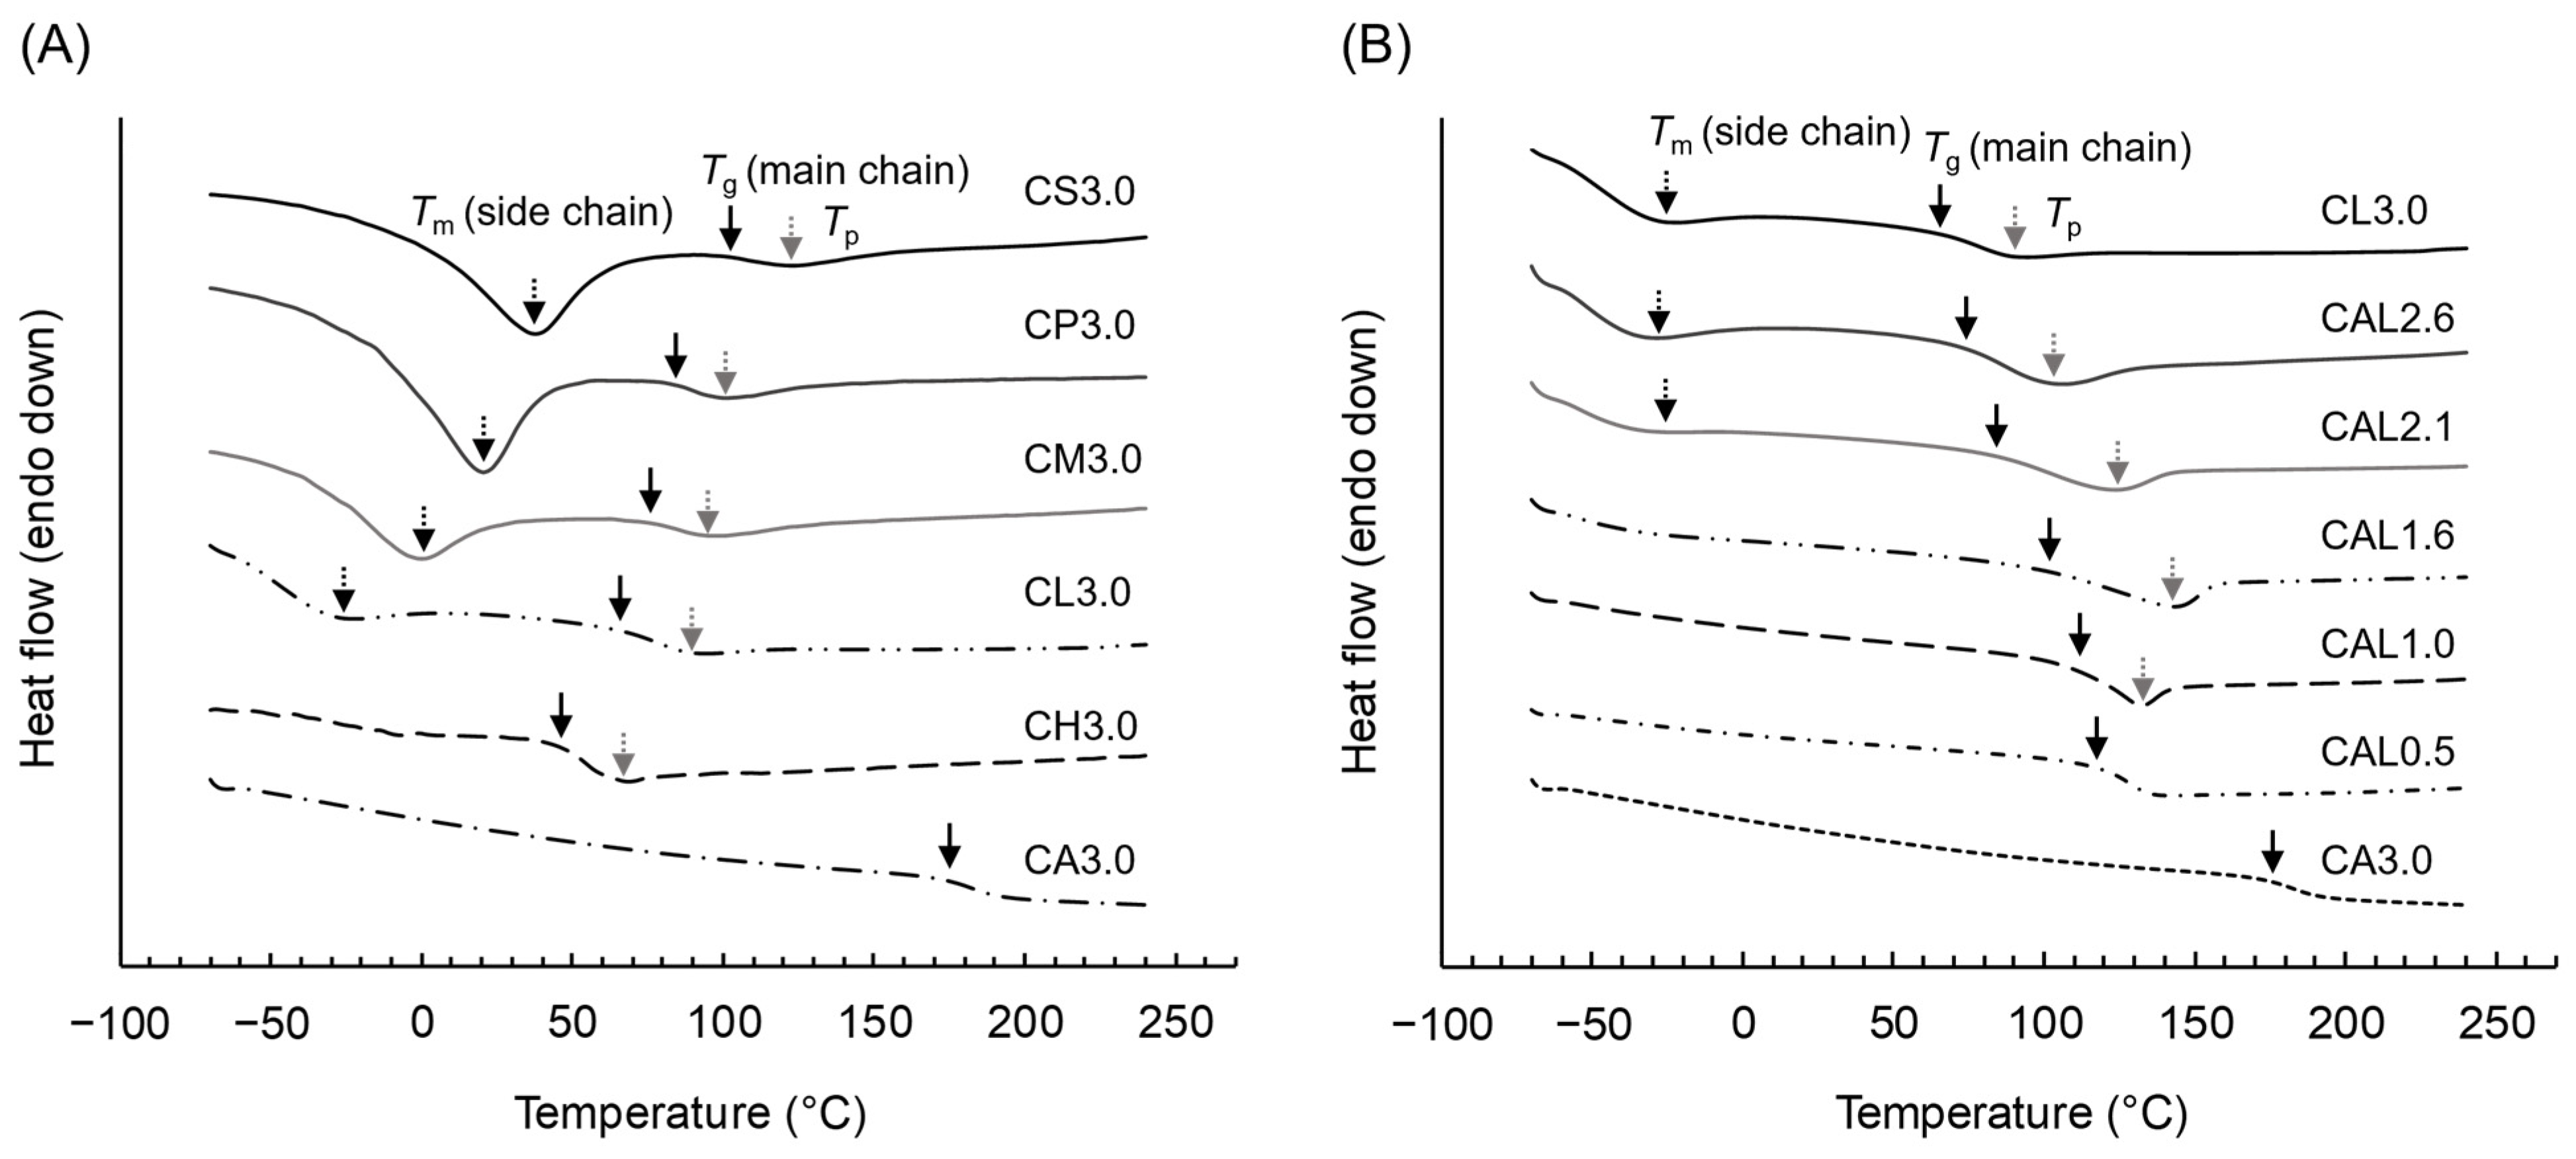
3.2. Thermal Properties of MCEs

All of the CALs were successfully molded into hot-pressed films and strip-shaped plates at 200 °C without any external plasticizer incorporated, suggesting the potential of CALs as thermoplastics. The thermal decomposition and transition temperatures of the SCEs and CALs were evaluated by TG-DTA and DSC. The 5% weight loss temperatures (Td5%), transition temperatures (Tm, Tg, and Tp), and the corresponding enthalpy changes (ΔHm and ΔHp) are summarized in Table 2. The thermogravimetric analysis (TGA) profiles obtained by heating these CEs from 30 °C to approximately 500 °C at a rate of 20 °C/min are shown in Figure S2. Previous research indicates that the thermal decomposition of SCEs is influenced by the degree of acyl substitution, with higher substitution levels contributing to relatively high thermal stability [42]. In contrast, the carbon number of the acyl group has minimal effect on the thermal stability [43]. The TG-DTA results reveal that the primary decomposition of the CALs begins at approximately 320 °C, with no significant difference in thermal stability observed in relation to that of the SCEs.
Figure 3 shows the second-heating DSC thermograms of the CEs. The thermograms display a broad glass transition for all of the CEs and, in some cases, one or two broad endothermic peaks (Tm and Tp). Among these thermal transitions, the low-temperature endothermic peaks (Tm) are associated with the melting of the acyl groups. Figure 3A shows that SCEs with C12 or a longer acyl chain exhibit a peak corresponding to the melting point of the aliphatic acid groups in the DSC thermogram, as previously reported [25]. For these SCEs, the highest Tm and largest ΔHm were observed for the stearoyl group, which had the longest alkyl chain, and as the carbon number decreased, the Tm shifted to lower values and the ΔHm decreased. In Figure 3B, the peaks of Tm were observed in the low-temperature regions of CL3.0, CAL2.6, and CAL2.1. Furthermore, the ΔHm of these peaks tended to decrease with a reduction in the lauroyl substituent ratio, and the Tm was absent for CAL1.6. The disappearance of the Tm observed for the CALs suggests that the crystallization of lauroyl groups is inhibited by modification with acetyl groups. The Tp is an endothermic peak observed at a temperature higher than the Tg by approximately ~40 °C, which has not been attributed to any type of transition in this study. Similar endothermic peaks were reported for similar CEs in previous studies, but in our view, the origin of such endothermic peaks is still controversial; Glasser et al. reported that they were melting points [26], while Yamagishi et al. and Tanaka et al. independently reported that they could be a transition from an anisotropic to isotropic phase [29,44]. The Tp must be some kind of a transition but could not be attributed to either the melting point or anisotropic-to-isotropic-phase transition in our study. The Tg values of CEs were influenced by the DS and the carbon number of the acyl group. Previous studies have indicated that a higher DS or a longer acyl chain (up to around C7) lowers the Tg [45,46], whereas acyl chains with C12 or more carbon atoms slightly increase the Tg due to crystallization interactions between the acyl groups [25]. For the CALs, Tg values were observed between CA3.0 and CL3.0, with an interpolative trend in which increasing the lauroyl substituent ratio led to a decrease in the Tg of the CALs.

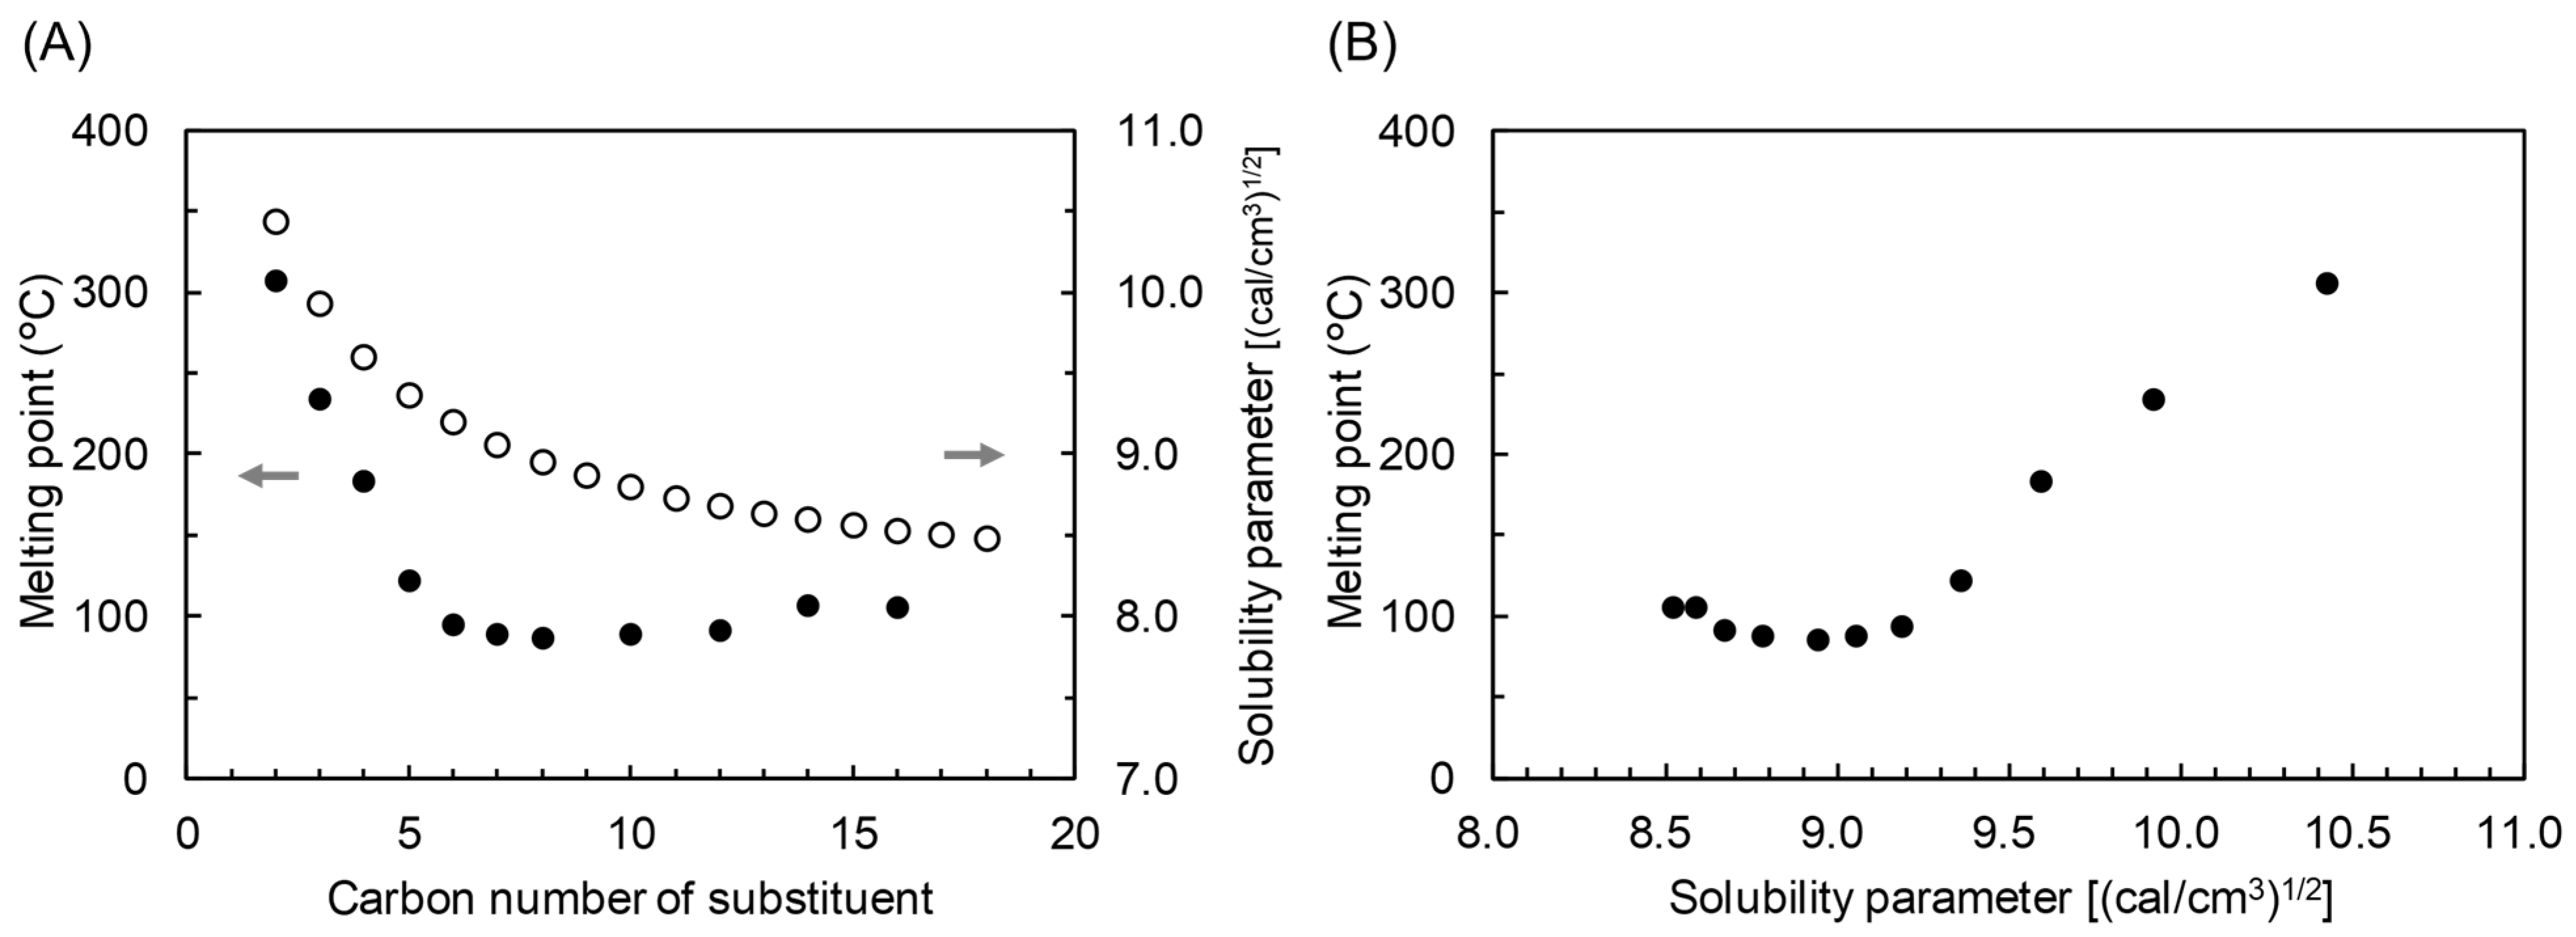
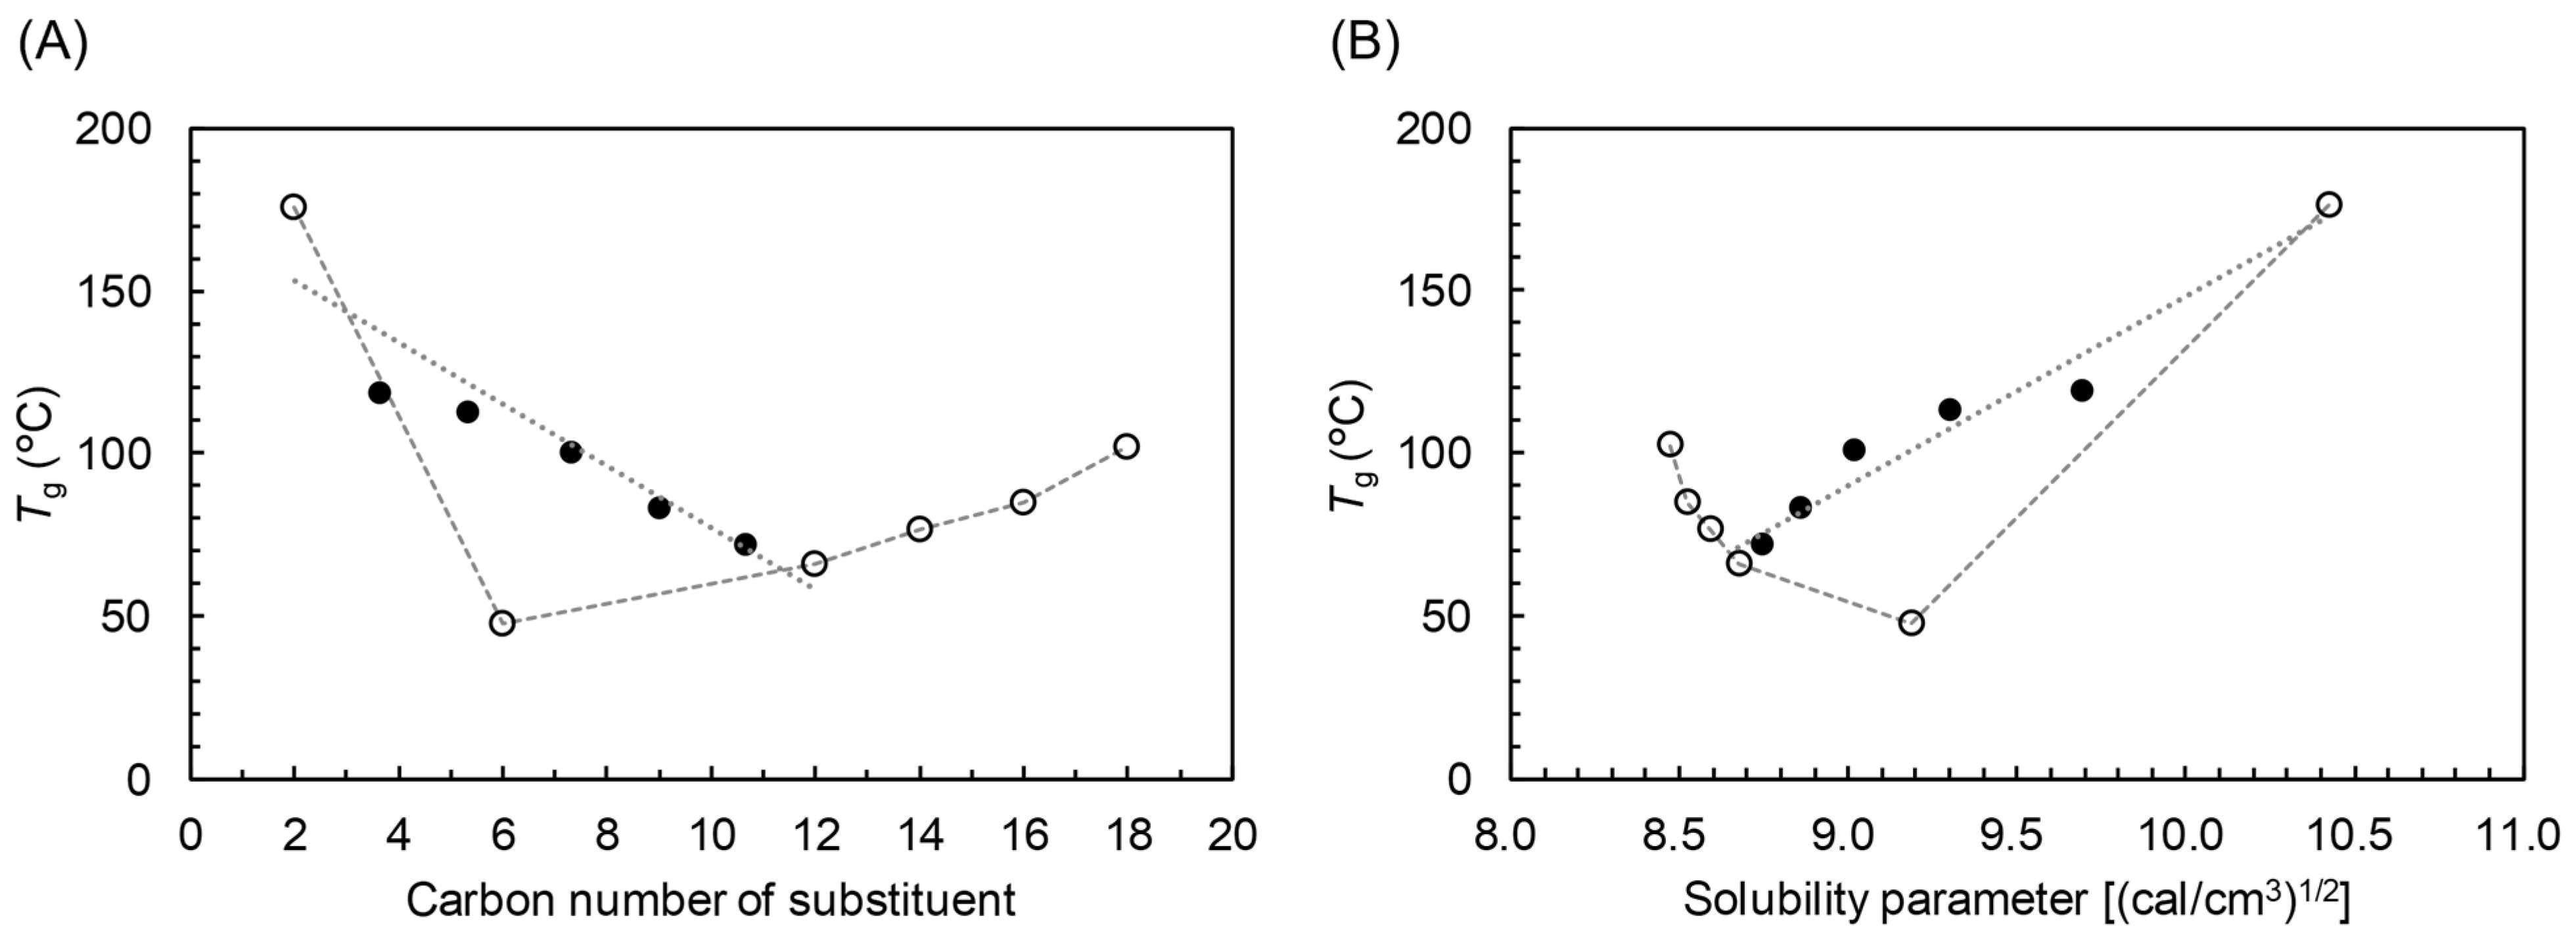
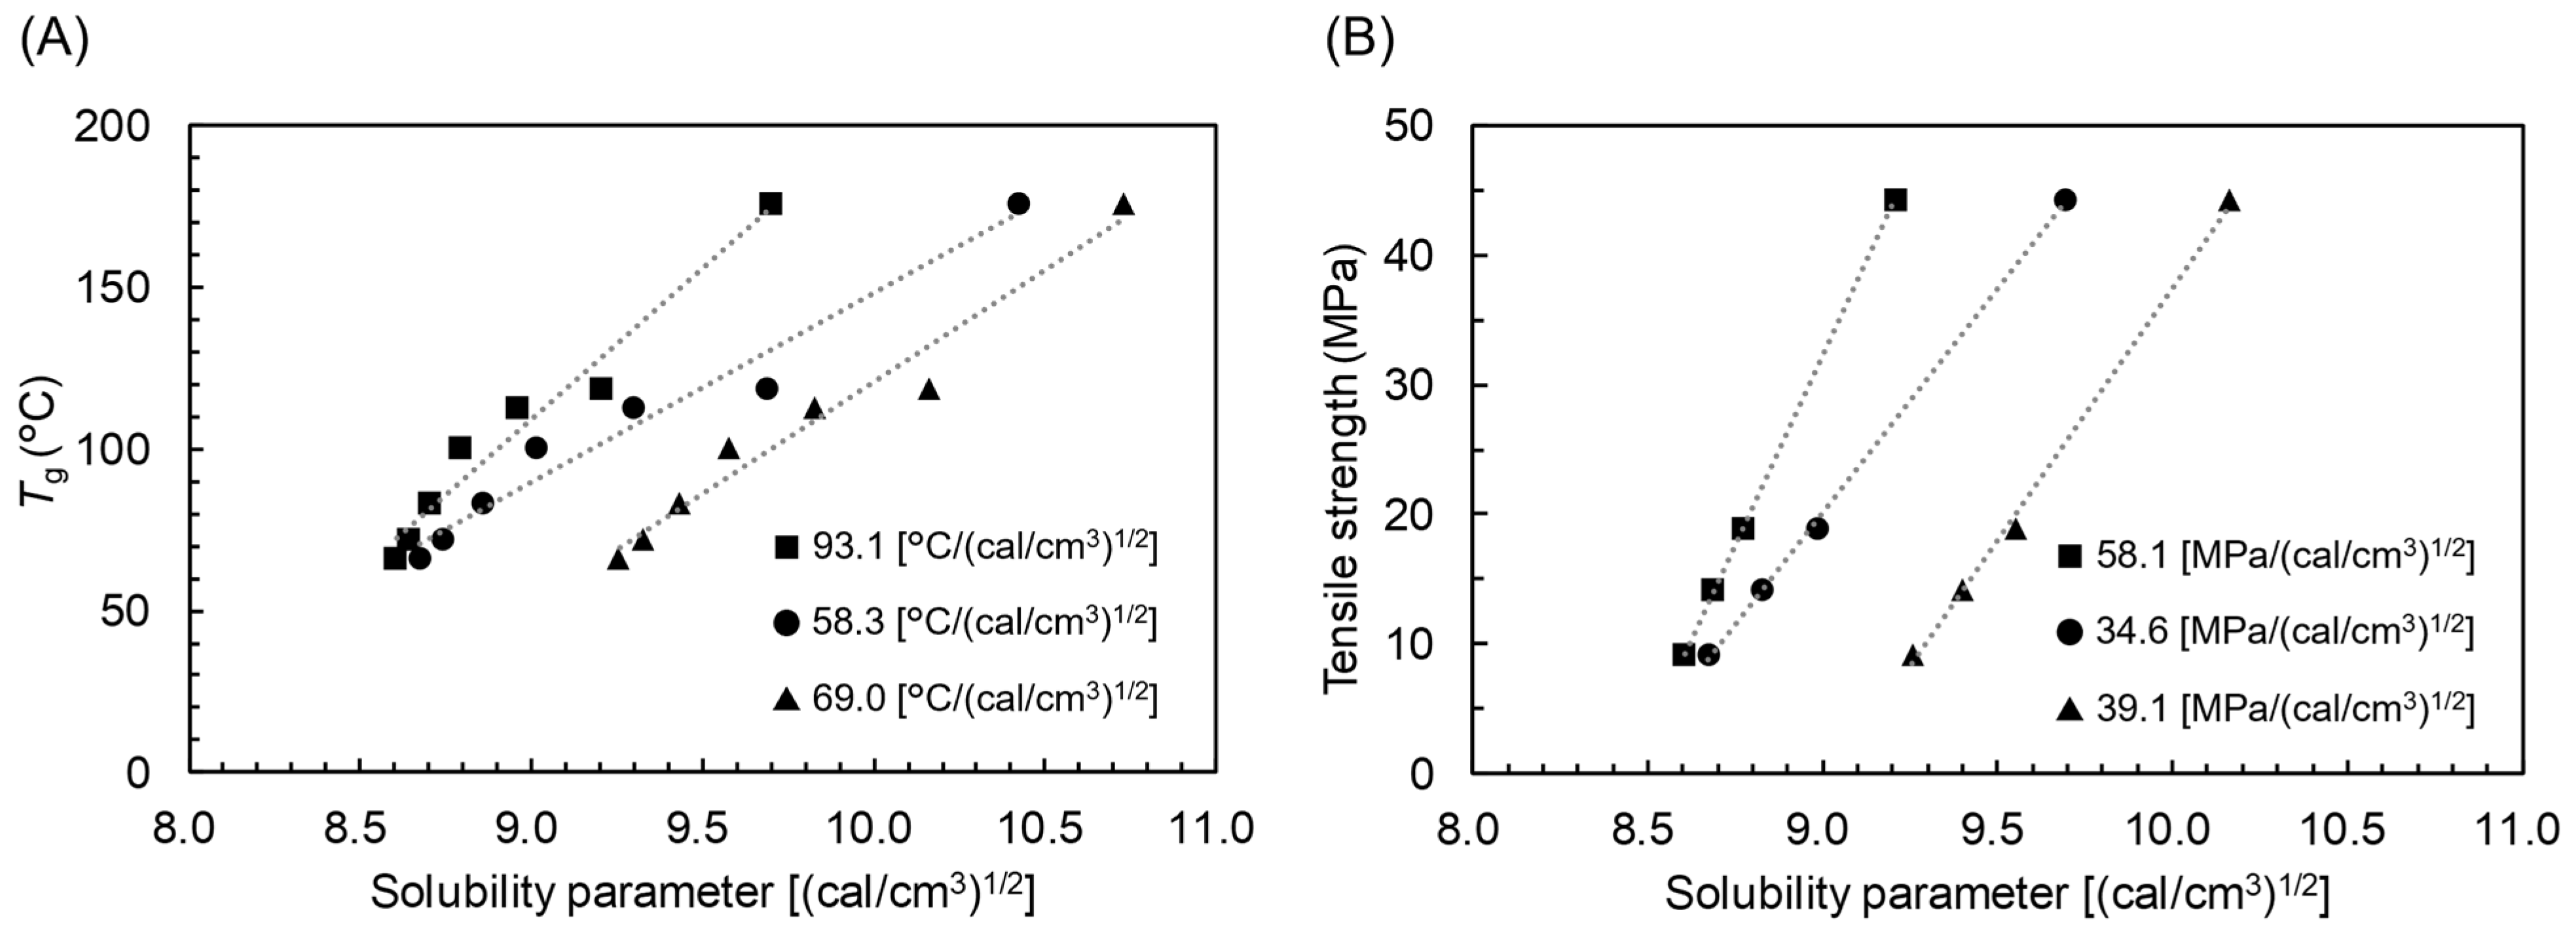
3.3. SP–Thermal Properties Relationship of CEs

Figure 4A shows the Tg values of the SCEs and CALs as a function of the carbon number of substituents; for CALs, the carbon number represents the average for two substituents taking into account the degree of substitutions. In the case of SCEs, the relationship between carbon number and Tg is not simple, showing a minimum of Tg at the carbon number 6 (sample CH3.0). The observed behavior of Tg of the SCEs can be regarded as similar in nature to that of the melting point (Figure 1A). On the other hand, in the case of the CALs, the Tg values were roughly expressed by interpolation of the Tg values of the corresponding SCEs, CA3.0 and CL3.0. Figure 4B shows the correlation between the Tg and SP of the CEs; the SP values are calculated from the method after Coleman et al. [32]. For the SCEs, a minimum of Tg was observed at around a SP value of 9.2 (cal/cm3)1/2. On the other hand, in the case of the CALs, the relationship between the Tg and SP is monotonic; the higher the SP, the higher the Tg as reported for cellulose acetate nonanoate and MCEs with shorter acyl chains by Edgar et al. [27]. From Figure 4A, it was revealed that the MCEs tend to possess higher Tg values than the SCEs, suggesting that the MCEs form more stable solid structures than the SCEs. Considering that the chemical structures of fully substituted SCEs possess symmetries subject to crystallization, whereas the heterogeneity in chemical structures of MCEs does not enable them to crystallize, it is somehow counterintuitive that the solid structures of MCEs are more stable than that of SCEs. Further efforts will be required to elucidate what makes the solid structures of MCEs stable. Watanabe et al. reported that heterogeneity in the chemical structure of synthetic peptide promotes liquid crystallinity [47]. Microscopic observations in this study for the CALs and SECs did not show any sign of the formation of thermotropic liquid crystals. DCS studies, however, revealed that the ΔHp values of unidentified endothermic peaks (Tp) of the CALs were larger than that of SCEs, showing the maximum when the substitution ratio was 0.5 (the balance of acetyl and lauroyl groups was approximately 1:1), meaning that some kind of stable structure was formed at the substituent ratio (Table 2). The formation of such a stable structure could contribute to the difference between MCE and SCE.

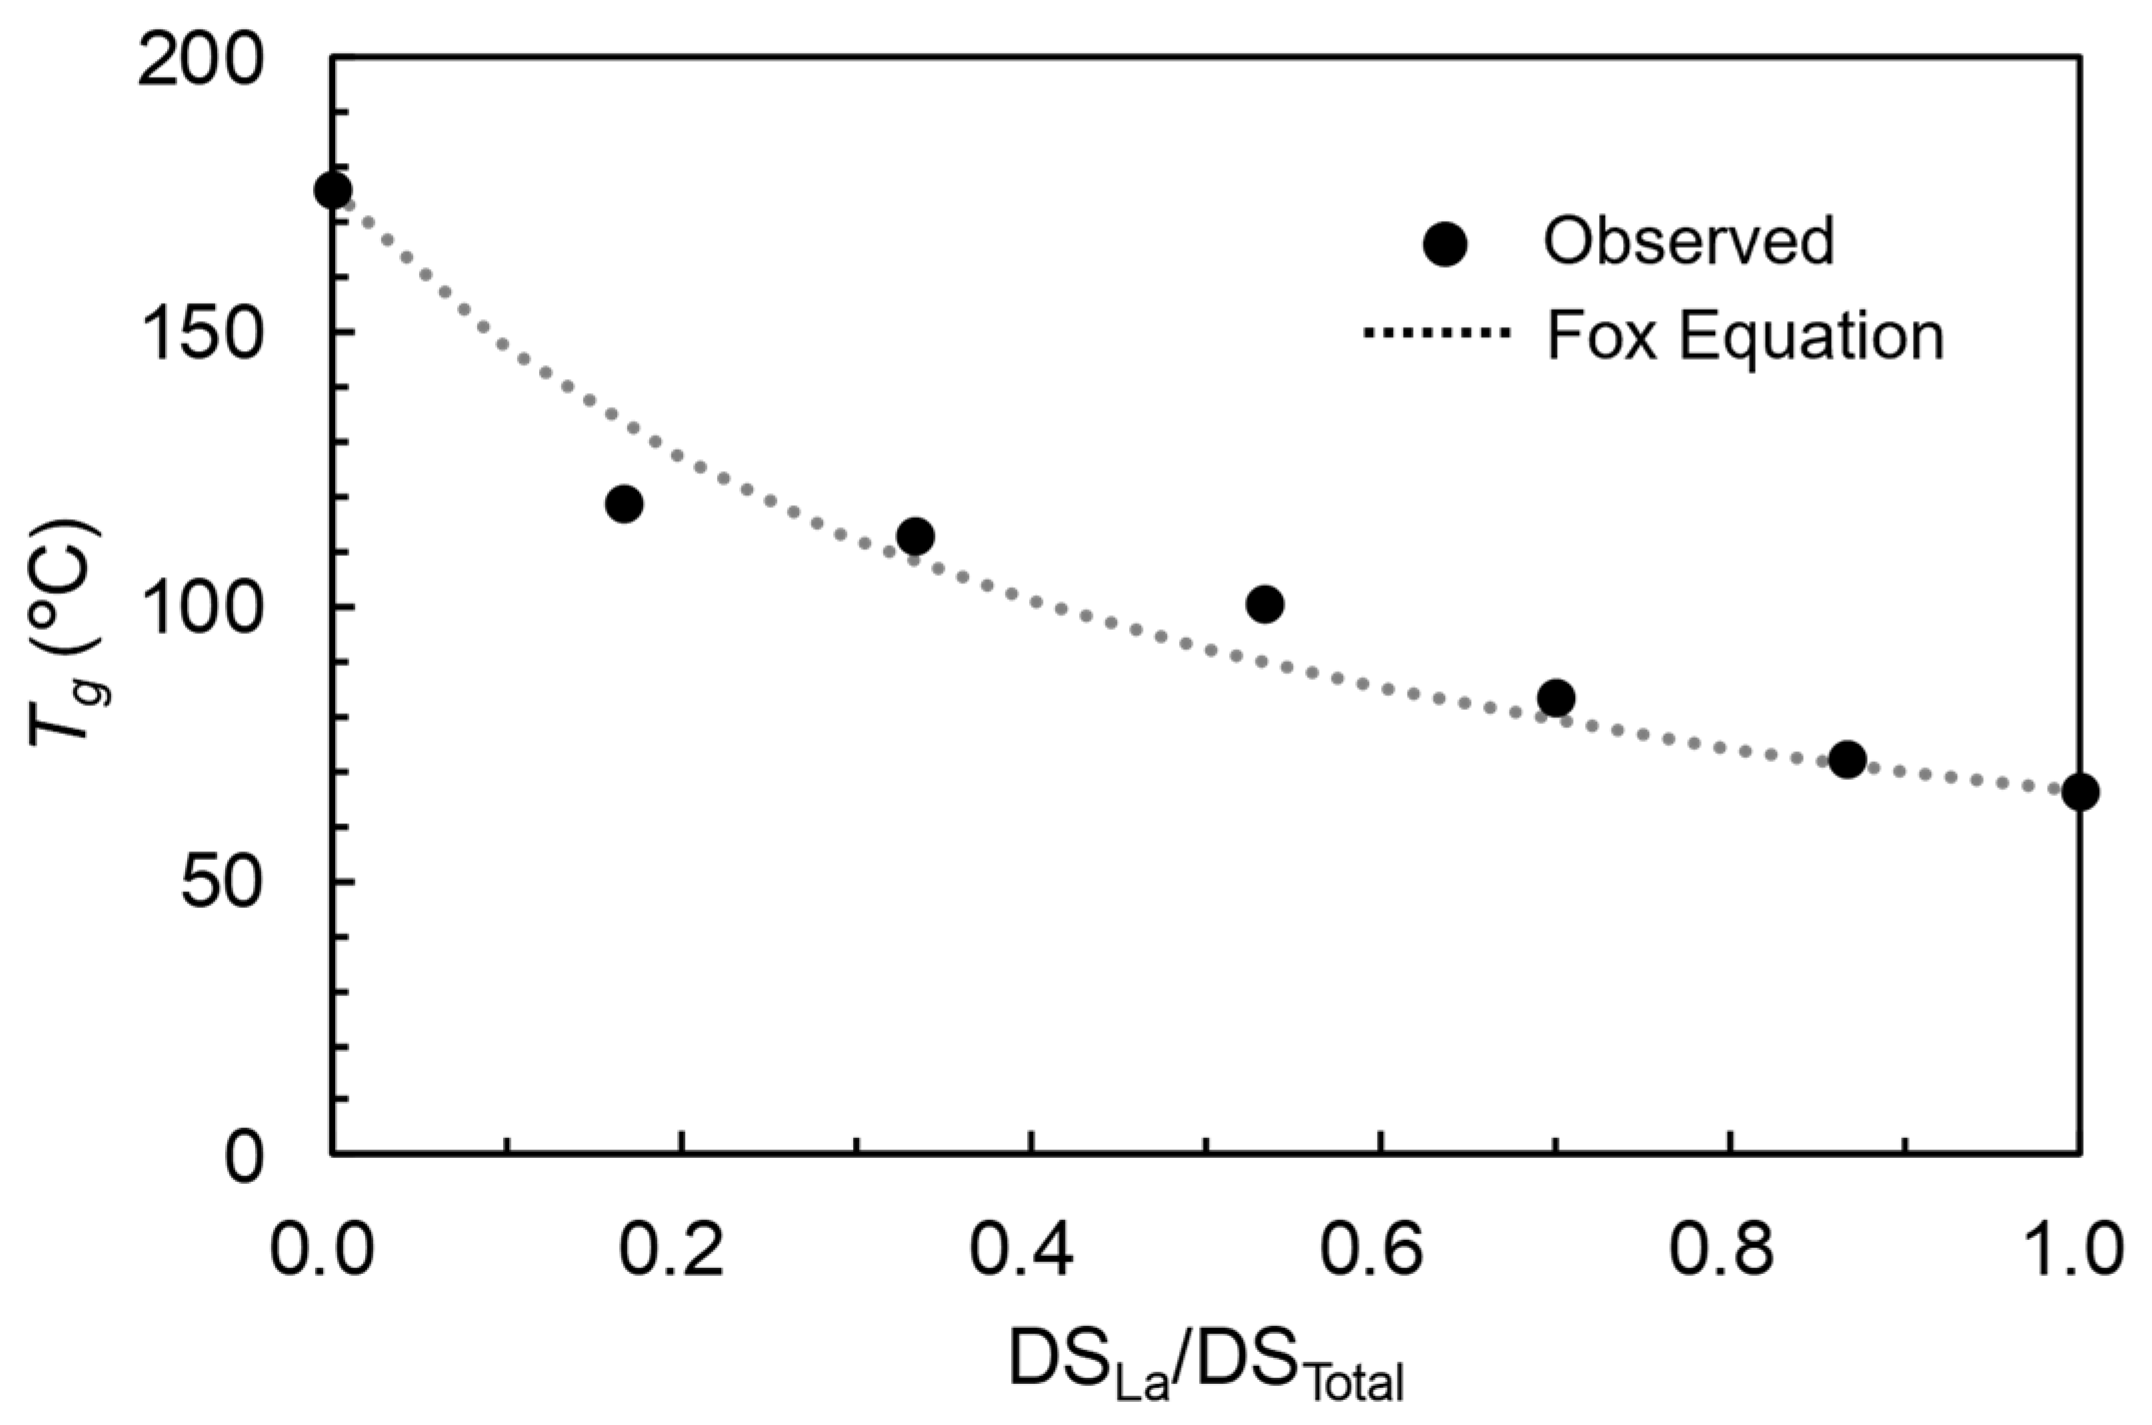
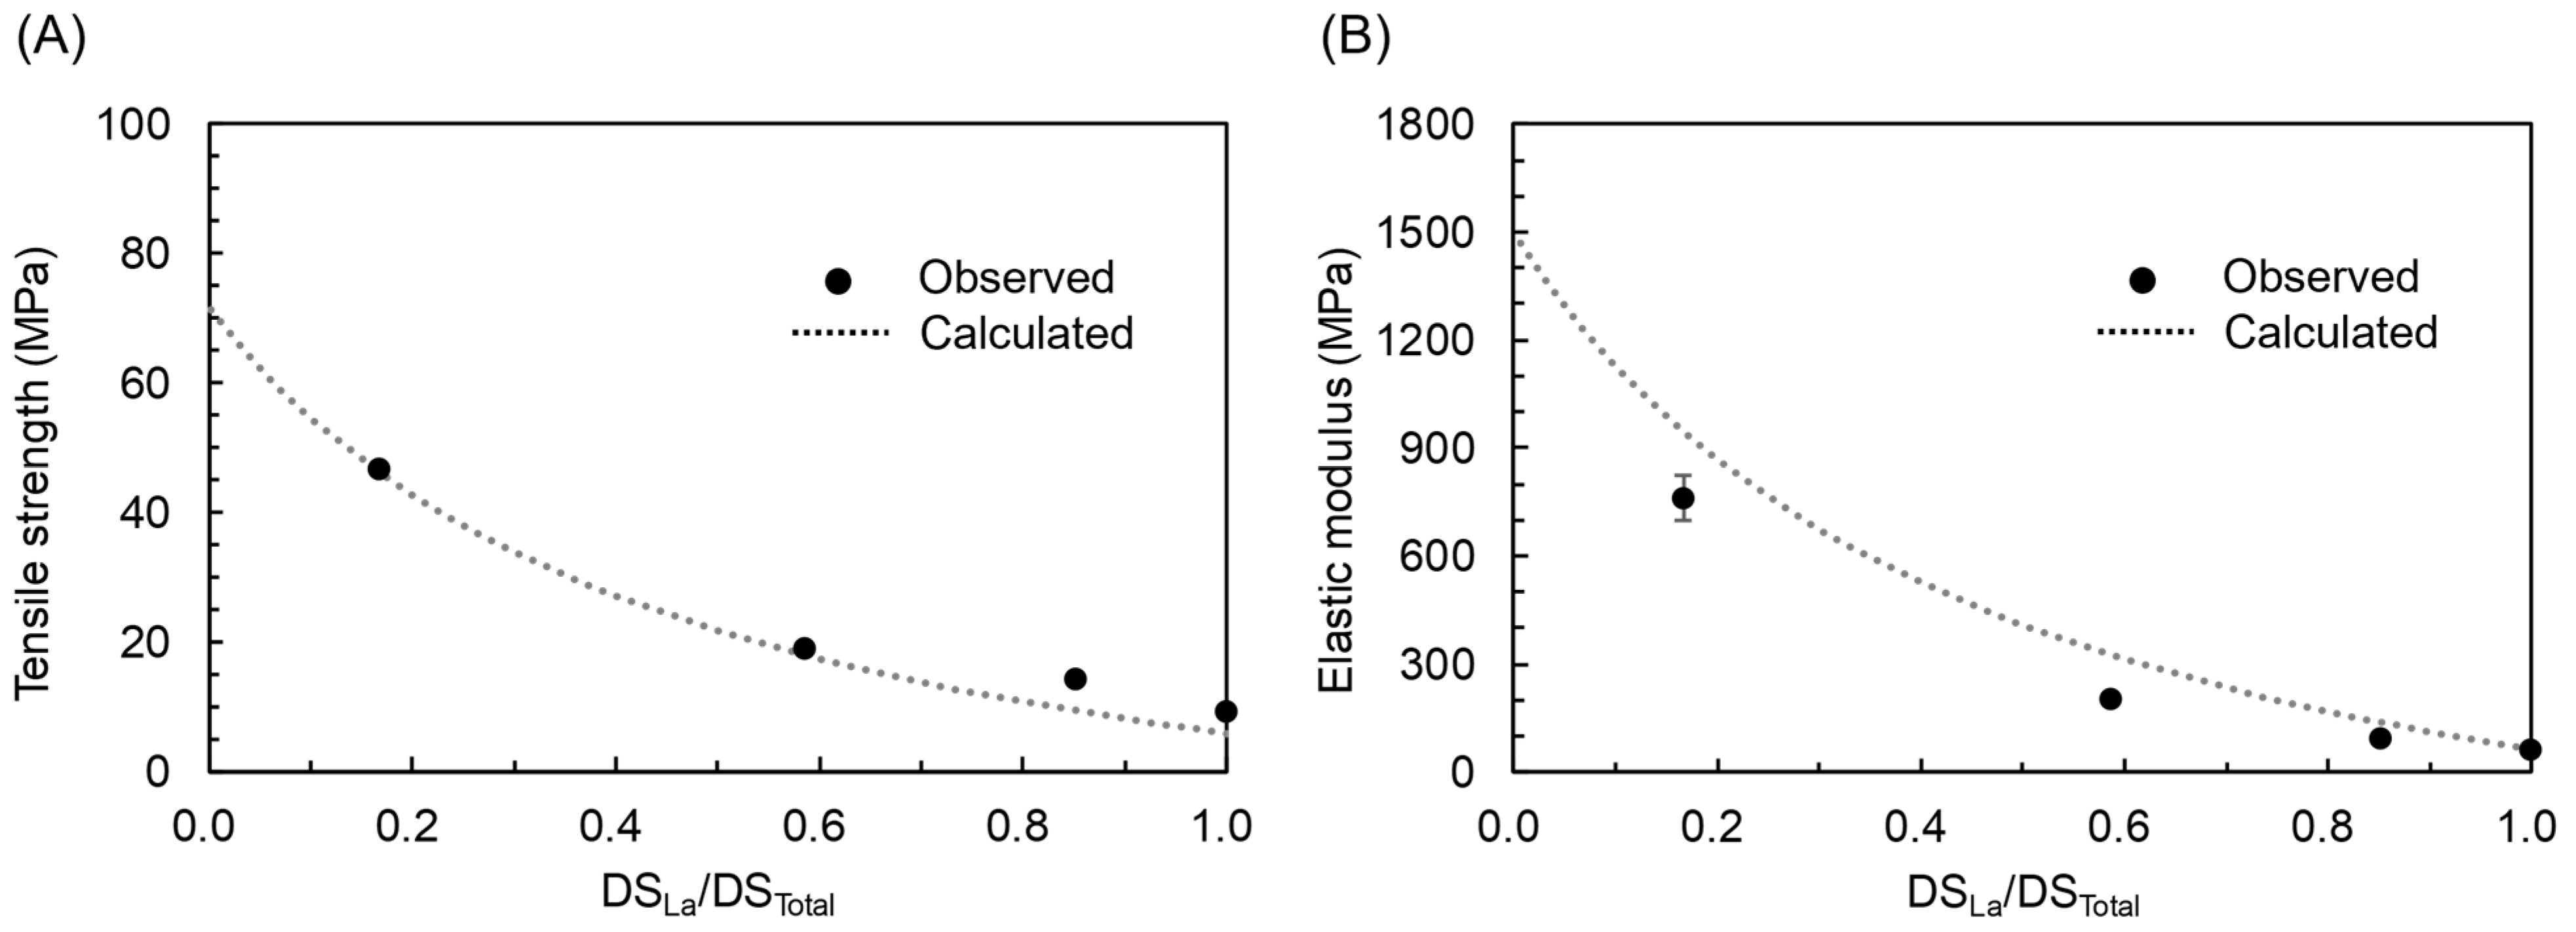
3.4. Prediction of the Physical Properties of MCEs

From the SP–thermal property relationship for CALs, as shown in Figure 4B, it is demonstrated that the Tg of CALs changed linearly as a function of the SP, making it possible to predict the Tg based on the SP as reported by Edgar et al. [27]. However, even for MCE, the empirical relationship with the SP varied from acyl group to acyl group, and no universal relationship or master curve exists as a function of the SP. Here, we examined the relationship between the SP and mechanical properties of CALs using the same approach as for Tg. Additionally, we also investigated the correlation between the SP calculated from other group contribution methods established by a few different groups and the physical properties of MCEs. Tensile tests were conducted on the hot-pressed CL3.0 and CALs films to evaluate the effect of the substituent ratios of the MCEs on mechanical properties. CAL0.5, CAL1.6, and CAL2.4 were prepared again using the same method as described above. Table S2 lists the DS, molar mass, and degree of polymerization. Table 3 summarizes the mechanical properties of these samples, including the tensile strength, elongation at break, and tensile modulus. The plots of these mechanical properties as function of the substituent ratio and stress–strain curves are shown in Figures S3 and S4. The results of this experiment indicated that the mechanical properties measured by the tensile test correlated with the lauroyl substituent ratios of the CALs. As the substituent ratios increased, both the tensile strength and tensile modulus decreased, while elongation at the break increased.
We investigated the relationships of the Tg and mechanical properties of CALs with the SP calculated from the methods of Coleman [32], Fedors [48], and Hoftyzer-Van Krevelen [49]. Figure 5A shows the Tg of the CA3.0, CL3.0, and CALs as a function of the SP calculated by these three methods. Although the slopes of the linear approximations naturally varied depending on the calculation methods of SP, all the correlations exhibited a similar linear trend. Figure 5B shows the tensile strength of the CL3.0 and CALs as a function of the SP. The tensile strength exhibited a strong linear correlation regardless of which methods were used for calculating the SP. The tensile modulus also correlated linearly with the SP, as shown in Figure S5. As reported by Edgar et al. for the MCEs with C9 or shorter acyl chains, we demonstrated that the Tg and mechanical properties of CALs, unlike the case of the SCEs with the long acyl groups, could be predicted based on the liner relationship involving SP.
We also examined whether the Tg and mechanical properties of CALs could be predicted from other methods using a model equation based only on the physical properties of the corresponding SCEs, CA3.0 and CL3.0 without using the SP. For Tg, empirical evidence suggests that the experimental Tg values of copolymers are typically in good agreement with the Fox equation [50,51,52]. In the case of CEs, the Tg of cellulose acetate with external plasticizers and partially substituted SCEs with long acyl chains as internal plasticizers aligns well with the Tg calculated by the Fox equation for a mixture of cellulose acetate and an external plasticizer or unsubstituted cellulose and eicosane (C20 alkane) [53,54,55]. Considering the CALs as copolymers of CA3.0 and CL3.0, we compared the Tg values calculated using the Fox equation with the experimental values. Figure 6 shows the experimental Tg (data points) and calculated Tg (dashed line) as a function of the lauroyl substituent ratios. The calculated values were obtained from the Fox equation (Equation (3)) using the Tg values (TgCA3.0, TgCL3.0) of CA3.0 and CL3.0, with the weight fractions (wCA3.0, wCL3.0) corresponding to the substituent ratios of the acetyl and lauroyl groups in each CAL.
1 T g = w C A 3.0 T g C A 3.0 + w C L 3.0 T g C L 3.0
The experimental values for the CALs closely match the calculated values, suggesting that the Tg of MCEs can be predicted directly from only that of SCEs using the Fox equation.
Following the prediction of Tg, we attempted to predict the mechanical properties of the CALs using model equations and compared the results with the experimental values. By treating the CALs as a mixture of the corresponding SCEs, CA3.0 and C3.0, we applied the Voigt model, one of the simplest models for binary mixtures known as the rule of mixtures [56,57,58], for predicting the mechanical properties of the CALs. Figure 7A, B illustrate the predicted curves of the tensile strength and elastic modulus for the CALs calculated using Equations (4) and (5), which represent the Voigt model, plotted alongside the experimental values. The molar volume fractions (VCA3.0 and VCL3.0), elastic moduli (ECA3.0 and ECL3.0), and tensile strengths (σRCA3.0 and σRCL3.0) in the equations are based on the substituent ratios of the acetyl and lauroyl groups in each CAL.
E = V C A 3.0 × E C A 3.0 + V C L 3.0 × E C L 3.0
σ R = V C A 3.0 × σ R C A 3.0 + V C L 3.0 × σ R C L 3.0
The values of tensile strength and elastic modulus of CA3.0 used for this prediction are taken from the literature [22,59], while that of CL3.0 are experimental data. The good agreement between the observed and calculated values suggests that it is possible to predict the mechanical properties of MCEs directly from only the property values of the corresponding SCEs using the Voigt model.
As previously mentioned, it is important to note that the relationship between SP and physical properties is not universal across all MCEs. The relationship provides a linear prediction by means of interpolation for the corresponding SCEs. Table 4 summarizes the parameters for the prediction of Tg for MCEs by utilizing the SP and Fox equation, respectively. Upon comparing the root mean squared errors (RMSEs) associated with the prediction methods for the Tg of CALs, the accuracy of the prediction using the Fox equation was larager than that of the method based on the SP. Both methods should be applied with the limitation in accuracy. The parameters, including the literature value in Malm et al. [22] for the prediction of tensile strength, are summarized in Table 5 in the same manner as for Tg. The values of RMSE were 3.0 and 3.5 calculated from the SP and Voight model, respectively. Both methods should be applied with the limitation in accuracy. Using the parameters presented in Table 4 and Table 5 makes it possible to predict the Tg and tensile property of the MCEs with various substituent ratios of the acetyl and acyl groups (C6, C12, C14, C16, or C18) without laboratory experiments.

4. Conclusions

  • The correlation between SP and physical properties exists only for MCE. There is no such correlation for SCE. The origin of such difference between MCE and SCE has yet to be further studied.
  • Even for MCE, the empirical relationship involving SP varies from acyl group to acyl group; there is no universal relationship.
  • In spite of the aforementioned limitation, the empirical relationship with SP is useful for the property prediction of MCE as long as acyl groups are specified. The Fox equation and Voigt model could also be utilized for the prediction based only on the properties of the corresponding SCEs. The observed root mean squared errors for prediction were 8.0 °C (Tg based on SP), 13.2 °C (Tg based on Fox equation), 3.0 MPa (tensile strength based on SP), and 3.5 MPa (tensile strength based on Voigt model).

Supplementary Materials

The following supporting information can be downloaded at: https://www.mdpi.com/article/10.3390/polym17081053/s1, Table S1. Feed amount of acid chlorides and DS of CEs; Figure S1. Relationship between the substituent ratio of the lauroyl group (DSLa/(DSAc + DSLa) and the feed ratio of the lauroyl chloride for the CA3.0, CL3.0, and CALs. The total amount of acyl chloride required was 9 mol for the three hydroxyl groups on each anhydroglucose unit; Figure S2. Thermogravimetric analysis (TGA) profiles of CEs upon heating from 50 °C to ~500 °C at a heating rate of 20 °C/min under a nitrogen atmosphere. (A) the CA3.0, CL3.0, and CALs; (B) SCEs (CA3.0, CH3.0, CL3.0, CM3.0, CP3.0, and CS3.0); Table S2. DS, molar mass, and degree of polymerization of CEs prepared for the tensile test; Figure S3. Mechanical properties of hot-pressed films prepared from the CL3.0 and CAL series. (A) Tensile strength: filled quadrangles. Elongation at break: filled triangles. (B) Elastic modulus: filled circles; Figure S4. Stress–strain curves of hot-pressed films prepared from the CL3.0 and CALs; Figure S5. Tensile modulus values of the CA3.0, CL3.0, and CALs as a function of the calculated SP by means of group contribution methods. Method of Coleman [32]: filled circles. Method of Fedors [48]: filled triangles. Method of Hoftyzer-Van Krevelen [49]: filled quadrangles.

Author Contributions

Conceptualization, T.M. and S.S.; methodology, T.M.; software, T.M.; validation, T.M.; formal analysis, T.M.; investigation, T.M.; data curation, T.M.; writing—original draft preparation, T.M.; writing—review and editing, K.N. and S.S.; visualization, T.M.; supervision, K.N. and S.S.; project administration, T.M. All authors have read and agreed to the published version of the manuscript.

Funding

This research received no external funding.

Institutional Review Board Statement

Not applicable.

Data Availability Statement

The original contributions presented in this study are included in the article/Supplementary Material. Further inquiries can be directed to the corresponding author.

Conflicts of Interest

Author Taro Mori, Kanji Nagai and Shu Shimamoto were employed by the company Daicel Corporation. The authors declare that the research was conducted in the absence of any commercial or financial relationships that could be construed as a potential conflict of interest.

References

  1. Organisation for Economic Co-Operation and Development. Global Plastics Outlook: Policy Scenarios to 2060. Available online: https://www.oecd.org/en/publications/global-plastics-outlook_aa1edf33-en.html (accessed on 18 November 2024).
  2. Plastics Europe. Plastics—The Fast Facts 2023. Available online: https://plasticseurope.org/knowledge-hub/plastics-the-fast-facts-2023/ (accessed on 18 November 2024).
  3. Thakur, S.; Chaudhary, J.; Sharma, B.; Verma, A.; Tamulevicius, S.; Thakur, V.K. Sustainability of bioplastics: Opportunities and challenges. Curr. Opin. Green Sustain. Chem. 2018, 13, 68–75. [Google Scholar] [CrossRef]
  4. Organisation for Economic Co-Operation and Development. Global Material Resources Outlook to 2060: Economic Drivers and Environmental Consequences. Available online: https://www.oecd.org/en/publications/global-material-resources-outlook-to-2060_9789264307452-en.html (accessed on 26 November 2024).
  5. Janaswamy, S.; Yadav, M.P.; Hoque, M.; Bhattarai, S.; Ahmed, S. Cellulosic fraction from agricultural biomass as a viable alternative for plastics and plastic products. Ind. Crops Prod. 2022, 179, 114692. [Google Scholar] [CrossRef]
  6. Wang, J.; Wang, L.; Gardner, D.J.; Shaler, S.M.; Cai, Z. Towards a cellulose-based society: Opportunities and challenges. Cellulose 2021, 28, 4511–4543. [Google Scholar] [CrossRef]
  7. Heinze, T. Cellulose: Structure and properties. In Cellulose Chemistry and Properties: Fibers, Nanocelluloses and Advanced Materials. Advances in Polymer Science; Rojas, O., Ed.; Springer: Cham, Switzerland, 2015; Volume 271, pp. 1–52. [Google Scholar] [CrossRef]
  8. Edgar, K.J.; Buchanan, C.M.; Debenham, J.S.; Rundquist, P.A.; Seiler, B.D.; Shelton, M.C.; Tindall, D. Advances in cellulose ester performance and application. Prog. Polym. Sci. 2001, 26, 1605–1688. [Google Scholar] [CrossRef]
  9. Wang, Y.; Wang, X.; Xie, Y.; Zhang, K. Functional nanomaterials through esterification of cellulose: A review of chemistry and application. Cellulose 2018, 25, 3703–3731. [Google Scholar] [CrossRef]
  10. Chen, Z.; Zhang, J.; Xiao, P.; Tian, W.; Zhang, J. Novel thermoplastic cellulose esters containing bulky moieties and soft segments. ACS Sustain. Chem. Eng. 2018, 6, 4931–4939. [Google Scholar] [CrossRef]
  11. Sata, H.; Murayama, M.; Shimamoto, S. Properties and applications of cellulose triacetate film. Macromol. Symp. 2004, 208, 323–334. [Google Scholar] [CrossRef]
  12. Candido, R.G.; Godoy, G.G.; Gonçalves, A. Characterization and application of cellulose acetate synthesized from sugarcane bagasse. Carbohydr. Polym. 2017, 167, 280–289. [Google Scholar] [CrossRef]
  13. Kamide, K.; Saito, M. Thermal analysis of cellulose acetate solids with total degrees of substitution of 0.49, 1.75, 2.46, and 2.92. Polym. J. 1985, 17, 919–928. [Google Scholar] [CrossRef]
  14. Charvet, A.; Vergelati, C.; Long, D.R. Mechanical and ultimate properties of injection molded cellulose acetate/plasticizer materials. Carbohydr. Polym. 2019, 204, 182–189. [Google Scholar] [CrossRef]
  15. Bonifacio, A.; Bonetti, L.; Piantanida, E.; Nardo, L. Plasticizer design strategies enabling advanced applications of cellulose acetate. Eur. Polym. J. 2023, 197, 112360. [Google Scholar] [CrossRef]
  16. Fordyce, C.R.; Meyer, L.W.A. Plasticizers for cellulose acetate and cellulose acetate butyrate. Ind. Eng. Chem. 1940, 32, 1053–1060. [Google Scholar] [CrossRef]
  17. Richardson, E.; Truffa Giachet, M.; Schilling, M.; Learner, T. Assessing the physical stability of archival cellulose acetate films by monitoring plasticizer loss. Polym. Degrad. Stab. 2014, 107, 231–236. [Google Scholar] [CrossRef]
  18. Fujii, M.; Shinohara, N.; Lim, A.; Otake, T.; Kumagai, K.; Yanagisawa, Y. A study on emission of phthalate esters from plastic materials using a passive flux sampler. Atmos. Environ. 2003, 37, 5495–5504. [Google Scholar] [CrossRef]
  19. Bui, T.T.; Giovanoulis, G.; Cousins, A.P.; Magnér, J.; Cousins, I.T.; de Wit, C.A. Human exposure, hazard and risk of alternative plasticizers to phthalate esters. Sci. Total Environ. 2016, 541, 451–467. [Google Scholar] [CrossRef]
  20. Vidéki, B.; Klébert, S.; Pukánszky, B. External and internal plasticization of cellulose acetate with caprolactone: Structure and properties. J. Polym. Sci. Part B Polym. Phys. 2007, 45, 873–883. [Google Scholar] [CrossRef]
  21. Teramoto, Y. Functional thermoplastic materials from derivatives of cellulose and related structural polysaccharides. Molecules 2015, 20, 5487–5527. [Google Scholar] [CrossRef]
  22. Malm, C.J.; Mench, J.W.; Kendall, D.L.; Hiatt, G.D. Aliphatic acid esters of cellulose. Properties. Ind. Eng. Chem. 1951, 43, 688–691. [Google Scholar] [CrossRef]
  23. Morooka, T.; Norimoto, M.; Yamada, T.; Shiraishi, N. Dielectric properties of cellulose acylates. J. Appl. Polym. Sci. 1984, 29, 3981–3990. [Google Scholar] [CrossRef]
  24. Wang, P.; Tao, B.Y. Synthesis of cellulose-fatty acid esters for use as biodegradable plastics. J. Environ. Polym. Degrad. 1995, 3, 115–119. [Google Scholar] [CrossRef]
  25. Sealey, J.E.; Samaranayake, G.; Todd, J.G.; Glasser, W.G. Novel cellulose derivatives. IV. Preparation and thermal analysis of waxy esters of cellulose. J. Polym. Sci. Part B Polym. Phys. 1996, 34, 1613–1620. [Google Scholar] [CrossRef]
  26. Glasser, W.G.; Samaranayake, G.; Dumay, M.; Davé, V. Novel cellulose derivatives. III. Thermal analysis of mixed esters with butyric and hexanoic acid. J. Polym. Sci. Part B Polym. Phys. 1995, 33, 2045–2054. [Google Scholar] [CrossRef]
  27. Edgar, K.J.; Pecorini, T.J.; Glasser, W.G. Long-chain cellulose esters: Preparation, properties, and perspective. ACS Symp. Ser. 1998, 688, 38–60. [Google Scholar] [CrossRef]
  28. Vaca-Garcia, C.; Thiebaud, S.; Borredon, M.E.; Gozzelino, G. Cellulose esterification with fatty acids and acetic anhydride in lithium chloride/N, N-dimethylacetamide medium. J. Am. Oil Chem. Soc. 1998, 75, 315–319. [Google Scholar] [CrossRef]
  29. Tanaka, S.; Iwata, T.; Iji, M. Long/short chain mixed cellulose esters: Effects of long acyl chain structures on mechanical and thermal properties. ACS Sustain. Chem. Eng. 2017, 5, 1485–1493. [Google Scholar] [CrossRef]
  30. Tedeschi, G.; Guzman-Puyol, S.; Paul, U.C.; Barthel, M.J.; Goldoni, L.; Caputo, G.; Heredia-Guerrero, J.A. Thermoplastic cellulose acetate oleate films with high barrier properties and ductile behaviour. Chem. Eng. J. 2018, 348, 840–849. [Google Scholar] [CrossRef]
  31. Boulven, M.; Quintard, G.; Cottaz, A.; Joly, C.; Charlot, A.; Fleury, E. Homogeneous acylation of Cellulose diacetate: Towards bioplastics with tuneable thermal and water transport properties. Carbohydr. Polym. 2019, 206, 674–684. [Google Scholar] [CrossRef]
  32. Coleman, M.M.; Serman, C.J.; Bhagwagar, D.E.; Painter, P.C. A practical guide to polymer miscibility. Polymer 1990, 31, 1187–1203. [Google Scholar] [CrossRef]
  33. McCormick, C.L. Novel Cellulose Solutions. U.S. Patent 4,278,790, 14 July 1981. [Google Scholar]
  34. Dawsey, T.R.; McCormick, C.L. The lithium chloride/dimethylacetamide solvent for cellulose: A literature review. Rev. Macromol. Chem. Phys. 1990, 30, 405–440. [Google Scholar] [CrossRef]
  35. Diamantoglou, M.; Kuhne, H. Reaktionen von Cellulose in homogener Loesung. Das Pap. 1988, 42, 690–696. [Google Scholar]
  36. Samaranayake, G.; Glasser, W.G. Cellulose derivatives with low DS. I. A novel acylation system. Carbohydr. Polym. 1993, 22, 1–7. [Google Scholar] [CrossRef]
  37. Samaranayake, G.; Glasser, W.G. Cellulose derivatives with low DS. II. Analysis of alkanoates. Carbohydr. Polym. 1993, 22, 79–86. [Google Scholar] [CrossRef]
  38. Shimizu, Y.; Hayashi, J. Acylation of cellulose with carboxylic acids. Cellul. Chem. Technol. 1987, 23, 661–670. Available online: http://pascal-francis.inist.fr/vibad/index.php?action=getRecordDetail&idt=19765050 (accessed on 6 November 2024).
  39. Crépy, L.; Miri, V.; Joly, N.; Martin, P.; Lefebvre, J.M. Effect of side chain length on structure and thermomechanical properties of fully substituted cellulose fatty esters. Carbohydr. Polym. 2011, 83, 1812–1820. [Google Scholar] [CrossRef]
  40. ISO527-3:1995; Plastics—Determination of Tensile Properties—Part 3: Test Conditions for Films and Sheets. ISO: Geneva, Switzerland, 1995.
  41. Maim, C.J.; Mench, J.W.; Kendall, D.L.; Hiatt, G.D. Aliphatic acid esters of cellulose. Preparation by acid-chloride-pyridine procedure. Ind. Eng. Chem. 1951, 43, 684–688. [Google Scholar] [CrossRef]
  42. Wen, X.; Wang, H.; Wei, Y.; Wang, X.; Liu, C. Preparation and characterization of cellulose laurate ester by catalyzed transesterification. Carbohydr. Polym. 2017, 168, 247–254. [Google Scholar] [CrossRef]
  43. Cao, X.; Peng, X.; Zhong, L.; Sun, S.; Yang, D.; Zhang, X.; Sun, R. A novel transesterification system to rapidly synthesize cellulose aliphatic esters. Cellulose 2014, 21, 581–594. [Google Scholar] [CrossRef]
  44. Yamagishi, T.; Fukuda, T.; Miyamoto, T. Thermotropic cellulose derivatives with flexible substituents IV. Columnar liquid crystals from ester-type derivatives of cellulose. Liq. Cryst. 1991, 10, 467–473. [Google Scholar] [CrossRef]
  45. Milotskyi, R.; Szabó, L.; Fujie, T.; Sakata, K.; Wada, N.; Takahashi, K. Low waste process of rapid cellulose transesterification using ionic liquid/DMSO mixed solvent: Towards more sustainable reaction systems. Carbohydr. Polym. 2021, 256, 117560. [Google Scholar] [CrossRef]
  46. Danjo, T.; Iwata, T. Syntheses of cellulose branched ester derivatives and their properties and structure analyses. Polymer 2018, 137, 358–363. [Google Scholar] [CrossRef]
  47. Watanabe, J.; Goto, M.; Nagase, T. Thermotropic polypeptides. 3. Investigation of cholesteric mesophase properties of poly (gamma.-benzyl L-glutamate-co-.gamma.-dodecyl L-glutamates) by circular dichroic measurements. Macromolecules 1987, 20, 298–304. [Google Scholar] [CrossRef]
  48. Fedors, R.F. A method for estimating both the SPs and molar volumes of liquids. Poly. Eng. Sci. 1974, 14, 147–154. [Google Scholar] [CrossRef]
  49. Brandrup, J.; Immergut, E.H.; Grulke, E.A. (Eds.) Polymer Handbook, 4th ed.; Wiley: Hoboken, NJ, USA, 1999. [Google Scholar]
  50. Fox, T.G. Influence of diluent and of copolymer composition on the glass temperature of a polymer system. Bull. Am. Phs. Soc. 1952, 1, 123. [Google Scholar]
  51. Johnston, N.W. Sequence distribution-glass transition effects. J. Macromol. Sci. Rev. Macromol. Chem. 1976, 14, 215–250. [Google Scholar] [CrossRef]
  52. Bonardelli, P.; Moggi, G.; Turturro, A. Glass transition temperatures of copolymer and terpolymer fluoroelastomers. Polymer 1986, 27, 905–909. [Google Scholar] [CrossRef]
  53. Erdmann, R.; Kabasci, S.; Heim, H.P. Thermal properties of plasticized cellulose acetate and its β-relaxation phenomenon. Polymers 2021, 13, 1356. [Google Scholar] [CrossRef]
  54. Bao, C.Y.; Long, D.R.; Vergelati, C. Miscibility and dynamical properties of cellulose acetate/plasticizer systems. Carbohydr. Polym. 2015, 116, 95–102. [Google Scholar] [CrossRef]
  55. Vaca-Garcia, C.; Gozzelino, G.; Glasser, W.G.; Borredon, M.E. Dynamic mechanical thermal analysis transitions of partially and fully substituted cellulose fatty esters. J. Polym. Sci. Part B Polym. Phys. 2003, 41, 281–288. [Google Scholar] [CrossRef]
  56. Voigt, W. Űber die Beziehung zwischen den beiden Elastizi ä tskonstanten isotroper Körper. Wied. Ann. 1889, 38, 573–587. [Google Scholar] [CrossRef]
  57. Joseph, S.; Thomas, S. Modeling of tensile moduli in polystyrene/polybutadiene blends. J. Polym. Sci. Part B Polym. Phys. 2002, 40, 755–764. [Google Scholar] [CrossRef]
  58. Bulıcek, M.; Málek, J.; Rajagopal, K.R. On Kelvin–Voigt model and its generalizations. Evol. Equ. Control. Theory 2012, 1, 17–42. [Google Scholar] [CrossRef]
  59. Mark, J.E. (Ed.) Physical Properties of Polymers Handbook, 2nd ed.; Springer: Berlin/Heidelberg, Germany, 2007. [Google Scholar]
Figure 1. (A) Melting points from Malm et al. [22] and SP values calculated by the method of Coleman [32] of simple cellulose esters with DS 3 (fully esterified) as a function of the carbon number of substituent. Melting point: filled circles. SP: open circles. (B) Melting points from Malm et al. [22] as a function of SP calculated by the method of Coleman [32].
Polymers 17 01053 g001
Scheme 1. Esterification of cellulose with acid chloride.
Polymers 17 01053 sch001
Figure 2. 1H NMR spectra of cellulose esters in CDCl3 (600 MHz, 40 °C). (A) CL3.0; (B) CAL1.6. The asterisk indicates the signal of water.
Polymers 17 01053 g002
Figure 3. DSC thermograms of CEs in the second heating scan. (A) SCEs (CA3.0, CH3.0, CL3.0, CM3.0, CP3.0, and CS3.0); (B) CA3.0, CL3.0, and CALs.
Polymers 17 01053 g003
Figure 4. (A) Tg values of cellulose esters as a functions of carbon number of substituent. For MCEs, the carbon number stands for the average per hydroxyl group. CALs: filled circles. SCEs (CA3.0, CH3.0, CL3.0, CM3.0, CP3.0, and CS3.0): open circles. (B) Tg values of cellulose esters as a function of the SP. CALs: filled circles. SCEs (CA3.0, CH3.0, CL3.0, CM3.0, CP3.0, and CS3.0): open circles.
Polymers 17 01053 g004
Figure 5. (A) Tg values of the CA3.0, CL3.0, and CALs as a function of the calculated SP by means of group contribution methods. Method of Coleman [32]: filled circles. Method of Fedors [48]: filled triangles. Method of Hoftyzer-Van Krevelen [49]: filled quadrangles. (B) Tensile strength values of the CA3.0, CL3.0, and CALs as a function of the calculated SP by means of group contribution methods. Method of Coleman [32]: filled circles. Method of Fedors [48]: filled triangles. Method of Hoftyzer-Van Krevelen [49]: filled quadrangles.
Polymers 17 01053 g005
Figure 6. Observed and calculated Tg values of the CA3.0, CL3.0, and CALs as a function of the lauroyl substituent ratios. Dotted lines represent the values of the CALs calculated from the values of cellulose triacetate and cellulose trilaurate using the Fox equation.
Polymers 17 01053 g006
Figure 7. Observed and calculated mechanical properties of CL3.0 and the CALs. (A) Tensile strength as a function of the lauroyl substituent ratios. Dotted lines represent the values of the CALs calculated from the values of cellulose triacetate and cellulose trilaurate in Malm et al. [22]. (B) Elastic modulus as a function of the lauroyl substituent ratios. Dotted lines represent the values of the CALs calculated from the values of cellulose triacetate in the handbook [59] and cellulose trilaurate in this work.
Polymers 17 01053 g007
Table 1. DS, molar mass, and degree of polymerization of the CEs prepared in this study.
CESubstituent ISubstituent II Molar Mass 4
IDNameCarbon
Number
DSx 1Carbon
Number
DSAcDSTotalDSx/DSTotal 2MAGU3Mn/10−3Mw/10−3DPw 5
(g/mol)(g/mol)(g/mol)
Simple cellulose ester (SCE)
CS3.0Cellulose stearate183.0--3.01.0961.585281292
CP3.0Cellulose palmitate163.0--3.01.0877.486338385
CM3.0Cellulose myristate143.0--3.01.0793.289422532
CL3.0Cellulose laurate123.0--3.01.0709.094536776
CH3.0Cellulose hexanoate63.0--3.01.0456.6161347760
CA3.0Cellulose acetate--23.03.00.0288.21163601248
Mixed cellulose ester (MCE)
CAL2.6Cellulose acetate laurate122.620.43.00.9652.986539849
CAL2.1Cellulose acetate laurate122.120.93.00.7582.885427738
CAL1.6Cellulose acetate laurate121.621.43.00.5512.766333655
CAL1.0Cellulose acetate laurate121.022.03.00.3428.568295695
CAL0.5Cellulose acetate laurate120.522.53.00.2358.461243686
1 DS by acyl groups except for acetyl group. 2 Defined as the longer substituent ratio in this study. 3 Molar mass of anhydroglucose unit (repeat unit). 4 Polystyrene equivalent number-average (Mn) or weight-average molecular weight (Mw) measured by GPC. Eluent: THF except for CA3.0. Eluent for CA3.0: DMAc containing 20 mM of LiBr. 5 Weight-average degree of polymerization defined as Mw/MAGU.
Table 2. Thermal properties of CEs.
CEDSTG-DTA 1DSC 2
IDDSXDSAcTd5%TmΔHmTgTpΔHp
(°C)(°C)(J/g)(°C)(°C)(J/g)
SCE
CS3.03.0-349.237.866.1102.3123.77.4
CP3.03.0-323.820.850.085.0101.16.9
CM3.03.0-320.80.132.776.595.69.9
CL3.03.0-317.4−26.616.566.190.110.1
CH3.03.0-331.8--47.768.76.8
CA3.0-3.0317.3--175.9--
MCE
CAL2.62.60.4324.6−28.97.472.1104.114.9
CAL2.12.10.9325.4−27.76.983.1125.716.0
CAL1.61.61.4324.0--100.5142.416.6
CAL1.01.02.0317.9--112.9132.715.6
CAL0.50.52.5320.4--118.8--
1 TG-DTA thermograms are shown in Figure S2. 2 DSC thermograms are shown in Figure 2.
Table 3. Mechanical properties of the hot-pressed films prepared from CEs.
CEDSMechanical Property
IDDSXDSAcTensile StrengthElongation at BreakTensile Modulus
(MPa)(%)(MPa)
CL3.03.0-9.2 ± 0.4282.5 ± 13.463.2 ± 3.3
CAL2.32.30.414.2 ± 1.6188.7 ± 30.096.9 ± 6.9
CAL1.71.71.218.9 ± 1.9154.5 ± 20.6203.0 ± 14.0
CAL0.50.52.544.3 ± 4.279.5 ± 14.0749.1 ± 82.7
Table 4. Parameters for prediction of Tg for MCE involving two substituents with total DS of 3.
MCETg from δ
by First Order Regression 1
Tg from Dr
by Fox Equation 2
Carbon Number
of Substituent
AbbreviationIntercept aSlope bRMSE 3
(°C)
TgCA3.0
(°C)
TgCX3.0
(°C)
RMSE 3
(°C)
C2 and C6CAH−905.1103.7N.A.175.947.7N.A.
C2 and C12CAL−477.662.78.0175.966.113.2
C2 and C14CAM−388.354.1N.A.175.976.5N.A.
C2 and C16CAP−322.247.8N.A.175.985.0N.A.
C2 and C18CAS−216.537.6N.A.175.9102.3N.A.
1 Tg = a + bδ, where δ is SP in (cal/cm3)1/2 obtained by the method of Coleman [32]. 2 1/Tg = wCA3.0/TgCA3.0 + wCX3.0/TgCX3.0, where wCA3.0 = (1 − wCX3.0), wCX3.0 = DrMCX3.0/[(1 − Dr) MCA3.0 + DrMCX3.0], MCA3.0 and MCX3.0 are molar mass of unit structure for cellulose triacetae (CA3.0, 288.2 g/mol) and another relevant SCE (C6, C12, C14, C16 or C18), respectively. CX3.0 represents cellulose trihexanoate (CH3.0), cellulose trilaurate (CL3.0), cellulose trimyristate (CM3.0), cellulose tripalmitate (CP3.0), or cellulose tristearate (CS3.0). Dr is the longer substituent ratio of MCE in question calculated from DSx/DSTotal. 3 Root mean squared error, RMSE = [Σ(yoyc)2/(n − 1)]1/2, where yo and yc are Tg observed and Tg predicted, respectively. N.A.: not available.
Table 5. Parameters for prediction of tensile strength (σR) for MCE involving two substituents with total DS of 3.
MCEσR from δ
by First Order Regression 1
σR from Dr
by Voigt Model 2
Carbon Number
of Substituent
AbbreviationIntercept aSlope bRMSE 3
(MPa)
σRCA3.0
(MPa)
σRCX
(MPa)
ρCA3.0
(g/cm3)
ρCX3.0
(g/cm3)
RMSE 3
(MPa)
C2 and C6CAH−416.346.8N.A.71.613.71.281.10N.A.
C2 and C12CAL−319.537.53.071.65.91.281.003.5
C2 and C14CAM−301.435.8N.A.71.65.91.280.99N.A.
C2 and C16CAP−293.835.0N.A.71.64.91.280.99N.A.
1 σR = a + bδ, where δ is SP in (cal/cm3)1/2 obtained by the method of Coleman [32]. 2 σR = VCA3.0σRCA3.0 + VCX3.0σRCX3.0 where VCA3.0 = (1 − VCA3.0), VCX3.0 = DrMCX3.0ρCX3.0−1/[(1 − Dr)MCA3.0ρCA3.0−1 + DrMCX3.0ρCX3.0−1], MCA3.0 and MCX3.0 are molar mass of unit structure for cellulose triacetae (CA3.0, 288.2 g/mol) and another relevant SCE (C6, C12, C14, or C16), respectively. CX3.0 represents cellulose trihexanoate (CH3.0), cellulose trilaurate (CL3.0), cellulose trimyristate (CM3.0), cellulose tripalmitate (CP3.0), or cellulose tristearate (CS3.0). Dr is the longer substituent ratio of MCE in question calculated from DSx/DSTotal. ρCA3.0 and ρCX3.0 are density of CA3.0 and CX3.0 after Malm et al. [22], respectively. 3 Root mean squared error, RMSE = [Σ(yoyc)2/(n − 1)]1/2, where yo and yc are σR observed and σR predicted, respectively. N.A.: not available.
Disclaimer/Publisher’s Note: The statements, opinions and data contained in all publications are solely those of the individual author(s) and contributor(s) and not of MDPI and/or the editor(s). MDPI and/or the editor(s) disclaim responsibility for any injury to people or property resulting from any ideas, methods, instructions or products referred to in the content.

