Article

Techno-Economic Study of Castor Oil Crop Biorefinery: Production of Biodiesel without Fossil-Based Methanol and Lignoethanol Improved by Alkali Pretreatment

1
Department of Chemical Engineering, Isfahan University of Technology, Isfahan 84156-83111, Iran
2
Department of Chemical Engineering, Vrije Universiteit Brussel, 1050 Brussels, Belgium
3
Industrial Biotechnology Group, Research Institute for Biotechnology and Bioengineering, Isfahan University of Technology, Isfahan 84156-83111, Iran
*
Author to whom correspondence should be addressed.
Agronomy 2020, 10(10), 1538; https://doi.org/10.3390/agronomy10101538
Submission received: 27 August 2020 / Revised: 29 September 2020 / Accepted: 1 October 2020 / Published: 10 October 2020
(This article belongs to the Special Issue Pretreatment and Bioconversion of Crop Residues)

Abstract

:
Castor, a non-edible oil crop that flourishes even under extreme cultivation conditions, can be cultivated in wastewater with a lower cultivation cost than similar plants, e.g., rapeseed and soybean. This plant, containing seeds and lignocellulosic residues, has a promising perspective for biofuel production. The oil extracted from the seeds is inexpensive and can be efficiently converted to biodiesel, while the lignocellulosic parts are suitable for ethanol production after pretreatment with NaOH. Biodiesel typically produced from the fossil-based methanol; however, it can also be produced from the ethanol. In this study, ethanol used for biodiesel production is produced from the lignocellulosic residues (scenario 1), which are more sustainable and environmentally friendly; the process was compared with that of the methanol (scenario 2). In this study, techno-economic analyses were used to compare the technical and economic aspects of producing biodiesel from methanol and the produced ethanol. Simulations of the processes were carried out by Aspen plus software, and economic studies were conducted by Aspen Economic Analyzer. The prices of produced ethanol as a byproduct in scenarios 1 and 2 were USD 0.701 and 0.693 per liter, respectively, which are greater than that of gasoline. The prices of biodiesel produced as a primary product for scenarios 1 and 2 are USD 0.410 and 0.323/L, lower than the price of diesel in the Middle East region. The profitability indices for scenarios 1 and 2 are 1.29 and 1.41, respectively. Therefore, despite environmental benefits, the biorefinery based on producing biodiesel from methanol is more economically feasible than that produced from ethanol.

1. Introduction

To prevent environmental issues caused by the use of fossil fuels, research on renewable sources of energy has increased. In this regard, biodiesel, bioethanol, and biogas are among the promising alternatives [1]. Biodiesel—the monoalkyl ester of vegetable, algal, and animal oils—is nowadays employed as a replacement to diesel. It is produced from edible oils and non-edible oils, while non-edible oils are more sustainable and promising resources [2,3,4,5]. Among the renewable liquid biofuels, ethanol currently plays a major role as a blend for the improvement of gasoline properties. Ethanol production from lignocelluloses has received significant attention due to its low price and availability in large quantities without food and energy conflict [6,7].
Energy crops that are specifically cultivated for energy production are among the most important sources of energy. These plants are divided into three groups of oily, cellulosic, and sugar-rich plants. These plants, e.g., castor plant, are suggested to supply a major part of future energy in the form of liquid and gaseous biofuels [8].
The castor plant is among the oily crops, containing seeds with 47–49% (w/w) non-edible oil, mainly include ricinoleic acid [9]. The castor plant can be cultivated under different climate conditions and in wastewater. The cultivation cost of this plant is lower than the other oily plants, such as jatropha and rapeseed. Moreover, castor seeds and seed cake are restricted to be used as human and animal feeds, as they are highly poisonous [10]. The castor plant’s residues, including stem, leaves, and seed processing residues (seed cake), are potential sources for bioethanol and biogas production and its oil is suitable for biodiesel production with high efficiency [9].
Biofuel production from lignocellulosic feedstocks and energy crops has different technical and economic bottlenecks. The biorefinery concept is suggested to address the process’s drawbacks and make the bioenergy from lignocelluloses competitive with the current forms of energy. Biorefineries are referred to as facilities to produce biofuels, energy, and biochemicals from renewable feedstocks. Recently, the biorefinery based on using energy crops as feedstock received significant attention. This has been predicted to have a significant role in addressing climate change and decreasing dependence on fossil fuels in economically feasible pathways [11,12].
An essential factor in biorefinery development is the consumption versus produced energy. The energy produced in the form of heat, power, and liquid or gaseous fuels through the biorefinery should be higher than the energy consumption in different units of processes. Therefore, the energy analysis for these processes is very important. To predict the feasibility of the biorefinery, technical and economic studies are necessary. The technical and economic analyses are methods that identify the strengths and weaknesses of each process and show future plans and perspectives of biorefinery development [13].
In recent years, techno-economic analyses were used as a tool to evaluate the feasibility of biodiesel, bioethanol, and biogas production from lignocellulosic materials. The economics of biodiesel production from edible, non-edible, and waste oil by different plants showed that the most effective factors on biodiesel price and economic parameters are raw oil cost and plant scale [14,15,16,17,18,19,20,21,22]. The techno-economic analyses showed that the raw material cost, type of byproducts, plant scales, and tax policies in the varied area have the greatest effect on economic factors of ethanol production from lignocelluloses. In addition, these studies showed that bioethanol production in a biorefinery in large scales is a profitable state [13,23,24,25]. In another study, we evaluated the potential of biodiesel, biogas, and heat production from the castor plant. The results showed that biogas production from the lignocellulosic part is not economically feasible [26]. The experimental results also showed that ethanol with high efficiency could be obtained from the lignocellulosic residues of castor plant. This lignoethanol was then successfully used for the transesterification process for biodiesel production [9,27]. This biodiesel is produced from two renewable feedstocks, i.e., castor oil and bioethanol, and thus is much more eco-friendly compared with the biodiesel produced from the fossil-based methanol [28,29]. To our knowledge, no references were detected for techno-economic study for the biorefinery based on castor plant for the production of bioethanol and biodiesel from lignoethanol.
The potential of castor plant for biofuel production is approved experimentally [9,27]. Based on experimental data, the economy of biorefinery for biodiesel and bioethanol production based on castor plant was investigated for the first time in this study. Two different processes, i.e., biodiesel production using lignoethanol (scenario 1) and methanol (scenario 2), were studied. Aspen Plus was used for the simulation of processes, Aspen Process Economic Analyzer (APEA) was employed to evaluate the economic parameters, and sensitivity analyses were conducted to determine the effective factors.

2. Methods

Two scenarios for biodiesel and bioethanol production in a biorefinery based on castor plant using NaOH pretreatment were developed. These processes were designed based on the promising experimental data previously obtained [9,27]. Aspen Plus simulated all the processes, and then APEA evaluated the economic features.

2.1. Process Development

In the first scenario, castor oil is used to produce biodiesel by transesterification with ethanol that is produced from the lignocellulosic materials of castor plant, including leaves, stem, and seed cake. In the second scenario, castor oil is used to produce biodiesel by transesterification with methanol and the lignocellulosic materials used for bioethanol production similar to scenario 1.

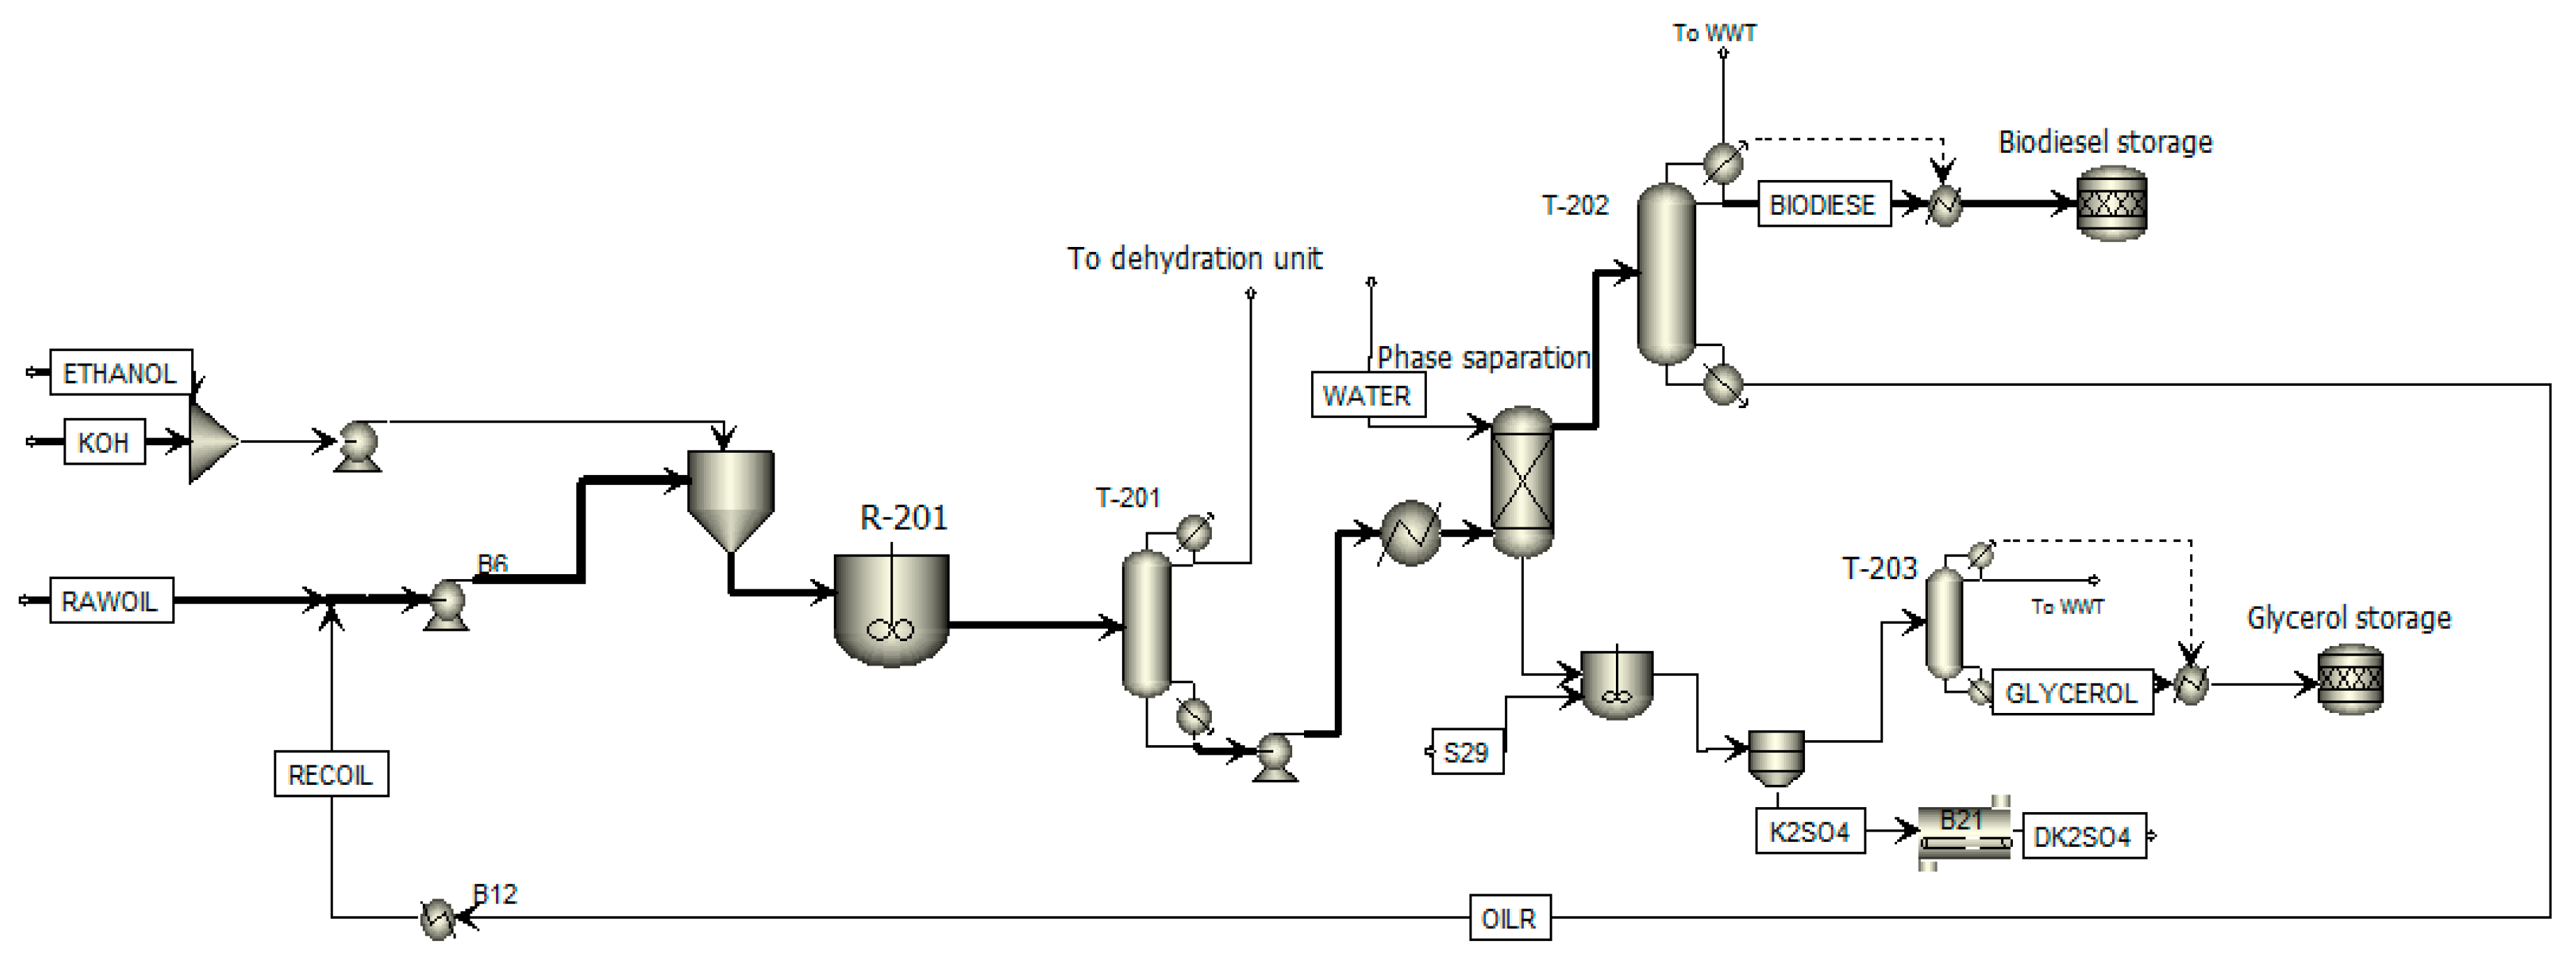
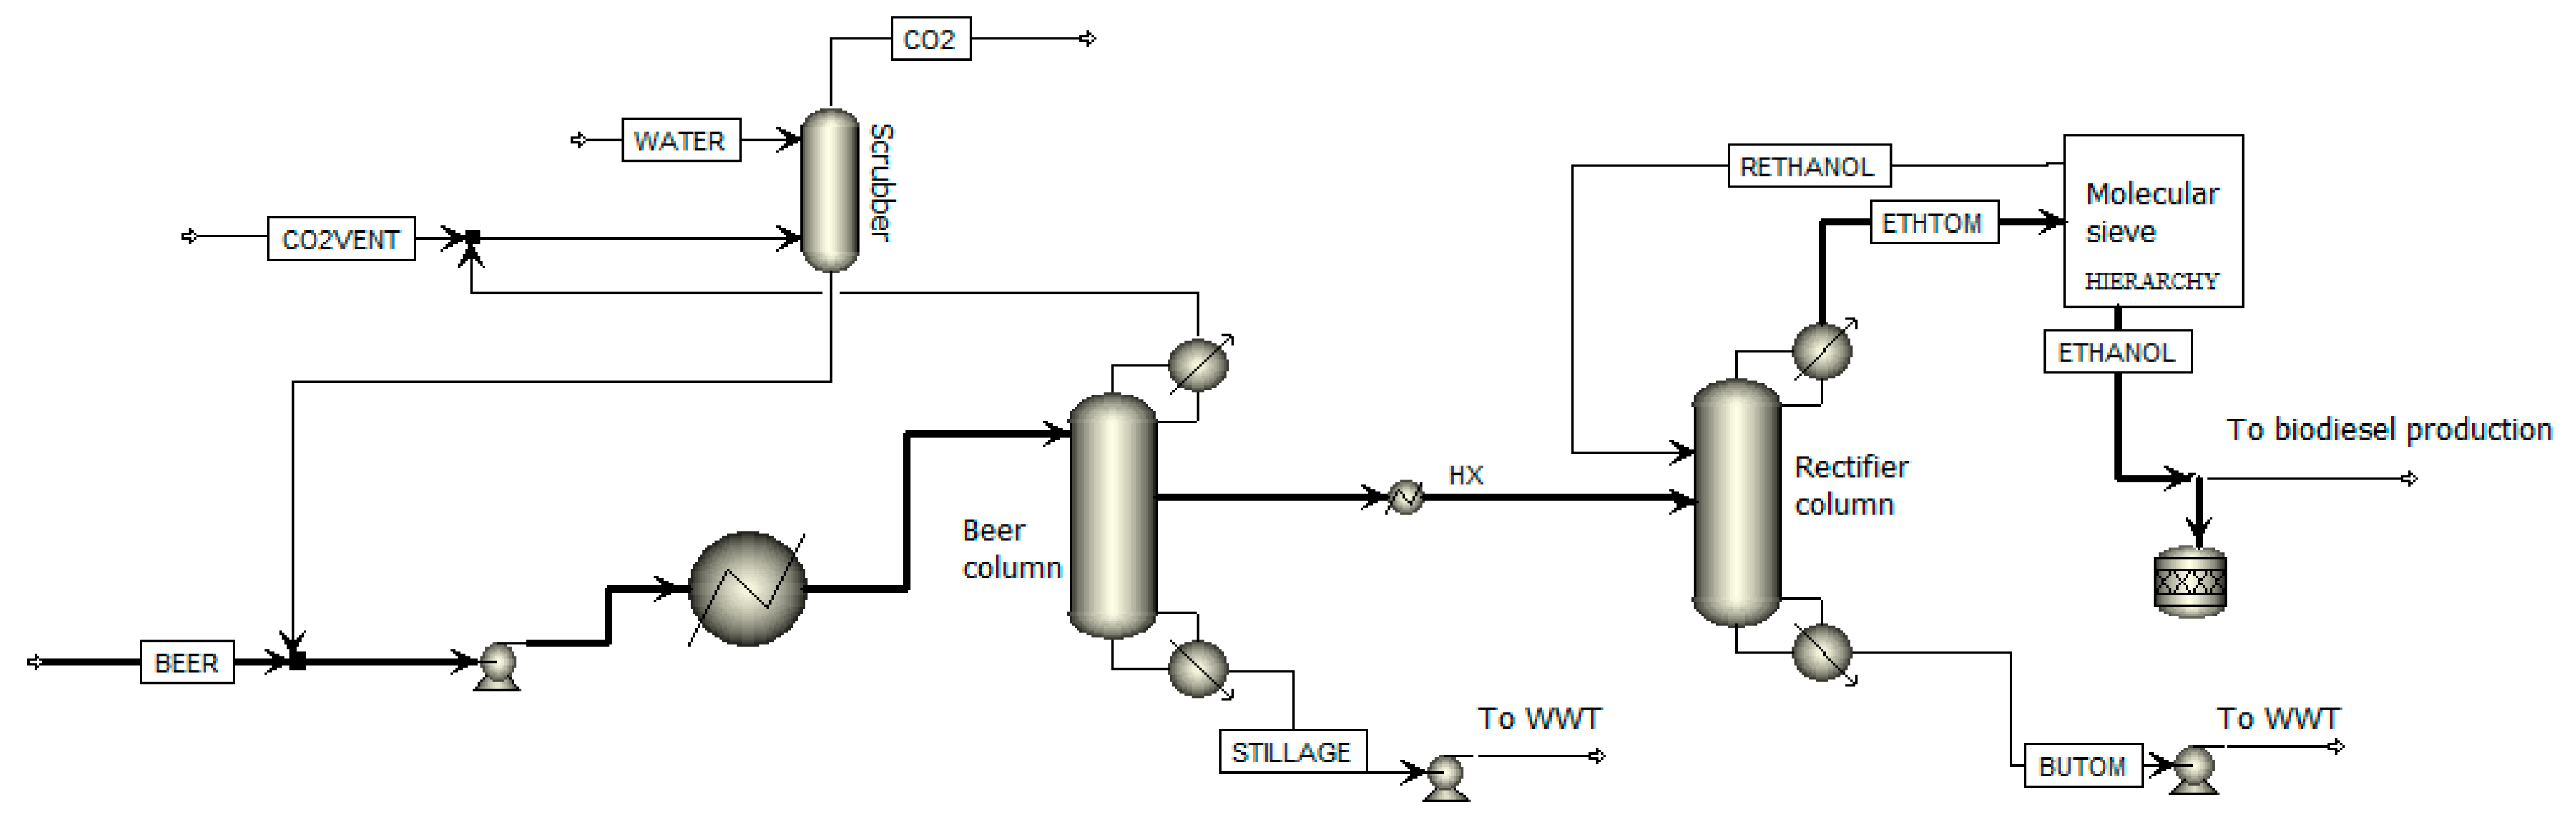
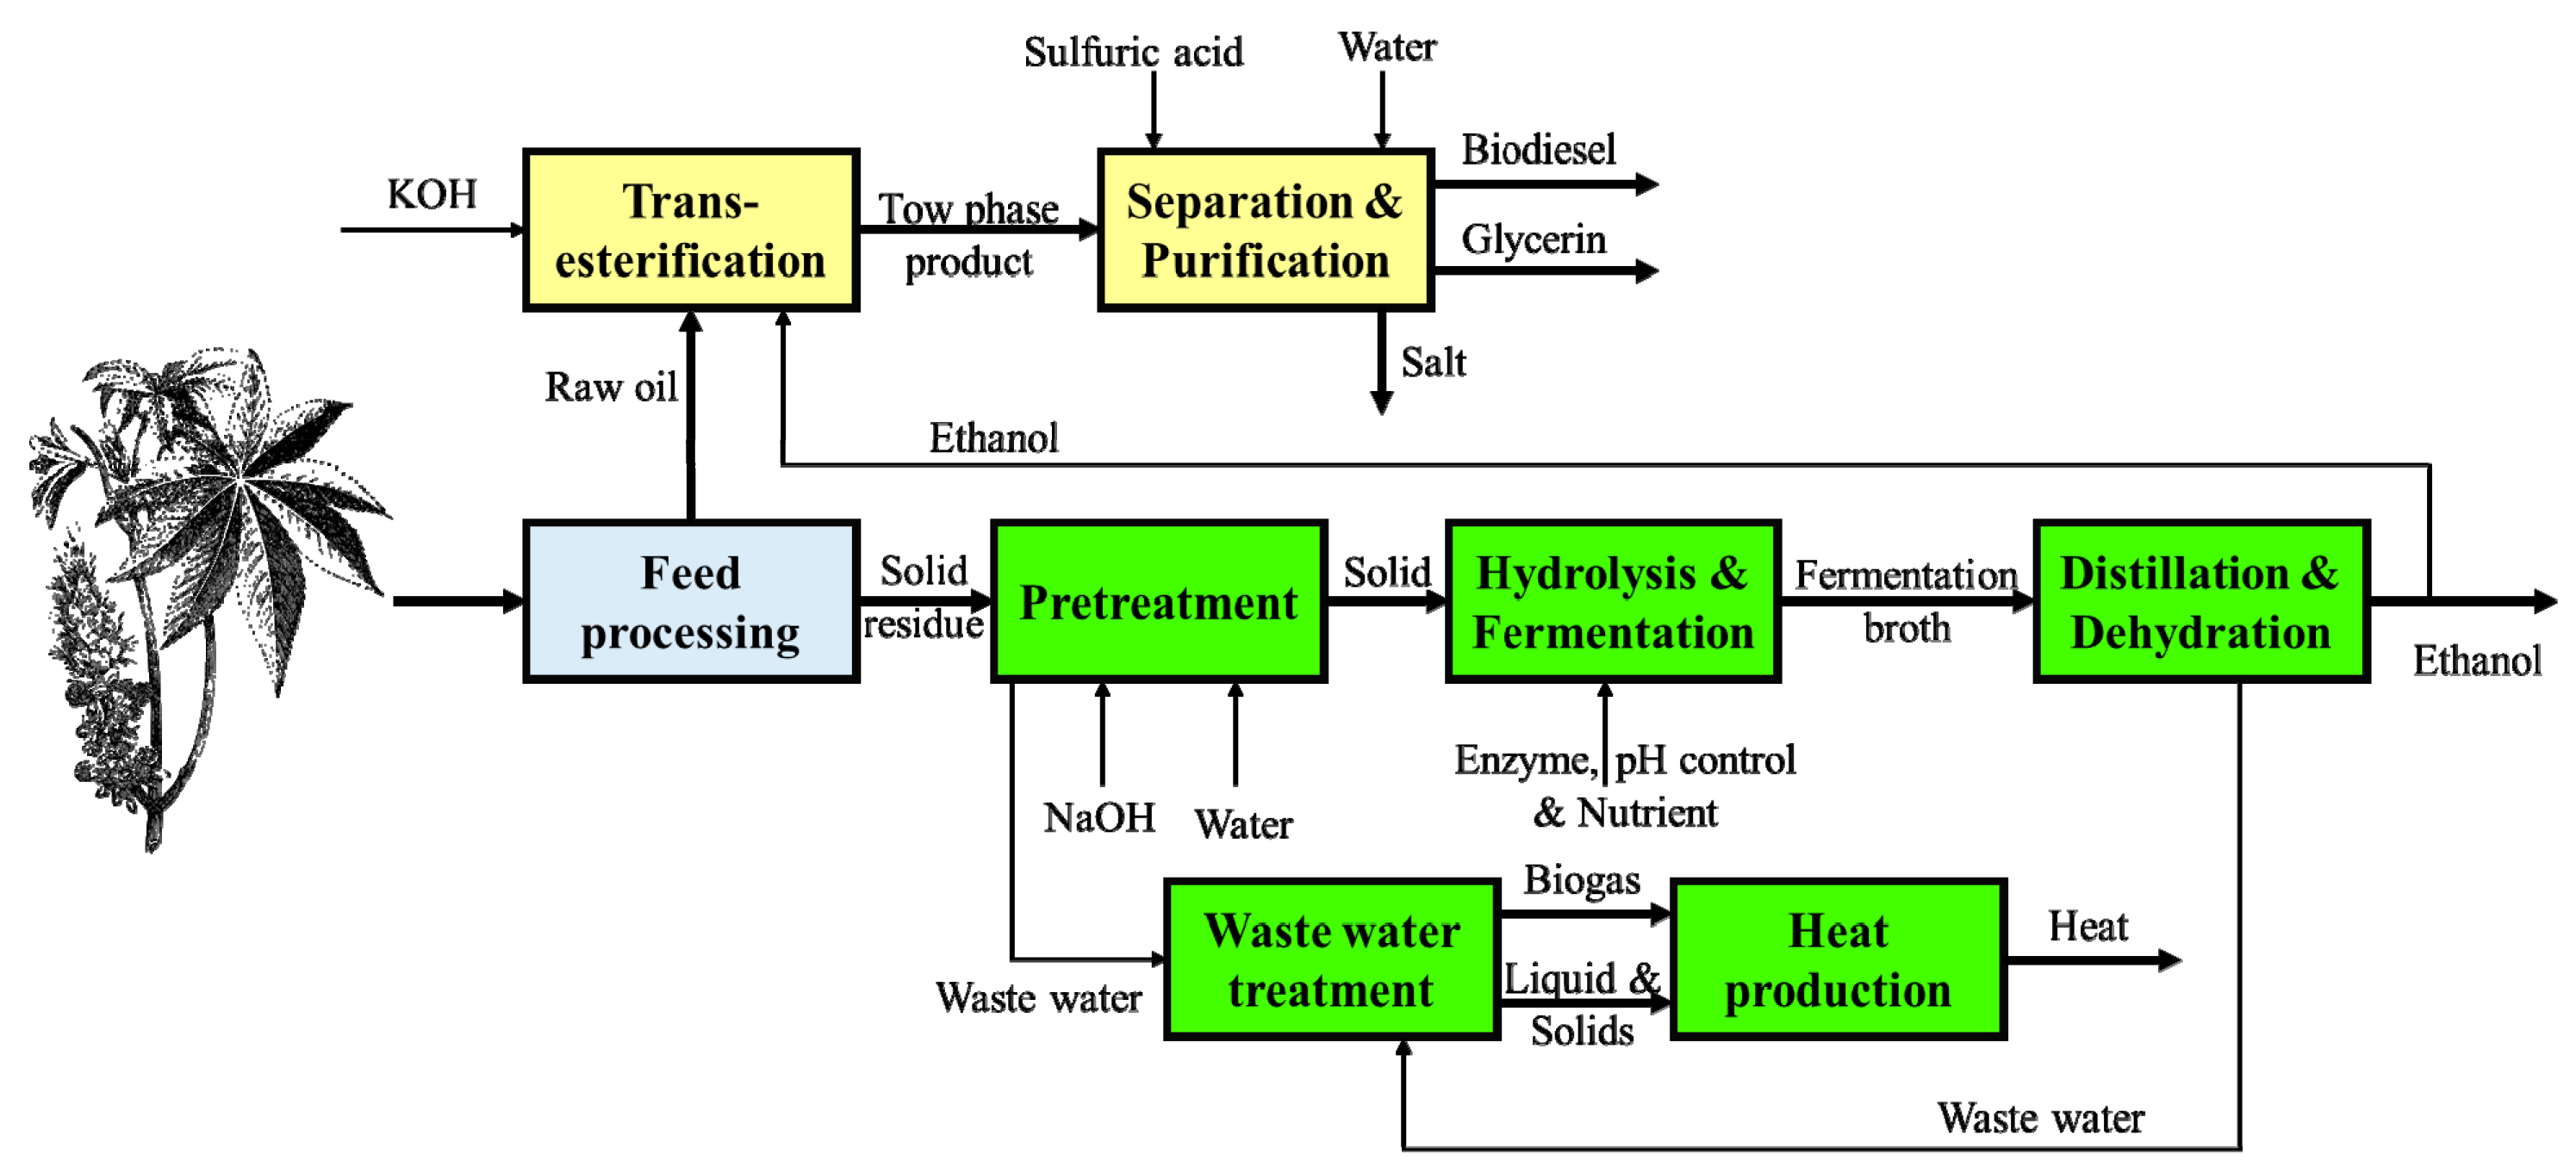
2.1.1. Scenario 1: The Biorefinery for Biodiesel (from Oil and Ethanol), Bioethanol, and Heat Production

This process includes feed handling, transesterification, biodiesel purification, pretreatment, ethanol production via simultaneous saccharification and fermentation (SSF), purification of bioethanol by distillation, and fuel grade production of ethanol by dehydration, heat production, wastewater treatment (WWT), and utility services units. The block flow diagram (BFD) of this scenario is shown in Figure 1.
In the harvest time, the seeds are separated, and seeds and residues were then sent to plant with trucks. In the feed handling unit, oil is extracted from the seeds by a cold mechanical press, filtered, kept for 24 h at 80 °C in the tank storage to remove extra moisture, and then sent to the transesterification reactor. Seed cake, stem, and leaves are crushed and dumped into storage piles until transfer to the pretreatment unit. Similar units for feed handling are considered for both scenarios [30].
Biodiesel is produced in a 25 m3 ransesterification reactor at 62.5 °C for 3.46 h by using 1 g potassium hydroxide (KOH) per kg oil and 0.29:1 ethanol to oil mass ratio to obtain 85% biodiesel efficiency. The two-phase stream, i.e., fatty acid esters (biodiesel) rich and glycerol rich streams, is removed from the reactor [1,9,20,27,31].
In the separation unit, the excess alcohol (here ethanol) contents of both biodiesel and glycerin are first recovered. The ethanol recovery is carried out by using a three-phase distillation tower, containing 22 sieve trays with 80% efficiency and operates under vacuum pressure of 0.2 bar (absolute). The product is finally sent to the dehydration unit for water separation, and the bottom stream of the tower sends to the biodiesel purification unit [31].
To help the phase separation, water is added to the process in the centrifuge. The products of transesterification are contaminated by the remaining raw material (i.e., oil), ethanol, catalyst (KOH), and soap. Thus, according to ASTM D6751 or EN 14214, the produced biodiesel is purified to contain less than 0.05% v/v impurities. A distillation tower containing 22 trays (sieve trays, 80% efficiency, operates at 0.1 bar pressure) is used for biodiesel purification. The purified biodiesel (99.95% v/v) obtained from the distillate is sent to the storage tanks, and the unreacted oil that exits from the bottom is sent back to the transesterification reactor. The glycerin-rich stream is first neutralized by the sulfuric acid and then purified in a distillation column with 4 sieve trays (80% efficiency, 0.4 bar pressure). The process flow diagram of the biodiesel production unit is presented in Figure 2 [1,24].
Figure 2. Process flow diagram of biodiesel production (transesterification and biodiesel purification units) (cf. Table 1 for process conditions).
Agronomy 10 01538 g002
Table 1. The process conditions for equipment for biodiesel production in scenario 1 in Figure 2.
Equipment/ConditionsTransesterification Reactor (R-201)Distillation Tower 1 (T-201)Distillation Tower 2 (T-202)Distillation Tower 3 (T-203)
Input T (°C)62.562.55025
Upper output T (°C)62.5216.7517244
Lower output T (°C)-42.1148.375
Input P (bar)1111
Upper output P (bar)-0.20.10.4
Lower output P (bar)10.20.20.5
Number of theoretical stages-17173
The pretreatment of castor residues is conducted with 8% w/v NaOH (100 °C, 60 min, 22% solid loading). The pretreated residues are then filtered and washed in a 9-stage counter current solid washer to minimize the freshwater consumption. Water containing the impurities is then sent to WWT unit.
SSF is used for ethanol production by hydrolysis of the pretreated solids (13% solid loading) with Cellic CTec3 enzyme (1.8% w/w of cellulose, Novozymes, Denmark [32]) and fermentation with Saccharomyces cerevisiae at 37 °C for 72 h under anaerobic conditions [25.33]. The nine main fermenters are designed with a volume of 350 m3. The seed yeast is prepared in a series of fermenters (stainless steel 304), starting from 5 L to 300 m3 final volume with 1:10 scale-up ratio. The beer (fermentation broth) stream, leaving the fermenters, contains 3.86% v/v ethanol, unfermented hexoses and pentoses, and lignin. The beer is stored in a 150 m3 tank and then sent to distillation step.
The purification of ethanol is conducted using stripper, rectifier, and scrubber columns (Table 2). The produced carbon dioxide is separated in a flash drum stage, and degassed beer is preheated to enter the second stage of stripper (24 sieve trays, 80% efficiency, 0.2 absolute bar). The vapor side-draw from the third stage, comprising 40.17% v/v ethanol, is fed to the rectifier column (32 sieve trays, 80% efficiency, 1.8 absolute bar). This column produced ethanol in 94% v/v concentration in vapor form. The vent from the top of the beer column, as well as the vents from beer stream storage and fermenters, is sent to the third column that is a water scrubber. The scrubber is a simple packed column that recovered 99% of vented ethanol by washing with water. The ethanol is exiting from the bottom and returned to the beer column [33]. The solid containing the unconverted residues of the substrate, e.g., lignin, is presented in the wastewater that leaves the distillation. It is sent to the wastewater treatment and used for heat production.
Saturated vapor from the rectifier column, along with the recovered ethanol from biodiesel separation unit, is superheated and fed to the molecular sieve unit for purification to 99.9% v/v concentration of ethanol. This unit includes two adsorption columns. They are used alternatively in adsorbing and regenerating operation. The regeneration of the adsorption columns is performed by pure hot ethanol vapor. The final product, i.e., pure ethanol, is cooled and a part of it (40%) is sent to the biodiesel production unit, and the remaining ethanol pumped to storage to be sold as a fuel [33].
Table 2. The process conditions for the equipment of distillation and dehydration in Figure 3.
Equipment/ConditionsBeer ColumnRectifier ColumnScrubber ColumnDehydration Section
Input temperature (°C)10012038.492.1
Highest output T (°C)122.2119.736.225
Lowest output T (°C)115.792.136-
Input P (bar)4.8211.7
Highest output P (bar)1.91.70.91
Lowest output P (bar)2.120.9-
Number of theoretical stages19259-
Figure 3. Process flow diagram of distillation and dehydration unit.
Agronomy 10 01538 g003
The bottom product of the rectifier column is pure water (>99% w/w) that is added to clean process water. The bottom product of the beer column, i.e., stillage, mainly contains non-fermentable sugars and lignin. Lignin is separated from this stream by filtration and is sent to the WWT unit. The liquor that is removed from the lignin separation step and the liquid effluent from the pretreatment unit is sent to the filtration and electrodialysis for the removal of dissolved compounds and NaOH that remained in the liquid. To reduce the COD and produce biogas, an anaerobic digester is used. The produced biogas consists of 44% carbon dioxide and 54% v/v biomethane. The rest of the organic materials are converted to CO2, water, and sludge, using aerobic digestion. A clarifier is used to settle the sludge, and the water is treated and added to clean process water. Biogas, lignin, and dewatered sludge are combusted, and heat is produced as a valuable byproduct in the heat production unit.

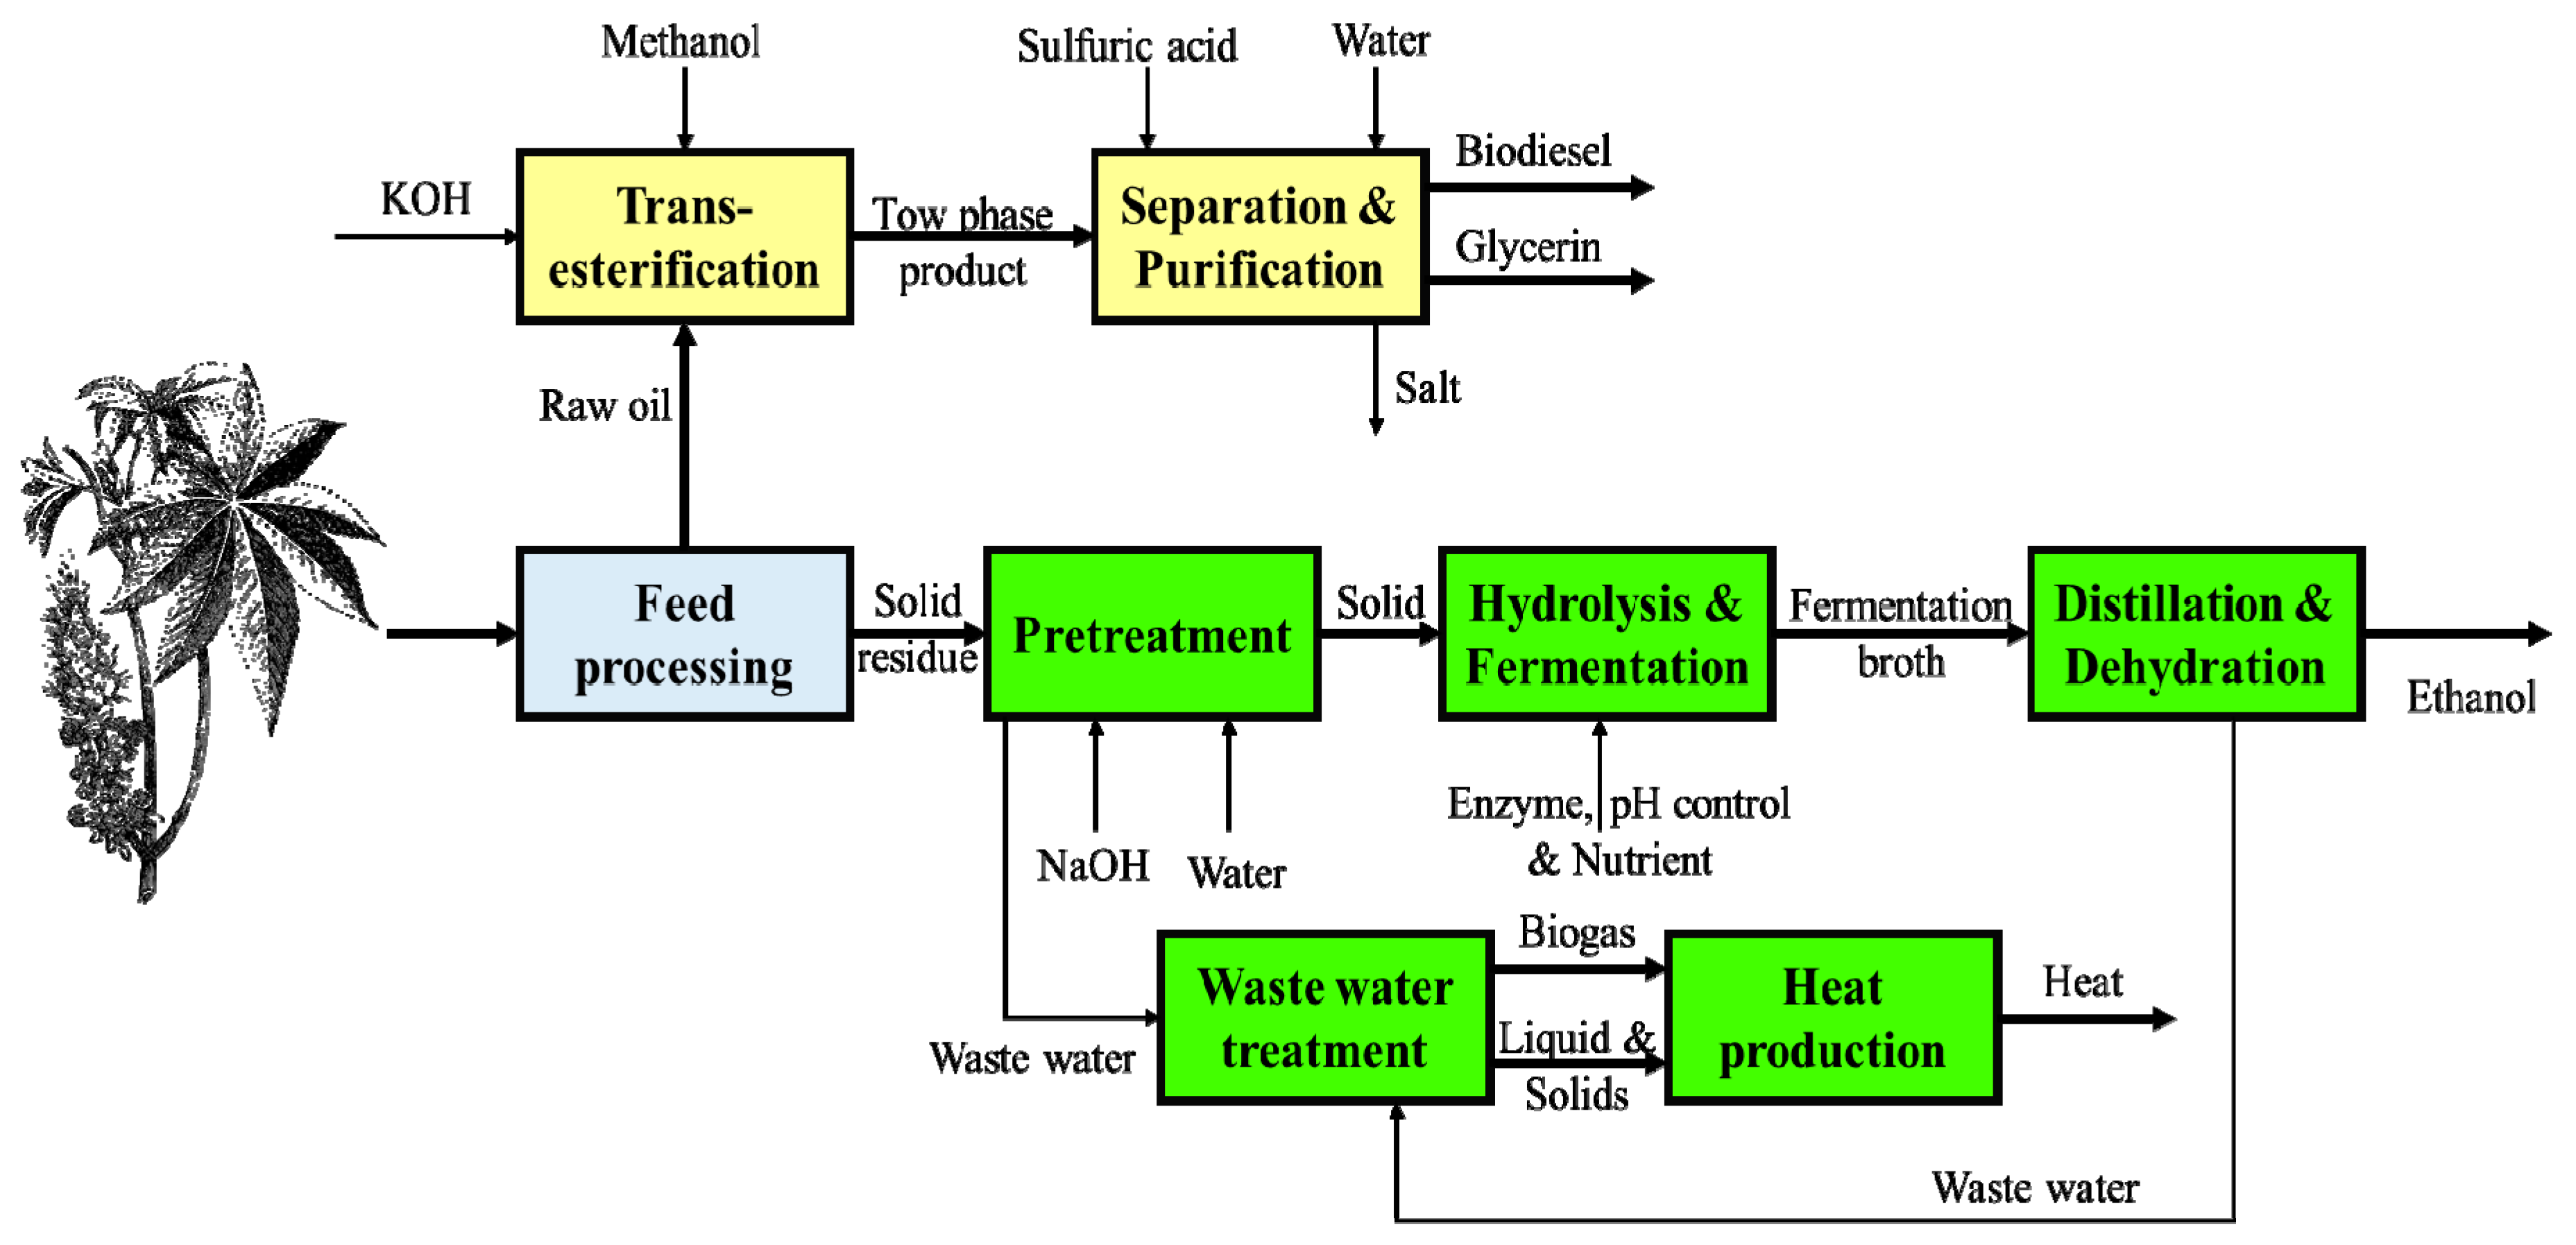
2.1.2. Scenario 2: The Biorefinery for Biodiesel (from Oil and Methanol), Bioethanol, and Heat Production

The overview of the process used in scenario 2 is presented in Figure 4. The castor plant seed and residual handling, oil extraction, and ethanol production units are similar to scenario 1. However, the transesterification of oil and process parameters are different. In this process, methanol is used for the transesterification in 10 m3 reactor (40 °C, 1.5 h, 1.5 g KOH/kg oil catalyst, 0.4:1 methanol to oil ratio). The excess alcohol is separated in the methanol recovery and recycled.

2.2. Plant Location and Capacity

In this study, Iran is selected as a place for the biorefinery, where fossil fuel resources and methanol are widely available. However, the area has water shortages and is dealing with severe environmental impacts. Therefore, castor, as a low water demanding plant that can be cultivated in wastewater, is used. Considering the total world production of castor [9,27], a plant with the capacity of handling 120,000 tons of castor plant per year (based on the dry weight) is used.

2.3. Process Simulation and Economic Calculations

The main processes of the biorefineries are simulated by Aspen Plus to obtain the composition and properties of streams. The physical properties databank of NREL (National Renewable Energy Laboratory, Golden, CO, USA) is used for the definition of lignocellulosic components [34]. The sizing and cost of all equipment are estimated by Aspen PEA. The assumptions are: plant capacity, 120,000 tons/year castor plant (dry basis); plant location, Asia (Iran); costs index, 2019; depreciation, straight-line for 7 years with zero salvage value; contingency factor, 18%; construction period, two years with a 6-month start-up; working capital, 5% of the total investment cost; project life, 30 years; tax rate, 0% based on Iran regulation for biofuel production.
The sensitivity analysis to identify the factors affecting the profitability and final price of biodiesel is carried out.

3. Results

Experimental data [9,27] showed promising results for the production of bioenergy from castor plant oil and residues. The residues are used for ethanol production, and ethanol is used as an alternative to methol for biodiesel production. The economic feasibility of this process is evaluated through the simulation by Aspen plus and analysis by Aspen PEA.

3.1. Material and Energy Balance

The amounts of feedstocks, products, and utilities are calculated and shown in Table 3. The primary raw materials used in the two scenarios (i.e., NaOH, nutrients, pH control agents, and enzymes) are equal. However, in the biodiesel production unit of scenario 2, based on experimental data, KOH consumption is more than scenario 1, and therefore, the amount of H2SO4 that is used for catalyst neutralization in scenario 2 is more than that in scenario 1. In scenario 1, a part of ethanol produced from the residues is used in the transesterification unit. Based on the experimental data, the conversion of this reaction in scenario 1 is 85.0%, while it is 88.2% in scenario 2. In scenario 1, 15% of raw oil is unreacted and recycled to the transesterification reactor, resulting in higher biodiesel production than that in scenario 2. Moreover, the biodiesel composition in each scenario is different. It is in the form of fatty acid ethyl ester in scenario 1, while it is fatty acid methyl ester in scenario 2. Consequently, the energy content of biodiesel in each scenario is different from another.
The main difference in the scenarios is the production of net ethanol. In scenario 1, about 40% of produced ethanol is used for biodiesel production, resulting in a much lower net ethanol production yield than that in scenario 2.
The prices of all components are shown in Table 3. Based on the price and amount of each component, seeds and solid residuals are the primary feeds of biorefinery. The price of NaOH (due to high consumption) and nutrients, which are expensive, is in the next position.
The distribution of raw material cost and product sales is shown in Figure 5. In scenario 1, the highest income is from biodiesel sale; in scenario 2, the transesterification reaction is conducted with methanol, and the highest revenue is from bioethanol sale.
The type and amount of utilities are shown in Table 3 for the two scenarios. The water is mainly used as makeup in the cooling system, in the pretreatment unit for washing the solid material, and to regulate NaOH concentration and in the fermentation step for adjusting the total solid in the fermenters. High pressure steam is used in distillation towers and also for heating. Low pressure steam is used to regulate the temperature and preheat the feeds. Fuel and hot oil are used for heating the oil streams in the biodiesel production unit in each scenario [33].
The breakdown of energy consumption in different units of each scenario is shown in Figure 6. Distillation towers in ethanol purification and energy consumption in biodiesel production are the most energy demanding units. Pretreatment of lignocellulosic materials at 100 °C and the anaerobic digestion at 55 °C, as well as the filtration system in the wastewater treatment unit, also need considerable amounts of energy.

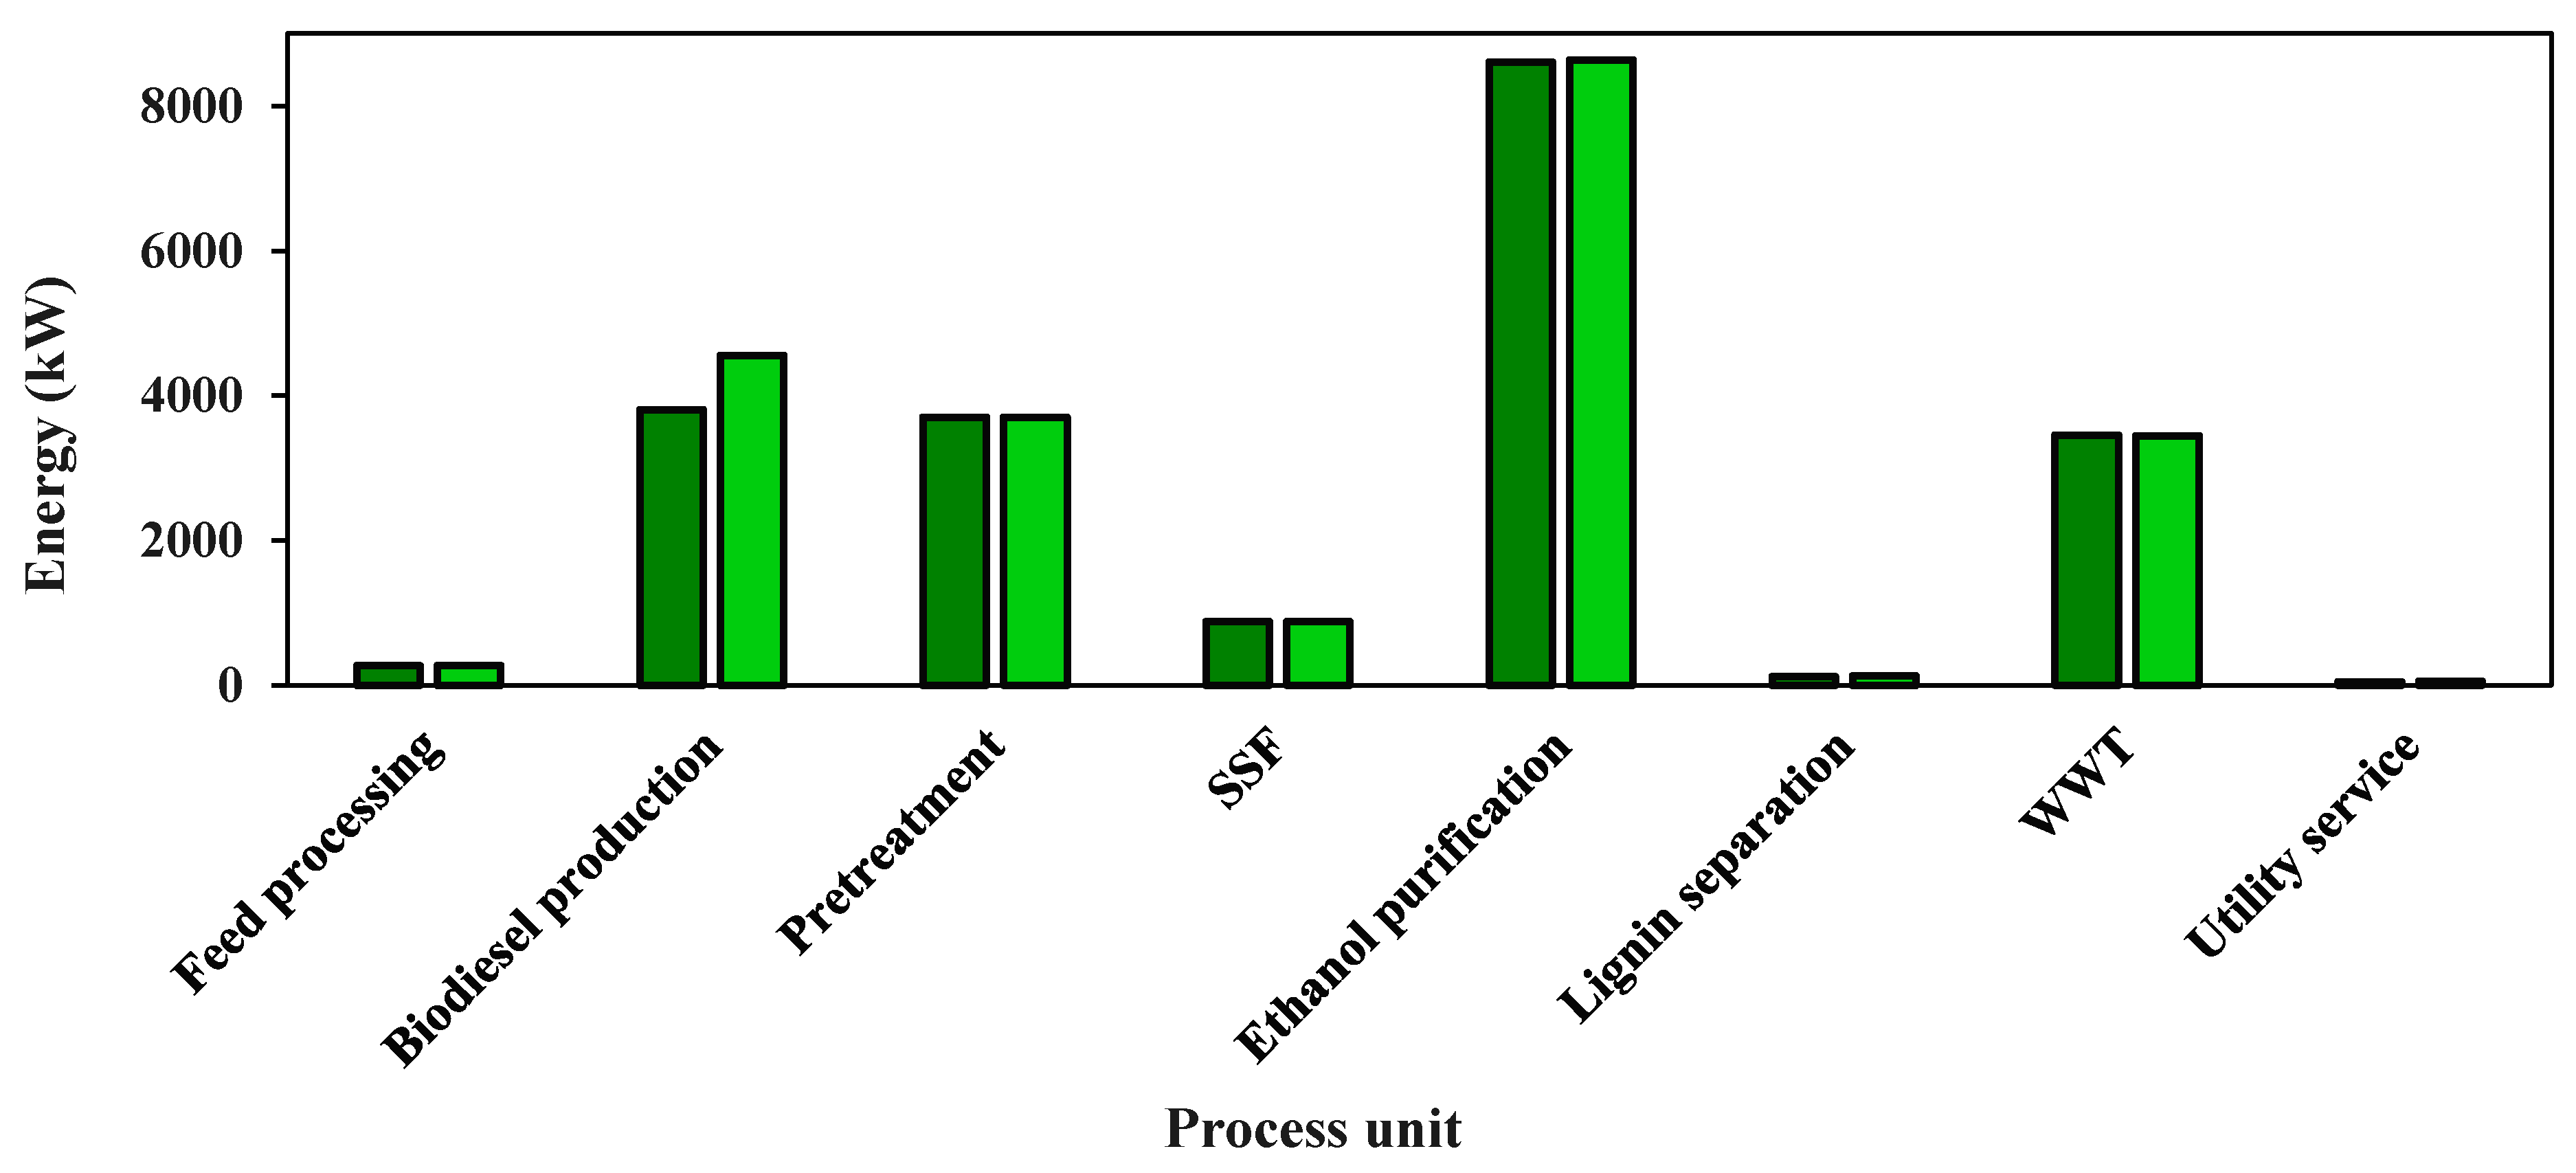
3.2. Energy Efficiency

The ratio of energy outputs to inputs in the process is defined as energy efficiency [32]. The energy outputs involve the energy available in biodiesel, bioethanol, and glycerol as well as produced heat. The energy inputs comprise the energy available in raw materials as well as steam, electricity, and fuel.
The energy consumptions of the scenarios are presented in Figure 6. The lower heating values are used to calculate the energy content of raw materials and products. The energy efficiency of scenarios 1 and 2 are 64.8% and 64.1%, respectively. In scenario 2, the energy consumption of the biodiesel production unit is more than that in scenario 1. On the other hand, the energy content of biodiesel is higher than that of ethanol, and in scenario 1, the amount of produced biodiesel is considerably higher than scenario 2. Thus, for the production of a higher amount of energy, transesterification with ethanol is preferred.

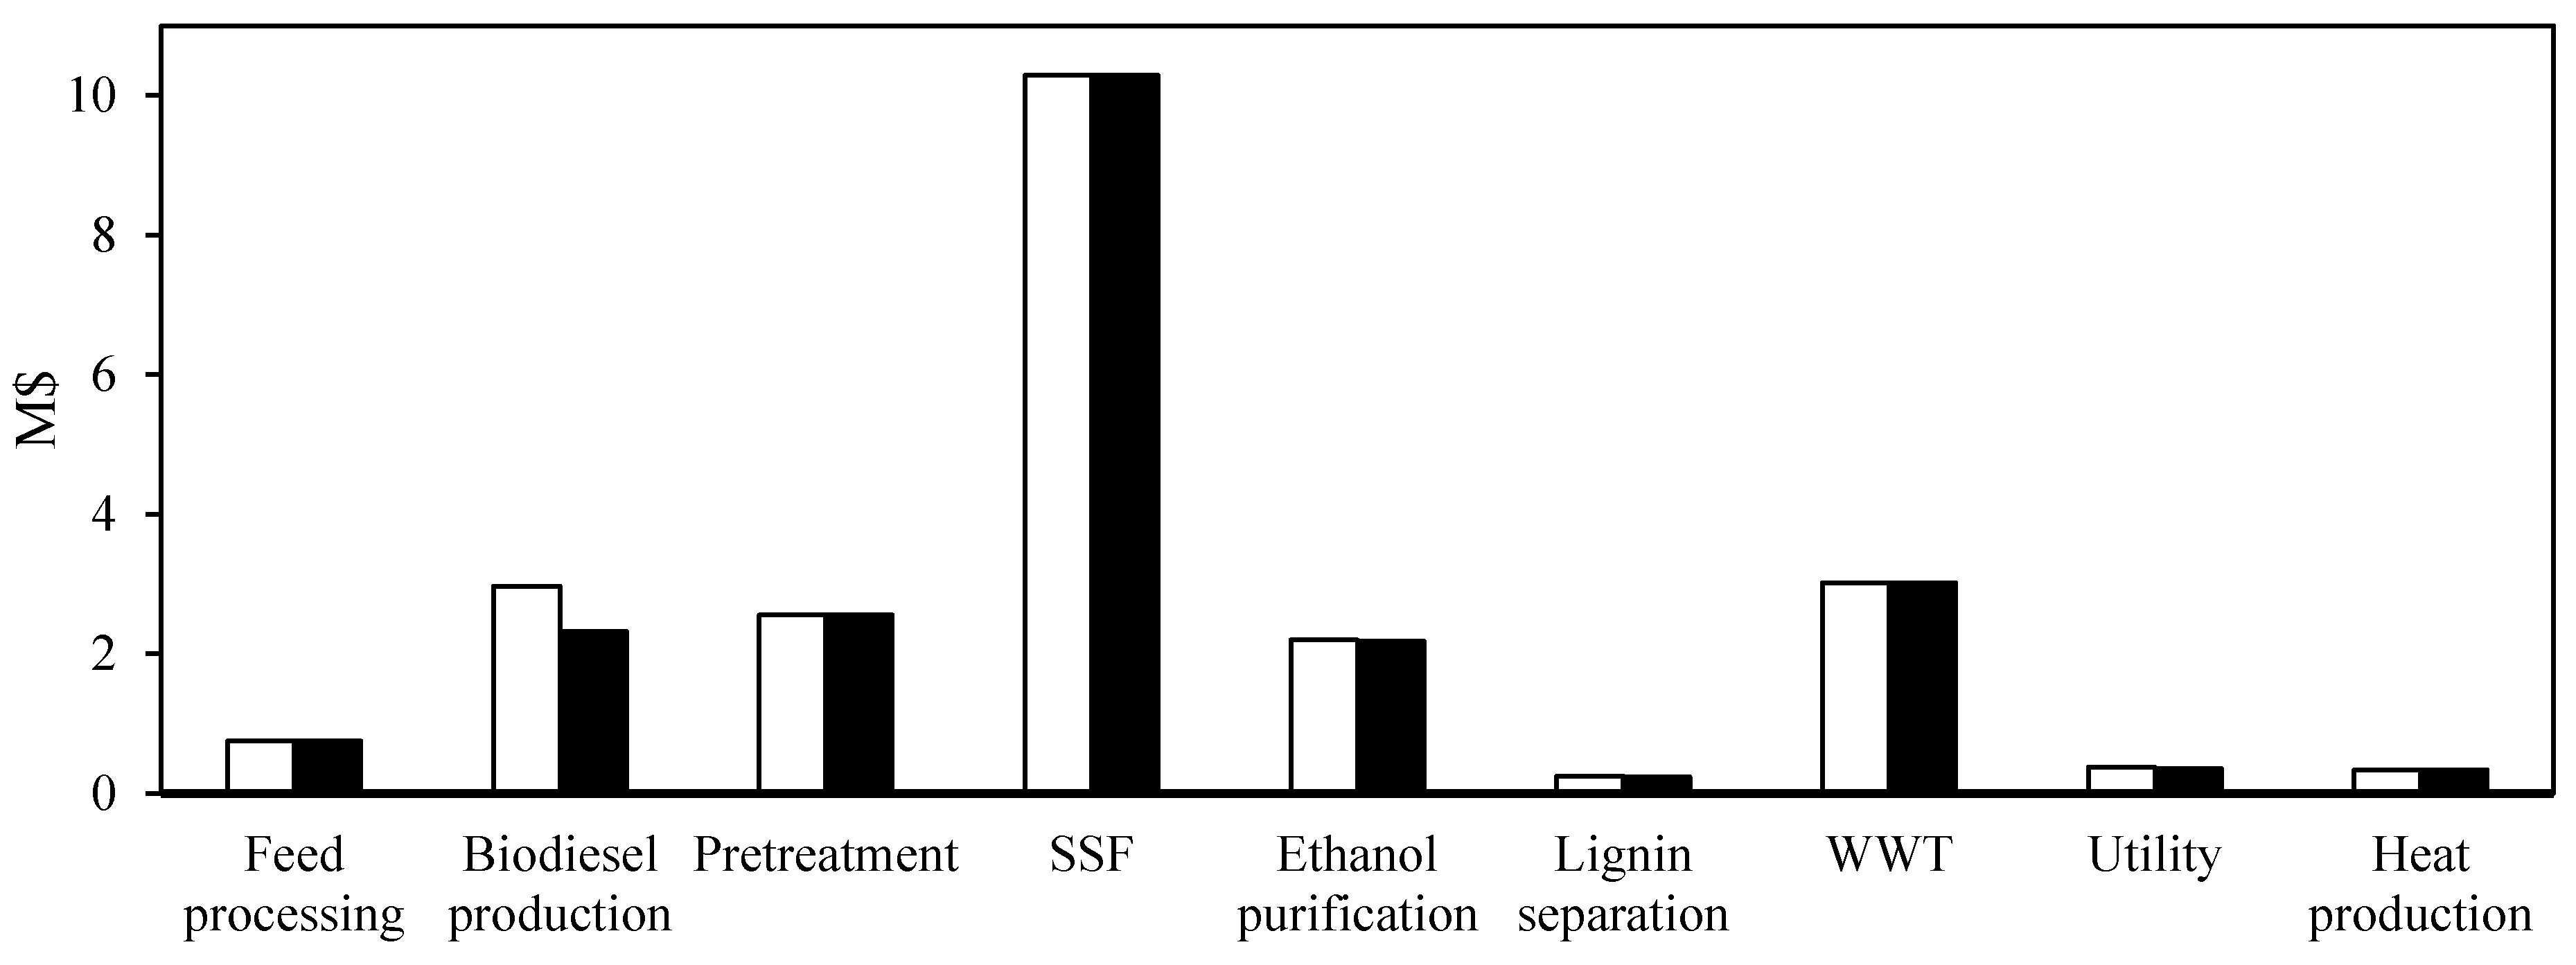
3.3. Total Capital Cost
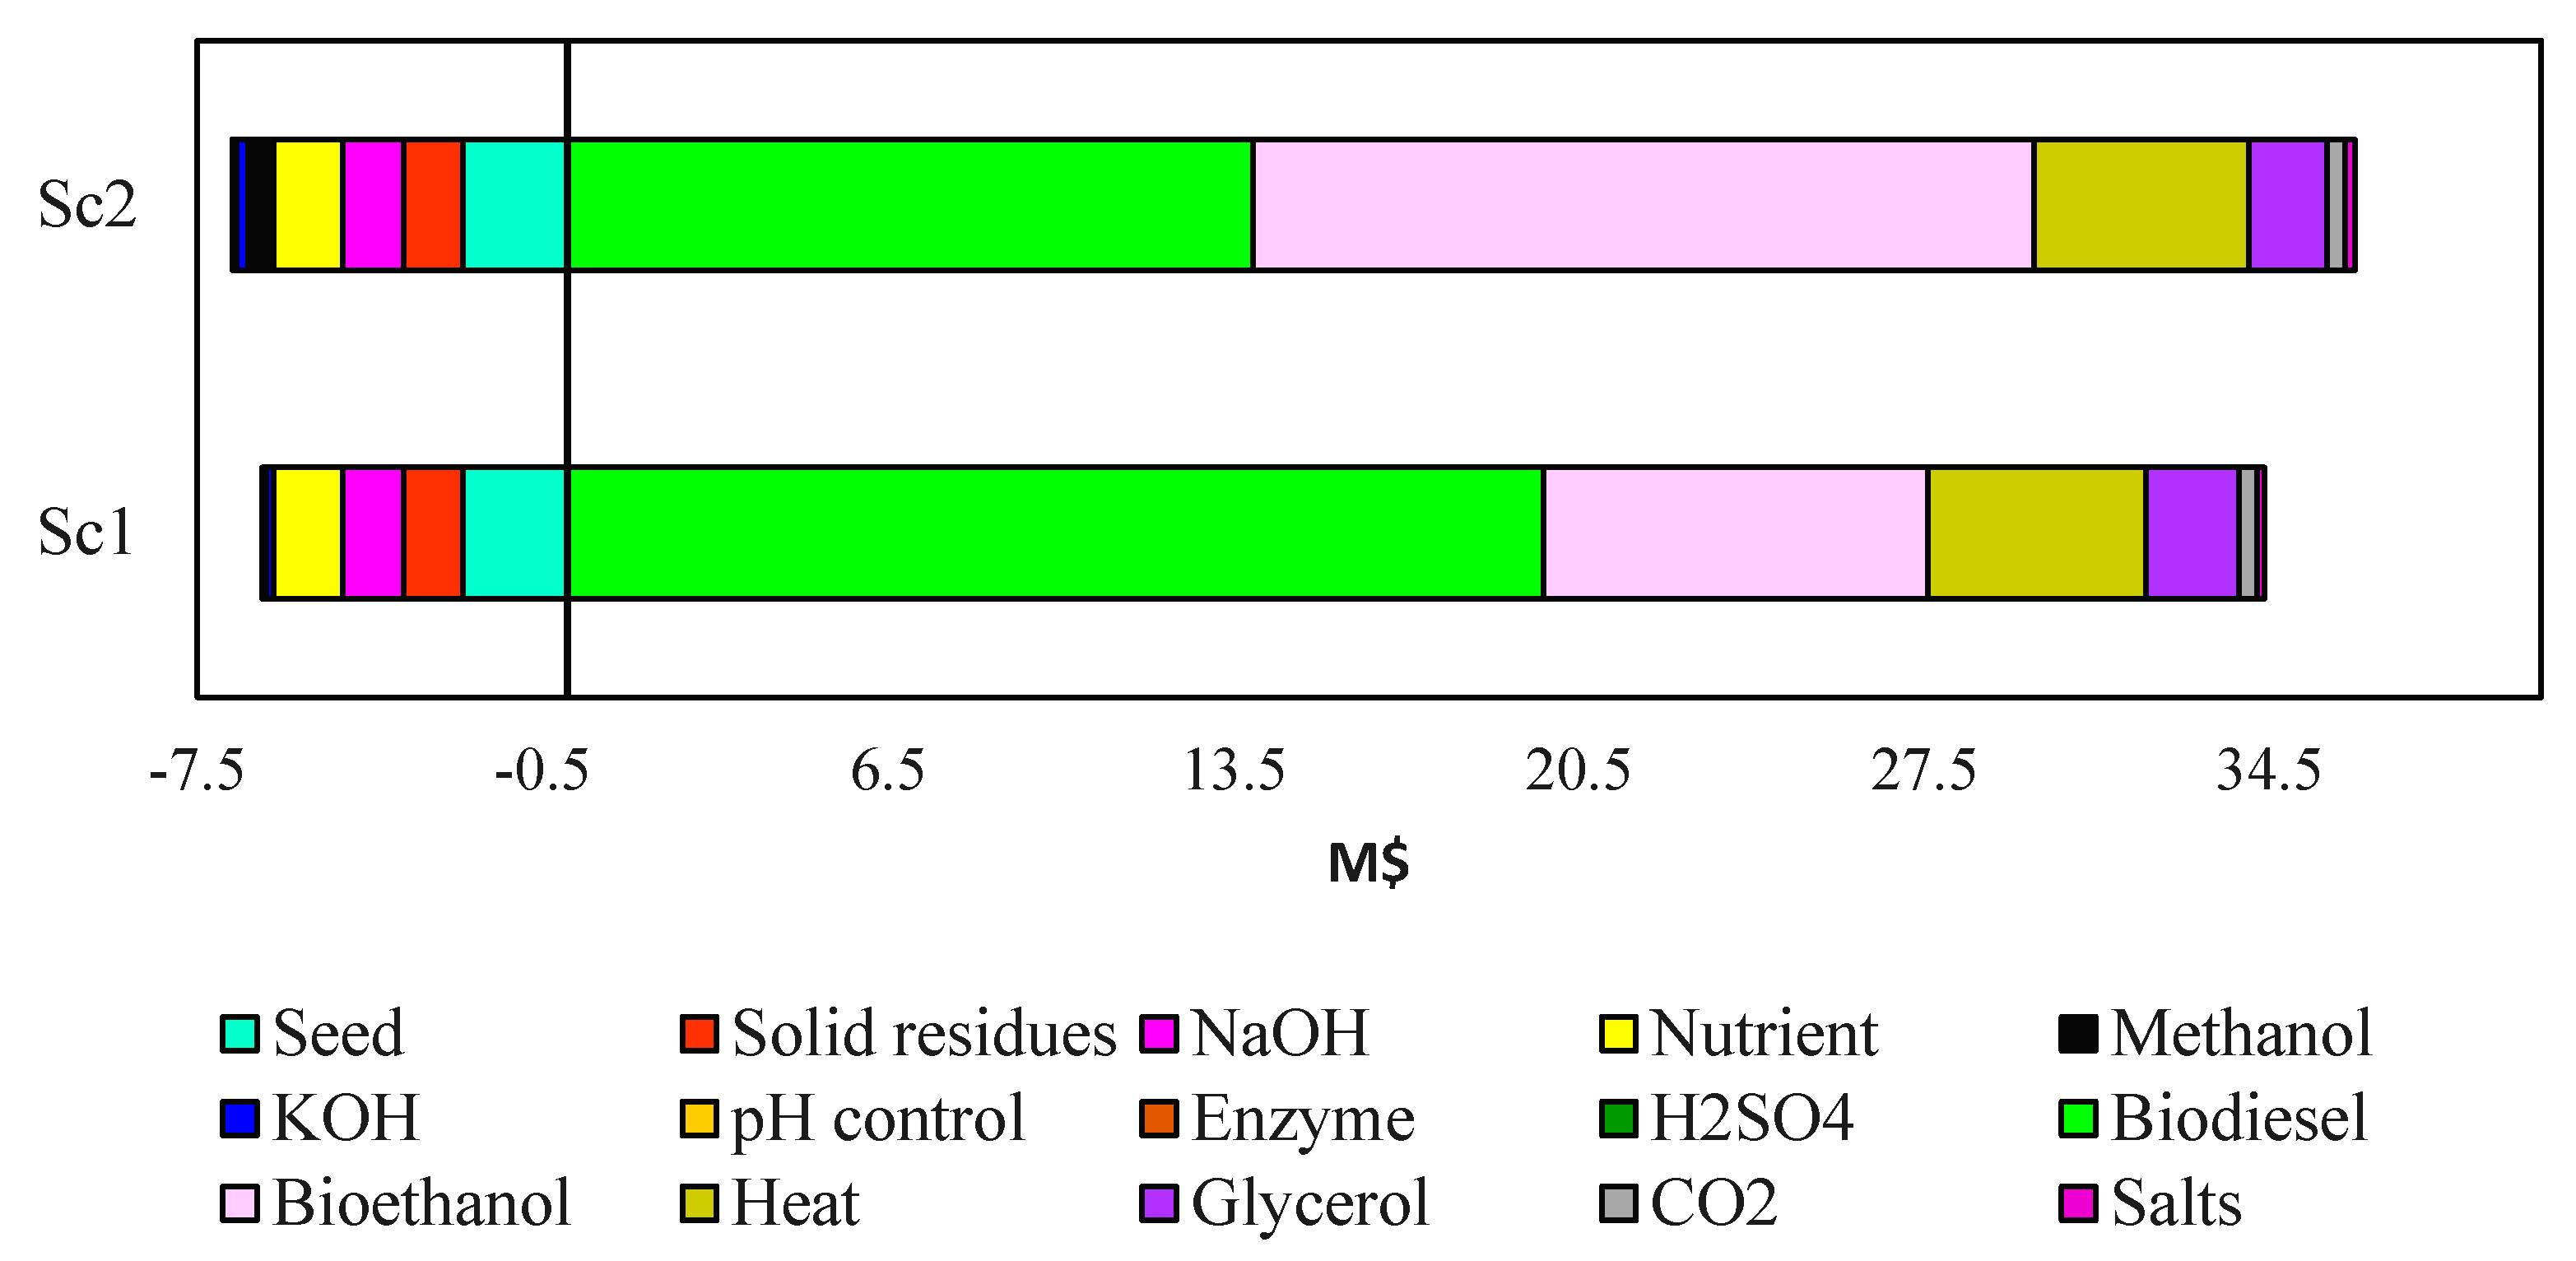
Based on the simulation results, economic analysis was conducted by Aspen PEA for each scenario. Total project investments are USD 51.69 million and USD 48.90 million for scenarios 1 and 2, respectively. The retention times for transesterification reactions in scenarios 1 and 2 are 3.64 and 1.5 h, respectively. The volume of equipment in scenario 1 is much higher than those in scenario 2, which results in the higher total capital cost of the plant in scenario 1 [31].
The most expensive units of plants are SSF and wastewater treatment (WWT) (Figure 7). SSF needs a long retention time (24 h) and a relatively high number of equipment, and the WWT unit needs filtration together with large anaerobic digesters with a long retention time [13].

3.4. Operating Cost

The breakdown of the operating costs is summarised in Figure 8. The direct manufacturing costs include the expenses for labor, supervisory, raw materials, utilities, and equipment maintenance and repairs. Tax and overhead are the fixed charges, while the expenditures for research and development, financing, and administrative form the general expenses [33]. The coziest raw materials are castor seed, plant residues, and sodium hydroxide. The byproducts of plants are bioethanol, glycerin, potassium phosphate, heat, and carbon dioxide. The highest revenue from the byproducts is obtained from bioethanol.

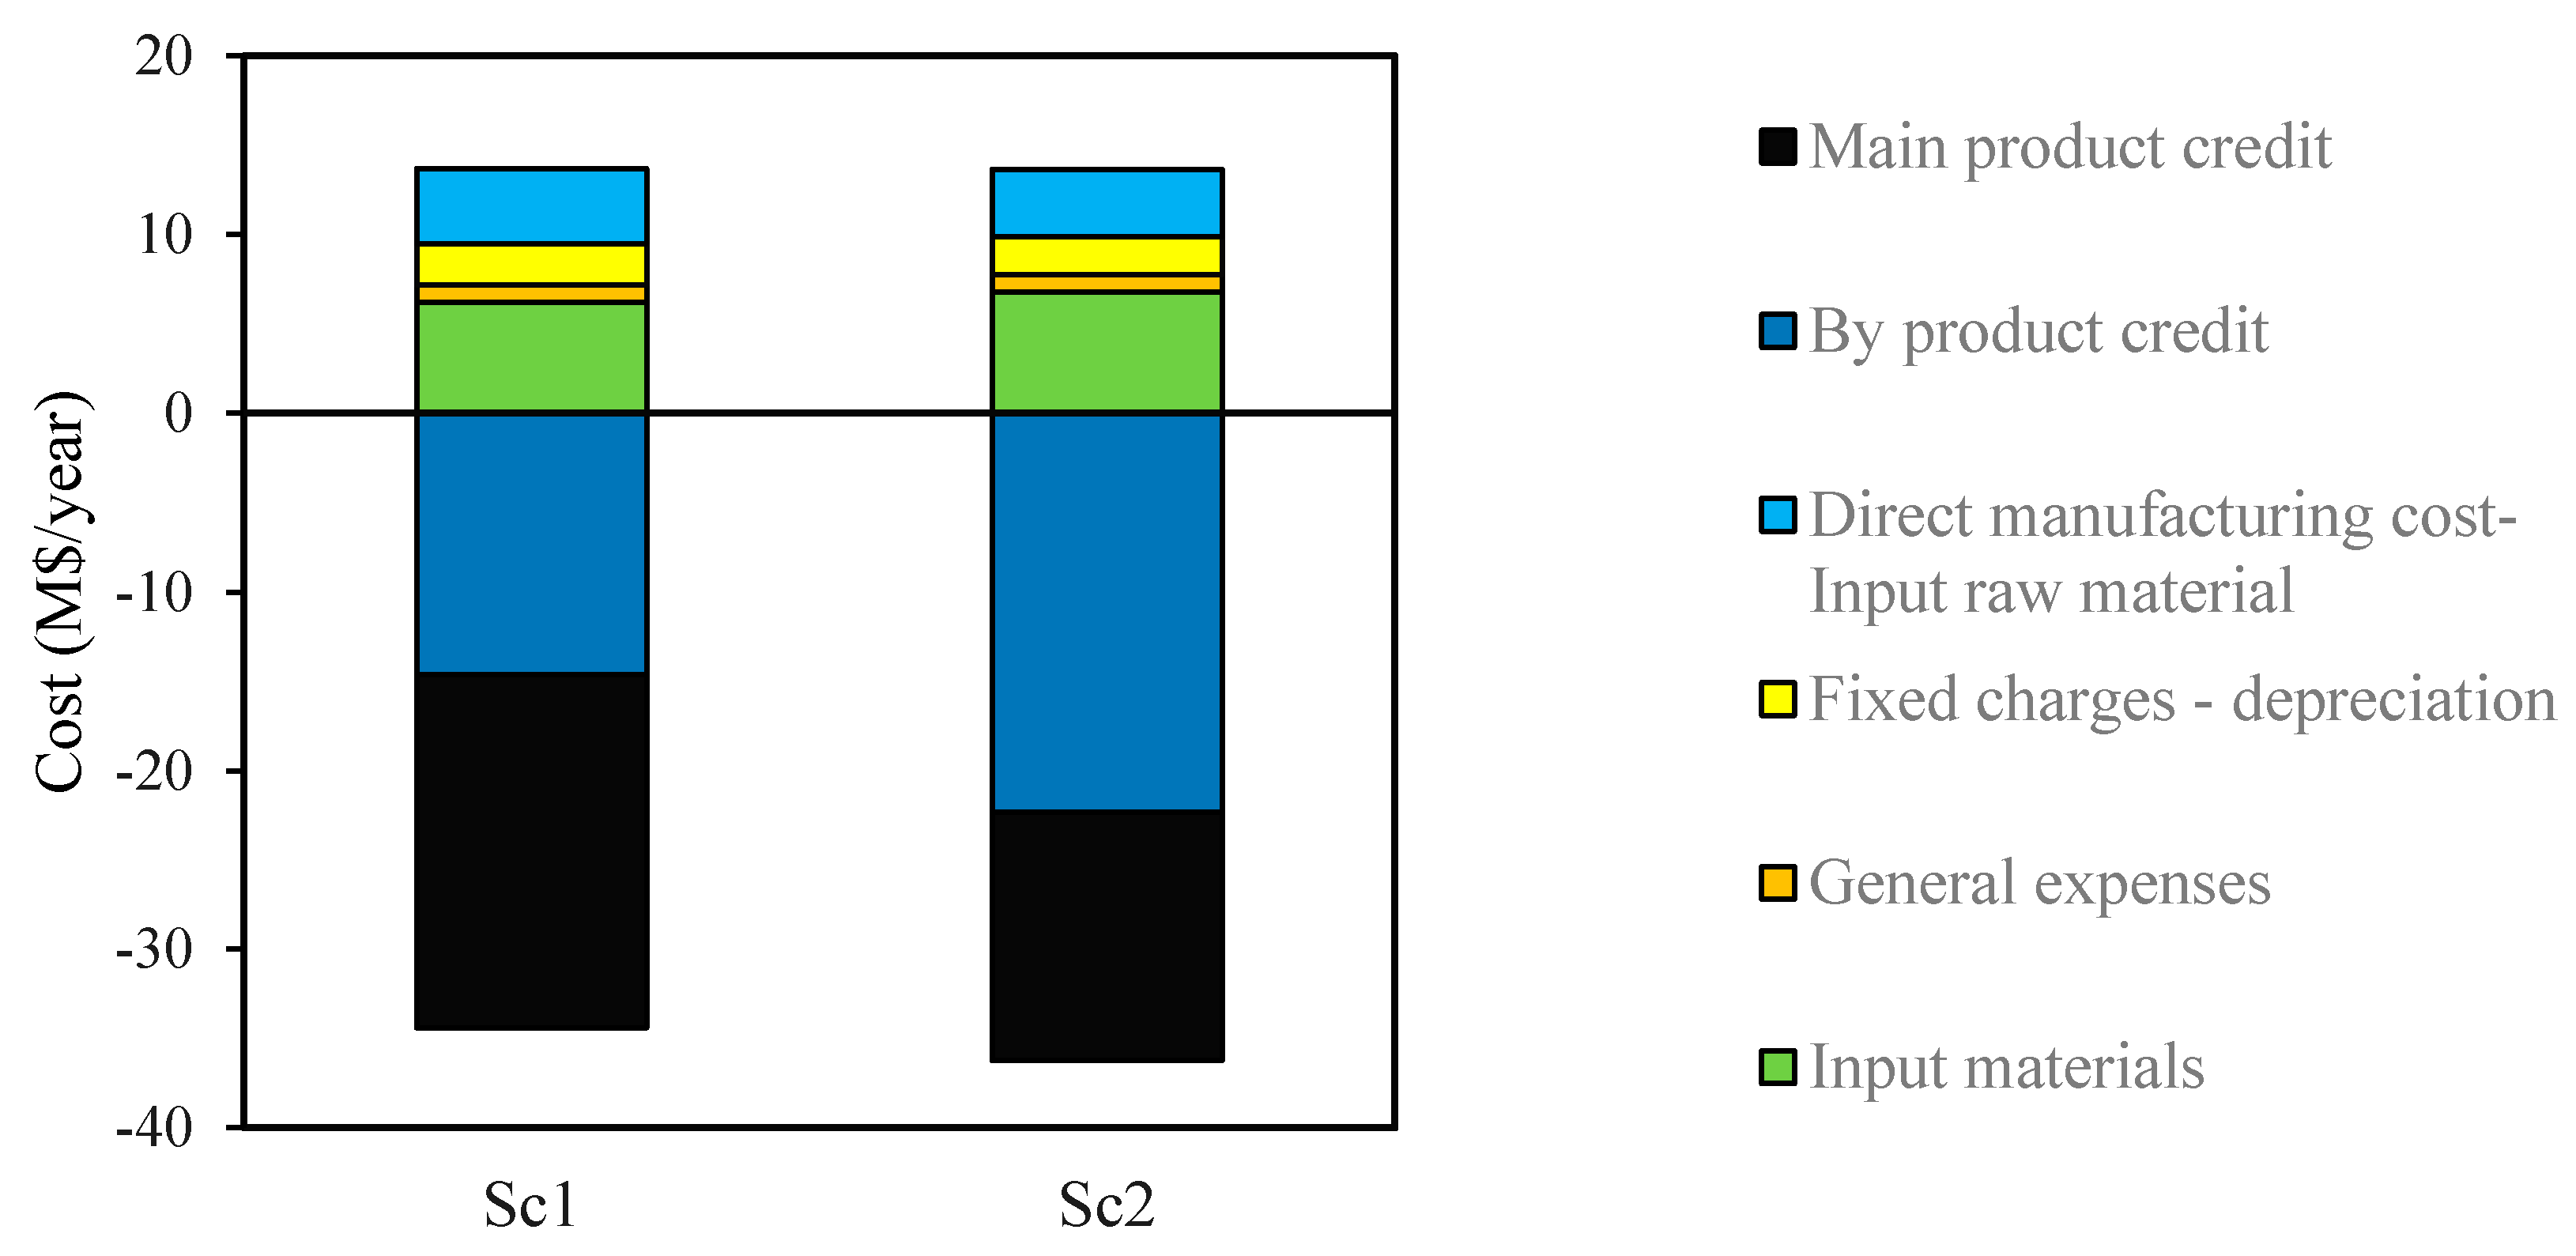
3.5. Manufacturing and Equivalent Costs

The manufacturing costs of biodiesel and bioethanol are calculated by considering the operating cost for all scenarios, and the breakdown is shown in Figure 8. The manufacturing costs of biodiesel for scenarios 1 and 2 are 0.328 and 0.271 USD/L, respectively. The final price of biodiesel is 0.336 and 0.279 USD/L, respectively. In spite of more biodiesel production in scenario 1, the final price is higher than that in scenario 2, which is due to the higher operating and total investment costs. The final price of biodiesel in the two scenarios is lower than the diesel fuel price (Table 4). The diesel equivalent prices of biodiesel, as the main product in each scenario, are presented Table 4. This parameter in scenario 2 is lower than the diesel price; thus, this process is more economically feasible and can compete with fossil-fuel-based diesel.
The manufacturing cost, final price, and gasoline-equivalent price were calculated for bioethanol in each scenario (Table 4). In the two scenarios, the gasoline equivalent price of bioethanol is more than the gasoline price. Therefore, bioethanol in Iran could not be an appropriate substitute for gasoline. The amount of ethanol produced in scenario 2 is higher than that in scenario 2.

3.6. Profitability Parameters

Considering the interest rate and money time value in the operating costs and total capital investment, discounted cash flow and the profitability parameters, i.e., profitability index, net return rate on investment, and payout period are calculated (Table 5) [33].
The payout period is the minimum time to get back the total capital investment. The minimum time is calculated for scenario 2 because of the lowest capital investment requirement and higher revenue. Net return rate is the ratio of the net present value and the present value (PV) of cumulative outflows. NRR of the two scenarios is positive, indicating the profitability of the two processes.
The relative profitability of processes was evaluated by the profitability index (PI), which is calculated by dividing the income value by the costs. The results (Table 5) show that both scenarios are profitable since the project is profitable when PI is greater than one. However, scenario 2 is more profitable, which is due to the production of higher amounts of ethanol.

3.7. Sensitivity Analysis

The effects of changes in the price of the most expensive raw materials (Figure 5), i.e., seed, castor plant residues, methanol, and NaOH, on bioethanol and biodiesel price are presented in Figure 9. The results indicate that seed oil and methanol prices significantly affect the manufacturing price of biodiesel. For example, 13% and 23% increases in the biodiesel manufacturing cost for scenarios 1 and 2 are observable after a 50% increase in seed oil price, respectively. The next effective parameter is the methanol price. Increasing the methanol price by 50% leads to a 5% increase in the manufacturing cost of biodiesel in scenario 2.
The price of plant residuals and NaOH had a direct effect on the bioethanol cost. As shown in Figure 9A,B by increasing the price of plant residuals and NaOH, the bioethanol manufacturing cost is increased and has a secure margin compared with the ethanol in the Iranian market. In both scenarios, bioethanol is the main byproduct. The biodiesel price is calculated by dividing the net yearly production expenses into the annual biodiesel production rate. The net yearly production expenses are calculated by subtraction of ethanol revenues from total production costs of the plant. Thus, the biodiesel manufacturing cost is decreased by increasing the ethanol production price.
The effects of bioethanol and heat prices, the main byproducts, on the biodiesel manufacturing cost are presented in Figure 10. The results indicate that there is no revenue from the byproduct by 50% increase in the byproduct price in the base cases. The price and amount of glycerol, CO2, and salts have minimal effects and do not significantly affect the process economy. Moreover, the effects of bioethanol and heat price on biodiesel price are also investigated. For both scenarios, the credit from bioethanol significantly affected the manufacturing cost of biodiesel.
The effects of the primary feedstock (castor seeds) price on the profitability index of each scenario are investigated (Figure 11). Increasing the seed oil price leads to decreasing the profitability index. By changing the price of seed oil in the range of 0–400%, the profitability index is larger than one for both scenarios, indicating a wide safe margin for PI.

4. Conclusions

Using ethanol produced from the lignocellulosic waste for biodiesel production from castor oil has excellent environmental benefits. However, the results of this study showed that the production of biodiesel from the castor oil by transesterification with fossil-based methanol is more economically profitable. In other words, there is a trade-off between economic aspects of the process and environmental issues. Moreover, the sensitivity analysis performed on the price of the main product showed that the price of the primary seed oil is the most important determinant of the price of the final product. This analysis also showed that the production of ethanol has an enormous effect on the price of the final product, i.e., biodiesel.

Author Contributions

Conceptualization, M.S. and K.K.; methodology, M.S.; software, V.R.; validation, M.S. and K.K.; formal analysis, V.R. and M.S.; investigation, V.R. and M.S.; resources, M.S.; data curation, V.R. and M.S.; writing—original draft preparation, V.R.; writing—review and editing, M.S. and K.K.; visualization, V.R. and M.S.; supervision, M.S. and K.K.; project administration, M.S. and K.K.; funding acquisition, K.K. All authors have read and agreed to the published version of the manuscript.

Funding

This research received no external funding.

Conflicts of Interest

The authors declare no conflict of interest.

References

  1. Nigam, P.S.; Singh, A. Production of liquid biofuels from renewable resources. Prog. Energy Combust. Sci. 2011, 37, 52–68. [Google Scholar] [CrossRef]
  2. Demirbaş, A. Progress and recent trends in biodiesel fuels. Energy Convers. Manag. 2009, 50, 14–34. [Google Scholar] [CrossRef]
  3. Berman, P.; Nizri, S.; Wiesman, Z. Castor oil biodiesel and its blends as alternative fuel. Biomass-Bioenergy 2011, 35, 2861–2866. [Google Scholar] [CrossRef]
  4. Chakrabarti, M.; Ali, M.; Baroutian, S.; Saleem, M. Techno-economic comparison between B10 of Eruca sativa L. and other indigenous seed oils in Pakistan. Process. Saf. Environ. Prot. 2011, 89, 165–171. [Google Scholar] [CrossRef]
  5. Tabatabaei, M.; Karimi, K.; Horváth, I.S.; Kumar, R. Recent trends in biodiesel production. Biofuel Res. J. 2015, 2, 258–267. [Google Scholar] [CrossRef]
  6. Menon, V.; Rao, M. Trends in bioconversion of lignocellulose: Biofuels, platform chemicals & biorefinery concept. Prog. Energy Combust. Sci. 2012, 38, 522–550. [Google Scholar] [CrossRef]
  7. Taherzadeh, M.; Karimi, K. Pretreatment of Lignocellulosic Wastes to Improve Ethanol and Biogas Production: A Review. Int. J. Mol. Sci. 2008, 9, 1621–1651. [Google Scholar] [CrossRef] [Green Version]
  8. Skoulou, V.; Mariolis, N.; Zanakis, G.; Zabaniotou, A. Sustainable management of energy crops for integrated biofuels and green energy production in Greece. Renew. Sustain. Energy Rev. 2011, 15, 1928–1936. [Google Scholar] [CrossRef]
  9. Bateni, H.; Karimi, K.; Zamani, A.; Benakashani, F. Castor plant for biodiesel, biogas, and ethanol production with a biorefinery processing perspective. Appl. Energy 2014, 136, 14–22. [Google Scholar] [CrossRef]
  10. Ogunniyi, D. Castor oil: A vital industrial raw material. Bioresour. Technol. 2006, 97, 1086–1091. [Google Scholar] [CrossRef]
  11. Kurian, J.K.; Nair, G.R.; Hussain, A.; Raghavan, G.V. Feedstocks, logistics and pre-treatment processes for sustainable lignocellulosic biorefineries: A comprehensive review. Renew. Sustain. Energy Rev. 2013, 25, 205–219. [Google Scholar] [CrossRef]
  12. Sandin, G.; Røyne, F.; Berlin, J.; Peters, G.M.; Svanström, M. Allocation in LCAs of biorefinery products: Implications for results and decision-making. J. Clean. Prod. 2015, 93, 213–221. [Google Scholar] [CrossRef]
  13. Shafiei, M.; Karimi, K.; Zilouei, H.; Taherzadeh, M. Economic Impact of NMMO Pretreatment on Ethanol and Biogas Production from Pinewood. BioMed Res. Int. 2014, 2014, 1–13. [Google Scholar] [CrossRef] [PubMed]
  14. Glisic, S.B.; Orlović, A.M. Review of biodiesel synthesis from waste oil under elevated pressure and temperature: Phase equilibrium, reaction kinetics, process design and techno-economic study. Renew. Sustain. Energy Rev. 2014, 31, 708–725. [Google Scholar] [CrossRef]
  15. Marchetti, J.M.; Miguel, V.; Errazu, A. Techno-economic study of different alternatives for biodiesel production. Fuel Process. Technol. 2008, 89, 740–748. [Google Scholar] [CrossRef]
  16. You, Y.-D.; Shie, J.-L.; Chang, C.-Y.; Huang, S.-H.; Pai, C.-Y.; Yu, Y.-H.; Chang, C.H. Economic Cost Analysis of Biodiesel Production: Case in Soybean Oil. Energy Fuels 2008, 22, 182–189. [Google Scholar] [CrossRef]
  17. Ong, H.; Mahlia, T.M.I.; Masjuki, H.; Honnery, D. Life cycle cost and sensitivity analysis of palm biodiesel production. Fuel 2012, 98, 131–139. [Google Scholar] [CrossRef]
  18. Quintero, J.A.; Felix, E.R.; Rincón, L.E.; Crisspín, M.; Baca, J.F.; Khwaja, Y.; Cardona, C.A. Social and techno-economical analysis of biodiesel production in Peru. Energy Policy 2012, 43, 427–435. [Google Scholar] [CrossRef]
  19. Karmee, S.K.; Patria, R.D.; Lin, C.S.K. Techno-Economic Evaluation of Biodiesel Production from Waste Cooking Oil—A Case Study of Hong Kong. Int. J. Mol. Sci. 2015, 16, 4362–4371. [Google Scholar] [CrossRef] [Green Version]
  20. Khounani, Z.; Nazemi, F.; Shafiei, M.; Aghbashlo, M.; Tabatabaei, M. Techno-economic aspects of a safflower-based biorefinery plant co-producing bioethanol and biodiesel. Energy Convers. Manag. 2019, 201, 112184. [Google Scholar] [CrossRef]
  21. Aghbashlo, M.; Tabatabaei, M.; Hosseinpour, S. On the exergoeconomic and exergoenvironmental evaluation and optimization of biodiesel synthesis from waste cooking oil (WCO) using a low power, high frequency ultrasonic reactor. Energy Convers. Manag. 2018, 164, 385–398. [Google Scholar] [CrossRef]
  22. Hoang, A.T.; Tabatabaei, M.; Aghbashlo, M.; Carlucci, A.P.; Ölçer, A.I.; Le, A.T.; Ghassemi, A. Rice bran oil-based biodiesel as a promising renewable fuel alternative to petrodiesel: A review. Renew. Sustain. Energy Rev. 2020, 135, 110204. [Google Scholar] [CrossRef]
  23. Anna Ekman, O.W.; Elisabeth, J.; Pål, B. Possibilities for sustainable biorefineries based on agricultural residues—A case study of potential straw-based ethanol production in sweden. Appl. Energy 2013, 102, 299–308. [Google Scholar] [CrossRef]
  24. Quintero, J.A.; Moncada, J.; Cardona, C.A. Techno-economic analysis of bioethanol production from lignocellulosic residues in Colombia: A process simulation approach. Bioresour. Technol. 2013, 139, 300–307. [Google Scholar] [CrossRef]
  25. Shafiei, M.; Karimi, K.; Taherzadeh, M. Techno-economical study of ethanol and biogas from spruce wood by NMMO-pretreatment and rapid fermentation and digestion. Bioresour. Technol. 2011, 102, 7879–7886. [Google Scholar] [CrossRef]
  26. Rahimi, V.; Shafiei, M. Techno-economic assessment of a biorefinery based on low-impact energy crops: A step towards commercial production of biodiesel, biogas, and heat. Energy Convers. Manag. 2019, 183, 698–707. [Google Scholar] [CrossRef]
  27. Bateni, H.; Karimi, K. Biodiesel production from castor plant integrating ethanol production via a biorefinery approach. Chem. Eng. Res. Des. 2016, 107, 4–12. [Google Scholar] [CrossRef]
  28. Khoshnevisan, B.; Rafiee, S.; Tabatabaei, M.; Ghanavati, H.; Mohtasebi, S.S.; Rahimi, V.; Shafiei, M.; Angelidaki, I.; Karimi, K. Life cycle assessment of castor-based biorefinery: A well to wheel LCA. Int. J. Life Cycle Assess. 2017, 23, 1788–1805. [Google Scholar] [CrossRef]
  29. Rajaeifar, M.A.; Tabatabaei, M.; Aghbashlo, M.; Hemayati, S.S.; Heijungs, R. Biodiesel Production and Consumption: Life Cycle Assessment (LCA) Approach. In Biorefining of Biomass to Biofuels; Springer: Berlin/Heidelberg, Germany, 2018; pp. 161–192. [Google Scholar]
  30. Humbird, D.; Tao, R.D.L.; Kinchin, C.; Hsu, D.; Aden, A.; Schoen, P.; Olthof, J.L.B.; Worley, M.; Sexton, D.; Dudgeon, D. Process Design and Economics for Biochemical Conversion of Lignocellulosic Biomass to Ethanol, Dilute-Acid Pretreatment and Enzymatic Hydrolysis of Corn Stover; National Renewable Energy Laboratory: Golden, France, 2011. [Google Scholar]
  31. Zhang, Y.; A Dubé, M.; McLean, D.D.; Kates, M. Biodiesel production from waste cooking oil: 2. Economic assessment and sensitivity analysis. Bioresour. Technol. 2003, 90, 229–240. [Google Scholar] [CrossRef]
  32. Shafiei, M.; Kabir, M.M.; Zilouei, H.; Horváth, I.S.; Karimi, K. Techno-economical study of biogas production improved by steam explosion pretreatment. Bioresour. Technol. 2013, 148, 53–60. [Google Scholar] [CrossRef]
  33. Turton, R.; Bailie, R.C.; Whiting, W.B.; Shaeiwitz, J.A. Analysis, Synthesis and Design of Chemical Processes; Prentice Hall PTR: Upper Saddle River, NJ, USA, 2003. [Google Scholar]
  34. Wooley, R.; Putsche, V. Development of an ASPEN PLUS Physical Property Database for Biofuels Components. National Renewable Energy Laboratory, TP-425-20685: Golden, CO, USA, 1996. [Google Scholar]
Figure 1. The block flow diagram (BFD) of biorefining of an environmentally friendly process for biodiesel and ethanol production (scenario 1).
Agronomy 10 01538 g001
Figure 4. The BFD of biorefining of the fossil-based process for biodiesel and ethanol production (scenario 2).
Agronomy 10 01538 g004
Figure 5. The distribution of raw material cost and product sales.
Agronomy 10 01538 g005
Figure 6. Breakdown of energy consumption in units of each scenario. Dark and light green represent scenarios 1 and 2, respectively.
Agronomy 10 01538 g006
Figure 7. Breakdown of capital investment in units. The empty and filled columns represent scenarios 1 and 2, respectively.
Agronomy 10 01538 g007
Figure 8. The breakdown of the operating costs.
Agronomy 10 01538 g008
Figure 9. The effect of NaOH price on bioethanol price in scenario 1 (●) (A), effect of the price of plant residuals on the bioethanol manufacturing cost in scenarios 1 (▲) and 2 (♦) (B), and effect of methanol price on biodiesel price in scenario 2 (♦) (C). The empty sign represents the base case values of the profitability index.
Agronomy 10 01538 g009
Figure 10. The effects of bioethanol and heat prices on the biodiesel manufacturing cost.
Agronomy 10 01538 g010
Figure 11. The effects of seed oil cost on the profitability index in scenarios 1 (▲) and 2 (♦). The empty sign represents the base case values of the profitability index.
Agronomy 10 01538 g011
Table 3. Energy and material balances for each scenario based on simulation results.
ComponentsScenario 1Scenario 2Price (USD/kg)
Raw materials (ton/year)
Solid residuals63,84063,8400.02
Seed56,16056,1600.04
NaOH 1653065300.19
Nutrient 2446044600.31
Methanol-21300.25
H2SO41702400.02
KOH 11802700.84
pH control 31701700.18
Enzyme777.5
Products (ton/year)
Biodiesel10,4907400
Ethanol795016,1400.94 (USD/L)
Glycerol220018500.85
Heat30305.7 (USD/MJ)
CO2 46,292,0006,292,0000.06 (USD/m3)
Salts1503400.59
Utilities
Make up water1,171,4401,240,0430.03 (USD/m3)
High pressure steam69,30577,70613.07 (USD/ton)
Low pressure steam87,61187,61113.07 (USD/ton)
Fuel6.325.4111.86 (USD/MWh)
Power 5529552896.38 × 10−6 (USD/kWh)
1 The purity of NaOH is 60% weight per volume and used KOH is solid. 2 The nutrients are a mixture of 60% (w/w) of super triple phosphate and 40% (w/w) of urea. 3 The pH controls with Na2CO3. 4 m3 per year. 5 Megawatt per year.
Table 4. The manufacturing cost and final price of biofuels.
ProductManufacturing Cost (USD/L)Final Price (USD/L)Final Price (Gasoline Equivalent) (USD/L)
Biodiesel
Scenario 10.3280.3360.410
Scenario 20.2710.2790.323
Bioethanol
Scenario 10.4740.4820.701
Scenario 20.4680.4760.693
Gasoline *-0.4000.400
Diesel fuel *-0.3800.380
Medical Ethanol-0.9401.370
* The price of fossil fuels is based on the price offered by Organization of the Petroleum Exporting Countries (OPEC) for the Middle East region on December 2016.
Table 5. The profitability parameters of four scenarios.
Scenario12
Payout period (year)5.214.64
Net return rate (NRR)29.2141.69
Profitability index (PI)1.291.41

