Abstract
Pearl millet (Pennisitum glaucum L.) is a warm season C4 grass well adapted to semiarid climates where concerns over scarce and depleting water resources continually prompt the search for water efficient crop management to improve water use efficiency (WUE). A two-year study was conducted in the Southern Great Plains, USA, semi-arid region, to determine optimum levels of irrigation, row spacing, and tillage to maximize WUE and maintain forage production in pearl millet. Pearl millet was planted in a strip-split-plot factorial design at two row widths, 76 and 19 cm, in tilled and no-till soil under three irrigation levels (high, moderate, and limited). The results were consistent between production years. Both WUE and forage yield were impacted by tillage; however, irrigation level had the greatest effect on forage production. Row spacing had no effect on either WUE or forage yield. The pearl millet water use-yield production function was y = 6.68 × x (mm) − 837 kg ha−1; however, a low coefficient of determination (r2 = 0.31) suggests that factors other than water use (WU), such as a low leaf area index (LAI), had greater influence on dry matter (DM) production. Highest WUE (6.13 Mg ha−1 mm−1) was achieved in tilled soil due to greater LAI and DM production than in no-till.
1. Introduction
Crop yield loss occurs under water deficit, however, many studies have found that higher crop water use efficiency (WUE) is often achieved under water stress conditions [1], albeit, with reduced yield. It is therefore, imperative to identify crop management strategies that optimize WUE without sacrificing attainable yield under limited water availability. The ratio of crop fodder (forage) or grain biomass produced per unit water used (transpiration and losses to soil evaporation) is considered crop water use efficiency [2]. Although there are many location characteristics and environmental conditions that influence WUE (e.g., climate regime, soil type) that cannot easily be manipulated by land managers, there are various crop management schemes known to increase water availability and promote greater WUE [1,2]. It is up to researchers to identify useful combinations of practices fit for particular regions based on the best science available from around the globe.
Pearl millet is a C4 warm season grass predominately in production for grain for human consumption and forage for livestock feed throughout Africa and India and is noted for its tolerance to semiarid conditions where there is low rainfall and limited levels of soil nutrients and organic matter [3,4]. It is typically grown on rainfed (dryland) areas in systems with grain sorghum (Sorghum bicolor L.), maize (Zea mays L.), or often integrated with legume crops such as cowpea (Vigna unguiculata (L.) Walp) in Africa [4,5]. Pearl millet is also gaining recognition in the Southern Great Plains, USA, semi-arid region, as a potential forage crop to be integrated into grain sorghum-winter wheat (Triticum aestivum, L.) livestock feed cropping systems by replacing summer fallow [6,7,8]. The United Nations Food and Agriculture Organization Statistical Database (FAO) reported that worldwide millet production in 2018 was approximately 31 million metric tons, with Africa and Asia accounting for 51 and 46% of total production, respectively; the Americas make up only 1% of global millet production [9]. Pearl and other millets (e.g., foxtail (Setaria italica, (L.) P. Beauvois), proso (Panicum miliaceum, L.), and Japanese (Echinochloa esculenta, A.Braun)) are common in semi-arid regions for livestock feed because of their rich nutrient value and fit in cropping rotations with short growing seasons that have limited water supply [6,10].
Water use efficiency can be improved using soil management, crop husbandry, water management, genetic selection, and crop competition management [1]. Many of these methods to improve WUE have been reported in studies of pearl and other millet species in locations around the world over the past 25 years (Table 1). Husbandry studies have tested various planting arrangement methods and population densities in hill type sowing [11,12,13]; forage harvest intervals have also been tested [8]. Studies of irrigation technology have investigated sprinkler, surface drip, and subsurface drip methods or irrigation scheduling throughout the season [10,14]. Other researchers explored increasing water stress and nutrient management; many of those studies utilized the factorial combination of the treatments to benefit from the interaction of improved WUE with nutrient management under limited water supply [15,16,17,18,19,20]. However, throughout all these studies, the range of millet WUE is 1–92 kg ha−1 mm−1 with a mean and median of 20.6 and 13.4 kg ha−1 mm−1, respectively (Table 1). In a global meta-analysis of WUE in various crops, [2], reported many environmental factors impact WUE variability within and among crop species. For example, greater WUE was observed in tropical versus desert climates, and greater organic matter content was strongly correlated with positive WUE, whereas clay content was negatively correlated with WUE [2]. Ultimately, [2] and co-authors admonished researchers to investigate the mechanisms that might further explain WUE variability within a species.

Table 1.
Location, soil type, millet crop, experimental treatment, soil tillage management, crop row spacing, water source, crop water use (WU) and water use efficiency (WUE) of pearl and other millet species.
To our knowledge, no studies with pearl millet have investigated the combination of irrigation levels to limit water availability, plant arrangement in narrow versus wide row spacing and soil management with conventional rotary tillage versus no-till. Goals of this research were to determine the optimum levels irrigation, row spacing, and tillage to maximize WUE while maintaining stable forage production [21] in pearl millet in the semi-arid region of the Southern Great Plains, USA. The underlying hypotheses guiding the objectives were (a) WUE will increase with decreased water availability [22]; (b) no-till soil management techniques can promote more efficient WU [23]; (c) pearl millet crop canopy can be modified through row spacing to increase incidence of leaf area index and light interception [24].
2. Materials and Methods
2.1. Location and Field Preparation
This forage pearl millet study was conducted during the 2016 and 2017 growing seasons at West Texas A&M University Nance Ranch near Canyon, TX (34°58′6″ N, 101°47′16″ W; 1097 m above sea level elevation) located on Olton clay loam (fine, mixed, superactive, thermic, Aridic Paleustoll). Treatments were arranged as strip-split-plots with four replications with irrigation as main plots, row spacing as subplots, and tillage as sub-subplots.
The plot area was prepared for planting in 2016 by first a using a rotary mower to reduce native perennial grasses, which had established in an unused portion of the field, and application of Roundup© PowerMax™ (Monsanto, St. Louis, MO, USA) herbicide at 9.5 L ha on 31 May 2016. The field was further prepared in 2016 by applying 88 mm of preplant irrigation through drip tape (system described below) to increase the ease of mechanical tillage. In 2017, pearl millet was planted following winter wheat sown in October 2016 terminated in March using Roundup© PowerMax™ herbicide at the same 2016 application rate. In both years, tilled plots were cultivated 20 cm depth using a CountyLine rotary tiller (King Kutter, Inc., Winfield, AL 35594, USA) the day of planting. ‘Graze King’ BMR pearl millet (176,405 seeds kg−1, 85% germination, 98% purity) was planted on 17 June 2016. Seed used in 2017 was procured from Winfield United (Shoreview, MN 55126, USA) (116,280 seeds kg−1, 85% germination, 98% purity). Sowing utilized a Great Plains 3P500 grain drill (Great Plains Mfg., Inc., Salina, KS, USA). The 3.05 × 6.1 m plots were seeded at 125 seeds m−2 and 95 seeds m−2 in 2016 and 2017, respectively. Plot width being 3.05 m, we accommodated 16 rows and 4 rows in 19 and 76 cm row spacing treatments, respectively. Different seeding rates were the result of different seed sizes and planter limitation to accommodate the small seed size at the same rate for both years.
2.2. Irrigation Management
Irrigation was administered with a metered surface drip line system with two lines 152 cm apart in each plot with emitters spaced 61 cm, each applying 7.5 L hour−1 emitter−1. In-line control valves were used to regulate water flow to the irrigation treatment levels so that when irrigation was applied to high (H) only, flow was restricted to moderate (M) and limited (L). However, when L was irrigated, the other levels were irrigated as well, and when M was irrigated, H also received water (Figure 1).
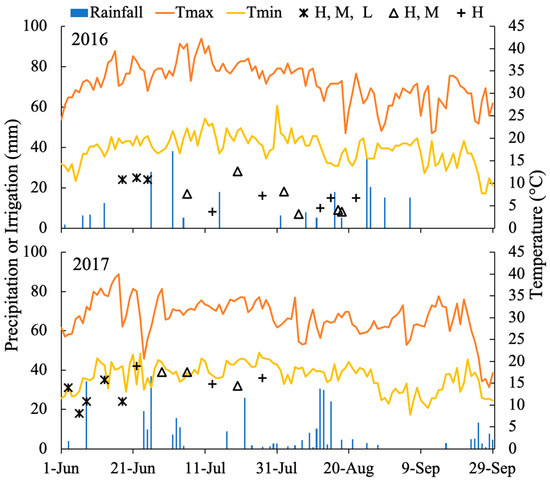
Figure 1.
Precipitation, irrigation by water level, and maximum and minimum daily temperature from 1 June to 30 September for 2016 and 2017 near Canyon, TX. Tmax, maximum daily temperature; Tmin, minimum daily temperature; H, high, M, moderate, L, limited irrigation levels.
Irrigation management was preplanned to simulate grower conditions where a specific amount of irrigation allowable by aquifer pumping would be provided during the season. Approximately 225 mm was selected as the upper quantity for H. The M and L levels were to be approximately 60 and 30% of the high level, respectively. Weekly applications of 25 mm were planned for H, biweekly in M, and only early season irrigation in L. Ultimately, irrigation management decisions were influenced by growing season climatic conditions, therefore, irrigation events took place when necessary.
Crop WU was defined as the sum of growing season precipitation, irrigation, and plant available soil water (PAW) at planting, minus PAW remaining at harvest. Water lost to runoff or drainage was not measured. Water use efficiency is DM divided by total WU.
2.3. Soil Moisture
Soil cores used to calculate average soil volumetric water content at planting were obtained by sampling four random locations throughout the plot area using a tractor mount Giddings hydraulic press (Giddings Machine Company, Inc., Windsor, CO, USA). Soil samples were taken the day prior to planting to a depth of 60 cm in 2016 and to a depth of 75 cm in 2017. Each core sample was divided into three incremental depths: 0–15, 15–30, 30–60 cm in 2016 and 0–15, 15–45, 45–75 cm in 2017. The soil cores were weighed, and oven dried at 104 °C for 72 h until a constant dry weight was attained. Soil volumetric water content at harvest in both years was determined using one core sample from each plot divided into segments of 0–15, 15–45, 45–75 cm.
Soil characteristics and properties utilized data obtained from the United States Department of Agriculture Natural Resources Conservation Service Web Soil Survey [28] (Table 2). Plant available soil water (PAW) was calculated by subtracting volumetric water content at permanent wilting point (−1500 kPa) from volumetric water content at −33 kPa and multiplied by the soil depth.
Table 2.
Soil moisture characteristics for Olton clay loam a.
2.4. Weather Data
Precipitation during the 2016 growing season was collected with a graduated plastic rain gauge at the study site and cross referenced with National Weather Service in Amarillo, TX (approximately 32 km from the study location). Temperature values were taken from the National Weather Service in Amarillo. Weather data for 2017 was collected on site utilizing a Campbell Scientific (Logan, UT, USA) weather station approximately 100 m from the plot location. The American Society of Civil Engineers reference evapotranspiration (ETo) for a well-watered grass crop was calculated using the REF-ET [29] macro software for Microsoft Excel (Microsoft Corp., Redmond, WA, USA). Growing degree-days (GDD) were calculated using Equation (1):
where crop maximum is 35 °C and base temperature is 10 °C [30]. Growing degree-days were calculated for the time period between planting date and harvest.
2.5. Crop Growth and Forage Yield Measurements
Plant emergence and density were observed and counted at 308 GDD (19 days after planting; DAP) and 255 GDD (18 DAP) in 2016 and 2017, respectively. Crop canopy height was determined using a 0.25 m2 circular clear plastic disk and the method described by [31] and used by [32]. Harvest DM was the mean of two 1 m2 quadrats from each plot, arranged in the 76 cm row spacing to include two rows, and cut at 15 cm above the soil surface [33].
Photosynthetically active solar radiation (PAR) intercepted by the crop canopy was measured every 7 to 12 d beginning 7 July 2016 and 19 June 2017 using the AccuPAR Linear PAR ceptometer, model 80 light measuring instrument (Decagon Devices, Pullman, WA, USA). Light interception measurements were collected by placing the instrument diagonally across three 19 cm spaced rows and perpendicular across two 76 cm spaced rows. Percent light intercepted by the canopy was determined by calculating the difference of one above (incident) measurement from the mean of two below canopy measurements, divided by the above measurement.
Leaf area index (LAI) was measured and calculated utilizing the LAI-2200 Plant Canopy Analyzer (Li-Cor, Inc., Lincoln, NE, USA). Measurements were obtained for row crops of narrow and wide row spacing per the Li-Cor instruction manual to calculate a mean from two sequences of one above canopy and four below canopy readings. Measurements were obtained at sunrise or sunset every 10 to 14 d beginning 12 July 2016 and 19 June 2017.
2.6. Statistical Design and Analysis
Year, irrigation, row spacing, and tillage were treated as fixed effects. Analysis of variance of main effects utilized Proc MIXED and GLM of the Statistical Analysis System, Version 9.4 (SAS Institute, Cary, NC, USA). Linear regression and analysis of covariance utilized Proc REG and Proc GLM with contrast statements to determine differences among slopes and intercepts of the regression equations [26]. Significance was determined at p < 0.05 for all means separation tests and used the P diff statement with Tukey’s adjustment for all main effects.
Interactions for all main effects were initially tested. When no interactions were detected, only main effect results are presented. Years were analyzed and are presented separately for analysis of variance as a consequence of management differences between the seasons: planting in 2016 was into native perennial grass, into wheat stubble in 2017; different seed used in each year. Years were combined for regression analysis after observing similar trends for both years.
3. Results
3.1. Weather, Irrigation, and Soil Moisture
3.1.1. Seasonal Weather
Total growing season precipitation was 217 and 309 mm in 2016 and 2017, respectively (Figure 1; growing seasons: 17 June to 30 September 2016; 1 June to 30 August 2017). The 30-year precipitation average for the Amarillo, TX area for June through September is 275 mm. Precipitation received was 89% and 137% of normal for the respective years (Table 3). Higher temperatures in July 2016 resulted in 10% greater cumulative degree days than in July 2017. Lower temperatures and greater precipitation in August 2017 generated 13% lower GDD accumulation for that month compared to 2016 (Table 3). The local 30-year average GDD accumulation for a 90-d pearl millet growing season is 1676 GDD for a 1 June planting date (Table 3).
Table 3.
Average maximum daily temperature, total precipitation, and estimated cumulative thermal time by month for 2016 and 2017 growing seasons near Canyon, TX from planting to harvest. a
3.1.2. Irrigation
Total irrigation applied in 2016 for each irrigation level was 220, 157, and 72 mm for the H, M, and L levels, respectively (Table 4). In 2017, 356, 242, and 132 mm were applied to the H, M, and L irrigation treatments, respectively (Table 4). The L level received three irrigation events in 2016, and five events in 2017; greater water was applied in 2017 early in the season due lower soil moisture at planting and to prevent soil surface crusting. The M level received nine events in 2016 and eight events in 2017. The H level received 14 events in 2016 and 11 events during the 2017 season. As a result of more frequent rainfall during the second half of July and in August of 2017, there were fewer irrigation events needed than in 2016.
Table 4.
Millimeters of irrigation applied to pearl millet by month for the 2016 and 2017 growing seasons a near Canyon, TX.
Applied irrigation accounted for approximately 24–53% of seasonal total water (irrigation and precipitation) for the crop at the respective irrigation levels over both growing seasons (Table 5). During the growing seasons, irrigation accounted for an average range of 50–53%, 41–43%, and 24–29% of the total water received by the crop (excluding stored soil moisture) in H, M, and L levels, respectively (Table 5). The total water is compared to ET [29] to evaluate the efficacy of irrigation management to meet climatic demand on the crop (Table 5). The ETo climatic demand was estimated at 772 and 902 mm in 2016 and 2017, respectively. The range of satisfied climatic demand across water regimes was 48–73% in 2017 vs. 37–56% in 2016 (Table 5). Although 2017 had fewer irrigation events for H and M levels, additional rainfall in 2017 was available to meet the climatic demand.
Table 5.
Precipitation and irrigation by month and irrigation level for 2016 and 2017 near Canyon, TX. Percent of total water as irrigation and total as water percent of ETo are also included.
The authors of [14] reported applying an average 353 and 350 mm in two study years on pearl millet and grain sorghum (Sorghum bicolor L.), respectively, in Nebraska where annual precipitation was 285 and 480 mm in the study two locations. In studies of rainfed millet production, [27] at Bushland, TX reported pearl millet forage WU range was 236 to 289 mm (precipitation and PAW from the soil). In a study testing the response of sorghum, maize, and pearl millet to four irrigation levels in India, [22], reported total WU ranged from 242 to 568 mm during the field study. In Akron, CO, during the five-year study of opportunity cropping systems [34], millet growing season precipitation ranged from 57 to 298 mm, similar to other semiarid locations.
3.1.3. Soil Moisture
Plant available water at planting was 3.35 cm for the 60 cm profile in 2016 and was 1.9 cm for the 75 cm profile in 2017. Mean PAW (soil depth 75 cm) at harvest across all treatments in 2016 (0.63 cm) was 20% of mean PAW in 2017 (3.09 cm). Harvest PAW in 2016 was influenced by irrigation, there was no influence of row spacing or tillage treatments, averaging 0.64 cm. High and M irrigation levels averaged 0.86 cm, which was different from L at 0.19 cm of PAW. Differences in PAW were found in 2017 among irrigation levels and in an irrigation × tillage interaction. Plant available water was highest in M (3.52 cm) and lowest in L (2.49 cm), a difference of 41%; H (3.1 cm) was not different from the M and L levels. The interaction resulted from L irrigation × no-till, 1.8 cm PAW, being 47% lower than the average of all other treatments (3.42 cm; SE = 0.42 cm), ranging from 2.7 to 3.8 cm. The primary reason harvest PAW in 2016 was 80% less than 2017 is the additional 31 d of growing season in 2016 and the rainfall prior to harvest in 2017 (Figure 1).
3.2. Treatment Effects: Irrigation, Row Spacing and Tillage
3.2.1. Plant Growth and Forage Dry Matter
Average pearl millet plant population was 14.6 and 30.9 plants m−2 in 2016 and 2017, respectively, a difference of 52%. A year x till interaction was observed, most likely due to low plant population in no-till in 2016 compared to no-till in 2017 (7.9 vs. 45.8 plants m−2, respectively). Additionally, in 2016, average population in no-till was 67% less than till (7.9 vs. 21.2 plants m−2, respectively). However, in 2017, average till plant population was 65% less than no-till (16.1 vs. 45.7 plants m−2). The no-till planting in 2016 was into herbicide killed native perennial grasses which prevented adequate seed to soil contact for proper germination. In 2017, an afternoon rainstorm following a morning irrigation event three days after sowing caused runoff that was observed in the till treatment. In contrast, no-till in 2017 was protected by the winter wheat stubble remaining on the soil surface after planting.
Forage DM was influenced by year, irrigation level, and tillage (p < 0.05) as main effects in both years; row spacing had no effect on forage production (Table 6). Average pearl millet DM in 2016 was approximately 38% less than in 2017 (1712 and 2759 kg DM ha−1, respectively). Average WU was 523 and 395 mm in 2017 and 2016, respectively. Average WUE was 5.28 and 4.26 kg ha−1 mm−1 in 2017 and 2016, respectively (Figure 2). Forage DM in H irrigation was 46% greater than L, ranging from 1219 to 2213 kg ha−1 in 2016. The H level was 54% greater than L in 2017, which ranged from 2213 to 3450 kg ha−1 (Figure 2). Dry matter in M was not different from H in either year but was different from L (p < 0.05; Figure 2). Water use in H was 15% greater than M and 43% greater than L in 2016. In 2017, H received 59% more water than L and 21% more than M (Figure 2). Water use efficiency was not different among irrigation levels ranging from 3.78 to 4.79 kg ha−1 mm−1. In contrast, a C3 bioenergy crop, hybrid poplar (Populus generosa Henry × P. nigra L.), achieved differing WUE values of 5.6 and 8.9 kg ha−1 mm−1 grown under 115 mm and 240 mm of applied irrigation, respectively [35]. Row spacing did not influence pearl millet forage DM, WU, or WUE in 2016 or 2017 (Figure 2, Table 6).
Table 6.
The p-values from ANOVA of pearl millet dry matter (DM), water use (WU), and water use efficiency (WUE).
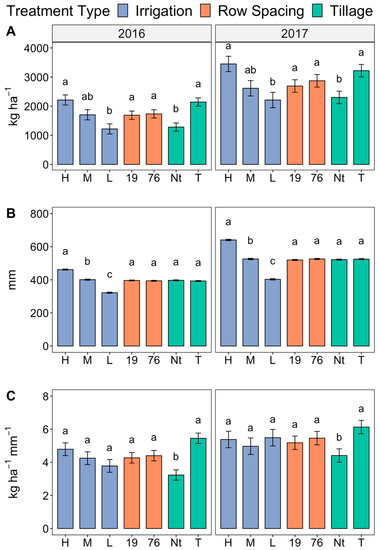
Figure 2.
(A) pearl millet dry matter; (B) water use = (rainfall + irrigation + plant available soil moisture at planting)–plant available soil moisture at harvest; (C) water use efficiency = dry matter/water use. Lowercase letters indicate significance at p < 0.05 within treatment and year; bars indicate standard error within treatment. H, high irrigation level, M, moderate irrigation level, L, limited irrigation level; 19 cm and 76 cm row spacing; N-t, no-till, T, tilled.
Pearl millet DM and WUE in the tilled plots were greater than in no-till in both years, although, WU was not affected by tillage management in either year (Figure 2). Forage DM in till was 66 and 39% greater than no-till, in 2016 and 2017, respectively. Pearl millet WUE in tilled soil was 68% greater than no-till in 2016 and 39% greater in 2017 (Figure 2).
Forage DM in 2016 till was greater as a consequence of the low plant population in no-till due to poor seed to soil contact. The low forage yields in 2017 are attributed to N deficiency observed in the no-till plants. This deficiency in no-till may be a result of higher plant population, compared to the till treatment, leading to the deficiency observed mid-season and no deficiency observed in the till plants.
Crop canopy height in 2016 was not influenced by irrigation, row spacing, or tillage; the end of season canopy height was 50 cm. For the 2017 season, canopy height was affected by irrigation over time. Height at harvest was 72, 67, and 59 cm for H, M, and L, respectively. In addition, there was an irrigation × tillage interaction in 2017, where L × no-till was 38 cm and H × till was 49 cm at harvest. No difference for crop canopy height was measured in the tillage treatment for either year.
3.2.2. Light Interception and Leaf Area Index
Crop LAI during the 2016 season was impacted by irrigation, which reached a maximum of 2.47 at 1262 GDD (Figure 3). In 2017, LAI was similarly affected by irrigation and reached a maximum of 3.07 at 1203 GDD (Figure 3). Incidence of crop canopy light interception responded to changes in irrigation through time in 2016 only, reaching 74.6% interception at 967 GDD (Figure 3).
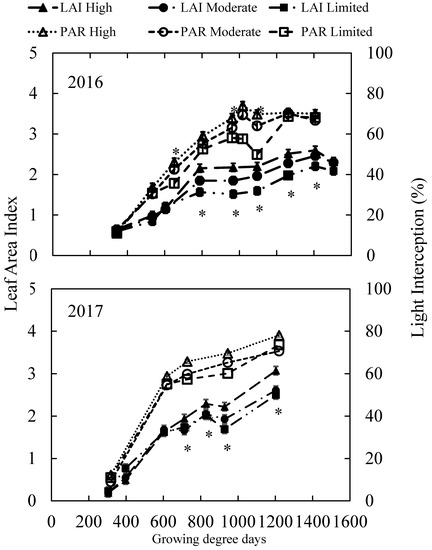
Figure 3.
Leaf area index (LAI) and percent light interception (PAR) for irrigation levels in 2016 and 2017 in pearl millet at Canyon, TX. Asterisks indicate treatment p < 0.05 on measurement date.
Light interception was influenced by row spacing though the 2016 season, which reached 74% in 19 cm and 65% in 76 cm at 1262 GDD (Figure 4). During 2017, LAI reached 2.87 in 19 cm and 2.59 in 76 cm at 1203 GDD (Figure 4). In both years, light interception and LAI were lower in wide row spacing. However, other work with pearl millet and row spacing has shown that in years where rainfall was less than the local average, wide row spacing outperformed narrow rows [36]. Weeds were not controlled either year of this field study and in 2016 rainfall was 11% less than the 30 year normal (Table 3), yet, row spacing had no effect on pearl millet DM.
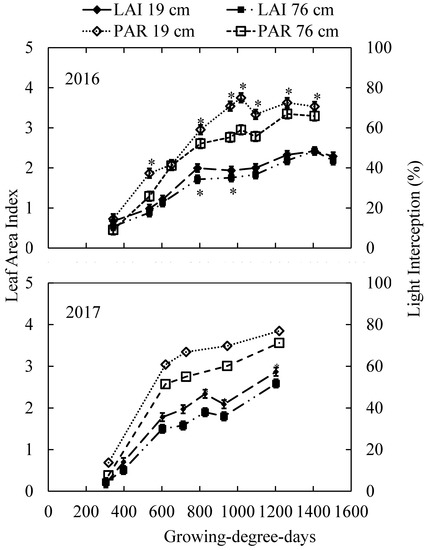
Figure 4.
Leaf area index (LAI) and percent light interception (PAR) for row spacing in 2016 and 2017 in pearl millet at Canyon, TX. Asterisk indicate treatment p < 0.05 on measurement date.
During 2016, no differences for LAI nor light interception were observed between tillage treatments (Figure 5). Through 2017, mid-season LAI was different for the tillage treatments but there was no difference by harvest time, reaching a maximum value of 2.8 and 2.6 in till and no-till, respectively (Figure 5). Light interception was greater in no-till through the 2017 season, reaching 77 vs. 70% in till at end of season (Figure 5). For the 2017 season, light interception interactions were found for irrigation × tillage and row spacing × tillage. In the till treatment, there was an increasing trend following increasing irrigation and narrow row spacing, however, that trend was interrupted in the no-till where M had 6% less light interception than L, and 76 cm row spacing had 20% less than 19 cm.
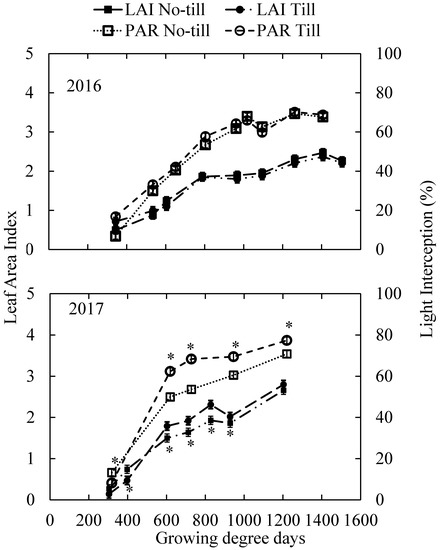
Figure 5.
Leaf area index (LAI) and percent light interception (PAR) for tillage levels in 2016 and 2017 in pearl millet at Canyon, TX. Asterisk indicate treatment p < 0.05 on measurement date.
4. Discussion
4.1. Explaining Water Use Efficiency
4.1.1. Water Use Efficiency and Soil Nutrient Supply
Although nutrient management was not a treatment in this study, field observations of possible nutrient deficiencies prompted investigation to the relationship between WUE and nutrient management. Proper soil nutrient supply improves plant growth, photosynthetic rate, transpiration, root growth and ultimately yield, all result in increased WUE [23]. For example, pearl millet, being tested under four levels of increasing N and irrigation supply, achieved 41 kg ha−1 mm−1 WUE in the most water stressed treatment with the highest level of N application, 225 kg N ha−1 [20]. The authors of [37] also illustrated the effect that irrigation and N application can have on WUE in an experiment with irrigated and rainfed wheat when “adequate” N was applied with irrigation, mean WUE was 78% greater and grain production was 16% greater in irrigated than in rainfed wheat without N application. The 2016 and 2017 of this pearl millet study, DM was influenced by observed nutrient deficiency, especially in the no-till treatment of 2017. The authors of [8] conducted an experiment with forage pearl millet at the same time just adjacent to the plot where this forage pearl millet experiment took place. Agronomic management similar to the H irrigation, 19 cm row spacing, and tilled treatment was similar in both studies except that in [8] N was applied in both study years at rates of 84 kg ha−1 and 78 kg ha−1 in 2016 and 2017, respectively. Pearl millet DM reported by [8] used approximately 514 and 602 mm of water in 2016 and 2017, respectively, which produced 6287 and 9874 kg ha−1, with WUE of 12.2 and 16.4 kg ha−1 mm−1 in those years, respectively. The DM yields from [8] were approximately three times greater than the mean across all treatments of this study in 2016 and 2017 having used a maximum of 462 and 641 mm in those years without N application. The lack of N, demonstrated by comparison to [8], lead to lack of nutrients reduced plant productivity and negatively impacted WUE [38].
4.1.2. Weed Influence on Pearl Millet Water Use Efficiency
Native grass/weed DM may have impacted pearl millet WUE due to no weed control in either year of this study. In 2016 grass/weed DM was not influenced by row spacing, however grass/weed DM was different among irrigation and tillage levels (Table 7). In 2017, only row spacing influenced grass/weed DM. The authors of [39] demonstrated in forage sorghum, when weeds are present, there was no difference in DM yields among wide (76 cm) or narrow (25 cm) row spacing. Although weed control was not a treatment in this study, regression analysis showed that grass/weed DM did influence pearl millet WUE across treatments and years (Figure 6). As weed proliferation was not checked by high leaf area index and resulting light interception correlated with crop competitive ability [40], weed/grass DM accumulated, thus reducing pearl millet WUE.
Table 7.
Grass/weed dry matter (DM) at pearl millet harvest by treatment near Canyon, TX in 2016 and 2017.
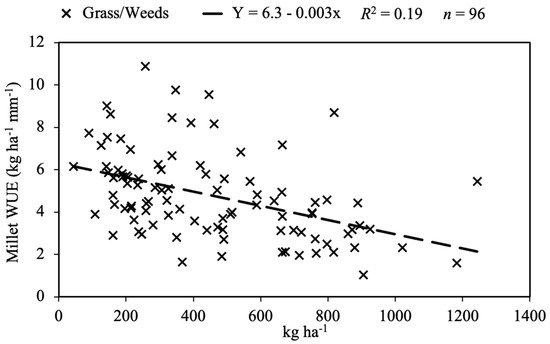
Figure 6.
Pearl millet water use efficiency (WUE) as a function of grass/weed dry matter (DM) across treatments and years.
4.1.3. Water Use Efficiency Response to Agronomics
Pearl millet WUE reported in the literature has been consistent yet wide ranging. During a five-year rotation study by [27], mean pearl millet production from two seasons was 3670 kg ha−1. Although weather conditions were not considerably different between the two years, [27] reported WUE of 31 kg ha−1 mm−1 in 1995 and 4.5 kg ha−1 mm−1 1996, most likely due to one month earlier planting date in 1995, allowing the crop to better utilize soil water prior to harvest. The authors of [13] found the WUE of pearl millet, in a study of various cultivars and plant populations in Niger, ranged from 7.6 to 8.7 kg ha−1 mm−1. In Tunisia, [41] reported a pearl millet WUE range of 6.4 to 7.6 kg ha−1 mm−1 among four water stress treatments. The authors of [22] reported pearl millet DM values of 4000 to 8300 kg ha−1 and WUE from 13.8 to 17.9 kg ha−1 mm−1, respectively, in India. Whereas, in Akron, CO, among forage and grain, foxtail and proso millet cropping systems described by [33], DM production ranged from 562 to 4545 kg ha−1 with WUE ranging from 4.8 to 27.5 kg ha−1 mm−1 during the five-year study. Additionally, [20] also reported high WUE ranging between 35.7 and 41 kg ha−1 mm−1 under four levels of irrigation. Grain sorghum WUE has been reported between 11 to 49.2 kg ha−1 mm−1 among locations throughout the Central and Southern Great Plains U.S. [42,43].
In the studies of pearl millet and sorghum cited above, minimum or no-till was used by [27] and [43], however, tillage information was absent from the other studies. In this study, a WUE response to agronomic management was only observed from tillage practices (Figure 2), whereas WUE was not impacted in the same way in this study by the increasing DM and WU from irrigation treatments as previously observed in other studies [20,22,41]. In a review of soil management effects on WUE, [23] reported that in no-till, where plant residue is maintained on the soil surface, higher WUE is typically found due to reduced evaporative water loss (E) from soil, lower soil surface temperatures, and improved water infiltration. The authors of [23] analyzed nineteen studies of crop and soil management practices and synthesized their results into a graphical depiction of crop WUE responses to soil management and seasonal effects. They demonstrated that crop biomass and yield increased or decreased due to changes in soil management. In this study, pearl millet DM response to soil tillage reflects differences in biomass due to soil management changes as described by [23] (Figure 7). However, when, soil surface E is roughly approximated at the x-intercept of the DM/WU regression line (Figure 7) [38,44], the two-season average estimated E from tilled and no-till soil was approximately 114 and 131 mm, respectively. While these estimates are similar, the result is contrary to reports of less E from no-till soil [23]. Additionally, WU was not different between tillage or row spacing treatments in either year. Furthermore, the spread of DM responses observed, lack-of-fit to the DM/WU predicted line, and no differences in DM or WU detected between row space levels and WU between tillage levels indicates that WU was insensitive to changes in the management practices other than when water was added by irrigation (Figure 2, Figure 7 and Figure 8). The authors of [24] reported that pearl millet yield is largely independent of WU when LAI is low, as was observed in both seasons of this pear millet forage study, due to the majority of light being intercepted by the soil surface allowing water loss to E in the sparse canopied crop with LAI values < 2 [44]. In 2016, LAI was not different between the tillage levels, however, in 2017, LAI in the tilled treatment reached approximately 2 nearly 100 GDDs before no-till reached a LAI of approximately 2. As mentioned above, the N deficiency observed predominately in no-till explains slower growth, lower DM and WEU for both years even though till had lower early season plant count than in no-till during 2017. Thus, higher WUE in tilled soil was achieved as a result of earlier canopy development, more light interception and greater DM production.
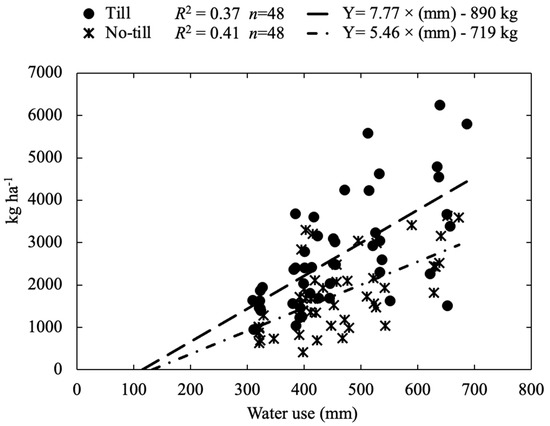
Figure 7.
Pearl millet forage dry matter (DM)/water use (WU) relationship with tillage levels indicating management impact on DM production for 2016 and 2017 at Canyon, TX.
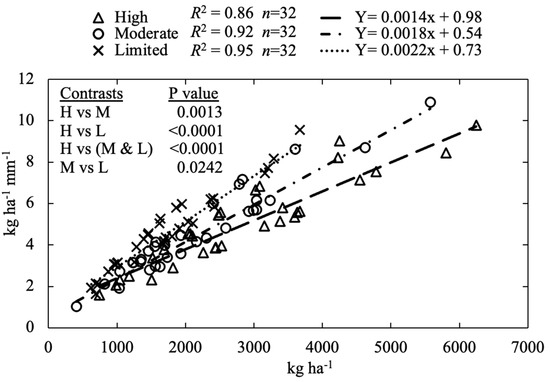
Figure 8.
Direct relationship between water use efficiency (WUE) and pearl millet dry matter (DM). Slopes show trends of increasing WUE as DM increases for each irrigation level.
The proceeding discussion explaining WUE differences in the tilled treatment also helps explain the absence of main effect interactions and lack of WUE response to decreasing irrigation. Poor soil nutrient supply and high weed competition reduced pearl millet crop growth thereby obscuring any possible interactions among the main effects and responses typically reported from no-till or water stress studies. The authors of [20,22,41] found that pearl millet WUE increased as water stress also increased, which was not observed in this study. However, the relationship between WUE and DM [26,37,38] affords direct comparison of WUE at each irrigation level (Figure 8). Statistical contrast analysis of the slopes and intercepts for the respective irrigation levels [26] show that L had greater positive gain in WUE than was achieved in the H or M. This analysis suggests that WUE at the L level had a higher rate of return for accumulated DM than the other water levels. The authors of [22] demonstrated that in water stressed pearl millet WUE increased 23% from well-watered conditions. Analysis of their results demonstrates that pearl millet maintains physiological functions even when constrained by water stress. For example, the ratio of net photosynthesis (g CO2 m−2 h−1) to WU (mm) was greater in the limited water treatment than in the full water treatment (0.029, 0.002, respectively) [22]. This result can be explained by the biochemical pathway in warm season C4 plants used to continue photosynthesis when vapor pressure deficit is high in low density canopies [45,46]. Furthermore, [44] explained that increased WUE this is the result of a greater proportional increase in WUE for low LAI values than when LAI is >2. Thus, the direct relationship between WUE and DM illustrates an ecophysiological response from pearl millet interacting with the crop environment.
Although irrigation applied lead to increased DM, WU did not well predict the behavior of pearl millet forage production across both years and all treatments. The production function y = 6.68 × x (mm) − 837 kg ha−1 (R2 = 0.31, n = 96) cannot be readily utilized in other production situations that might have better weed and sol nutrient management. In contrast, for most DM/WU linear regressions, the coefficient of determination is much higher (>0.7) [33,42] and more confidence is given to estimating crop yield from WU given a set of WUE optimizing management strategies.
5. Conclusions
These results demonstrate the challenges of field study management to optimize WUE. Future research in the study region might explore agroecological strategies to mitigate poor soil nutrient supply and weed competition for pearl millet by practicing intercropping with legumes or agroforestry where possible [24]. Despite the factors that obscured the main effects and interactions, greatest average forage production was achieved with the highest irrigation level, however, highest WUE was attained in tilled soil due to greater LAI, light interception, and plant growth than in no-till. While the application of water increases forage production, low LAI values will increase estimated E and reduce WUE, especially without adequate nutrient application. Differences in DM were associated with changes in soil management, which ultimately resulted in higher WUE for tilled soil. The DM/WU pearl millet forage production function lacked strong correlation because of weeds and LAI < 2. An agronomic WUE optimization plan for pearl millet forage production should include conventional till, weed control, and proper nutrient management. Narrow is preferable to wide row spacing for greater LAI and light interception earlier in the growing season. If irrigation is available, water application should range from 400–600 mm of total water available for ET to maximize forage production, however, climatic demand will cause greater water loss from transpiration than if limited water is applied. Future research has an opportunity to conduct a more comprehensive review and meta-analysis of global pearl millet management practices used to improve water use efficiency and the effective use of water [47].
Author Contributions
Conceptualization, B.C., B.B., M.R.; Methodology, B.C., B.B., and M.R.; Formal analysis, B.C., M.D., and M.R.; Funding acquisition, B.B.; Investigation, B.C., and B.B.; Project administration, B.C., and B.B.; Resources, B.B.; Supervision, B.B., M.D., and M.R.; Validation, B.B., M.D., and M.R.; Visualization, B.C.; Writing—original draft, B.C.; Writing—review and editing, B.C., B.B., M.D., and M.R. All authors have read and agreed to the published version of the manuscript.
Funding
This research received no external funding.
Acknowledgments
Research funding was provided by the Dryland Agriculture Institute, West Texas A&M University, Canyon, TX, USA. The authors also wish to express their gratitude for the time and efforts of two anonymous reviewers whose thoughts contributed to the improvement of the manuscript.
Conflicts of Interest
The authors declare no conflict of interest.
References
- Farooq, M.; Hauuain, M.; Ul-Allah, S.; Siddique, K.H.M. Physiological and Agronomic Approaches for Improving Water-Use Efficiency in Crop Plants. Agric. Water Manag. 2019, 219, 95–108. [Google Scholar] [CrossRef]
- Mbava, N.; Mutema, M.; Zengeni, R.; Shimelis, H.; Chaplot, V. Factors Affecting Crop Water Use Efficiency: A Worldwide Meta-Analysis. Agric. Water Manag. 2020, 228. [Google Scholar] [CrossRef]
- Andrews, D.L.; Kumar, K.A. Pearl millet for food, feed, and forage. In Advances in Agronomy; Sparks, D.L., Ed.; Academic Press, Inc.: Cambridge, MA, USA, 1992; Volume 48, pp. 89–139. [Google Scholar]
- Mason, S.C.; Maman, N.; Pale, S. Pearl Millet Production Practices in Semi-Arid West Africa: A Review. Exp. Agric. 2015, 15, 501–541. [Google Scholar] [CrossRef]
- Samake, O.; Stomph, T.J.; Kropff, M.J. Integrated Pearl Millet Management in the Sahel: Effects of Legume Rotation and Follow Management on Productivity and Striga hermonthica infestation. Plant Soil 2006, 286, 245–257. [Google Scholar] [CrossRef]
- Baumhardt, R.L.; Salinas-Garcia, J. Dryland agriculture in Mexico and the U.S. Southern Great Plains. In Dryland Agriculture, 2nd ed.; Agronomy Monograph No. 23; American Society of Agronomy, Crop Science Society of America, Soil Science Society of America: Madison, WI, USA, 2006. [Google Scholar]
- Bhattarai, B.; Singh, S.; West, C.P.; Saini, R. Forage Potential of Pearl Millet and Forage Sorghum Alternatives to Corn under the Water-Limiting Conditions of the Texas High Plains: A Review. Crop Forage Turfgrass Manag. 2019, 5, 1–12. [Google Scholar] [CrossRef]
- Machicek, J.A.; Blaser, B.C.; Darapuneni, M.; Rhoades, M.B. Harvesting regimes affect brown midrib sorghum-sudangrass and brown midrib pearl millet forage production and quality. Agronomy 2019, 9, 416. [Google Scholar] [CrossRef]
- FAO. Production Quantities of Millet by Country. FAOSTAT, Crops. 2020. Available online: http://www.fao.org/faostat/en/#data/QC/visualize (accessed on 22 October 2020).
- Ismail, S.M. Optimizing Productivity and Irrigation Water Use Efficiency of Pearl Millet as a Forage Crop in Arid Regions Under Different Irrigation Methods and Stress. Afr. J. Agric. Res. 2012, 7, 2509–2518. [Google Scholar] [CrossRef]
- Sharma, B.; Kumari, R.; Kumari, P.; Meena, S.K.; Singh, R.M. Effect of Planting Pattern of Productivity and Water Use Efficiency of Pearl Millet in the Indian Semi-Arid Region. J. Indian Soc. Soil Sci. 2015, 6, 259–265. [Google Scholar] [CrossRef]
- Silungwe, F.R.; Graef, F.; Bellingrath-Kimura, S.D.; Tumbo, S.D.; Kahimba, F.C.; Lana, M.A. The Management Strategies of Pearl Millet Farmers to Cope with Seasonal Rainfall Variability in a Semi-Arid Agroclimate. Agronomy 2019, 9, 400. [Google Scholar] [CrossRef]
- Payne, W.A. Managing yield and water use of pearl millet in the Sahel. Agron. J. 1997, 89, 481–490. [Google Scholar] [CrossRef]
- Maman, N.; Lyon, D.J.; Mason, S.C.; Galusha, T.D.; Higgins, R. Pearl millet and grain sorghum yield responses to water supply in Nebraska. Agron. J. 2003, 95, 1618–1624. [Google Scholar] [CrossRef]
- Bhattarai, B.; Singh, S.; West, C.P.; Ritchie, G.L.; Trostle, C.L. Water Depletion Pattern and Water Use Efficiency of Forage Sorghum, Pearl Millet, and Corn Under Water Limiting Conditions. Agric. Water Manag. 2020, 238, 106206. [Google Scholar] [CrossRef]
- Jahansouz, M.R.; Afshar, R.K.; Heidari, H.; Hashemi, M. Evaluation of Yield and Quality of Sorghum and Millet as Alternative Forage Crops to Corn under Normal and Deficit Irrigation Regimes. Jordan J. Agric. Sci. 2014, 10, 699–715. Available online: https://platform.almanhal.com/Files/2/94696 (accessed on 20 October 2020).
- Ibrahim, A.; Abaidoo, R.C.; Fatandji, D.; Opoku, A. Hill Placement of Manure and Fertilizer Micro-Dosing Improves Yield and Water Use Efficiency in the Sahelian Low Input Millet-Based Cropping System. Field Crops Res. 2015, 180, 29–36. [Google Scholar] [CrossRef]
- Manyame, C. On-Farm Yield and Water Use Response of Pearl Millet to Different Management Practices in Niger. Ph.D. Thesis, Texas A&M University, College Station, TX, USA, 2006. Available online: https://core.ac.uk/download/pdf/147132537.pdf (accessed on 20 October 2020).
- Neal, J.S.; Fulkerson, W.J.; Hacker, R.B. Differences in Water Use Efficiency among Annual Forages Used by the Dairy Industry Under Optimum and Deficit Irrigation. Agric. Water Manag. 2011, 98, 759–774. [Google Scholar] [CrossRef]
- Rostamza, M.; Chaichi, M.; Jahansouz, M.; Alimadadi, A. Forage Quality, Water Use and Nitrigen Utilization Efficiencies of Pearl Millet (Pennisetum americanum L.) Grown Under Different Soil Moisture and Nitrogen Levels. Agric. Water Manag. 2011, 98, 1607–1614. [Google Scholar] [CrossRef]
- Geerts, S.; Raes, D. Deficit Irrigation as an on-farm Strategy to Maximize Crop Water Productivity in Dry Areas. Agric. Water Manag. 2009, 96, 1275–1284. [Google Scholar] [CrossRef]
- Singh, B.R.; Singh, D.P. Agronomic and physiological responses of sorghum, maize, pearl millet, to irrigation. Field Crops Res. 1995, 42, 57–67. [Google Scholar] [CrossRef]
- Hatfield, J.L.; Sauer, T.J.; Prueger, J.H. Managing Soils to Achieve Greater Water Use Efficiency: A review. Agron. J. 2001, 93, 271–280. [Google Scholar] [CrossRef]
- Payne, W.A. Optimizing crop water use in sparse stands of pearl millet. Agron. J. 2000, 92, 808–814. [Google Scholar] [CrossRef]
- Zhang, Z.; Whish, J.P.M.; Bell, L.W.; Nan, Z. Forage Production, Quality and Water-Use-Efficiency of Four Warm-Season Annual Crops at Three Sowing Times in the Loess Plateau Region of China. Eur. J. Agron. 2017, 84, 84–94. [Google Scholar] [CrossRef]
- Nielsen, D.C.; Vigil, M.F.; Benjamin, J.G. Forage response to water use for dryland corn, millet, and triticale in the Central Great Plains. Agron. J. 2006, 98, 992–998. [Google Scholar] [CrossRef]
- Unger, P.W. Alternative and opportunity dryland crops and related soil conditions in the Southern Great Plains. Agron. J. 2001, 93, 216–226. [Google Scholar] [CrossRef]
- Web Soil Survey. 2019. Available online: https://websoilsurvey.sc.egov.usda.gov/App/HomePage.htm.
- Allen, R.G. REF-ET, Reference Evapotranspiration Calculator, Version 4.1; Research and Extension Center, University of Idaho: Kimberly, ID, USA, 2016. [Google Scholar]
- Ritchie, J.T.; Alagarswamy, G. Simulation of sorghum and pearl millet phenology. In Modeling the Growth and Development of Sorghum and Pearl Millet; Virmani, S.M., Tandon, H.L.S., Alagarswamy, G., Eds.; Research Bulletin No. 12; ICRISAT: Patancheru, Andhra Pradesh, India, 1989. [Google Scholar]
- Olsen, J.E.; Hansen, P.K.; Berntsen, J.; Christensen, S. Simulation of above-ground suppression of competing species and competition tolerance in winter wheat varieties. Field Crops Res. 2004, 89, 263–280. [Google Scholar] [CrossRef]
- Blaser, B.C.; Singer, J.W.; Gibson, L.R. Winter cereal canopy effect on cereal and interseeded legume productivity. Agron. J. 2011, 103, 1080–1185. [Google Scholar] [CrossRef]
- Stephenson, R.J.; Posler, G.L. Forage yield and regrowth of pearl millet. Trans. Kans. Acad. Sci. 1984, 87, 91–97. [Google Scholar] [CrossRef]
- Nielsen, D.C.; Vigil, M.F.; Benjamin, J.G. Evaluating decision rules for dryland rotation crop selection. Field Crops Res. 2011, 120, 254–261. [Google Scholar] [CrossRef]
- Paris, P.; Di Matteo, G.; Tarchi, M.; Tosi, L.; Spaccino, L.; Lauteri, M. Precision Subsurface Drip Irrigation Increases Yield While Sustaining Water-Use Efficiency in Mediterranean Poplar Bioenergy Plantations. For. Ecol. Manag. 2018, 409, 749–756. [Google Scholar] [CrossRef]
- Bouchard, A.; Vanasse, A.; Seguin, P.; Belanger, G. Yield and Composition of Sweet Pearl Millet as Affected by Row Spacing and Seeding Rate. Agron. J. 2011, 103, 995–1001. [Google Scholar] [CrossRef]
- Musick, J.T.; Jones, O.R.; Stewart, B.A.; Dusek, D.A. Water-yield relationships for irrigated and dryland wheat in the U.S. Southern Plains. Agron. J. 1994, 86, 980–986. [Google Scholar] [CrossRef]
- Ehlers, W.; Goss, M. Water Dynamics and Plant Production, 2nd ed.; CAB International: Boston, MA, USA, 2016. [Google Scholar]
- Myers, R.J.K.; Foale, M.A. Row spacing and population density in grain sorghum—A simple analysis. Field Crops Res. 1981, 4, 147–154. [Google Scholar] [CrossRef]
- Mohler, C.L. Enhancing the Competitive Ability of Crops. In Ecological Management of Agricultural Weeds; Liebman, M., Mohler, C.L., Staver, C.P., Eds.; Cambridge University Press: Cambridge, UK, 2004; pp. 269–305. [Google Scholar]
- Nagaz, K.; Toumi, I.; Mahjoub, I.; Masmoudi, M.M.; Mechlia, N.B. Yield and Water-Use Efficiency of Pearl Millet (Pennisetum glaucum (L.) R. Br.) Under Deficit Irrigation with Saline Water in Arid Conditions of Southern Tunisia. Res. J. Agron. 2009, 3, 9–17. [Google Scholar]
- Nielsen, D.C.; Vigil, M.F. Defining a Dryland Grain Sorghum Production Function for the Central Great Plains. Agron. J. 2017, 109, 1582–1590. [Google Scholar] [CrossRef]
- Hao, B.; Xue, Q.; Bean, B.W.; Rooney, W.L.; Becker, J.D. Biomass Production, Water and Nitrogen Use Efficiency in Photoperiod-Sensitive Sorghum in the Texas High Plains. Biomass Bioenergy 2014, 62, 108–116. [Google Scholar] [CrossRef]
- Ritchie, J.T. Efficient water use in crop production: Discussion on the generality of relationships between biomass production and evapotranspiration. In Limitations to Efficient Water Use in Crop Production; Tanner, H.M., Jordan, W.R., Sinclair, T.R., Eds.; ASA-CSSA-SSSA: Madison, WI, USA, 1983; pp. 29–44. [Google Scholar]
- Sinclair, T.R.; Weiss, A. Principles of Ecology in Plant Production, 2nd ed.; CABI: Cambridge, MA, USA, 2010. [Google Scholar]
- Hardwick, S.R.; Toumi, R.; Pfeifer, M.; Turner, E.C.; Nilus, R.; Ewers, R.M. The Relationship between Leaf Area Index and Microclimate in Tropical Forest and Oil Palm Plantation: Forest Disturbance Drives Changes in Microclimate. Agric. For. Meteorol. 2015, 201, 187–195. [Google Scholar] [CrossRef]
- Blum, A. Effective Use of Water (EWU) and not Water-Use Efficiency (WUE) is the Target of Crop Yield Improvement under Drought Stress. Field Crops Res. 2009, 112, 119–123. [Google Scholar] [CrossRef]


Publisher’s Note: MDPI stays neutral with regard to jurisdictional claims in published maps and institutional affiliations. |
© 2020 by the authors. Licensee MDPI, Basel, Switzerland. This article is an open access article distributed under the terms and conditions of the Creative Commons Attribution (CC BY) license (http://creativecommons.org/licenses/by/4.0/).