1. Introduction
In Mexico there are 6.5 million hectares under irrigation. Of this, 3.3 million are distributed in 86 irrigation districts and 3.2 million are distributed in just over 40 thousand irrigation units located mainly in the center and north of the country. Gravity surface irrigation (border or furrows) is the most used method in these areas [
1].
According to recent statistics and studies that have been registered by the National Water Commission (CONAGUA, according to its Spanish acronym), application efficiencies in Mexico are less than 50% [
1,
2,
3], 5% below the global average [
4,
5], and consequently the water productivity (Kg/m
3) is very low compared to pressurized irrigation systems [
1,
6]. Despite the fact that support has been given to modernize the traditional sprinkler and drip irrigation systems, there are still various factors that cause farmers not to opt for these technologies; for example, a lack of investment, little government support, payment of trained personnel to operate the equipment, social factors, risks in the acquisition of equipment that they do not know, among others [
4,
6,
7,
8].
The low application efficiencies obtained by gravity irrigation systems are mainly due to water losses associated with deep infiltration, coleus, and flooding in some parts of the soil as a result of a poor flow design at the entrance of the furrow [
2,
3], as well as unevenness in the plots and little knowledge about the water depth that must be supplied to the crops so that they can develop fully. However, in a sector where the demand for water occupies a high percentage of the available water, the efficient use of irrigation water and the increase in productivity are crucial factors that must be addressed as soon as possible to sustainably manage the water and adaptation to climate change [
5,
9,
10,
11].
Faced with this problem, during the years 2015–2019 CONAGUA maintained a modernization program in gravity irrigation systems (RIGRAT for its acronym in Spanish) in an area of 200,000 ha in some irrigation districts of Mexico. The objective of the program was to increase the efficiency of water application in the crops through two main axes: a timely design for optimal flow at the entrance of the furrows and a reduction in irrigation time in each plot.
A correct design of the flow rate that must be applied to each border or furrow requires knowledge of the characteristics of the plots (length, moisture content, and apparent density), the established crop, phenological stage, and the irrigation depth to be applied, as well as the mean parameters of the infiltration equation being used: Richards or Green and Ampt [
12].
Several simulation models can be found in the literature to model gravity irrigation, which are completely empirical [
13,
14,
15] to those that use the complete Barré de Saint-Venant and Richards equations to model runoff and infiltration, respectively [
16,
17,
18]. The use of these models (numerical or analytical) helps to better understand the behavior of water during the processes of advancing, storage, and recession [
12,
17,
19]. However, the complexity with which they were developed or the limitations they have make their use impractical and only used for research purposes, leaving aside their practical application.
In recent studies, it has been reported that it is possible to have high application efficiencies in gravity irrigation systems, by applying the optimal flow rate at the entrance of the border or furrow and maintaining a high uniformity coefficient in the plot, called the Christiansen Uniformity Coefficient [
2,
3,
12].
This methodology was applied by Chávez and Fuentes [
2,
3] for seven crops planted in 1010 ha:
Zea mays L.,
Sorghum vulgare Pers.,
Medicago sativa L.,
Phaseolus vulgaris L.,
Pachyrhizus erosus L.,
Hordeum vulgare L.,
Triticum aestivum L. and
Allium cepa L. They found that with the application of the optimal flow rate of the calculated irrigation, the irrigation depths decreased on average 19 cm. The irrigation times decreased on average 11.76 h ha
−1 per irrigation event and, in addition, the average volume saved was 2000 m
3 ha
−1 per irrigation event, which increased the average efficiency from 51 to 86%. However, to have an efficient design, knowledge of the plots and the water requirements of the crops established in the different phenological stages are necessary [
12].
The objective of this work is to show that it is possible to increase the application efficiency and productivity of water in gravity irrigation systems in Irrigation District 023, San Juan del Río, Querétaro, Mexico. For the simulation, the kinematic wave model is used, and an analytical formula is used to calculate the optimal flow rate that takes into account the characteristics of the plot (length, moisture content, density, and texture), the parameters of the equation of infiltration (Ks and Hf), and the net irrigation depth to be applied to the crops in their different phenological stages.
2. Materials and Methods
2.1. The Kinematic Wave Model
The kinematic wave model considers that, in the Barré de Saint-Venant momentum equation, the inertial and pressure terms are negligible with respect to the friction and gravity terms [
2]:
where A = A(x,t) is the hydraulic area (L
2); Q = Q(x,t) is the flow (L
3T
−1); W is the infiltrated volume per unit of furrow length in unit time (L
3T
−1); t is the time (T); S
o is the slope of the bottom of the furrow (LL
−1); and S
f is the friction slope (LL
−1).
2.2. Green and Ampt Equations
The Green and Ampt model [
20] is established from the continuity equation and Darcy’s law, with the following hypotheses: (a) the initial moisture profile in a soil column is uniform θ = θ
o; (b) water pressure at the soil surface is hydrostatic: ψ ≥ 0, where h is the water depth; (c) there is a well-defined wetting front characterized by negative pressure: ψ = −h
f < 0, where h
f is the suction at the wetting front; and (d) the region between the soil surface and the wetting front is completely saturated (plug flow)): θ = θ
s and K = K
s, where K
s is the hydraulic saturation conductivity, that is, the value of the hydraulic conductivity of Darcy’s law corresponding to the volumetric saturation content of water. The resulting ordinary differential equation is as follows:
where ∆θ = θ
s − θ
o is the storage capacity; I is the accumulated infiltrate volume per unit of soil surface or infiltrated depth; and z
f is the position of the wetting front.
2.3. Analytical Representation to Calculate Optimal Flow
According to Fuentes and Chávez [
12], the analytical representation of the optimal irrigation expenditure is a function of the border length, the hydrodynamic properties, and the soil moisture constants, maintaining a maximum value of the uniformity coefficient. In this way,
in which it should be noted that K
s L = q
m represents the minimal unit flux necessary for the water to reach the final part of the border; S is the sorptivity of the medium expressed by S
2 = 2 K
s h
f (θ
s − θ
o); and ℓ
n is the net irrigation depth. The optimal flow per row is calculated as Q
o = b q
o, where b is the width of the furrow. This analytical formula has been applied in field experiments with good results [
2,
3].
2.4. Case Study
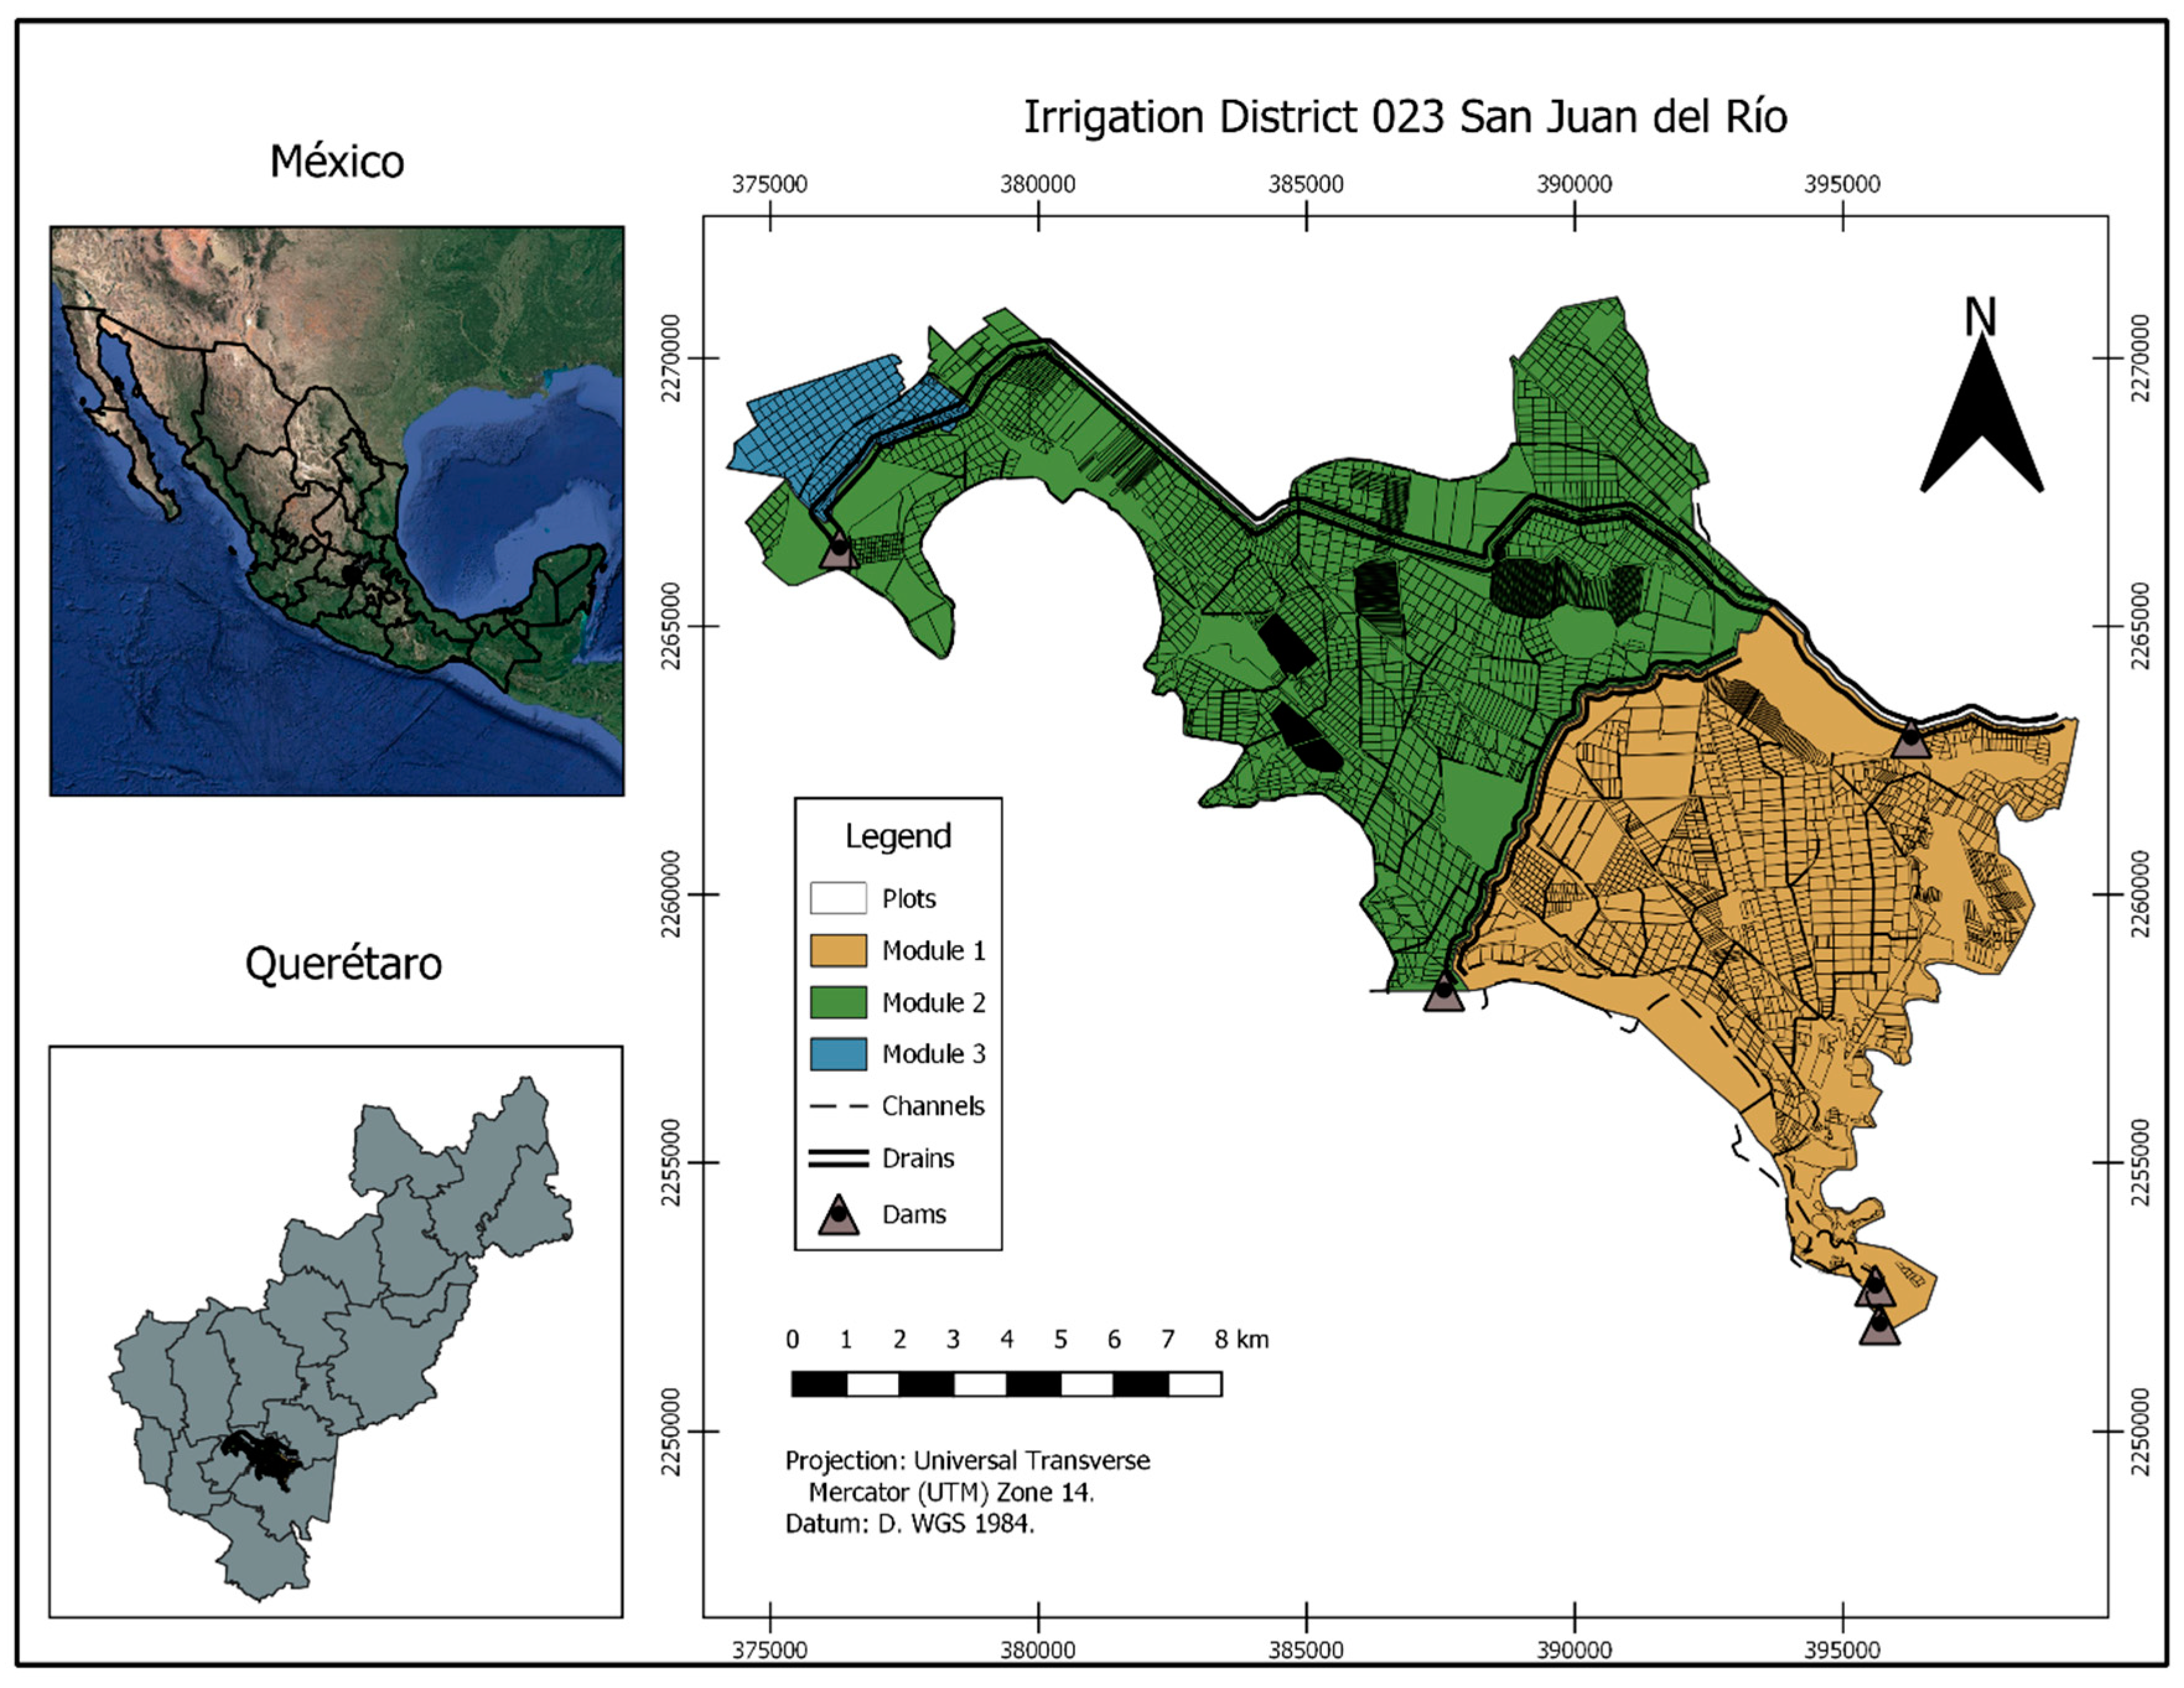
Irrigation District 023 is located between the municipalities of San Juan del Río and Pedro Escobedo in the state of Querétaro, México (
Figure 1), and has an area of 11,048 ha. The water for irrigation is obtained from the San Ildefonso, Constitución de 1917, La Llave and La Venta dams, and from 54 deep wells. It is legally constituted by three irrigation modules and the RIGRAT program was carried out in modules II and III on an area of 5021 ha. Its predominant climate is semiarid with summer rains, with an annual precipitation average of 599 mm and annual average temperature of 21 °C [
1]. The water is conducted through open channels. The main channels are lined with concrete, but all the laterals channels that carry water to the plots are unlined. The separation of the plots in some cases are by trees, unlined channels, drains, or roads.
2.5. Variables Measurements
In the plots where the study was carried out, the length, longitudinal and transverse slope, texture, apparent density, initial moisture contents, and saturation were measured. The first three were measured using digital topography equipment, the texture was obtained in the laboratory through mesh analysis and the Bouyoucos hydrometer, the apparent density (ρa) was obtained using the known volume cylinder method, the initial moisture content by means of a calibrated sensor TDR 300® (Spectrum Technologies, Inc., Aurora, IL, USA), and the moisture saturation content was assimilated to the total porosity of the soil obtained through the relationship ϕ = 1 − ρa/ρs, where ρs is the density of the quartz particles taken as 2.65 g/cm3. For the laboratory measurements, six samples were collected from each plot at random at a depth of 0–30 cm. Later they were mixed, and a homogeneous sample was the one that was analyzed. The USDA triangle was used to classify the soil samples.
2.6. Irrigation Tests
The irrigation tests were carried out in the plots in order to observe the behavior of the water and the volumes of water used in each irrigation event. The process, in general, is as follows: (1) the initial moisture content in the plot was measured; (2) along the length of the border or furrow distances were marked at every 20 or 30 m, which depended on the length of each of the plots; (3) farmers do not use siphons to flood the plots, instead, they open the unlined channel for the water to pass through and lead it to the furrows or borders with the help of a shovel; (4) the time in which the water front reached each of the established marks (advance front) was counted while the water flow was counted at the entrance of the border or furrow using an ultrasonic Doppler effect sensor (FluxSense®) (SEHIDRO Inc., Qro., MEX); and (5) once the water reached the end of the border or furrow, the water inlet was cut off at the beginning and the time in which the recession wave arrived at all the marked points was taken. The irrigation tests were carried out on irrigation lines that varied from 10 to 60 furrows, depending on the expense at the entrance to the canal. The results of the advance and recession times correspond to the average of the furrows evaluated in each irrigation line.
With the data collected from the plots (length, longitudinal slope, apparent density, initial moisture contents and saturation, and flow at the entrance of furrow or border) and the measured times of the advance and recession phase, we proceeded to find the parameters of the Green and Ampt equation (Ks and hf) values that minimized the sum of the squares of the errors in this test. For this stage, we used the nonlinear Levenberg–Marquardt optimization algorithm [
21].
2.7. Application Efficiency and Water-Use Efficiency
Application efficiency (η
A) is defined as [
3]:
where V
n is the volume of water stored in the root zone and V
b is the total volume of water applied. The first is obtained with the expression V
n = ℓ
n A
r, where ℓ
n is the net irrigation depth, defined according to the crop irrigation requirements, and A
r is the irrigated area considered. The second is obtained as V
b = ℓ
b A
r, where ℓ
b is the gross irrigation depth. The net irrigation depth was calculated with the FAO-56 Penman–Monteith evapotranspiration method [
22] and the crop phenology was estimated using the FAO methodology [
23].
The water-use efficiency (WUE) is the relationship that exists between the biomass present in a crop per unit of water used by it, although recent studies refer to this term as the productivity of irrigation water [
11,
24]. This relationship is an indicator that allows us to calculate the economic value of the irrigation water in the area. High values of this index will indicate that we are managing to produce a greater amount of organic matter with less use of water. In this work we focus on the productive component of the harvest, which is why we will use the dry biomass yield (<15% of moisture) obtained in kg of the product per m
3 of water used:
3. Results and Discussion
3.1. Soil Texture
Soil texture is an indicator of the amount of water that soil can store and, consequently, the irrigation interval with which crops must be watered.
Figure 2 shows the general classification of textures found in the study area. The predominant soils were loam (21.33%), silty clay loam (18.26%), silty loam (16.44%), and sandy loam (11.71%). This measure allowed us to detect the soils in which more water was used and explain the reasons why the application efficiencies were lower than other soils with similar or different textures.
3.2. Irrigations Test
During the study, 475 irrigation tests were carried out on a surface in different phenological stages of the crops: sowing, growth, flowering, and fruiting. The crops in which they were made were corn (Zea mayz), sorghum (Sorghum vulgare), and barley (Hordeum vulgare) in the spring–summer (S–S) and autumn–winter (A–W) cycles (2014–2019). The results show that, in 25% of the cases, the irrigation depth applied by irrigation is 30 cm, which represents an application efficiency of 43%, while 50% of the farmers apply an average irrigation depth of 23 cm per irrigation (ηA = 69%), and the remaining 25% applies an irrigation depth greater than 40 cm, which in some cases has reached up to 98 cm, which is equivalent to an application efficiency ranging from 16 to 40%.
The irrigation depth applied is directly related to the amount of water that reaches the plots, since the average value is close to 58 L/s, but there is a minimum value of 3.78 L/s that goes up to the maximum value of 160 L/s. This brings with it a very strong problem for the farmer, since he wants to apply the same furrow laying regardless of the flow that he has at the entrance of the plot, which leads to the irrigation time per hectare being 2–6 days and, consequently, there are low application efficiencies.
3.3. Irrigation Design
With the information of the established crop and the phenological stage in which it was found, the length of the borders or furrows, the parameters found in the irrigation tests (Ks and Hf), and the net irrigation depth to be applied in the next laying was calculated with the Equation (4). The entry flow in the plot was divided by the result obtained and the number of furrows per laying was found with which it should be watered for that specific crop and plot. The plots were split in half to apply traditional and designed irrigation.
As an example, in the case of Plot 778 (
Table 1), the results of the evaluation and design were (1) for growing corn, 12 cm needed to be applied but the farmer applied 35.46 cm (η
A = 33.84%); (2) once the advance and recession phase had been calibrated, the optimal flow was calculated with Equation (4); (3) with these data, the farmer is told that with the flow he has at the entrance of the plot, he must only open 44 furrows instead of the 52 with which he had been irrigating in the traditional way; (4) the farmer had a reduction of 120 min in the irrigation time per set and consequently a reduction of 22.86 in the irrigation depth; and (5) finally, he had an increase in application efficiency, going from 33.84 to 95.23%.
With this methodology developed to obtain the optimal flow in each border or furrow of the plots, it was achieved that the irrigation time required to apply the expenses that have been designed decrease by more than half (
Figure 3), where for example in soils with a silty loam texture, where previously the farmer took an average of 35 h per hectare, now it does so in less than 10 h. In the loam and silty clay loam texture plots, they exceed 25 h/ha and, in some cases, they have reached up to 89 h/ha. In general, in the plots where the study was carried out, it was found that the irrigation times decreased.
Irrigation times per hectare decreased significantly, but these times are a function of the expense that farmers receive at the entrance to the plot, so it is not the same to irrigate a hectare with 50 L/s to another that has an expense of 10 L/s. However, the same farmers stated that their lines are progressing evenly, but the only drawback they see is that now they must be more attentive. In some areas where the design was carried out, they had lengths of more than 300 m, and in these cases recommendations were given to modify the irrigation line, otherwise the irrigation will be deficient and the efficiencies will be questionable, despite the advice and design that under these conditions could be generated.
3.4. Reduction in Irrigation Depths
In the plots where the irrigation tests were carried out and the irrigation recipes calculated with Equation (4), it was possible to lower the irrigation depth by more than half, as shown in
Figure 4. In general, it can be noted that the farmers have a tendency to apply more water in the plots with a loam texture (with an average of 40 cm/ha/irrigation and a maximum of 97 cm/ha/irrigation); however, after the recipe is shown and the information on the number of furrows per irrigation to be applied is given, this irrigation depth is reduced at 15 cm/ha/irrigation on average, which brings considerable savings to the irrigation district. On the other hand, in the plots with a silty clay texture, the irrigation depth applied is, on average, 19 cm/ha/irrigation.
The furrows per irrigation that must be opened depending on the flow at the entrance of the plot and the optimal flow are less than those that the farmers usually apply. This implies more work for him and sometimes he does not cooperate mainly because the payment that they receive is a function of the number of hectares they can irrigate. According to their experience, the slower they pour the water into the plots, the more plots they can serve. In this sense, in coordination with the irrigation district authorities, incentives were sought to convince the farmers to apply the irrigation recipe.
In addition, in some cases the irrigation lengths are greater than 300 m, and in these plots the irrigation depth that is applied per hectare exceed 40 cm. In
Figure 4 appears atypical points, meaning that, in some plots, it has been detected that they apply almost 100 cm of depth per irrigation event. Here, they were given the recommendation to make two or three sections along their original irrigation lines.
The efficient design that was carried out allowed us to lower the total amount of water used in each of the studied crops. In all cases it was observed that by applying a correct design the amount of water used per growing period was reduced.
Figure 5 shows the average of the evaluations carried out during the years of this study, which in general shows a reduction of 35% for barley and 48% for corn and sorghum crops. The savings obtained for the corn and sorghum crops represented 93% of the amount of water required to plant the same crop in another hectare, while in the case of barley the savings obtained in 2 ha provided enough water to plant an additional 1 ha.
3.5. Water-Use Efficiency
The harvest of each crop was measured in entire plots and the WUE calculated with Equation (6) is shown in
Figure 6 for the barley, corn, and sorghum crops. This value increased over the years, mainly due to the fact that the farmers and the supervisory personnel accepted the design of the optimal flow provided. Accepting the irrigation design represented a generational change in the way of watering for farmers, since most mentioned that the way of watering was as their father had taught them, and that in several cases there was no knowledge of irrigation water needs. However, in the last year of evaluation, increases in the WUE of 54.0%, 43.8%, and 23.0% were achieved for barley, corn, and sorghum, respectively.
The WUE in the evaluated gravity irrigation systems was also affected by various factors: environmental, social, management practices, payment for the service, land rent, among others. These results coincide with other studies where they show that farmers who do not use irrigation devices such as probes or tensiometers for estimating the soil water potential or volumetric water content tend to over-irrigate [
9,
25]. In this sense, in the plots with the most unfavorable slopes and those where they had waterlogging problems, it was recommended to perform land leveling (1200 ha). This practice helped to increase the efficiency in the use of water in the following agricultural cycle, as well as to obtain a better yield in the harvest.
The water savings obtained with an efficient design helped us to have increases in crop productivity, since without a prescription in the case of barley for the last year, 0.700 kg was harvested for each cubic meter of water used, and with the designed irrigation, for the same cubic meter of water, 1078 kg of grain were harvested; in the case of sorghum, this increase represented an additional 0.307 kg and in the case of corn it corresponded to 0.591 kg.
With the efficient design of optimal flow, we managed to reduce the amount of water used to produce 1 kg of biomass (
Figure 7). In the case of barley, this reduction was 47.45%, going from 1.96 m
3/kg to 0.93 m
3/kg, while in the case of corn and sorghum crops, the reduction was 38% and 27%, respectively. These data are an important indicator in areas with essential water resources and allow calculating the economic value of the irrigation water that can be maximized, and therefore will be one of the main requirements in making decisions about the distribution and use policies of water in food production.
4. Conclusions
The reduction in irrigation time per hectare had a considerable impact on the irrigation depth applied to crops. In general, it can be seen that the minimum saving is of the order of 450 m3 in clay loam, silty, and silty clay soils. The plots where there are more savings are those where they correspond to the loam, sandy clay, and silty clay loam textures. Despite the fact that this program was implemented for only 5 years, the savings obtained per cycle were still significant for the farmers, since in the low rainfall season the dams do not have enough storage to provide water, and this is where the impact of this design has been reflected: with less water, they have irrigated the same irrigation area and, on occasions, as in the 2018–2019 cycle, the savings allowed to give an additional irrigation of 15 cm to 2500 ha.
Finally, it was possible to verify that, with a design for optimal flow in each border or furrow, it helped to improve the efficiency in the use of water and helped increase the productivity of the three crops that were irrigated by gravity. Although with pressurized irrigation systems (sprinkler or drip) there is a higher WUE, this design provides an opportunity to make better use of the resource, increase productivity, and improve crop yield.

 ,
, 


