Article

Soil Microbial Community Profiling and Bacterial Metabolic Activity of Technosols as an Effect of Soil Properties following Land Reclamation: A Case Study from the Abandoned Iron Sulphide and Uranium Mine in Rudki (South-Central Poland)

by
Agnieszka Wolińska
1,*,
Kinga Włodarczyk
1,
Agnieszka Kuźniar
1,
Anna Marzec-Grządziel
2,
Jarosław Grządziel
2,
Anna Gałązka
2 and
Łukasz Uzarowicz
3
1
Department of Biology and Biotechnology of Microorganisms, The John Paul II Catholic University of Lublin, Konstantynów St. 1 I, 20-708 Lublin, Poland
2
Department of Agricultural Microbiology, Institute of Soil Science and Plant Cultivation, Czartoryskich St. 8, 24-100 Puławy, Poland
3
Department of Soil Science, Institute of Agriculture, Warsaw University of Life Sciences—SGGW, Nowoursynowska 159 Str., Building No. 37, 02-776 Warsaw, Poland
*
Author to whom correspondence should be addressed.
Agronomy 2020, 10(11), 1795; https://doi.org/10.3390/agronomy10111795
Submission received: 19 October 2020 / Revised: 4 November 2020 / Accepted: 12 November 2020 / Published: 16 November 2020

Abstract

:
The aims of the study were (1) to recognize the structure of bacteria diversity in Technosols developed from mine spoils containing iron (Fe) sulphides with the use of culture-independent technique, and (2) to determine microbial metabolic activities, in the context of their potential to be an adequate indicators of soil properties being the consequence of land reclamation. The study site was located in the vicinity of the abandoned Fe sulphide and uranium mine in Rudki village (Holy Cross Mts., Poland). Three soil profiles with different chemical properties (pH, content of carbonates, soil salinity, content of total organic carbon and total nitrogen) were studied. Biodiversity was determined with the use of meta-barcoding of 16S rRNA community profiling analysis based on the hypervariable V3-V4 region of 16S rRNA gene (MiSeq, Illumina). The catabolic fingerprinting of soil microbial communities was evaluated with the use of Biolog®EcoPlates™ System. It was evidenced that changes in microbial structure and their metabolic activity were the consequence of a combined effect of both the soil depth and soil chemical properties being the final result of reclamation process. Consequently, microbial indicators (from phyla to genera level) indirectly testifying about success or ineffectiveness of reclamation in technogenic soils were recommended. To our best knowledge, the present study is the first insight into Polish Technosols biodiversity and catabolic activity.

1. Introduction

Technosols are soils strongly influenced by human activity or made by human [1]. They develop e.g., on mine waste disposal sites in mining areas. A specific group of Technosols are soils containing iron (Fe) sulphides. In Poland, such Technosols occur e.g., on mine spoils of abandoned Fe sulphide mines in Rudki and Wieściszowice [2].
Fe sulphide weathering influences the properties of Technosols because it contributes to strong acidity unless carbonates occur in parent material [3,4]. Acidification enhances leaching of base cations, e.g., calcium (Ca) and magnesium (Mg), makes nutrients less available for plants, inhibits microbial activity and leads to the release of toxic elements [5]. To resolve that problem, Technosols containing Fe sulphides are reclaimed in order to neutralize the unfavourable strong acidity and restore their biological activity. It is known, that low pH limits microbial activity and biodiversity [6,7,8,9], as majority of soil microorganisms prefer soil reaction close to neutral (pH ~ 7). Only a few autochthonic acidophilic bacteria are able to live in strongly acidic environment. Most widespread genera representatives of this group include: Acidobacterium, Rhodanobacter [7], Mycobacterium, Nocardia [10], Thiobacillus, Acidithiobacillus, Leptospirillum [11,12], Bacillus [5,13], Pseudomonas, Flavobacterium, Alcaligenes, Cellulomonas, Arthrobacter, Brevibacterium [14].
As far as the physicochemical properties of Technosols containing Fe sulphides were well recognized [2,3,4,15], the microbiology of Technosols has been rarely studied [16,17]. It is known that restoration of ecological functions by reclamation of post-mining areas initiates biological activity on the disposal sites [5]. There are only a few reports regarding microbial activity in Technosols containing Fe sulphides [16,18,19], where a tendency to decrease in microorganism abundance with soil depth were observed. Until now, the structure of microbial community in Technosols was mostly studied based on culturable methods [5,20], that limit the cognitive sphere to 1–3% of microorganisms that can be culturable in the laboratory [21], while 97–99% belongs to the VBNC (Viable But Not Cultivable) group. In order to recognize this enormous unculturable group of microorganisms metagenomic methods should be applied.
In 1998, metagenome term was first proposed as ‘the collective genomes of soil microbiota and utilized to investigate genetic information of all microbial populations [22,23,24]. It should be emphasized that Next Generation Sequencing (NGS)provide unique opportunity to sequence uncultured microbes sampled directly from their habitats, e.g., from soil [25,26,27,28,29]. In order to receive metabolic fingerprint testifying about microbial catabolic activity, the Biolog®EcoPlates™ technique, also known as Community Level Physiological Profiling (CLPP) is widely applied [30,31,32,33]. This technique is efficiently used in environmental studies, e.g., to analyse the physiological activity of microorganisms present in contaminated soils [32,34] or to recognize the differences in soil metabolic activity between cultivation systems and plants [35,36,37]. The fact that microorganisms react quickly to any environmental stresses is commonly known, thus changes in their metabolic activity are treated as a first signal of any alterations in the ecosystem [38]. In this context it seems that application of this technique to study technogenic soils with different chemical properties being an effect of reclamation process will lead to demonstration of differences in metabolic activity between the studied soils representing areas where reclamation was successful and unsuccessful.
The main goals of the present study were (1) to recognize the structure of bacterial diversity in Technosols developed from mine spoils containing Fe sulphides with use of culture-independent technique, and (2) to determine microbial metabolic profiles in Technosols. It was hypothesized that both parameters (biodiversity and metabolic activity) depend on soil chemical properties (pH, content of carbonates, soil salinity, content of total organic carbon and total nitrogen) and could be an indirect indicators of reclamation process effectiveness in technogenic soils. To our best knowledge, this is one of the first reports about biodiversity structure, determined by culture-independent approach in Polish Technosols developed from mine spoils containing Fe sulphides. In order to obtain a comprehensive picture of Technosol biodiversity NGS and CLPP techniques were combined.

2. Materials and Methods

2.1. Study Site Description and Soil Sampling

The study site was located in the vicinity of the abandoned “Staszic” mine in Rudki village (south-central Poland, 50°53′52″ N, 21°05′55″ E). Iron sulphides and uranium ores were exploited from 1920 to 1970s [2,3,5]. Three soil profiles (R1—Rudki 1, R2—Rudki 2, R3—Rudki 3) developed from mine spoils containing iron sulphides and representing areas of different effects of land reclamation were investigated (Scheme 1). Detailed description of soil profiles and their properties are available elsewhere [5,39].
R1 profile was located on the former post-flotation waste tanks. These wastes were originally composed of crushed ore-bearing rock consisting mainly of dolomite and Fe sulphides, and were characterized by strong compaction. The reclamation performed in 1970s included covering the tanks with a layer of loamy material of a thickness about 40–50 cm [40]. Such a process led to the formation of soil profile with a layer of post-flotation waste (2C horizon, 45–85 cm) in the subsoil and a loamy layer in the topsoil where the following horizons were distinguished during the field work: A (1–3 cm), C1 (3–15 cm), and C2 (15–45 cm). R1 profile had high pH (6.7–7.5) throughout the profile due to carbonates presence [5] (Table S1 Supplementary material). The highest concentrations of total organic carbon (TOC) and total nitrogen (TN) were present in A and C1 horizon (4.8 and 2.7% of TOC, and 0.41 and 0.23% of TN, respectively) with decreasing trend with profile depth [5,39]. Importantly, loamy material covering post-flotation sludge contains high concentration of trace elements (e.g., Pb, As, Tl, U, Th) and consequently surface layer of R1 is enriched in these elements [2,3,5,41]. Nevertheless, the topsoil of R1 profile comprises an optimal niche for microbial colonization, whereas the subsoil (2C horizon) is not a favourable environment for development of majority of microbes [5]. The soil surface was covered with a meadow plant community dominated by Medicago sp., Rubus sp., Hypericum perforatum and Calamagrostis epigejos [5].
R2 profile was located in the area of the former “Serwis” disposal site where strongly acidic mine wastes containing Fe sulphides were deposited [5]. The reclamation works made there in 1970s included liming of waste surface and introduction of grasses and legumes [40]. R2 profile represents an area where reclamation failed as the soil was not successfully neutralized. The reaction throughout the profile was strongly acidic (pHH2O 3.0–3.9) and carbonates did not occur [5,39] (Table S1, Supplementary material). That profile was poor in TOC and TN, therefore it is an extreme niche for microbial colonization [5]. Surface of soil was covered by sparse meadow [2,3,5,42].
R3 profile was located nearby R2 profile, however the R3 profile represents an area where reclamation process was successful. R3 profile had pHH2O 6.7 and 7.5 in A (2–10 cm) and AC (10–20 cm) horizons, respectively [39] (Table S1, Supplementary material). It was due to the presence of carbonates added to the soil during reclamation in 1970s [5,39]. However, carbonates were absent in deeper horizons of R3 profile, i.e., C1 (20–40 cm) and C2 (40–70 cm), therefore these horizons were strongly acidic (pHH2O of 3.9) due to the presence of Fe sulphides and products of their weathering [2,3,4,5,39]. Also, TOC and TN concentrations were high only in A horizon (8% of TOC and 0.65% of TN) and they decreased downward in the profile [5]. The soil was covered with a lush meadow. Thus, R3 profile represents an area where reclamation was partially successful because the acidity was neutralized in the topsoil, (however it still remained in the subsoil) and plans were successfully introduced to the area. The soil surface was covered with a lush meadow with Alopecurus pratensis, Urtica dioica, Festuca sp. and Artemisia vulgaris as predominant plant species [5].
Profiles R1 and R3 represent areas where reclamation can be treated as successful, however the properties of soils are not perfect, because both profiles have some favourable and unfavourable properties. Profile R1 is characterized by pH ~ 7 and presence of carbonates throughout the profile, but its unfavourable feature is the high concentration of trace elements (e.g., Pb) in the topsoil (0–45 cm) and high compaction of soil material in the subsoil (2C horizon, 45–85 cm). Profile R3 has favourable properties in the topsoil (0–20 cm) (e.g., pH ~ 7, presence of carbonates, high TOC contents), whereas unfavourable ones in the subsoil (<20 cm) (e.g., pH < 4). Finally, R2 profile represents an area where reclamation failed and soil properties are unfavourable (pH < 4, high soil salinity) throughout the profile.
The soil samples were taken in June 2019. The samples from each soil horizon distinguished in the field were mixed in the plastic container. In total, 13 samples were taken and studied in terms of microbiological properties. Both containers and tools for soil profiles taking were washed with water and ethanol (>99% w/w) every time prior to taking the next samples [5]. Plant roots were removed prior to laboratory analysis and soil materials were sieved with 2 mm sieve. The soil samples were stored in darkness at 4 °C for a short time (no longer than 24 h) prior to analyses.

2.2. DNA Extraction and Next Generation Sequencing (NGS)

All homogenous soil materials (250 mg in triplicate for each soil horizon) were applied for three independent DNA extractions performed with the Power Soil DNA Isolation Kit (QIAGEN, Hilden, Germany) according manufacturer’s protocol. After that, the quantity and quality of isolated DNA were verified with a BioSpectrophotometer (Eppendorf, Hamburg, Germany). In the case if three DNA replicates were characterized by similar DNA content and purity, the extracted materials were pooled and mixed well in a single tube. This procedure remains in agreement with Soliman et al. [43] and Song et al. [44], who proved that pooling DNA extractions from individual soil samples increased operational taxonomic unit (OTU) richness.
Meta-barcoding of 16S rRNA community profiling analysis was performed based on the hypervariable V3–V4 region of 16S rRNA gene [9]. The following primers 341F and 785R were used for amplification of mentioned region and the library preparation [45]. The PCR reaction was carried out using a Q5 Hot Start High-Fidelity 2X Master Mix (New England Biolabs Inc., Ipswich, MA, USA) under conditions described elsewhere [9]. Next generation sequencing was performed by Genomed S.A. (Warsaw, Poland) on a MiSeq sequences (Illumina, San Diego, CA, USA) in paired-end (PE) technology, 2 × 300 nt, using Illumina v3 kit (San Diego, CA, USA).
The data are available under accession number PRJNA663639 (GenBank, NCBI, https://www.ncbi.nlm.nih.gov/search/all/?term=PRJNA663639).

2.3. Bioinformatic Analysis

DADA2 version 1.14 package [46] and R version 3.6.0 [47] were used to amplicon sequence variants (ASVs) analysis. The forward and reverse reads were trimmed to 250 bp based on the quality plots, and primers/adapters were removed from all analysed reads. Filtering parameters applied were as follows: maxN = 0, maxEE = 3, truncQ = 2. Sequences were also dereplicated using derepFastq with default parameters and to exact sequences were resolved using DADA [48]. Summary of the sequencing data quality obtained in the study is presented in Table S2. As a result of NGS sequencing of 13 studied soil samples 3091632 raw sequences were obtained in total. 2325317 sequences remained after the preliminary quality filtering. Next, denoised F/R quality filtering was performed, which yielded 2278140 (denoised F) and 2288207 (denoised R) sequences. The total amount of merged forward-reverse reads was 2163594 sequences. After chimera removal, 2105152 sequences remained for the analysis, meaning that ca. 32% did not meet the assumed criteria and were removed during restrictive bioinformatic data processing. Rarefaction curves were generated for all samples and did plateau for each sample studied (Figure S1).
Taxonomy was assigned against the latest version of the Silva (modified version r138, see http://www2.decipher.codes/Downloads.html) using the IDTAXA Classifier [49]. The Venn diagrams and the network-like Venn diagrams were prepared in Cytoscope (v.3.7.2) [50]. In order to prepare the diagrams, the soil samples were divided into three groups: (1) surface soil samples (R1-A, R2-AC, R3-A, R3-AC), subsurface soil samples (R1-C1, R1-C2, R2-C1, R2-C2, R3-C1) and subsoil samples (R1-2C, R2-C3, R2-C4, R3-C2).

2.4. Bacterial Community-Level Physiological Profiles—Biolog®EcoPlates™

The community-level physiological profiling (CLPP) technique was performed using Biolog®EcoPlates™ System (Biolog Inc., Hayward, CA, USA). The catabolic fingerprinting of soil microbial communities was evaluated with the use of 31 different carbon sources [51] grouped into five categories: amines and amides, amino acids, carbohydrates, carboxylic acids, polymers. 1 g of each soil sample was transferred into conical flasks holding 99 mL of sterile 0.9% NaCl, vortexed (30 min, 150 rpm, 25 °C) and cooled (30 min, 4 °C) [9]. Finally, each of the solutions were transferred into each of the wells in the EcoPlate and incubated (144 h, 28 °C).
As the most intensive metabolic activity was noted after 120 h of incubation, the results obtained in mentioned time are presented in this study. The results reading was performed every 24 h (MicroStation ID System at 590 nm). The results are shown as a percentage of utilization of individual compounds. Clustering analysis tree was prepared from all results obtained in 120 h of analysis after correction with negative control using Past 3.25 software (Oslo, Norway) [52]. Graphical presentation of the obtained results was prepared with use of Interactive Tree of Life Platform Software 5.6.2 [53]. Moreover, results of CLPP are also expressed as average well-color development (AWCD), the Shannon-Wiener (H’) and Evenness (E) [54]. Graphical presentation of functional results was carried out with the use of R Studio packages (Northern Ave, Boston, MA, USA) and GraphPad Prism 8 (San Diego, CA, USA).

3. Results

3.1. Biodiversity of the Studied Technosols—Phyla Taxonomic Level

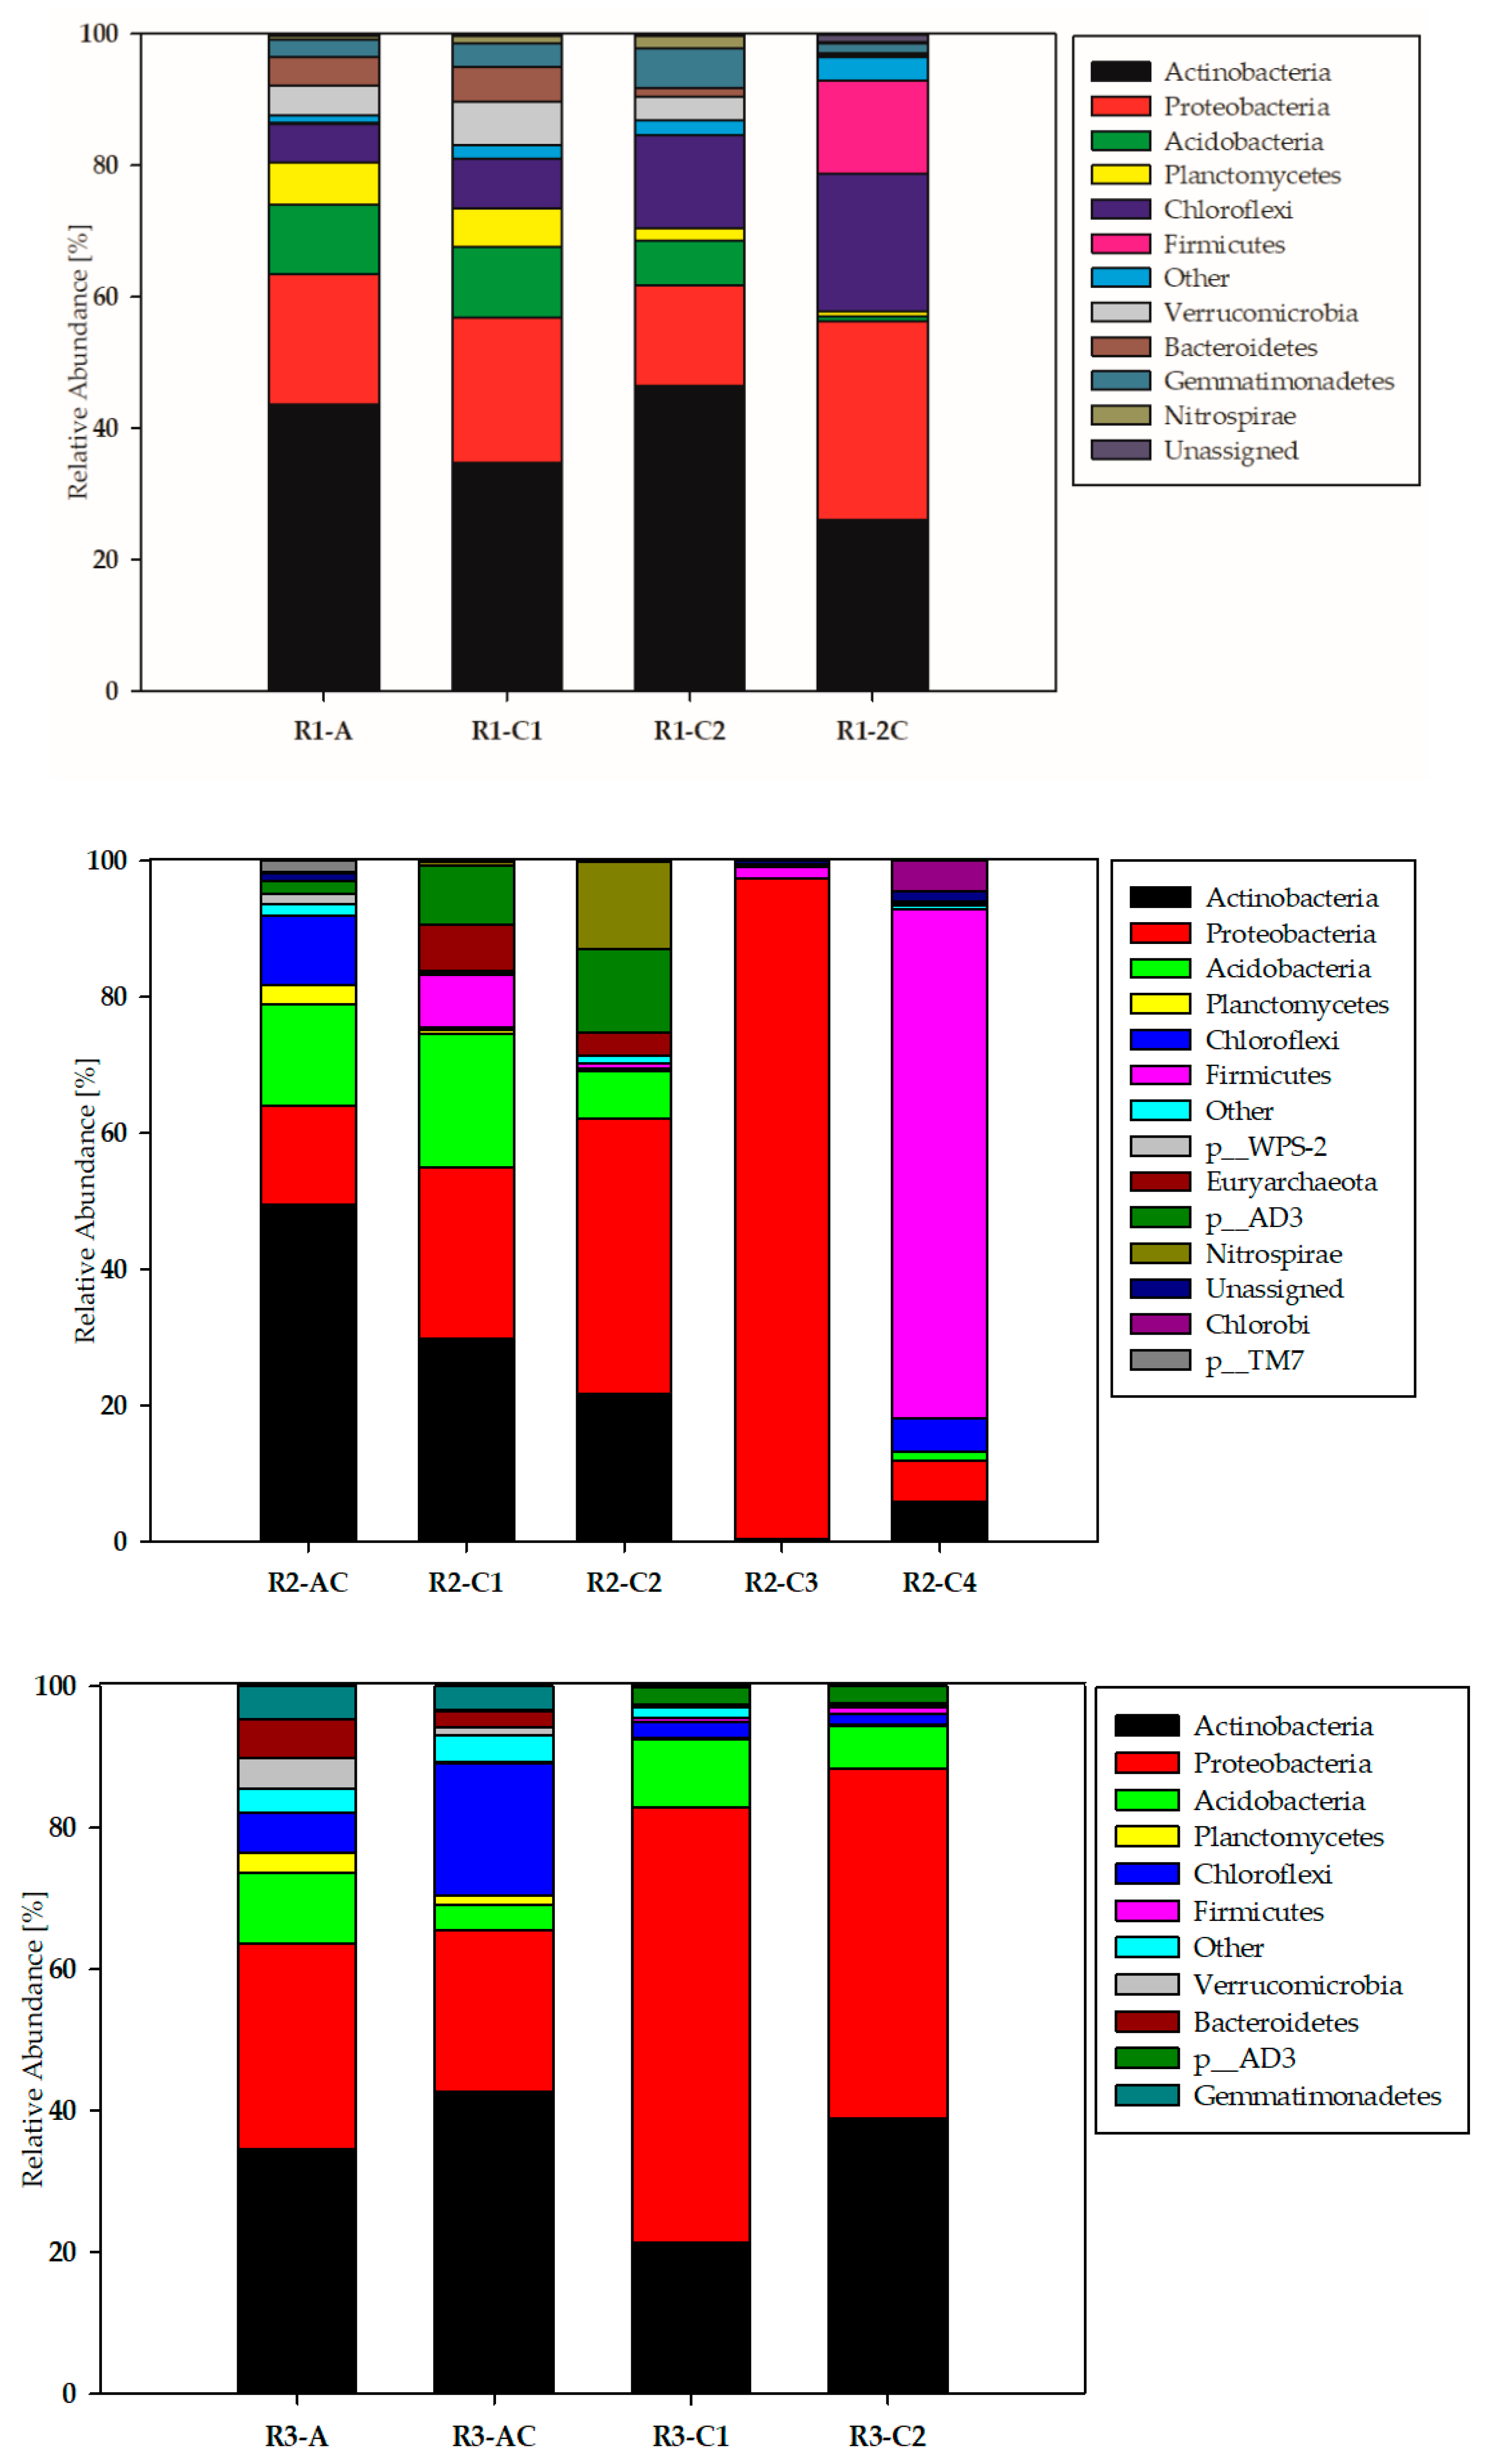
Main phyla of bacteria identified by culture independent technique in the three studied soil profiles with different chemical properties (R1, R2, R3) being an effect of successful (R1 and R3 profiles) and unsuccessful (R2 profile) reclamation are shown in Figure 1.
It was evidenced that Actinobacteria and Proteobacteria are dominants in each of the studied profiles, however their abundance was dependent on the soil depth and soil chemical properties being an effect of reclamation process. Proteobacteria were found at the highest abundance (96.94% of all identified sequences) in R2-C3 soil horizon. Quite high abundance of Proteobacteria (40.49%) was noted in R2-C2 soil horizon, whereas in remaining horizons of the R2 profile oscillated at the range of 14.55–25.20%, for R2-AC and R2-C1, respectively. Their lowest abundance occurred in the deepest part of R2 profile (6.13%). A predomination of Proteobacteria (49.69–61.61%) was also found in the deeper horizons of R3 profile (R3-C2 and R3-C1, respectively) (Figure 1). In the top layers of R3 profile Proteobacteria abundance ranged from 22.83% (R3-AC) to 29.15% (R3-A). The lowest Proteobacteria share (15.44–30.18%) was found in R1 profile.Acidobacteria and Chloroflexi phyla were determined as subdominants in Technosols bacterial structure (Figure 1). Their numbering was sensitive to soils properties (being an effect of reclamation) and the depth in the soil profile. They found the most accurate environment for colonization in the strongly acidic R2 profile, because the highest abundance of Acidobacteria (14.84–19.59%) in the surface layers of R2 was found. In R2-C2 their number amounted 6.92% whilst in the two deepest parts of R2 was strongly reduced to 0.05–1.36% (Figure 1). In R1 profile Acidobacteria abundance was on the level of 10.48–10.60% in the two surface horizons and it decreased with depth to 0.68–6.80% in the subsoil. In R3 profile with neutral topsoil and acidic subsoil, Acidobacteria abundance reached maximal level (10.09%) in R3-A, followed by 9.63% in R3-C1 and 5.96% in R3-C2.
In contrary, the lowest (3.73%) Acidobacteria abundance occurred in R3-AC, where, in turn, a high number of Chloroflexi (18.73%) was recorded (Figure 1). In the remaining parts of R3 profile, their numbers remained within the limits of 5.63–1.44%, displaying a clear decreasing trend with depth. The abundance of Chloroflexi in the R1 profile was opposite to that described above, as increased with depth (5.92–14.15%), reaching a maximum (20.94%) in the deepest part of R1 profile (Figure 1). Finally, in R2 profile Chloroflexi preferred to inhabit the surface part (10.22%), whilst in the other horizons their abundance was strongly reduced to 0.27–4.75% in R2-C1 and R2-C4, respectively. The lowest Chloroflexi abundance was noted in R2-C2 and R2-C3 horizons, where amounted 0.003% and 0.026%, respectively.
An interesting data were obtained in respect to Verrucomicrobia, Bacteroidetes and Gemmatimonadetes phyla as they were not found at all in the R2 profile where reclamation failed and soil reaction was strongly acidic throughout the profile. In R1 profile, Verrucomicrobia relative abundance ranged from 0.22 to 6.60% whereas in R3 profile oscillated on the level of 0.009–4.46% (Figure 1). In both cases, decrease of Verrucomicrobia numbers with depth was confirmed. Similarly, Bacteroidetes abundance displayed a reduction of growth with depth and ranged between 0.41–4.32% and 0.08–5.40% in R1 and R3, respectively. Decrease of Gemmatimonadetes number with the soil depth was noted only in R3 profile (0.002–4.65%), meanwhile in R1 the highest relative abundance of mentioned phylum in R1-C2 layer (6.00%) was evidenced whilst remained on a level of 2.73–3.54% in the surface parts of that profile.
The highest abundance of Plancomycetes was noted in R1 profile (0.85–6.51%), followed by R3 (0.15–2.78%). Against this background, the R2 profile stands out again, as the presence of Planctomycetes on the level of 2.83% was recorded in the surface layer (R2-AC), while in the remaining parts of the profile their numbers dropped strongly (0.006–0.63%) and in the horizon R2-C3 their presence was not noted at all. R2 profile differ from the two others also in respect to Firmicutes abundance. Firmicutes definitely dominated in (74.90%) the deepest part of R2 profile (R2-C4) whilst in other analysed horizons their abundance ranged from 0.08 to 7.75% (Figure 1). Similar trend, showing preference to colonize the deepest parts of the soil profile by Firmicutes was confirmed in R1 and R3 profiles, where 14.15% and 1.03% of all identified sequences in layer R1-2C and R3-C2, respectively belonged to Firmicutes. The share of other bacterial phyla (e.g., Nitrosospirae, Chlorobi, Euryarcheota) illustrated in Figure 1 was negligible and usually did not exceed 2% of identified sequences.

3.2. Biodiversity of the Studied Technosols—Classes Taxonomic Level

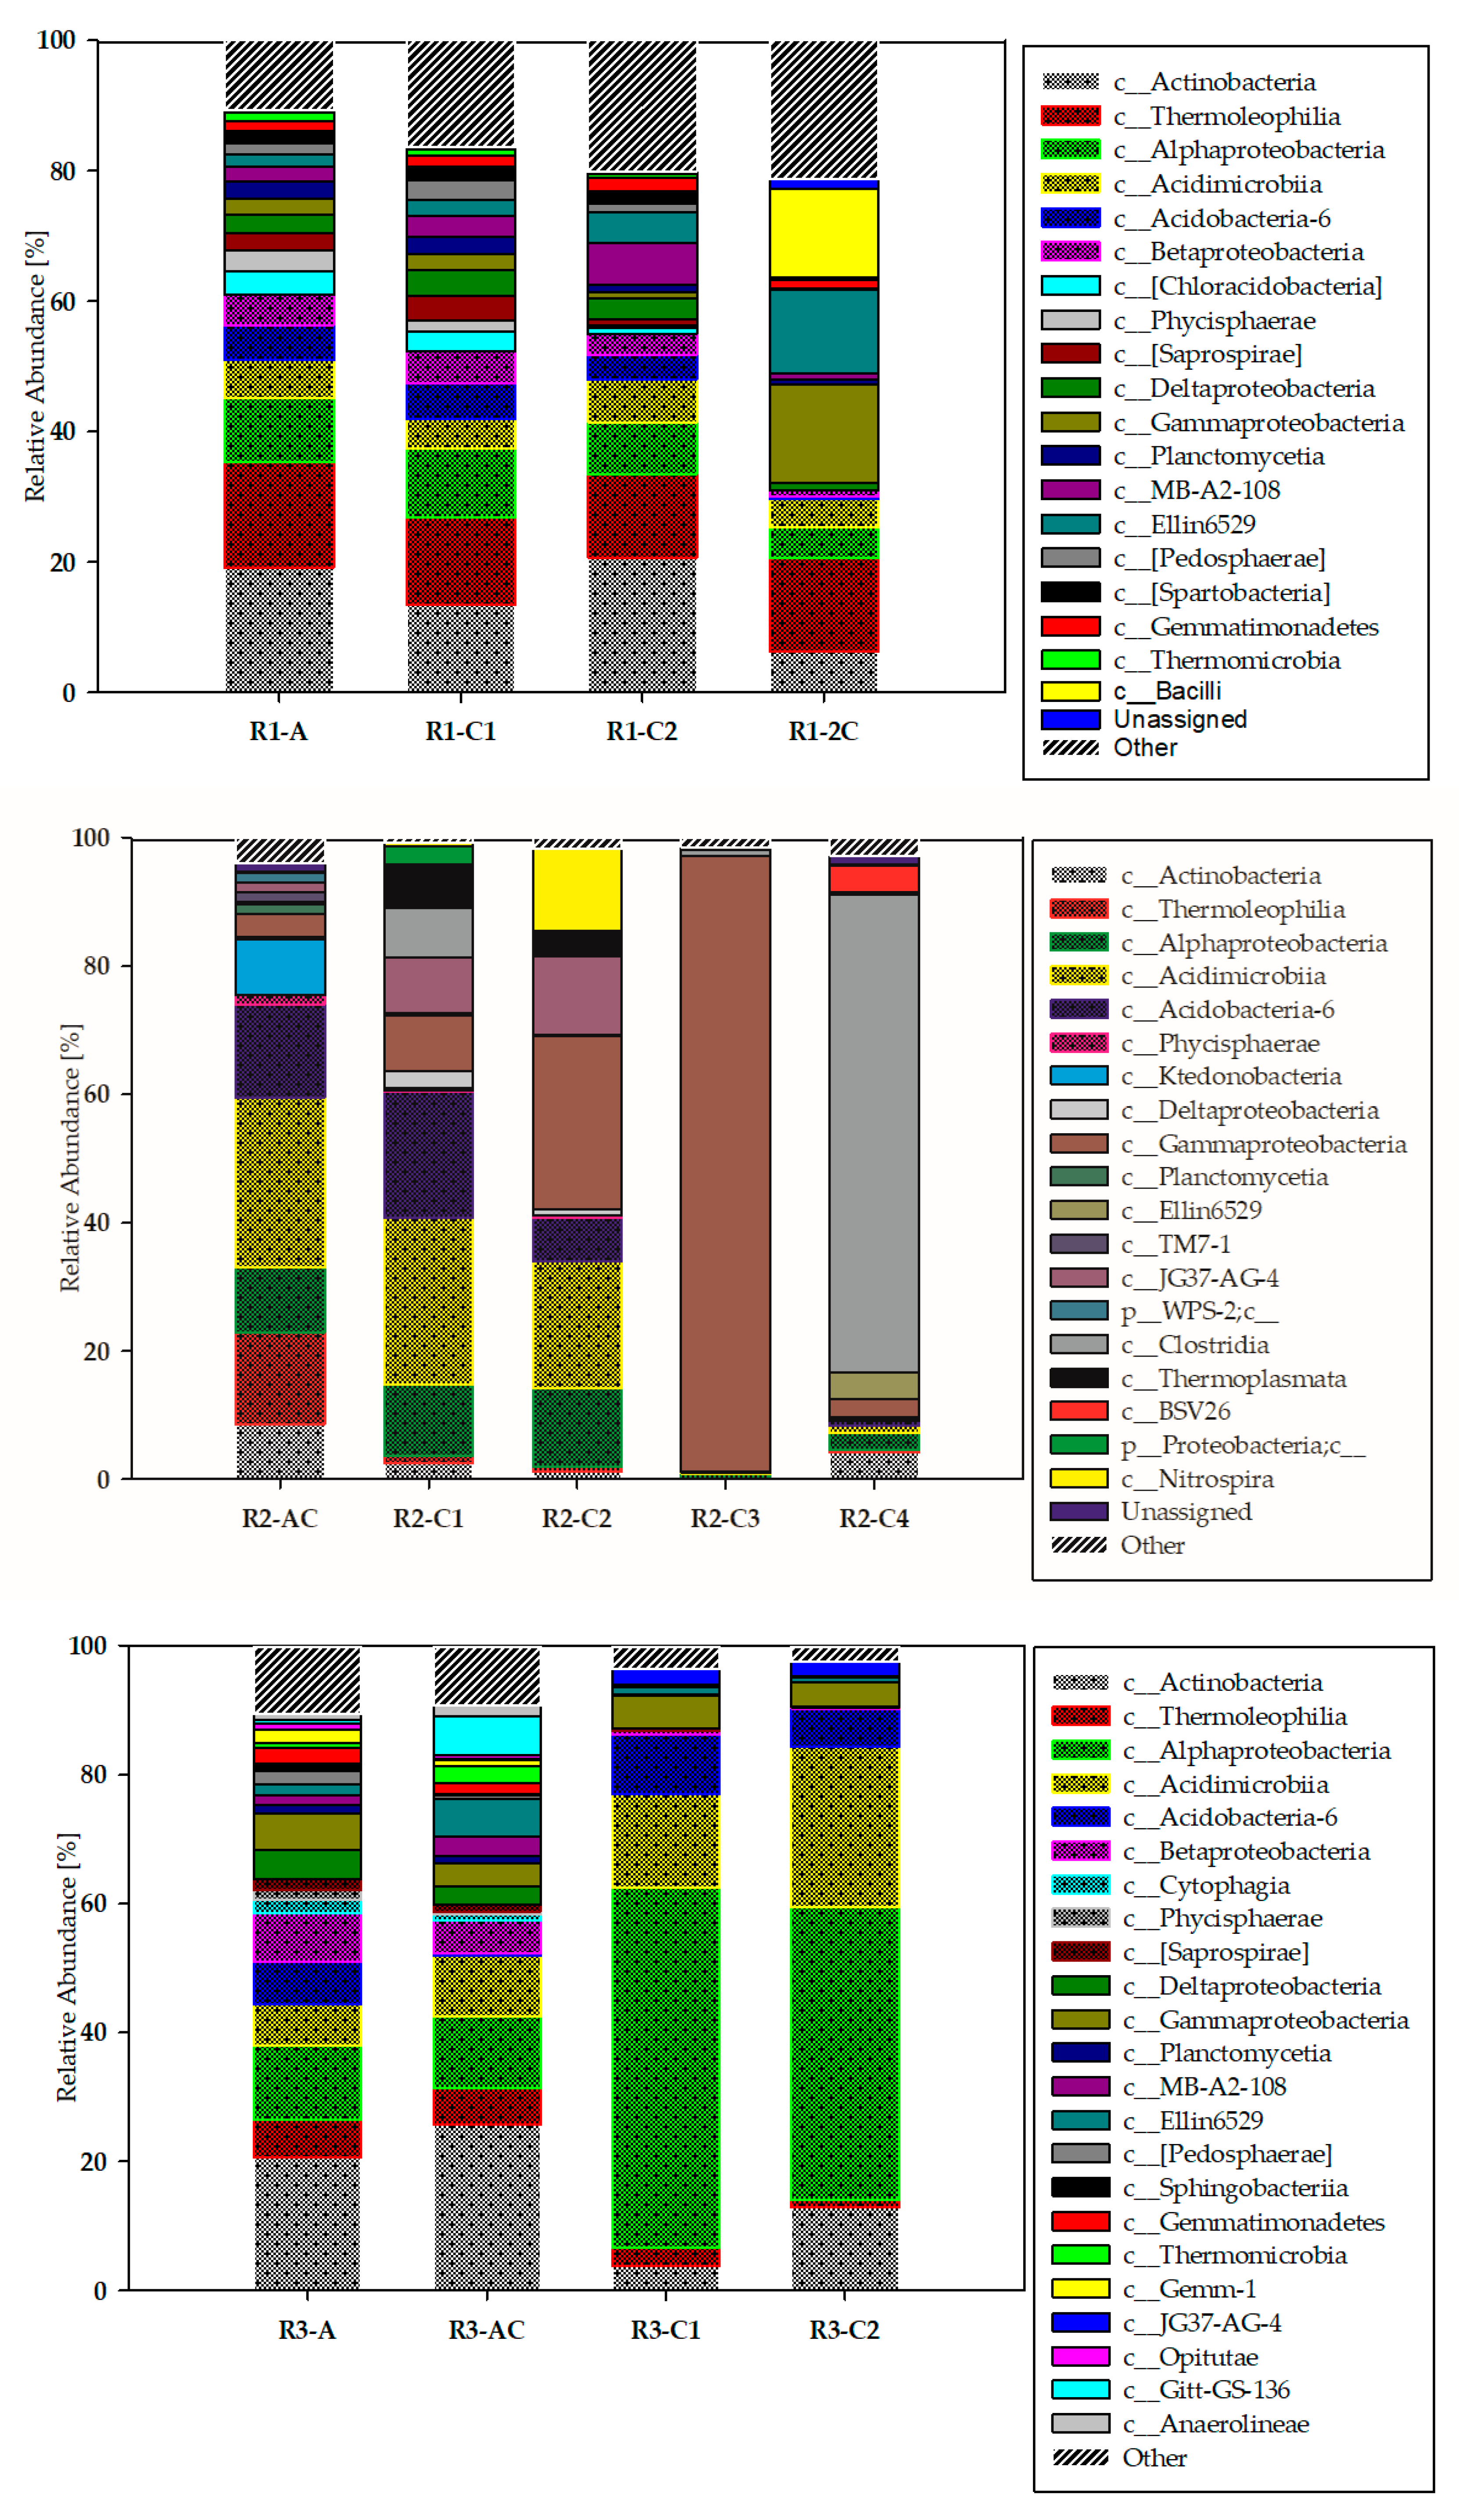
Main classes of bacteria identified by culture independent technique in the three studied soil profiles (R1, R2 and R3) are presented in Figure 2.
At this taxonomic level, a large variation in bacterial structure was found depending on soil properties being the final effect of reclamation process. Moreover, biodiversity decreasing trend with soil depth was observed. It was the most visible in the deeper layers of R2 and R3 profiles (Figure 2). In the case of strongly acidic R2 profile representing an area where reclamation process failed, in R2-C3 horizon Gammaproteobacteria were found as dominants (96.14%) whereas in R2-C4 Clostridia (74.35%) was a predominant taxon. In R3 profile, the deepest horizons (R3-C1 and R3-C2) were dominated by Alphaproteobacteria (55.84% and 45.44%, respectively), followed by Acidimicrobiia (14.51–24.90%), Actinobacteria (3.80–12.85%), Acidobacteria-6 (5.88–9.24%), and Gammaproteobacteria (3.80–4.95%). In R1 profile, domination of Actinobacteria (6.34–20.70%) was determined followed by Thermoleophilia (12.73–16.14%) and Alphaproteobacteria (4.65–10.54%). The bacterial structure on the class level in the deepest studied R1 horizon (R1-2C) differed most from the other layers (Figure 2). In that horizon, Gammaproteobacteria and Ellin 6529 classes achieved the highest abundance amounting 15.07% and 12.87%, respectively.

3.3. Beta-Diversity in the Studied Technosols—Genera Taxonomic Level

A network-like Venn-diagrams, illustrating bacterial preferences for colonization of the various parts of soil profiles (surface, subsurface, subsoil) is shown in Figure S2 (Supplementary material). The division of the studied soils into these three zones was explained in Section 2.3. Not surprisingly, the majority of bacteria were found in the surface horizons and their number decreased with depth of the soil profile. The shared genera were mostly noted between surface and subsurface parts of technogenic soils meanwhile similarity in bacterial structure was reduced between surface and subsoil layers (Figure S2).
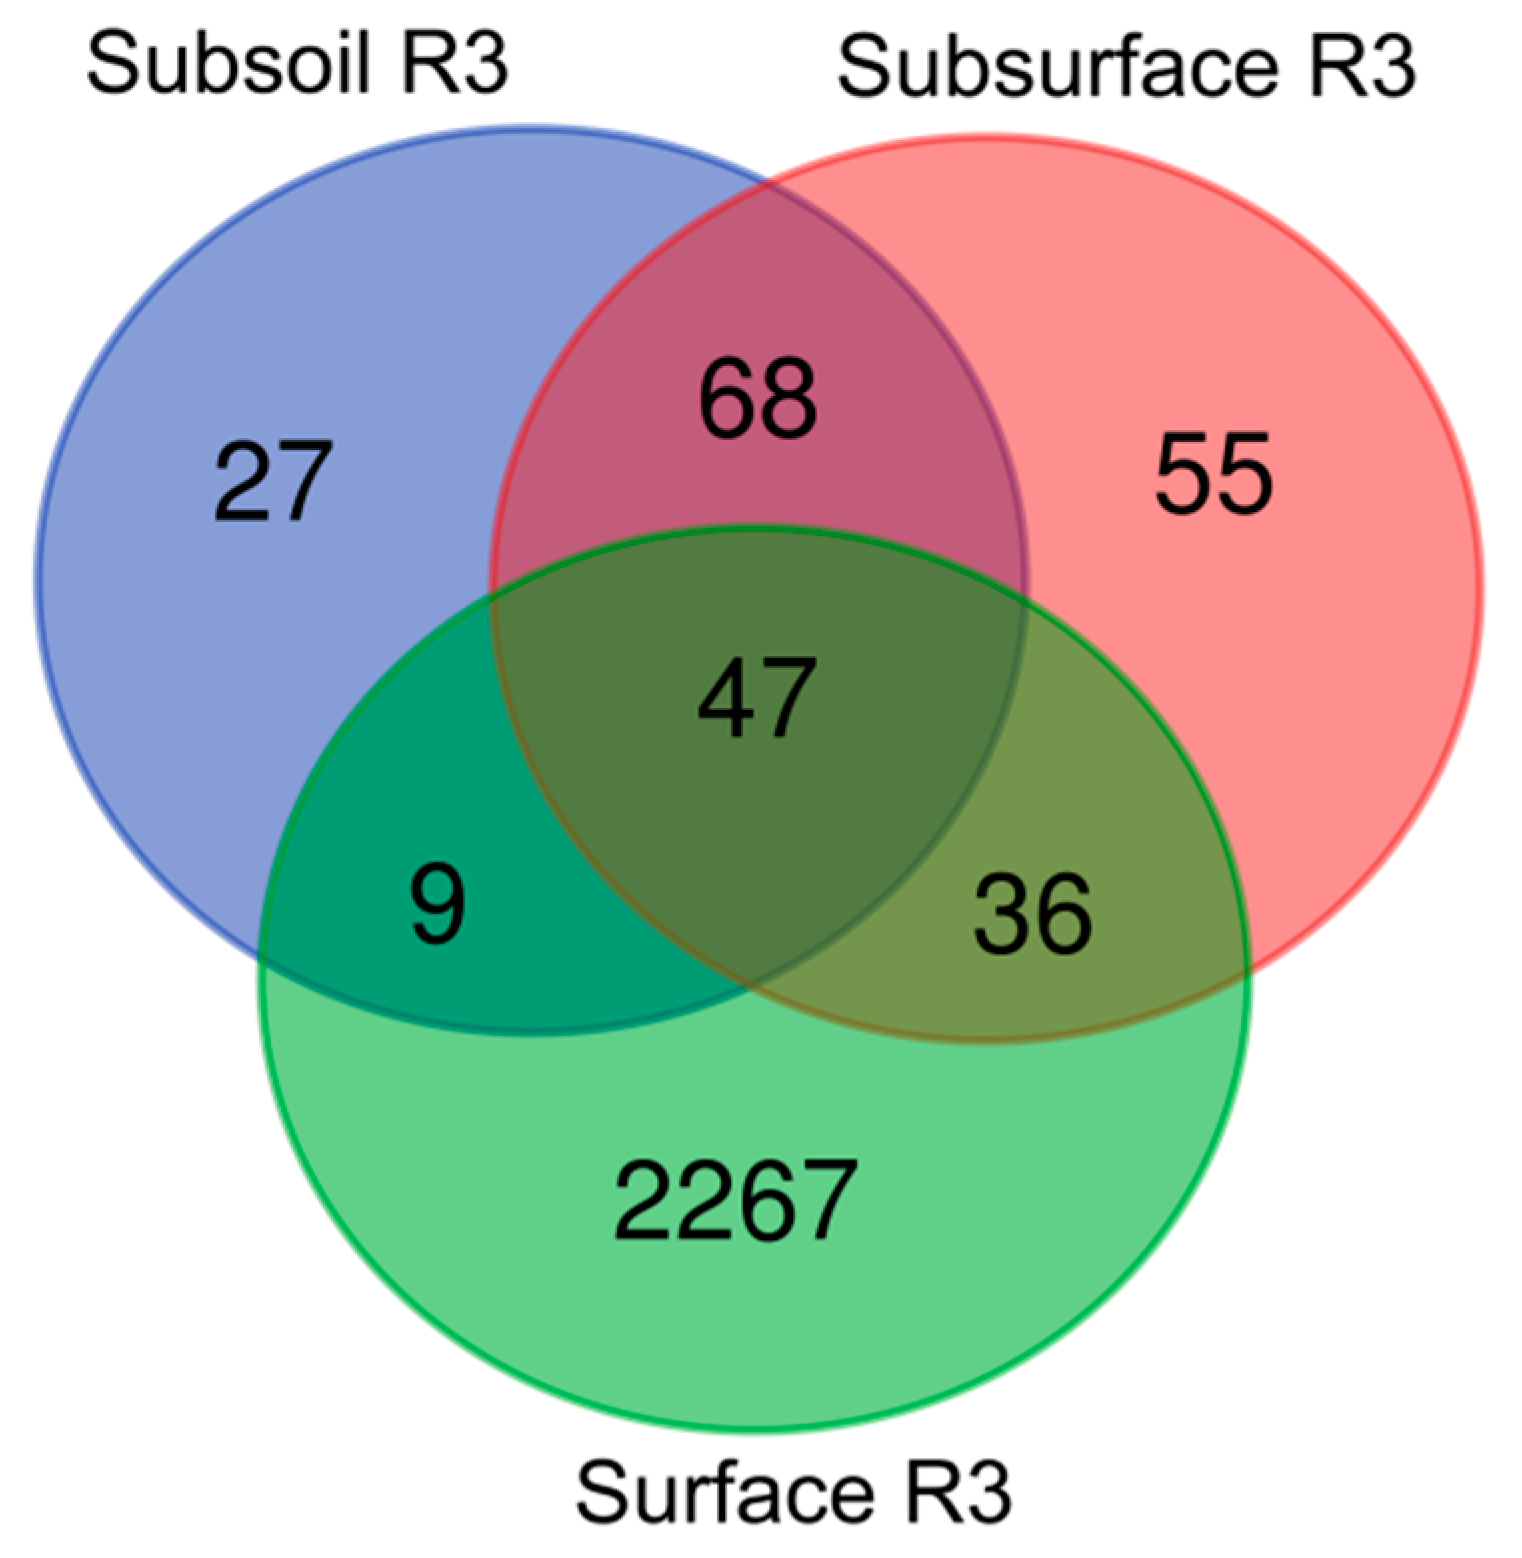
The above observations were also confirmed by Venn diagrams (Figure 3), presenting the numbers of unique and shared core microbiome in the surface, subsurface and subsoil of studied profiles. If one considers surface horizons, it was demonstrated that the highest bacterial genera abundance occurred in the surface layer of profile (R3), followed by the surface layer of profile (R1) (both with favourable chemical properties), whereas the lowest abundance was noted in the surface layer of R2 profile with unfavourable chemical properties (Figure 3).
A slightly different trend was noticed in relation to the subsurface layers, where by far the largest number of bacterial genera representatives (491) was found in the R1 profile, followed by R3 (55) and R2 (22) profiles. Also, in respect to subsoil layer, those from R1 and R2 profiles seemed to be the most willingly inhabited (462 and 148 of bacterial genera, respectively) whilst the deepest part of profile R3 was not an optimal niche for microorganisms to live (presence of 27 genera representatives were confirmed).
In general, NGS resulted in identification of 7747 bacterial genera in all (13) studied soil samples (Table S3, Supplementary material). The top bacterial genera with abundance above 10% of all sequences were selected and summarized in Table 1.
Acidiphilium and Gaiella representatives were present both in the surface, subsurface and subsoil horizons of technogenic soils, however their presence depended on soil chemical properties being the final reclamation final effect (Table 1; Table S3, Supplementary material). Gaiella was found in R1 profile, whilst Acidiphiliumin R2 profile surface and subsurface part and R3 profile subsurface and subsoil zones. Acidothermus and Metallibacterium presence were confirmed in R2 profile surface and subsurface soil layers. Sulfurifustis inherence in the abundance >10% of sequences was noted in R1 profile (surface and subsoil part). The subsurface and subsoil parts of strongly acidic R2 profile seemed to be an adequate niche for Acidithiobacillus and Acidocella colonization.
Shannon-Wiener values proved that the highest biodiversity was typical of R3 profile, where H′ oscillated between 2.880–6.272, reaching maximum values in surface horizons and showing a decrease with increasing soil depth. High diversity of bacteria (H′ 5.930–6.140) occurred also in the topsoil of R1 profile, however in the deepest parts diversity decreased (H′ 2.830–2.339). In R2 profile H′ index reached maximal level (4.265) only in the surface horizon and then with increase of depth diversity of bacteria declined.
Remaining top bacterial genera with abundance above 10% of all sequences included in Table 1 were characteristic for either surface, subsurface or subsoil parts of the studied Technosols. In the surface layers of R2 profile presence of Conexibacter, Granulicella and Candidatus Udaerobacter were confirmed, meanwhile Nocardioides and Streptomyces were identified in the surface parts of R1 and R3. The subsurface layers of R2 and R1 profiles were dominated by Leptospirillum and Kribbella, respectively (Table 1). The relatively high biodiversity occurred also in the deepest part (subsoil) of the technogenic soils. Pseudonocardia, Jatrophihabitants, Alakanibacter and Ferrithrix seemed to be characteristic genera for R3 profile (Table 1). Bacillus, Paenisporosarcina, Psychrobacter and Serratia presence were noted in the deepest part of R1 profile, whereas Desulfosporosinus and Cellulomonas were able to colonize the subsoil layer of R2 profile. The above observations were also confirmed by the calculated values of the biodiversity indices (Table 2).
The C3 horizon of R2 profile (sampleR2-C3) was characterized by the lowest diversity (H′ = 0.335). Simpson index of dominance (1/D) expressing ‘appreciable’ the number of species amounted to 0.8635–0.9927, 0.6206–0.9924 and 0.0881–0.9626 in R3, R1 and R2 profile, respectively (Table 2).
Such a trend undoubtedly indicates a direct relationship between biodiversity recovery and soil chemical properties being the effect of reclamation process. It should be pointed that in fact R3 and R1 soil profiles were characterized by a higher number of bacteria, represented in a smaller number (<10% of the sequences, Table S3, Supplementary material), whereas biodiversity in R2 was mostly restricted to the presence of the genera that were predominant (>10%), shown in Table 1.

3.4. Bacterial Community-Level Physiological Profiles—Biolog®EcoPlates™

The Biolog®EcoPlates™ technique was applied to characterize metabolic changes in soil communities. The calculated Shannon-Wiener index in respect to functional diversity (Table 3) confirmed that both the highest biodiversity and metabolic activity occurred in the surface parts of the soil profiles, where H′ amounted 3.219–3.286, 2.713–2.836 and 3.210–3.288 for R1, R2 and R3 profiles, respectively.
The H′ decreased with soil depth to the values of: 2.736 (R3 profile), 2.636 (R1 profile) and 1.875 (R2 profile). The calculated evenness (E) index was maintained at a level of 0.983–1.248 for R1 profile, and 0.980–1.338 for R3 profile. In respect to R2, E was detected only in the surface layer (1.066), what undoubtedly testified about unfavourable soil chemical properties (strong acidity) due to failed reclamation effect.
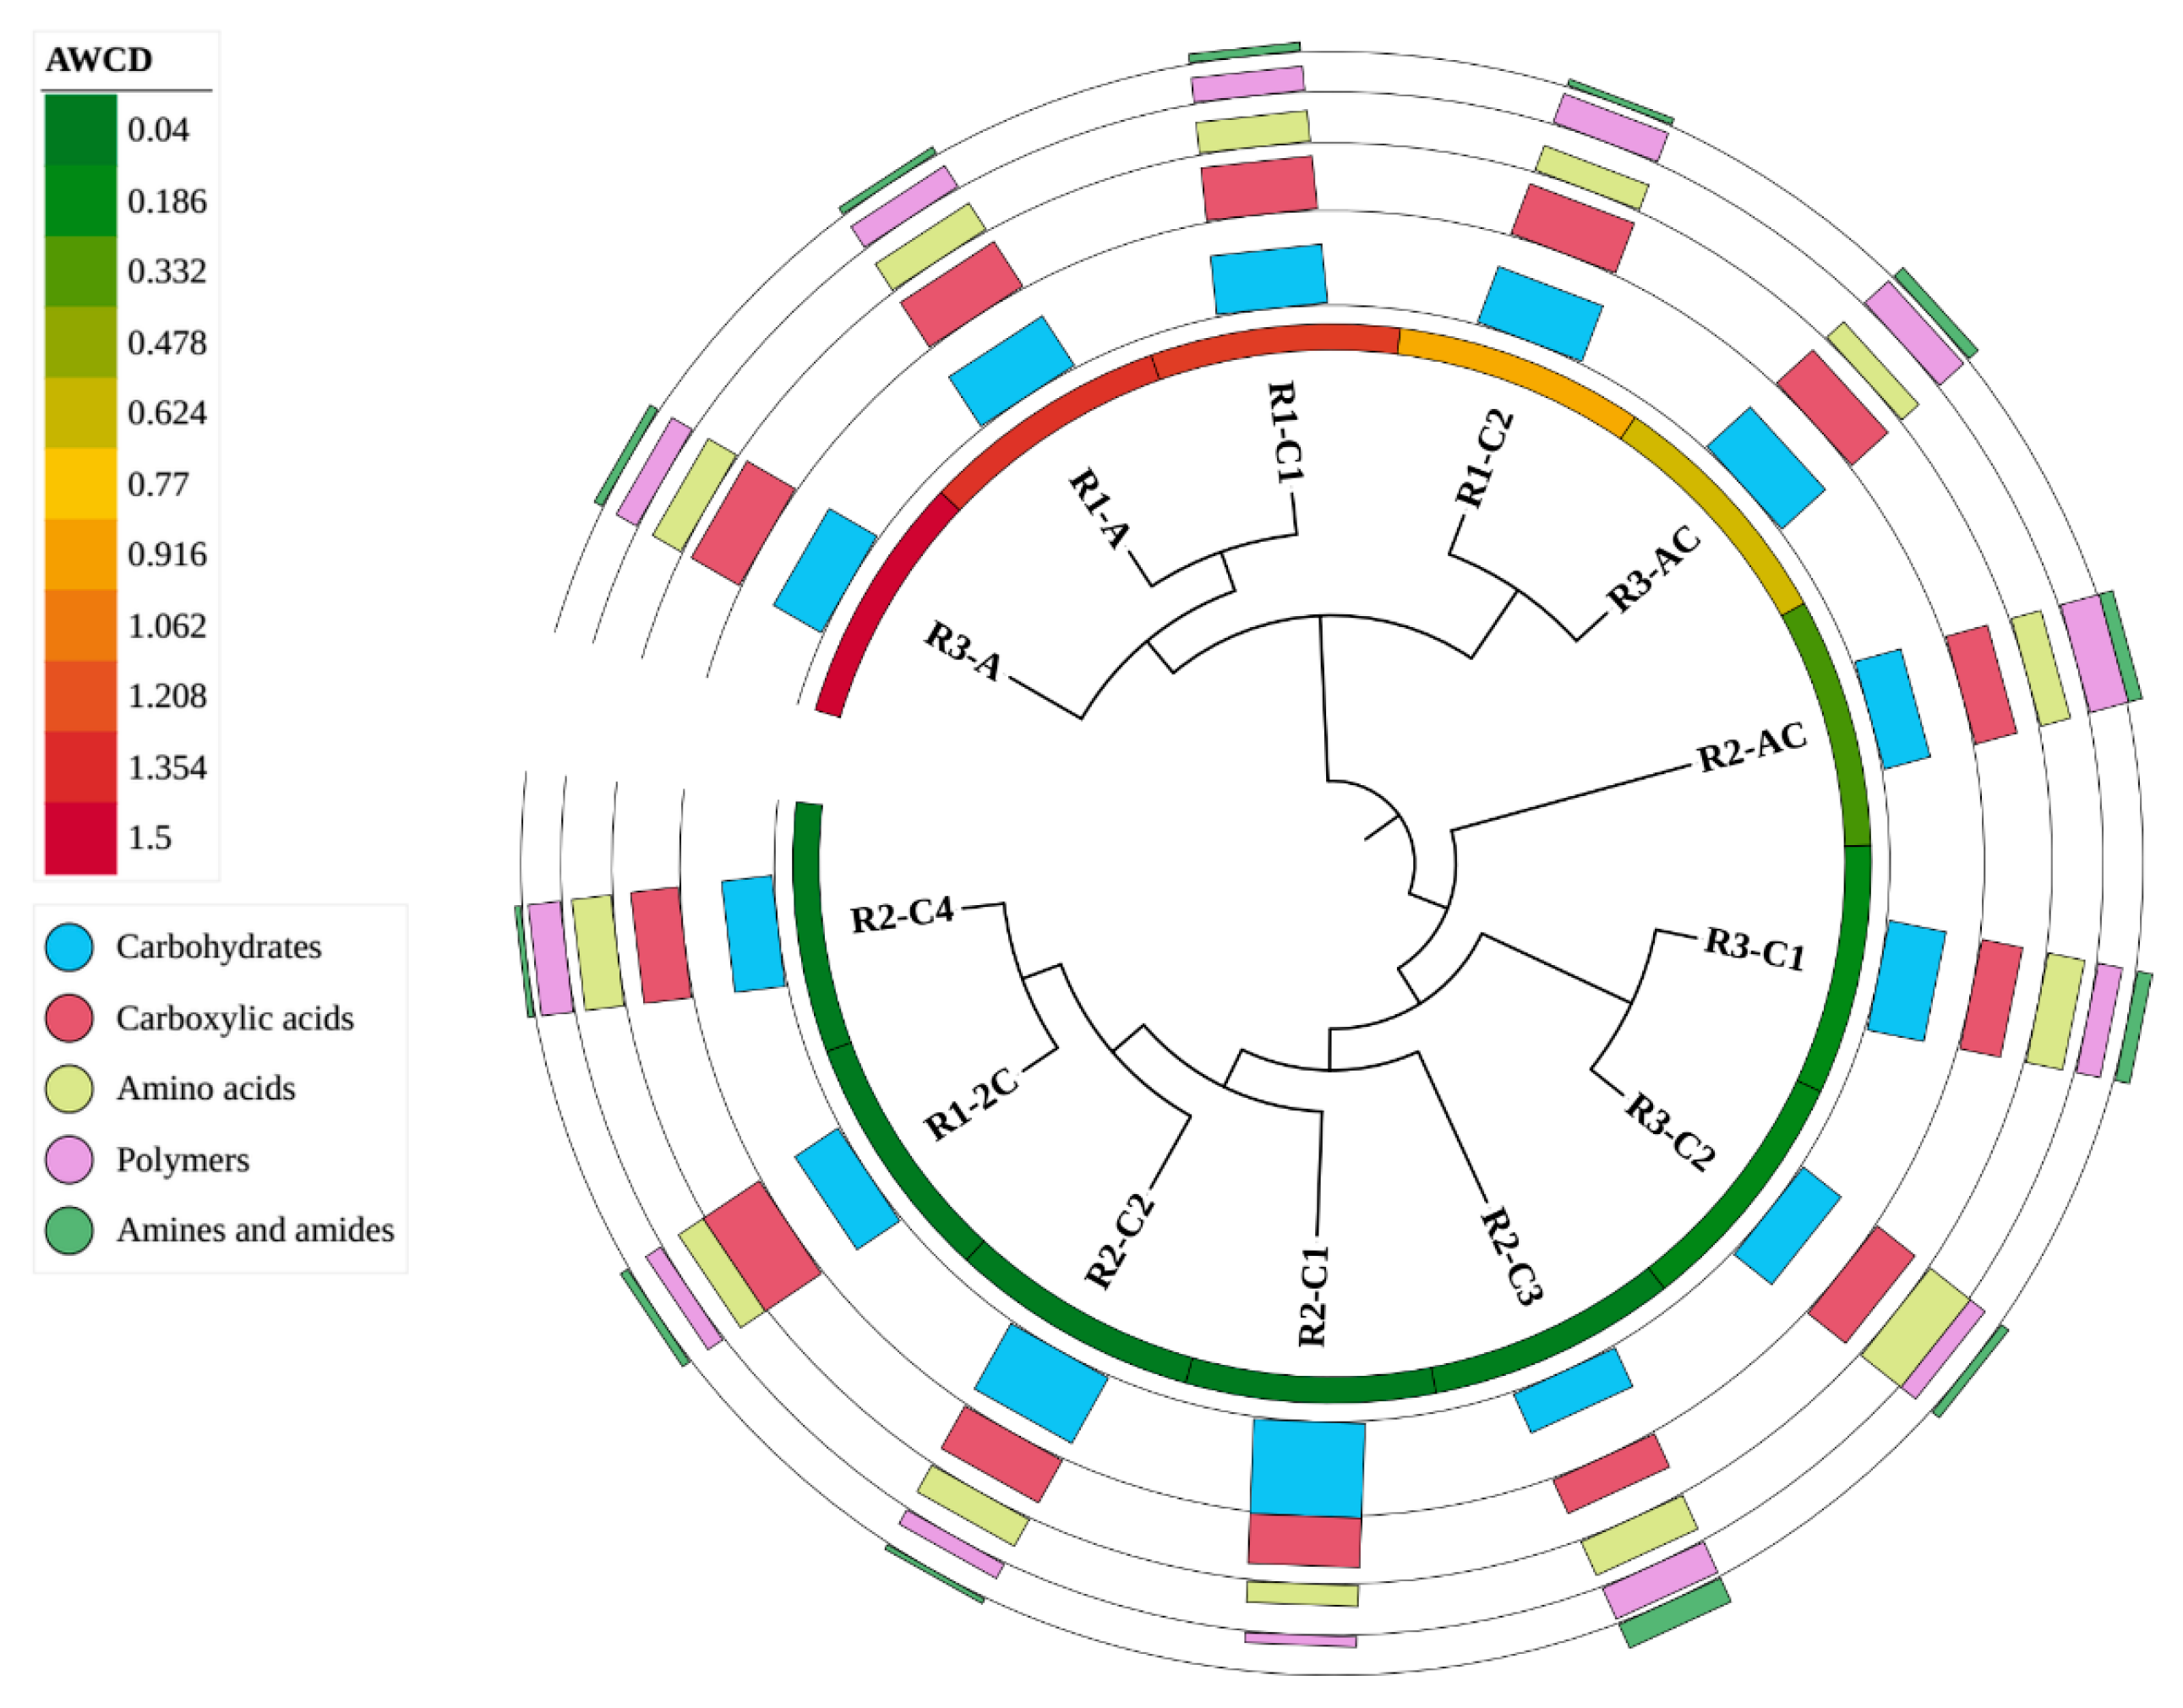
Effect of phenotyping analysis based on results of CLPP technique was presented in Figure 4. The highest average well colour development (AWCD) index was calculated for surface horizon of R3 profile (1.497) and R1 profile (1.329), whereas the lowest was in the surface horizon of R2 profile (0.314). This testify that the highest metabolic levels occurred in the surface parts of technogenic soils profiles, where also biodiversity was the highest. AWCD displayed decreasing trend with soil depth and it was low in deepest parts of each soil profile (AWCD amounted 0.041; 0.048 and 0.048 in R1-2C, R2-C4 and R3-C2 horizons).
It was found that carbohydrates, carboxylic acids, and amino acids were the most preferentially utilized by soil bacteria inhabiting technogenic soils. Polymers seemed to be less preferable carbon source meanwhile usage of amines and amides was the lowest (Figure 4). The mean of carbohydrates usage oscillated between 32.68%, 35.43% and 31.37% for R1, R2 and R3 profile, respectively.
Carboxylic acids were metabolized as follows: 30.22–38.66% (R1), 20.82–28.27% (R2) and 23.61–27.92% (R3), whereas amino acids: 14.96–17.89% (R1), 11.91–22.38% (R2) and 13.07–29.23% (R3) (Figure 4). The mean utilization of the substrates from polymer group was the highest in R2 profile (5.81–22.78%), followed by R3 profile (10.69–18.54%) and the lowest in R1 profile (10.14–17.42%). The weakest utilization was stated for amines and amides as in general their usage did not exceed 7% and in majority of samples remained on the level of 4.3–6.3%.
R3-A and R1-C1 were the samples in which the most effective substrate utilization was confirmed. Cell growth was observed in 96.66% of wells representing carbohydrates and in 100% of wells representing the remaining substrates. R2-C4 was the least effective sample which indicated cell growth in 53.33% of wells representing carbohydrates, 44.44%—carboxylic acids and amino acids, and 41.66%—polymers. Moreover, the R2-C4 sample did not indicate the cell growth in any of wells representing amines and amides.
Based on the results obtained with the Biolog®EcoPlate™ method, a heat map was constructed (Figure 5). As shown below, the heat map also facilitated identification of differences in the preferences of the microorganisms for the utilization of the carbon sources. The highest metabolic activity was observed in the soils from the sample R3-A, whereas a slightly lower catabolic activity was noted in the R2-C4 and R2-C1 (Figure 5).
Nevertheless, these differences depended on the type of metabolized substrate and the effect of reclamation. The i-Erythritol, alpha-Ketobutyric Acid, Itaconic Acid, Glycyl-L-Glutamic Acid, D-Galactonic Acid gamma-Lactone, L-Serine and alpha-Cyclodextrin were characterized by the highest utilization rate in the soil of R3-A. Also the beta-Methyl-DGlucoside, Glucose-1-Phosphate, D-Xylose, Phenylethylamine, D-Malic Acid and Glycogen were characterized by the highest utilization rate in the soil of R1-A (Figure 5). We proved that preferences for particular carbon sources utilization by the soil bacterial communities depended on (1) the soil chemical properties being an effect of reclamation and (2) the soil depth.
The samples with the most and the least effective carbon sources utilization were R3-A (median = 1.587, 95%CI = 1.292/1.832) and R2-C4 (median = 0.000, 95%CI = 0.000/0.012), respectively (Figure S3, Supplementary material). The results showed that metabolic activity determined by CLPP technique could be a good indicator of soil properties showing the reclamation process effectiveness in the studied Technosols.

4. Discussion

We previously proved that an area of the abandoned mine in Rudki seems to be a perfect place to examine the relationship between soil chemical characteristics, microbiological activity and culturable bacteria diversity in Technosols after land reclamation conducted in 1970s [5]. Herein, we extended our microbiological analyses and determined the biodiversity of the bacteria using a culture independent technique to which we added a picture of their metabolic activity using the community level physiological profiling (CLPP) technique. The present study gives a comprehensive insight into Technosols biodiversity and catabolic activity and is a part of contemporary study trend regarding microbiological properties of Technosols [55,56,57,58]. Physical and chemical features of the studied soil profiles were described in detail in our previous papers [2,3,4,5,39], however a short summary of soil properties was shown in “Materials and methods” section and in Table S1 (Supplementary material) in order to allow for a better understanding of further discussion of soil biodiversity.
In the present study, we hypothesized that both culture-independent bacterial biodiversity and metabolic activity is related with soil properties and soil depth, as well as could be an adequate indirect indicators of reclamation process effectiveness in technogenic soils. The obtained results seem to confirm the validity of this hypothesis. As previous reports on Technosols microbiological properties were limited to determination of their enzymatic activities, microbial biomass [16,17,18,56,58] and culturable autochthonous microbiota structure [5,19,20,39], herein we attempted to determine the biodiversity of these soils with the use of culture-independent technique. By using NGS tools, biodiversity of bacteria at taxonomic levels of phyla, classes and genera in three different profiles of Technosols was recognized. Hafeez et al. [57] indicated that at the phyla and classes taxonomic levels microbial community structure in constructed Technosols remained in very close similarity to “natural” soils. Starting from the highest taxonomic level, the dominance of Proteobacteria and Actinobacteria was demonstrated in the studied technogenic soils (Figure 1). Other study reported that Proteobacteria dominance in Technosols were supported by: Bacteroidetes, Firmicutes, Chloroflexi, and Actinobacteria presence [57]. Proteobacteria, Acidobacteria and Bacteroidetes were found as dominant phyla in a Technosols historically contaminated by the burning of chemical ammunitions [56]. The fact that Proteobacteria dominated in the soil environment is well known [6,8,9,56,57], however current results evidenced that Proteobacteria are able to colonize not only the topsoil but also the subsoil, what remains in agreement with other studies [59,60]. However, the fact that these bacteria possess ability for adaptation to unfavourable environmental conditions (strong acidity), as in the whole R2 profile or in deeper part of R3 profile (Figure 1) is a new finding. On the other hand, deeper parts of R2 profile (C3 and C4 horizons) with strong acidity and high salinity are microbiologically interested because domination of both Proteobacteria and Planctomycetes was stated (Figure 1). This shows the high resistance of these phyla to unfavourable environmental conditions and the ability to live in soil with low pH, high salinity, and low concentration of soil organic matter. Members of the bacterial phylum Planctomycetes are known to be able to inhabit a wide range of aquatic and terrestrial environments with diverse environmental conditions, i.e., polar desert soils at the northern land limit of the arctic polar region [61] and low-temperature environments (i.e., boreal wetlands) [62,63]. Also it was suggested that Planctomycetes participate in degradation of plant-derived polymers, exoskeletons of peat-inhabiting arthropods, as well as exopolysaccharides produced by other bacteria [63]. However, till now there was no information about their abundant occurrence in strongly acidic Technosols developed from mine wastes containing Fe sulphides. That finding suggests that Planctomyctes (Figure 1) could inhabit soil having extreme properties even after reclamation process failure. In contrary, Actinobacteria abundance could be recommended as potential indicator of effectiveness of reclamation, as they were present in higher abundance in R1 and R3 profiles rather than in R2, where their presence was limited to surface horizons. Very interesting findings were noted in respect to Verrucomicrobia, Bacteroidetes and Gemmatimonadetes phyla (Figure 1) whose presence was not demonstrated at all in strongly acidic R2 profile. This proves that mentioned phyla can be treated as indirect indicators of the reclamation process success, whilst the recorded lack of their presence in the profile representing an area where reclamation failed confirms the ineffectiveness of the reclamation attempt.
On the classes taxonomic level, Gammaproteobacteria and Clostridia could be undoubtedly treated as indicators of reclamation ineffectiveness in Technosols developed from mine wastes containing Fe sulphides, as both group dominated in the deepest parts of R2 profile (Figure 2). The ability for colonizing acidic soils by Gammaproteobacteria and Clostridia were reported previously [64,65], however their great abundance was generally noted in the surface soil layers [56,64,65], whereas in the present study we found that this bacteria representatives are also able to colonize the subsoil parts. Moreover, Gammaproteobacteria dominance was confirmed in Technosols constructed for remediation of a contaminated industrial wasteland [57] as well as in Technosols contaminated with arsenic [56].
Our study at genera taxonomic level showed that, if one considers surface soil horizons, the highest bacterial abundance occurred in surface horizons of R3 and R1 profiles where reclamation processes improved soil properties, whereas the lowest abundance was noted in the surface horizons of R2 profile representing an area where reclamation process failed. This trend was confirmed by biodiversity indices (Table 2), especially by H′ index that reached the highest values in R3 profile, then in surface part of R1 profile, whilst the lowest H′ value was noted in R2 profile. In general, higher biodiversity represented by genera at lower abundance <10% was typical of R3 and R1 profiles having favourable and partly favourable properties and representing successfully reclaimed areas, whereas in strongly acidic R2 profile where reclamation failed, mostly genera of large numbers (>10% sequences, Table 1) were present. All of noted genera in R2 profile (Conexibacter, Acidothermus, Granulicella, Metallibacterium, Acidithiobacillus, Acidocella, Leptospirillum, Desulfosporosinus, Cellulomonas) could be treated as potential indicators testifying about inefficiency of reclamation process in Technosols developed from mine wastes containing Fe sulphides. In majority, they are represented by genera preferring acidic conditions as their optimal niche for colonization and are classified as sulphur oxidizing bacteria [66,67]. Therefore, their presence in such extreme environment as strongly acidic technogenic soils containing Fe sulphides is justified. Leptospirillum presence was also noted in Technosols contaminated by the burning of chemical ammunitions [56]. The success of reclamation processes can be proved by the abundance (>10%) of genera: Nocardioides, Streptomyces, Pseudonocardia, Jatrophihabitans, Alkanibacter, Ferrithrix (Table 1). Actinobacteria is a phylum and class of Gram-positive bacteria that are ubiquitous in nature, also in the soil environments [68]. Their presence in soil is usually beneficial as they can: (1) be utilized as biofertilizers for sustainable agriculture, (2) enhance plant growth and soil health though different plant growth promoting attributes, i.e., solubilization of phosphorus, potassium and zinc, production of Fe-chelating compounds and phytohormones, as well as by biological nitrogen fixation [68]. In addition to these important ecological functions, recommendation of Actinobacteria representatives (Nocardioides, Streptomyces, Pseudonocardia, Jatrophihabitans) as indicators of reclamation success in areas where Fe sulphides occur in anthropogenic soil substrates is a new approach. Alkanibacter was noted to be present in soil contaminated with petroleum substances [69] or tetracycline [70], whereas Ferritrix of Firmicutes phylum is mainly known as acidophilic, autotrophic and Fe/S oxidizing bacteria with ability to facilitate bioremediation processes [71] or as microbial methanol-utilizer [72].
Community-level physiological profiling (CLPP) analyses from very diverse environments are frequently used in order to characterize the metabolic versatility of the whole environmental bacterial communities [37]. Despite advantages of CLPP that include the simplicity of the protocol and the largely reduced cost of analysis, many limitations in the use of this approach for complex environmental samples have been previously reported (i.e., preference of fast-growing bacteria in the assay, the data analysis and the interpretation of the CLPP results [73,74,75,76]. However, CLPP is still commonly used to select microorganisms that are able to utilize various carbon compounds and that can be subsequently identified using molecular methods [37,76]. Due to the fact that every bacterial community has a characteristic reaction pattern with different optical density values for different carbon compounds, a specific pattern called a ‘metabolic fingerprint’ is received as an effect of CLPP assay [76,77]. Herein, we applied CLPP, together with NGS, in order to prove that CLPP could be extremely effective in recognizing the influence of soil properties being an effect of land reclamation on microbiological properties of Technosols containing Fe sulphides. Utilization of all substrates in Biolog®EcoPlates™ analysis in studied samples (Figure S3, Supplementary material) clearly demonstrated the differences in metabolic activity of microorganisms which coincided with soil chemical properties (Table S2, Supplementary material) being an effect of reclamation processes, as well as with soil depth. Most of the carbon substrates were more intensively utilized in R3 profile, followed by the surface layers of R1, where soil chemical properties (pH, content of carbonates, TOC, and TN) were favourable due to successful reclamation. We found that carbohydrates and carboxylic acids were the most preferentially utilized by soil bacteria inhabiting technogenic soils. Our results may be supported by the findings of Kenarova et al. [78] and Martinez-Toledo et al. [79] who indicated that heavy metals contaminated soils generate environmental stress, demanding a high energy generation from microorganisms. Consequently, carbon sources with a high energy input, i.e., carbohydrates and carboxylic acids are firstly metabolized [78,79] in contaminated environments. Moreover, it was evidenced that D-Galactonic Acid gamma-Lactone, found in the current study as substrate with the highest utilization in R3, belongs to carbon source that is the most used to induce resistance to heavy metals contamination in microbial communities [78]. Studies on engine-oil contaminated soils have shown that the use of different remediation methods increases the activity of microorganisms and functional richness [80]. It has also been demonstrated that the addition of heavy metals to the sludge affects the decrease of biological activity in the sample [81]. Very low catabolic activity was typical of strongly acidic R2 profile representing an area where reclamation failed. Mentioned trends were reflected by calculated AWCD values, reaching the highest levels in the surface parts of technogenic soils (R3 > R1 > R2). A negative correlation between the AWCD and heavy metals presence in soil environment was noted in other studies [82,83]. Research on Technosols in comparison to forest soil [84] displayed also lower AWCD. The fact that CLPP is a suitable assay for estimation of reclamation results was also confirmed by calculation of Shannon E index (Table 3), focused on the evenness of values across all utilized substrates [76] which remained uncountable (not detectable) in majority of horizons of R2 profile. However, it is worth mentioning that CLPP does not reflect the functional abilities of the entire soil microbial community but that of limited subset of microbial fraction capable to grow on the carbon sources provided in the Biolog®EcoPlates™ [85]. Therefore, in order to receive a comprehensive insight into microbial structure and activity in the heterogeneous soil environment such as Technosols the combination of two techniques (CLPP and NGS) is justified [9,32,86].

5. Conclusions

The combination of two techniques: NGS and CLPP resulted in comprehensive recognition of bacterial biodiversity and their catabolic activity in three Technosols developed from mine wastes containing Fe sulphides in Poland. All soils had different chemical properties being an effect of reclamation processes conducted in 1970s. It was evidenced that changes in microbial structure were the consequence of a combined effect of (1) the soil chemical properties and (2) the soil depth.
The following taxa (from higher to lower taxonomic level) were found in soils representing areas where soil chemical properties were improved by reclamation process: Verrucomicrobia, Bacteroidetes, Gemmatimonadetes, Alphaproteobacteria, Acidimicrobia, Nocardioides, Strepromyces, Pseudonocardia, Jatrophihabitants, Alkanibacter and Ferrithrix. Therefore they can be treated as an indirect microbial indicators of reclamation process success in technogenic soils developed from mine wastes containing Fe sulphides. On the contrary, reclamation ineffectiveness manifested by strong acidity of Technosols of the study area could be confirmed by (1) the lack of the following phyla: Verrucomicrobia, Bacteroidetes and Gemmatimonadetes, as well as (2) the high abundance of the following bacterial representatives: Gammaproteobacteria, Clostridia, Conexibacter, Acidothermus, Granulicella, Metallibacterium, Acidithiobacillus, Acidocella, Leptospirillum, Desulfosporosinus and Cellulomonas.
The CLPP analysis allowed for recognition of microbial preferences for the intensity of carbon substrate utilization by obtaining catabolic fingerprinting. CLPP (analogically like NGS) evidenced that metabolic activity depended on (1) the chemical properties of soils being the result of reclamation process and (2) the soil depth. Most of the carbon substrates were more intensively utilized in topsoil horizons of the successfully reclaimed profile R3 and R1, whereas very low catabolic activity was characteristic for strongly acidic R2 profile where reclamation failed. The most easily utilized group of compounds were as follows: carbohydrates > carboxylic acids > amino acids > polymers > amines and amides.
Our findings indicate that both soil microbial community profiling and bacterial metabolic activity in technogenic soils developed from mine wastes containing Fe sulphides can be a suitable indirect indicators of reclamation process effectiveness of mine waste spoils from iron sulphide mines.

Supplementary Materials

The following are available online at https://www.mdpi.com/2073-4395/10/11/1795/s1, Figure S1: Rarefaction curves for the studied soil samples based on the number of unique sequences (ASVs). Figure S2: Network-like Venn diagrams of the bacterial genera presence in the surface, subsurface and subsoil of the studied soil profiles. Figure S3: Utilization of all substrates in the studied samples based on the analysis with the use of Biolog®EcoPlates™. Table S1: Selected properties of studied Technosols. Table S2: Sequencing data quality. Table S3: Genus_aggregated_percent.

Author Contributions

Conceptualization, A.W. and Ł.U.; methodology, K.W., A.K. and A.G.; software, A.M.-G., J.G. and A.K.; validation, A.K., A.G., J.G. and A.M.-G.; formal analysis, A.W. and Ł.U.; investigation, K.W., A.K. and A.G.; writing—original draft preparation, A.W.; writing—review and editing, A.G. and Ł.U.; visualization, A.K., A.M.-G., J.G. and A.G.; supervision, A.G. and Ł.U.; funding acquisition, A.W. All authors have read and agreed to the published version of the manuscript.

Funding

This research and APC were funded by Faculty of Science and Health of The John Paul II Catholic University of Lublin discipline pool in biological science, grant number 12/2019.

Acknowledgments

The authors thank Anna Sochaczewska in the technical staff fir her help in DNA extraction and PCR reaction performing.

Conflicts of Interest

The authors declare no conflict of interest.

References

  1. IUSS Working Group, WRB. World Reference Base for Soil Resources 2014, update 2015. In International Soil Classification System for Naming Soils and Creating Legends for Soil Maps; World Soil Rep.: Rome, Italy, 2015. [Google Scholar]
  2. Uzarowicz, Ł. Technogenic soils developed on mine spoils containing iron sulfides in select abandoned industrial sites: Environmental hazards and reclamation possibilities. Pol. J. Environ. Stud. 2011, 20, 771–782. [Google Scholar]
  3. Uzarowicz, Ł.; Skiba, S. Technogenic soils developed on mine soils containing iron sulphides: Mineral transformation as indicator of pedogenesis. Geoderma 2011, 163, 95–108. [Google Scholar] [CrossRef]
  4. Uzarowicz, Ł. Microscopic and microchemical study of iron sulphide weathering in a chronosequence of technogenic and natural soils. Geoderma 2013, 197–198, 137–150. [Google Scholar] [CrossRef]
  5. Uzarowicz, Ł.; Wolińska, A.; Błońska, E.; Szafranek-Nakonieczna, A.; Kuźniar, A.; Słodczyk, Z.; Kwasowski, W. Technogenic soils (Technosols) developed from mine spoils containing Fe sulphides: Microbiological activity as an indicator of soil development following land reclamation. Appl. Soil Ecol. 2020, 156, 103699. [Google Scholar] [CrossRef]
  6. Wolińska, A.; Kuźniar, A.; Zielenkiewicz, U.; Izak, D.; Szafranek-Nakonieczna, A.; Banach, A.; Błaszczyk, M. Bacteroidetes as a sensitive biological indicator of agricultural soil usage revealed by culture independent approach. Appl. Soil Ecol. 2017, 119, 128–137. [Google Scholar] [CrossRef]
  7. Wu, Y.; Zeng, J.; Zhu, Q.; Zhang, Z.; Lin, X. pH is the primary determinant of the bacterial community structure in agricultural soils impacted by polycyclic aromatic hydrocarbon pollution. Sci. Rep. 2017, 7, 40093. [Google Scholar] [CrossRef] [Green Version]
  8. Wolińska, A.; Kuźniar, A.; Zielenkiewicz, U.; Banach, A.; Błaszczyk, M. Indicators of arable soils fatigue—bacterial families and genera: A metagenomic approach. Ecol. Ind. 2018, 93, 490–500. [Google Scholar] [CrossRef]
  9. Wolińska, A.; Kuźniar, A.; Gałązka, A. Biodiversity in the rhizosphere of selected winter wheat (Triticum aestivum L.) cultivars—Genetic and catabolic fingerprinting. Agronomy 2020, 10, 953. [Google Scholar] [CrossRef]
  10. Poomthongdee, N.; Duangmal, K.; Pathom-aree, W. Acidophylic actinomycetes from rhizosphere soil: Diversity and properties beneficial for plants. J. Antibiot. 2015, 68, 106–114. [Google Scholar] [CrossRef]
  11. Panyushkina, A.E.; Tsaplina, I.A.; Kondrat’eva, T.F.; Bulaev, A.G. Physiological and morphological characteristics of acidophilic bacteria Leptospirillumferriphilum and Acidithiobacillusthiooxidans, members of a chemolithotrophic microbial consortium. Microbiology 2018, 87, 326–338. [Google Scholar] [CrossRef]
  12. Wang, R.; Lin, J.Q.; Liu, X.M.; Pang, X.; Zhang, C.J.; Yang, C.L.; Gao, X.Y.; Lin, C.M.; Li, Y.Q.; Li, Y.; et al. Sulfur oxidation in the acidophilic autotrophic Acidithiobacillus spp. Front. Microbiol. 2019, 9, 3290. [Google Scholar] [CrossRef]
  13. Mahdavi, A.; Sajedi, R.H.; Rassa, M. Investigation of acid-neutralizing property of Bacillus cereus GUF8. Biomacromol. J. 2017, 3, 18–25. [Google Scholar]
  14. Plotnikova, E.G.; Rybkina, D.O.; Anan’ina, L.N.; Yastrebova, O.V.; Demakov, V.A. Characteristics of microorganisms isolated from technogenic soils of the Kama region. Rus. J. Ecol. 2006, 37, 233–240. [Google Scholar] [CrossRef]
  15. Mangova, K.; Lintnerova, O. Environmental aspects of the low-sulphide post-flotation tailings transformation into anthropogenic soils (Smolnik, Slovakia). Acta Geol. Slov. 2015, 7, 195–212. [Google Scholar]
  16. Santos, E.S.; Abreu, M.M.; Macías, F.; de Varennes, A. Chemical quality of leachates and enzymatic activities in Technosols with gossan and sulphide wastes from the São Domingos mine. J. Soils Sedim. 2016, 16, 1366–1382. [Google Scholar] [CrossRef]
  17. Moreno-Barriga, F.; Díaz, V.; Acosta, J.A.; Muñoz, Á.; Faz, Á.; Zornoza, R. Organic matter dynamics, soil aggregation and microbial biomass and activity in Technosols created with metalliferous mine residues, biochar and marble waste. Geoderma 2017, 301, 19–29. [Google Scholar] [CrossRef]
  18. Ondoño, S.; Bastida, F.; Moreno, J.L. Microbiological and biochemical properties of artificial substrates: A preliminary study of its application as Technosols or as a basis in Green Roof Systems. Ecol. Eng. 2014, 70, 189–199. [Google Scholar] [CrossRef]
  19. Zornoza, R.; Acosta, J.A.; Faz, A.; Bååth, E. Microbial growth and community structure in acid mine soils after addition of different amendments for soil reclamation. Geoderma 2016, 272, 64–72. [Google Scholar] [CrossRef]
  20. Šimonovičová, A.; Ferianc, P.; Vojtková, H.; Pangallo, D.; Hanajík, P.; Kraková, L.; Feketeová, Z.; Čerňanský, S.; Okenicová, L.; Žemberyová, M.; et al. AlkalineTechnosol contaminated by former mining activity and its culturable autochtonous microbiota. Chemosphere 2017, 171, 89–96. [Google Scholar] [CrossRef] [Green Version]
  21. Kumar Awasthi, M.; Ravindran, B.; Sarsaiya, S.; Chen, H.; Wainaina, S.; Singh, E.; Liu, T.; Kumar, S.; Pandey, A.; Singh, L.; et al. Metagenomics for taxonomy profiling: Tools and approaches. Bioengineered 2020, 11, 356–374. [Google Scholar] [CrossRef] [Green Version]
  22. Handelsman, J.; Rondon, M.R.; Brady, S.F.; Clardy, J.; Goodman, R.M. Molecular biological access to the chemistry of unknown soil microbes: A new frontier for natural products. Chem. Biol. 1998, 5, 245–249. [Google Scholar] [CrossRef] [Green Version]
  23. Cowan, D.A.; Arslanoglu, A.; Burton, S.G. Metagenomics, gene discovery, and the ideal biocatalyst. Biochem. Soc. Trans. 2004, 32, 298–302. [Google Scholar] [CrossRef] [PubMed] [Green Version]
  24. Allen, E.E.; Banfield, J.F. Community genomics in microbial ecology and evolution. Nat. Rev. Microbiol. 2005, 3, 489–498. [Google Scholar] [CrossRef] [PubMed]
  25. Wolińska, A. Metagenomic achievements in microbial diversity determination in croplands: A review. In Microbial Diversity in Genomic Era; Das, S., Dash, H.R., Eds.; Academic Press Elsevier: Cambridge, MA, USA, 2019; Volume 2, pp. 15–35. [Google Scholar]
  26. Pershina, E.; Valkonen, J.; Kurki, P.; Ivanova, E.; Chirak, E.; Korvigo, I.; Provorov, N.; Andronov, E. Comparative analysis of prokaryotic communities associated with organic conventional farming systems. PLoS ONE 2015, 10, e0145072. [Google Scholar] [CrossRef] [PubMed] [Green Version]
  27. Handelsman, J. Metagenomics: Application of genomics to uncultured microorganisms. Microbiol. Mol. Biol. Rev. 2004, 68, 669–685. [Google Scholar] [CrossRef] [PubMed] [Green Version]
  28. Lazarevic, V.; Whiteson, K.; Gaïa, N.; Gizard, Y.; Hernandez, D.; Farinelli, L.; Østerås, M.; François, P.; Schrenzel, J. Analysis of the salivary microbiome using culture-independent techniques. J. Clin. Bioinf. 2012, 2, 4. [Google Scholar] [CrossRef] [PubMed] [Green Version]
  29. Neelkanta, G.; Sultana, H. The use of metagenomic approaches to analyze changes in microbial communities. Microbiol. Ins. 2013, 6, 37–48. [Google Scholar] [CrossRef]
  30. Garland, J.L.; Millis, A.L. Classification and characterization of heterotrophic microbial communities on the basis of patterns of community-level sole-carbon-source utilization. Appl. Environ. Microbiol. 1991, 57, 2351–2359. [Google Scholar] [CrossRef] [Green Version]
  31. Gałązka, A.; Gawryjołek, K.; Grządziel, J.; Frąc, M.; Księżak, J. Microbial community diversity and their interaction of soil under maize growth in different cultivation techniques. Plant Soil Environ. 2017, 63, 264–270. [Google Scholar]
  32. Wolińska, A.; Gałązka, A.; Kuźniar, A.; Goraj, W.; Jastrzębska, N.; Grządziel, J.; Stępniewska, Z. Catabolic fingerprinting and diversity of bacteria in MollicGleysol contaminated with petroleum substances. Appl. Sci. 2018, 8, 1970. [Google Scholar] [CrossRef] [Green Version]
  33. Grządziel, J.; Furtak, K.; Gałązka, A. Microorganisms from different types of soil that are characteristic to Poland—A long-term microplot experiment. Sustainability 2019, 11, 56. [Google Scholar] [CrossRef] [Green Version]
  34. Kuźniar, A.; Banach, A.; Stępniewska, Z.; Frac, M.; Oszust, K.; Gryta, A.; Kłos, M.; Wolińska, A. Community-level physiological profiles of microorganisms inhabiting soil contaminated with heavy metals. Int. Agrophys. 2018, 32, 101–109. [Google Scholar] [CrossRef] [Green Version]
  35. Furtak, K.; Gawryjołek, G.; Gajda, A.M.; Gałązka, A. Effects of maize and winter wheat grown under different cultivation techniques on biological activity of soil. Plant Soil Environ. 2017, 63, 449–454. [Google Scholar]
  36. Chou, Y.M.; Shen, F.T.; Chiang, S.C.; Chang, C.M. Functional diversity and dominant populations of bacteria in banana plantation soils as influenced by long-term organic and conventional farming. Appl. Soil Ecol. 2017, 110, 21–33. [Google Scholar] [CrossRef]
  37. Lladó, S.; Baldrian, P. Community-level physiological profiling analyses show potential to identify the copiotrophic bacteria present in soil environments. PLoS ONE 2017, 12, e0171638. [Google Scholar] [CrossRef]
  38. Stefanowicz, A. The Biolog Plate technique as a tool in ecological studies of microbial communities. Pol. J. Environ. Stud. 2006, 15, 669–676. [Google Scholar]
  39. Stępniewska, H.; Uzarowicz, Ł.; Błońska, E.; Kwasowski, W.; Słodczyk, Z.; Gałka, D.; Hebda, A. Fungal abundance and diversity as influenced by properties of Technosols developed from mine wastes containing iron sulphides: A case study from abandoned iron sulphide and uranium mine in Rudki, south-central Poland. Appl. Soil Ecol. 2020, 145, 103349. [Google Scholar] [CrossRef]
  40. Skawina, T.; Trafas, M.; Gołda, T. Recultivation of after-mine areas of the pyrite mine “Siarkopol” at Rudki near Kielce. Zesz. Nauk. AGH 1974, 466, 9–21, (in Polish with English abstract). [Google Scholar]
  41. Gałuszka, A.; Migaszewski, Z.; Duczmal-Czernikiewicz, A.; Dołęgowska, S. Geochemical background of potentially toxic trace elements in reclaimed soils of the abandoned pyrite-uranium mine (south-central Poland). Int. J. Environ. Sci. Technol. 2016, 13, 2649–2662. [Google Scholar] [CrossRef] [Green Version]
  42. Warda, A. Assessment of reclamation effects in “Staszic” mine in Rudki near Kielce. Geomat. Environ. Engin. 2007, 1, 181–196. [Google Scholar]
  43. Soliman, T.; Yang, S.Y.; Yamazaki, T.; Jenke-Kodama, H. Profiling soil microbial communities with next-generation sequencing: The influence of DNA kit selection and technician technical expertise. Peer J. 2017, 5, e4178. [Google Scholar] [CrossRef] [Green Version]
  44. Song, Z.; Schlatter, D.; Kennedy, P.; Kinkel, L.L.; Kistler, H.C.; Nguyen, N.; Bates, S.T. Effort versus reward: Preparing samples for fungal community characterization in high-throughput sequencing surveys of soils. PLoS ONE 2015, 10, e0127234. [Google Scholar] [CrossRef] [PubMed] [Green Version]
  45. Thikjs, S.; Op De Beeck, M.; Beckers, B.; Truyens, S.; Stevens, V.; Van Hamme, J.D.; Weyens, N.; Vangronsveld, J. Comparative evaluation of four bacteria-specific primers pairs for 16S rRNA gene surveys. Front. Microbiol. 2017, 8, 494. [Google Scholar]
  46. Callahan, B.J.; McMurdie, P.J.; Rosen, M.J.; Han, A.W.; Johnson, A.J.A.; Holmes, S.P. DADA2: High-resolution sample inference from Illumina amplicon data. Nat. Meth. 2016, 13, 581–583. [Google Scholar] [CrossRef] [Green Version]
  47. Team, R.C.R. A Language and Environment for Statistical Computing; R Foundation for Statistical Computing: Vienna, Austria, 2018; Available online: https://www.R.-project.org/ (accessed on 20 April 2020).
  48. Kuźniar, A.; Włodarczyk, K.; Grządziel, J.; Woźniak, M.; Furtak, K.; Gałązka, A.; Dziadczyk, E.; Skórzyńska-Polit, E.; Wolińska, A. New insight into the composition of wheat seed microbiota. Int. J. Mol. Sci. 2020, 21, 4634. [Google Scholar] [CrossRef] [PubMed]
  49. Murali, A.; Bhargava, A.; Wright, E.S. IDTAXA: A novel approach for accurate taxonomic classification of microbiome sequences. Microbiome 2018, 6, 140. [Google Scholar] [CrossRef]
  50. Shannon, P.; Markiel, A.; Ozier, O.; Baliga, N.S.; Wang, J.T.; Ramage, D.; Amin, N.; Schwikowski, B.; Ideker, T. Cytoscape: A software environment for integrated models of biomolecular interaction networks. Genome Res. 2003, 13, 2498–2504. [Google Scholar] [CrossRef]
  51. Pohland, B.; Owen, B. BiologEcoPlates standard methods. TAS Tech. Biul. Biol. 2009, 1, 1–3. [Google Scholar]
  52. Hammer, Ø.; Harper, D.A.T.; Ryan, P.D. Past: Paleontological statistics software package for education and data analysis. Palaeontol. Electron. 2001, 4, 1–9. [Google Scholar]
  53. Letunic, I.; Bork, P. Interactive tree of life (iTOL): An online tool for phylogenetic tree display and annotation. Bioinformatics 2007, 23, 127–128. [Google Scholar] [CrossRef] [Green Version]
  54. Frąc, M.; Oszust, K.; Lipiec, J. Community level physiological profiles (CLPP), characterization and microbial activity of soil amended with dairy sewage sludge. Sensors 2012, 12, 3253–3268. [Google Scholar] [CrossRef] [Green Version]
  55. Hafeez, F.; Spor, A.; Breuil, M.C.; Schwartz, C.; Martin-Laurent, F.; Philipoot, L. Distribution of bacteria and nitrogen-cycling microbial communities along constructed Technosol depth-profiles. J. Hazard. Mater. 2012, 231, 88–97. [Google Scholar] [CrossRef]
  56. Thouin, H.; Battaglia-Brunet, F.; Norini, M.P.; Joulian, C.; Hellal, J.; Le Forestier, L.; Dupraz, S.; Gautret, P. Microbial community response to environmental changes in a technosol historically contaminated by the burning of chemical ammunitions. Sci. Total Environ. 2019, 697, 134108. [Google Scholar] [CrossRef] [Green Version]
  57. Hafeez, F.; Martin-Laurent, F.; Beguet, J.; Bru, D.; Cortet, J.; Schwartz, C.; Morel, J.L.; Philippot, L. Taxonomic and functional characterization of microbial communities in Technosols constructed for remediation of a contaminated industrial wasteland. J. Soils Sedim. 2012, 12, 1396–1406. [Google Scholar] [CrossRef]
  58. Piotrowska-Długosz, A.; Charzyński, P. The impact of the soil sealing degree on microbial biomass, enzymatic activity, and physicochemical properties in the Ekranic Technosols of Toruń (Poland). J. Soils Sedim. 2015, 15, 47–59. [Google Scholar] [CrossRef] [Green Version]
  59. Celestina, C.; Wood, J.L.; Manson, J.B.; Wang, X.; Sale, P.W.G.; Tang, C.; Franks, A.E. Microbial communities in top-and subsoil of repacked soil columns respond differently to amendments but their diversity is negatively correlated with plant productivity. Sci. Rep. 2019, 9, 8890. [Google Scholar] [CrossRef]
  60. Polain, K.; Knox, O.; Wilson, B.; Pereg, L. Subsoil microbial diversity and stability in rotational cotton systems. Soil Syst. 2020, 4, 44. [Google Scholar] [CrossRef]
  61. Ivanova, A.A.; Kulichevskaya, I.S.; Merkel, A.Y.; Toshchakov, S.V.; Dedysh, S.N. High diversity of Plantcomycetes in soils of two lichen-dominated sub-arctic ecosystems of northwestern Siberia. Front. Microbiol. 2016, 7, 2065. [Google Scholar] [CrossRef] [Green Version]
  62. Ivanova, A.A.; Wegner, C.E.; Kim, Y.; Liesack, W.; Dedysh, S.N. Identification of microbial populations driving biopolymer degradation in acidic peatlands by metatranscriptomic analysis. Mol. Ecol. 2016, 25, 4818–4835. [Google Scholar] [CrossRef]
  63. Dedysh, S.N.; Ivanova, A.A. Planctomycetes in boreal and subarctic wetlands: Diversity patterns and potential ecological functions. FEMS Microbiol. Ecol. 2019, 95, fiy227. [Google Scholar] [CrossRef] [Green Version]
  64. Hermans, S.M.; Buckley, H.L.; Case, B.S.; Curran-Cournane, F.; Taylor, M.; Lear, G. Bacteria as emerging indicators of soil condition. Appl. Environ. Microbiol. 2017, 83, e02826-16. [Google Scholar] [CrossRef] [Green Version]
  65. Kim, H.M.; Jung, J.Y.; Yergeau, E.; Hwang, C.Y.; Hinzman, L.; Nam, S.; Hong, S.G.; Kim, O.S.; Chun, J.; Lee, Y.K. Bacterial community structure and soil properties of a subarctic tundra soil in Council, Alaska. FEMS Microbiol. Ecol. 2014, 89, 465–475. [Google Scholar] [CrossRef]
  66. Sadeghi, P.M.M.; Pourbabaee, A.A.; Alikhani, H.A.; Haidari, A.; Manafi, Z. The diversity of sulfur-oxidizing bacterial populations at an Iranian copper mine and the surrounding agricultural soils. Appl. Ecol. Environ. Res. 2016, 14, 509–533. [Google Scholar] [CrossRef]
  67. Wu, X.; Wong, Z.L.; Sten, P.; Engblom, S.; Osterholm, P.; Dopson, M.; Nakatsu, C. Microbial community potentially responsible for acid and metal release from an Ostrobothnian acid sulfate soil. FEMS Microbiol. Ecol. 2013, 84, 555–563. [Google Scholar] [CrossRef]
  68. Yadav, N.; Yadav, A.N. Actinobacteria for sustainable agriculture. J. Appl. Biotechnol. Bioengin. 2019, 6, 38–41. [Google Scholar]
  69. Wu, M.; Ye, X.; Chen, K.; Li, W.; Yuan, J.; Jiang, X. Bacterial community shift and hydrocarbon transformation during bioremediation of short-term petroleum-contaminated soil. Environ. Pollut. 2017, 223, 657–664. [Google Scholar] [CrossRef]
  70. Wu, X.; Gu, Y.; Wu, X.; Zhou, X.; Zhou, H.; Amanze, C.; Shen, L.; Zeng, W. Construction of tetracycline degrading bacterial consortium and its application evaluation in laboratory-scale soil remediation. Microorganisms 2020, 8, 292. [Google Scholar] [CrossRef] [Green Version]
  71. Gupta, A.; Dutta, A.; Sarkar, J.; Panigrahi, M.K.; Sar, P. Low-abundance members of the Firmicutes facilitate bioremediation of soil impacted by highly acidic mine drainage from the Malanjkhand copper project, India. Front. Microbiol. 2018, 9, 2882. [Google Scholar] [CrossRef]
  72. Morawe, M.; Hoeke, H.; Wissenbach, D.K.; Lentendu, G.; Wubet, T.; Krober, E.; Kolb, S. Acidotolerant bacteria and fungi as a sink of methanol-derived carbon in a deciduous forest soil. Front. Microbiol. 2017, 8, 1361. [Google Scholar] [CrossRef]
  73. Konopka, A.; Oliver, L.; Turco, R.F. The use of carbon substrate utilization patterns in environmental and ecological microbiology. Microb. Ecol. 1998, 35, 103–115. [Google Scholar] [CrossRef]
  74. Smalla, K.; Wachtendorf, U.; Heuer, H.; Liu, W.; Forney, L. Analysis of BIOLOG GN substrate utilization patterns by microbial communities. Appl. Environ. Microbiol. 1998, 64, 1220–1225. [Google Scholar] [CrossRef] [PubMed] [Green Version]
  75. Preston-Mafham, J.; Boddy, L.; Randerson, P.F. Analysis of microbial community functional diversity using sole-carbon-source utilisation profiles—A critique. FEMS Microbiol. Ecol. 2002, 42, 1–14. [Google Scholar] [PubMed]
  76. Sofo, A.; Ricciuti, P. A standardized method for estimating the functional diversity of soil bacterial community by BiologEcoPlates assay—The case study of a sustainable olive orchard. Appl. Sci. 2019, 9, 4035. [Google Scholar] [CrossRef] [Green Version]
  77. Zak, J.C.; Willig, M.R.; Moorhead, D.L.; Wildman, H.G. Functional diversity of microbial communities: A quantitative approach. Soil Biol. Biochem. 1994, 26, 1101–1108. [Google Scholar] [CrossRef]
  78. Kenarova, A.; Radeva, G.; Tryakov, I.; Boteva, S. Community level physiological profiles of bacterial communities inhabiting uranium mining impacted sites. Ecotoxicol. Environ. Saf. 2014, 100, 226–232. [Google Scholar] [CrossRef]
  79. Martinez-Toledo, A.; Gonzalez-Mille, D.J.; Garcia-Arreola, M.E.; Cruz-Santiago, O.; Trejo-Acevedo, A.; Ilizaliturri-Hernandez, C.A. Patterns in utilization of carbon siurces in soil microbial communities contaminated with solid astes from San Luis Potosi, Mexico. Ecotoxicol. Environ. Saf. 2021, 208, 111493. [Google Scholar] [CrossRef]
  80. Kawina, R.; Lebeau, M.; Martineau, S.; Amyot, M. Bioremediation of engine-oil contaminated soil using local residual organic matter. Peer J. 2019, 7, e7389. [Google Scholar]
  81. Gryta, A.; Frąc, M.; Oszust, K. The application of the Biolog EcoPlate approach in ecotoxicological evaluation of dairy sewage sludge. Appl. Biochem. Biotechnol. 2014, 174, 1434–1443. [Google Scholar] [CrossRef] [Green Version]
  82. Fazekas, J.; Fazekasova, D.; Adamisin, P.; Hulicova, P.; Benkova, E. Functional diversity of microorganisms in metal- and alkali-contaminated soils of central and north-eastern Slovakia. Soil Water Res. 2019, 14, 32–39. [Google Scholar] [CrossRef] [Green Version]
  83. Pająk, M.; Błońska, E.; Frąc, M.; Oszust, K. Functional diversity and microbial activity of forest soils that are heavily contaminated by lead and zinc. Water Air Soil Pollut. 2016, 227, 348. [Google Scholar] [CrossRef] [Green Version]
  84. Epelde, L.; Lanzen, A.; Martin, I.; Virgel, S.; Mijangos, I.; Besga, G.; Garbisu, C. The microbiota of technosols resembles that of a nearby forest soil three years after their establishment. Chemosphere 2018, 220, 600–610. [Google Scholar] [CrossRef] [PubMed]
  85. Markowicz, A.; Płaza, G.; Piotrowska-Seget, Z. Activity and functional diversity of microbial communities in long-term hydrocarbon and heavy metal contaminated soils. Arch. Environ. Prot. 2016, 42, 3–11. [Google Scholar] [CrossRef] [Green Version]
  86. Wolińska, A.; Frąc, M.; Oszust, K.; Szafranek-Nakonieczna, A.; Zielenkiewicz, U.; Stępniewska, Z. Microbial biodiversity of meadows under different modes of land use: Catabolic and genetic fingerprinting. World J. Microbiol. Biotechnol. 2017, 33, 154. [Google Scholar] [CrossRef] [PubMed] [Green Version]
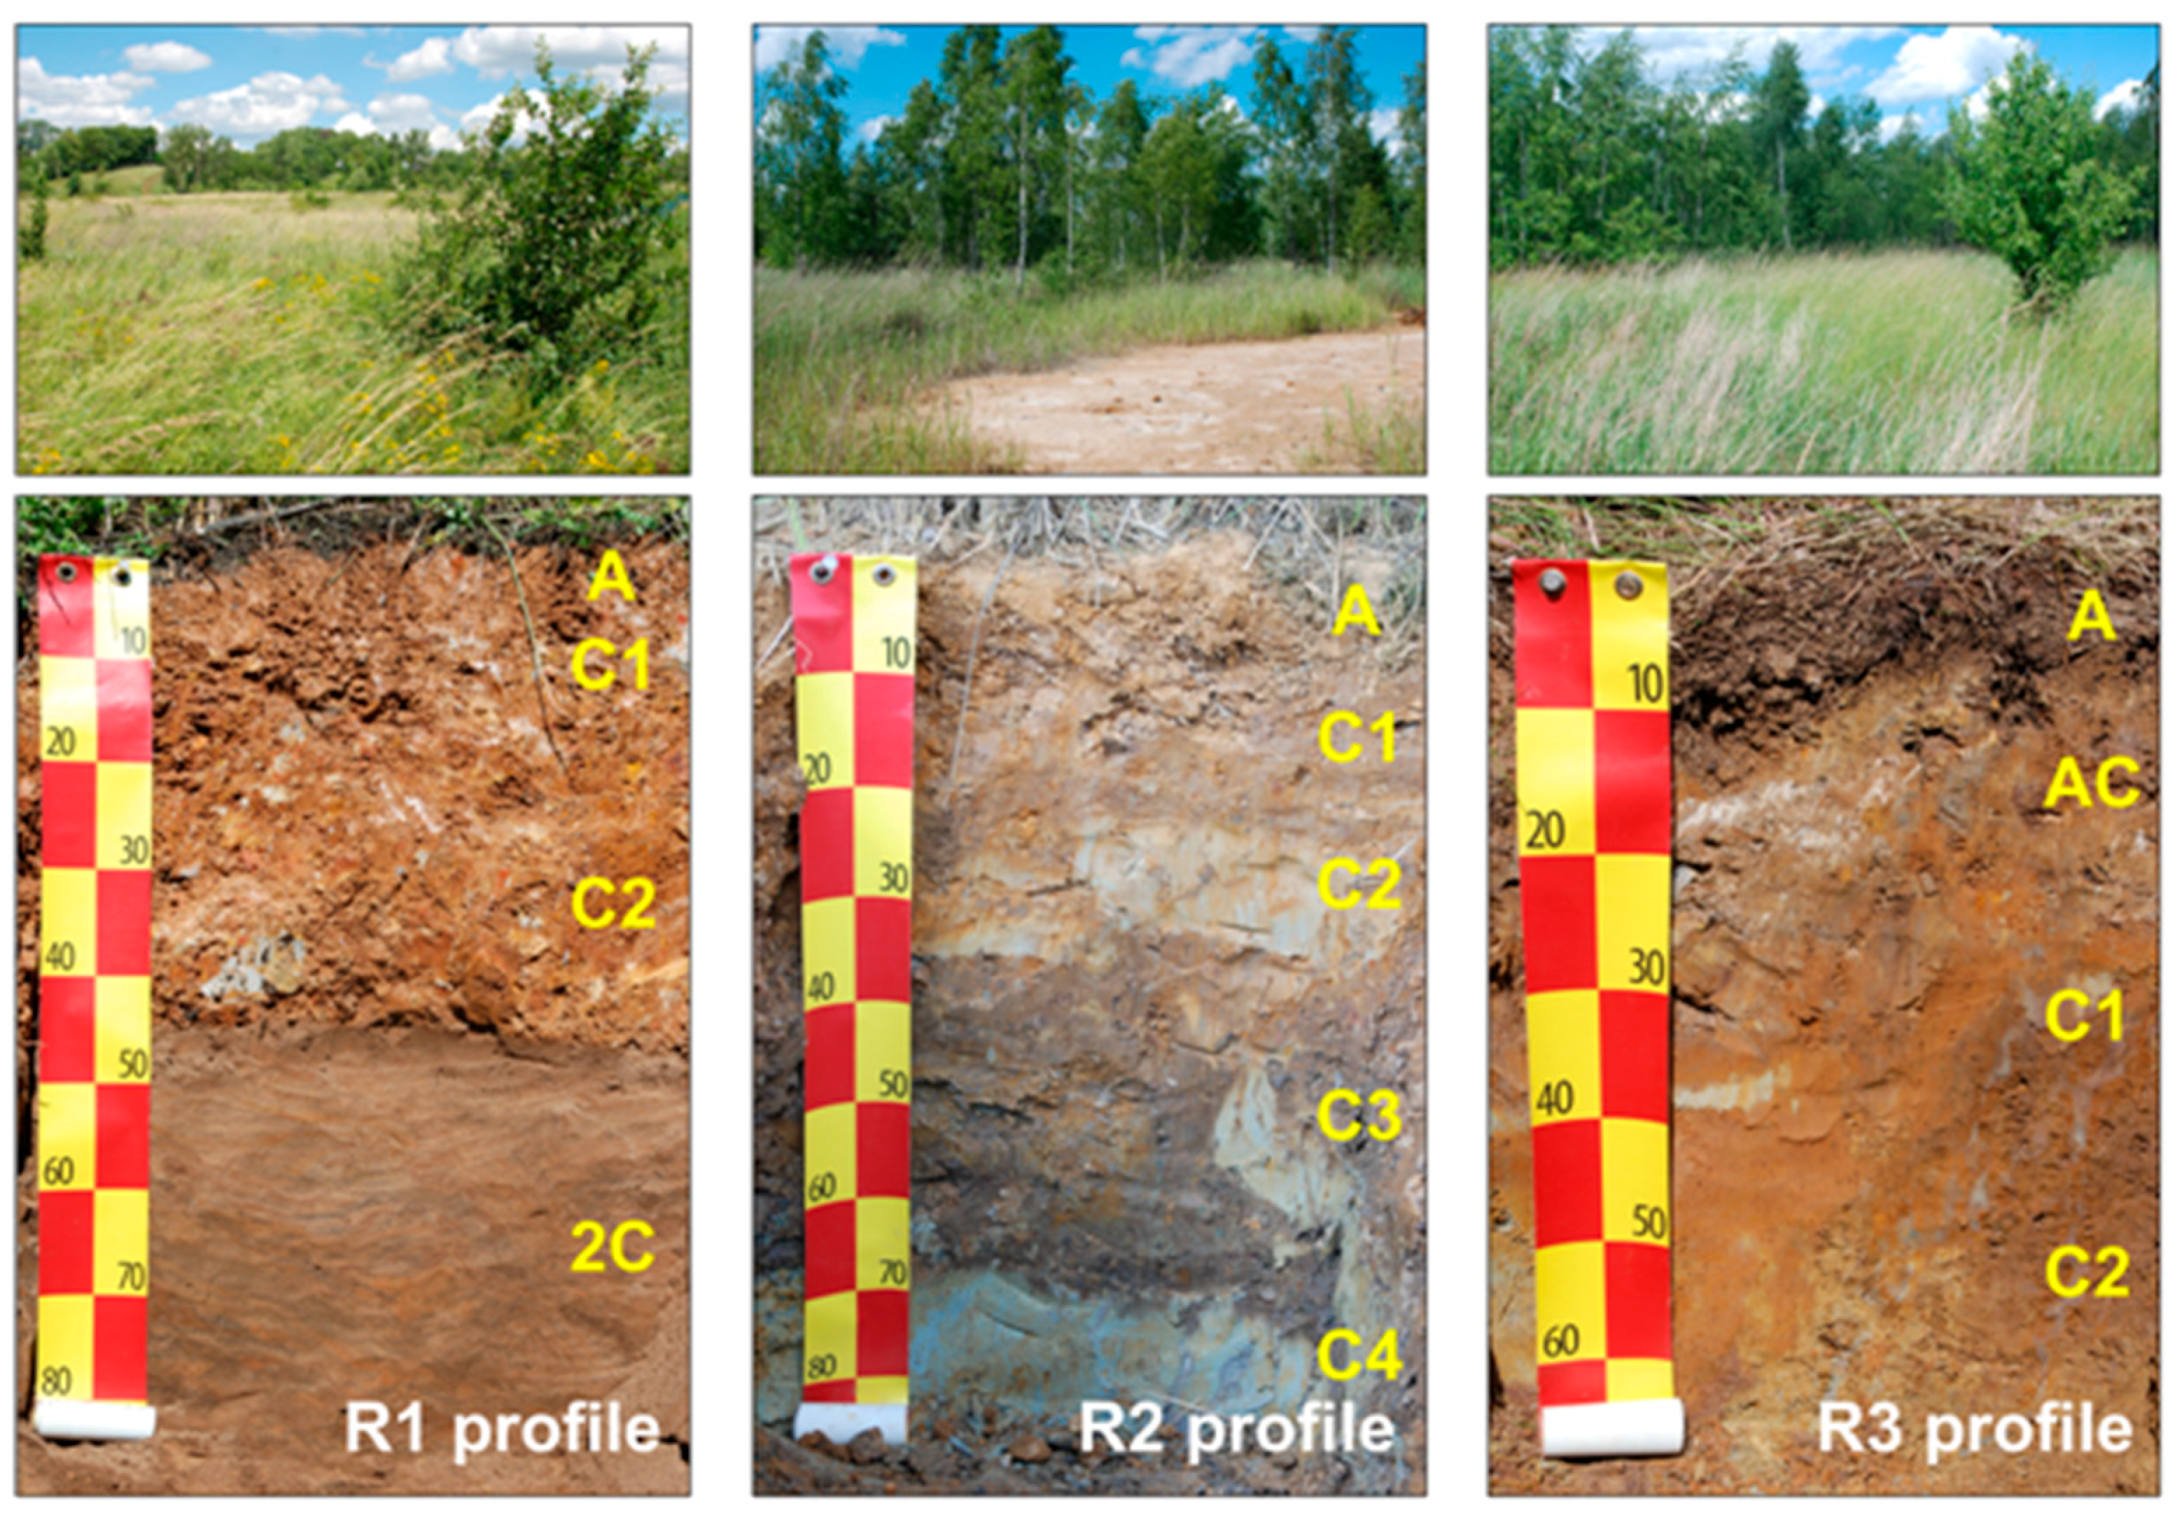
Scheme 1. Studied soil profiles and their surroundings (made by Uzarowicz Ł.). The letters in the photo means the depth of the soil horizons (in general: A – humus horizon, C – parent material), as follows: R1 profile: A (1–3 cm); C1 (3–15 cm); C2 (15–45 cm); 2C (45–85 cm), R2 profile: A(1–10 cm); C1 (10–20 cm); C2 (20–35 cm); C3 (35–75 cm); C4 (70–90 cm), R3 profile: A (2–10 cm); AC (10–20 cm); C1 (20–40 cm); C2 (40–70 cm).
Agronomy 10 01795 sch001
Figure 1. Main phyla of bacteria identified in the studied soils profiles (R1, R2 and R3) and horizons (A, AC, C1, C2, C3, C4, 2C).
Agronomy 10 01795 g001
Figure 2. Main classes of bacteria identified in the studied soils profiles (R1, R2 and R3) and horizons (A, AC, C1, C2, C3, C4, 2C).
Agronomy 10 01795 g002
Figure 3. Beta-diversity of bacterial genera in the studied soil profiles (R1, R2, R3). The numbers included in the Venn diagrams refer to the occurrence of the identified genera representing the unique and shared core microbiome in the surface, subsurface and subsoil of studied soil profiles.
Agronomy 10 01795 g003aAgronomy 10 01795 g003b
Figure 4. Phenotyping analysis based on results of Biolog®EcoPlates™ analysis. Clustering analysis tree created on the basis of the results of the utilization of all substrates after the correction with negative control (UPGMA, Euclidean similarity index). Inner circle (color gradient) presents AWCD – average well colour developed. Multivalue bar charts present % utilization of different groups of substrates (each line presents a different group of substrates, as shown in the legend).
Agronomy 10 01795 g004
Figure 5. Heat map of carbon utilization patterns of 31 substrates from the Biolog®EcoPlates™ incubates for 120 h from the studied soil profiles. The results are demonstrated as standardized data of absorbance measurement at 590 nm (the higher value means, the higher functional activity).
Agronomy 10 01795 g005
Table 1. Variability of the top bacterial genera (with abundance above 10% of all sequences) detected in the studied soil profiles (+ means the presence of the genus).
Soil ZoneGenusSoil Profile
R1R2R3
SurfaceConexibacter +
Acidothermus +
Granulicella +
Gaiella+
Nocardioides+ +
Streptomyces+ +
CandidatusUdaerobacter++
Acidiphilium +
Metallibacterium +
Sulfurifustis+
SubsurfaceAcidiphilium ++
Acidithiobacillus +
Leptospirillum +
Metallibacterium +
Gaiella+
Acidocella +
Acidothermus +
Kribbella+
SubsoilDesulfosporosinus +
Bacillus+
Acidithiobacillus +
Acidiphilium +
Pseudonocardia +
Gaiella+
Jatrophihabitans +
Sulfurifustis+
Paenisporosarcina+
Alkanibacter +
Acidocella +
Cellulomonas +
Psychrobacter+
Serratia+
Ferrithrix +
Table 2. Calculated diversity indices at genetic distance of 3% for studied soil profiles.
Soil ProfileSoil Sample LabelHD1/D
R1R1-A5.9300.01010.9898
R1-C16.1400.00750.9924
R1-C22.8300.18660.8134
R1-2C2.3390.37940.6206
R2R2-AC4.2650.03730.9626
R2-C13.5000.04920.9508
R2-C23.0910.08220.9177
R2-C30.3350.91190.0881
R2-C41.6100.52220.4778
R3R3-A6.2720.00730.9927
R3-AC5.8270.00940.9905
R3-C15.8070.00940.9906
R3-C22.8800.13650.8635
H′ Shannon-Wiener index of general diversity, D Simpson index of diversity, 1/D Simpson index of dominance.
Table 3. Functional diversity indices evaluated by substrate utilization in the Biolog®EcoPlates™ calculated on data from all 31 carbon sources (n.d.—not detected).
Soil ProfileSoil Sample LabelShannon-Wiener (H′)Evenness
(E)
R1R1-A3.2860.983
R1-C13.2190.986
R1-C22.7011.248
R1-2C2.636n.d.
R2R2-AC2.8361.066
R2-C12.713n.d.
R2-C22.263n.d.
R2-C32.574n.d.
R2-C41.875n.d.
R3R3-A3.2880.980
R3-AC3.2101.019
R3-C12.8041.018
R3-C22.7361.338
Publisher’s Note: MDPI stays neutral with regard to jurisdictional claims in published maps and institutional affiliations.