Article

Interactive Effects of Elevated Ozone and Temperature on Growth and Yield of Soybean (Glycine max (L.) Merr.) under Field Conditions

1
USDA-ARS Plant Science Research Unit, Raleigh, NC 27603, USA
2
Department of Crop and Soil Sciences at North Carolina State University, Raleigh, NC 27695-7631, USA
*
Author to whom correspondence should be addressed.
Agronomy 2020, 10(11), 1803; https://doi.org/10.3390/agronomy10111803
Submission received: 29 September 2020 / Revised: 5 November 2020 / Accepted: 12 November 2020 / Published: 17 November 2020
(This article belongs to the Special Issue Ozone Effects on Crop Production)

Abstract

:
Elevated ozone and rising temperature are both factors in climate change, but they are difficult to study in combination due to exposure system requirements. We developed and deployed an air exclusion exposure system to treat soybean (Glycine max (L.) Merr.) cultivar “Jake” with season-long combinations of sub-ambient ozone (18 ppb, 12 h mean), elevated ozone (66 ppb, 12 h mean), and elevated temperature (+3.5 °C daytime, +2.4 °C nighttime) in irrigated field plots. Warming caused a shift in biomass partitioning from reproductive tissues into stems and petioles at mid-season that resulted in a significant 25% reduction in final seed yield and a significant reduction in harvest index. The elevated ozone treatment delayed mid-season biomass production, and final seed yield was reduced by a non-significant 2%. However, there were significant underlying effects of elevated ozone on seed production. The non-significant impact of ozone on seed yield of cultivar “Jake” resulted from significant increases in pod number (+16%) and seed number (+18%) that were offset by a significant reduction in seed size (−16%). No evidence of significant warming–ozone interactions was found in biomass or seed yield responses. In general, significant impacts of the individual warming or ozone treatments were found to be additive.

1. Introduction

Since the discovery of ozone as the cause of “weather flecking” in tobacco [1], several decades of research have shown that rising atmospheric ozone concentrations have negative impacts on plants [2,3]. Ground level ozone is considered a secondary air pollutant formed by photochemical reactions between oxygen in the atmosphere and the primary pollutant precursors nitrogen oxide (NOx), methane, and volatile organic compounds (VOCs) generated by anthropogenic sources [3]. Ozone is a toxic air pollutant that enters plants though leaf stomata and initiates stress response pathways leading to a reduction in photosynthesis that results in loss of biomass and yield for all of the major agricultural crops on which humans depend for food and fiber [2,3]. Annual soybean yield losses from ambient ozone are estimated to be 10% [4] while measured [3] and modeled [5] scenarios suggest that further yield losses can be expected as ambient ozone concentrations continue to rise. These projections have been confirmed by recent modeling studies that examined the impact of ozone and the interactions of ozone with other climate change factors on soybean, wheat, maize, and rice [6,7].
Heat stress is a major limitation to crop growth, including both soybean and wheat, with the problem projected to become greater in the future [8,9]. Elevated temperature is known to impact reproductive growth to a greater extent than vegetative biomass production with declines in seed number (pollination) and seed size (resource allocation) resulting in reduced seed yield and harvest index [10]. One challenge for research on heat stress is the need for exposure systems to provide season-long elevated heat treatments under field conditions. The SoyFACE facility at the University of Illinois has used infrared heaters to raise canopy temperature in field plots and found that elevated temperature decreased seed yield of both soybean [11] and maize [12] for specific cultivars. The work reported here has utilized a different approach where both ozone and warming treatments were imposed by conditioning air before injection into the plant canopy.
Climate change involves multiple interacting factors that include ozone pollution and elevated temperature. Ozone levels are projected to increase during the 21st century as the result of increased primary precursor production [3,13]. At the same time, average temperatures are also projected to increase by as much as 4 °C [13]. Understanding the interactions between these environmental factors is an important step in predicting the response of crops to climate change. Interactions between elevated temperature and elevated carbon dioxide have been studied under field conditions for soybean [11] and maize [12]. However, interactions between elevated temperature and ozone have been limited to controlled environment studies [14,15] due to the lack of exposure facilities for conducting field experiments. Here we report the development of a system to conduct such field trials and utilize this system to examine the interacting effects of elevated ozone and temperature on the growth and yield of soybean. The experimental hypothesis tested was that the combination of elevated ozone and temperature will interact to reduce soybean yield relative to the individual stresses alone.

2. Materials and Methods

2.1. Research Site

The experiment was conducted over a four-year period at a site located 5 km south of Raleigh, North Carolina, USA on the Lake Wheeler Farm of North Carolina State University (35°43′ N, 78°40′ W; elevation 120 m). The soil was an Appling sandy loam (fine, kaolinitic, thermic Typic Kanhapludult), well drained with a pH of 6.2.

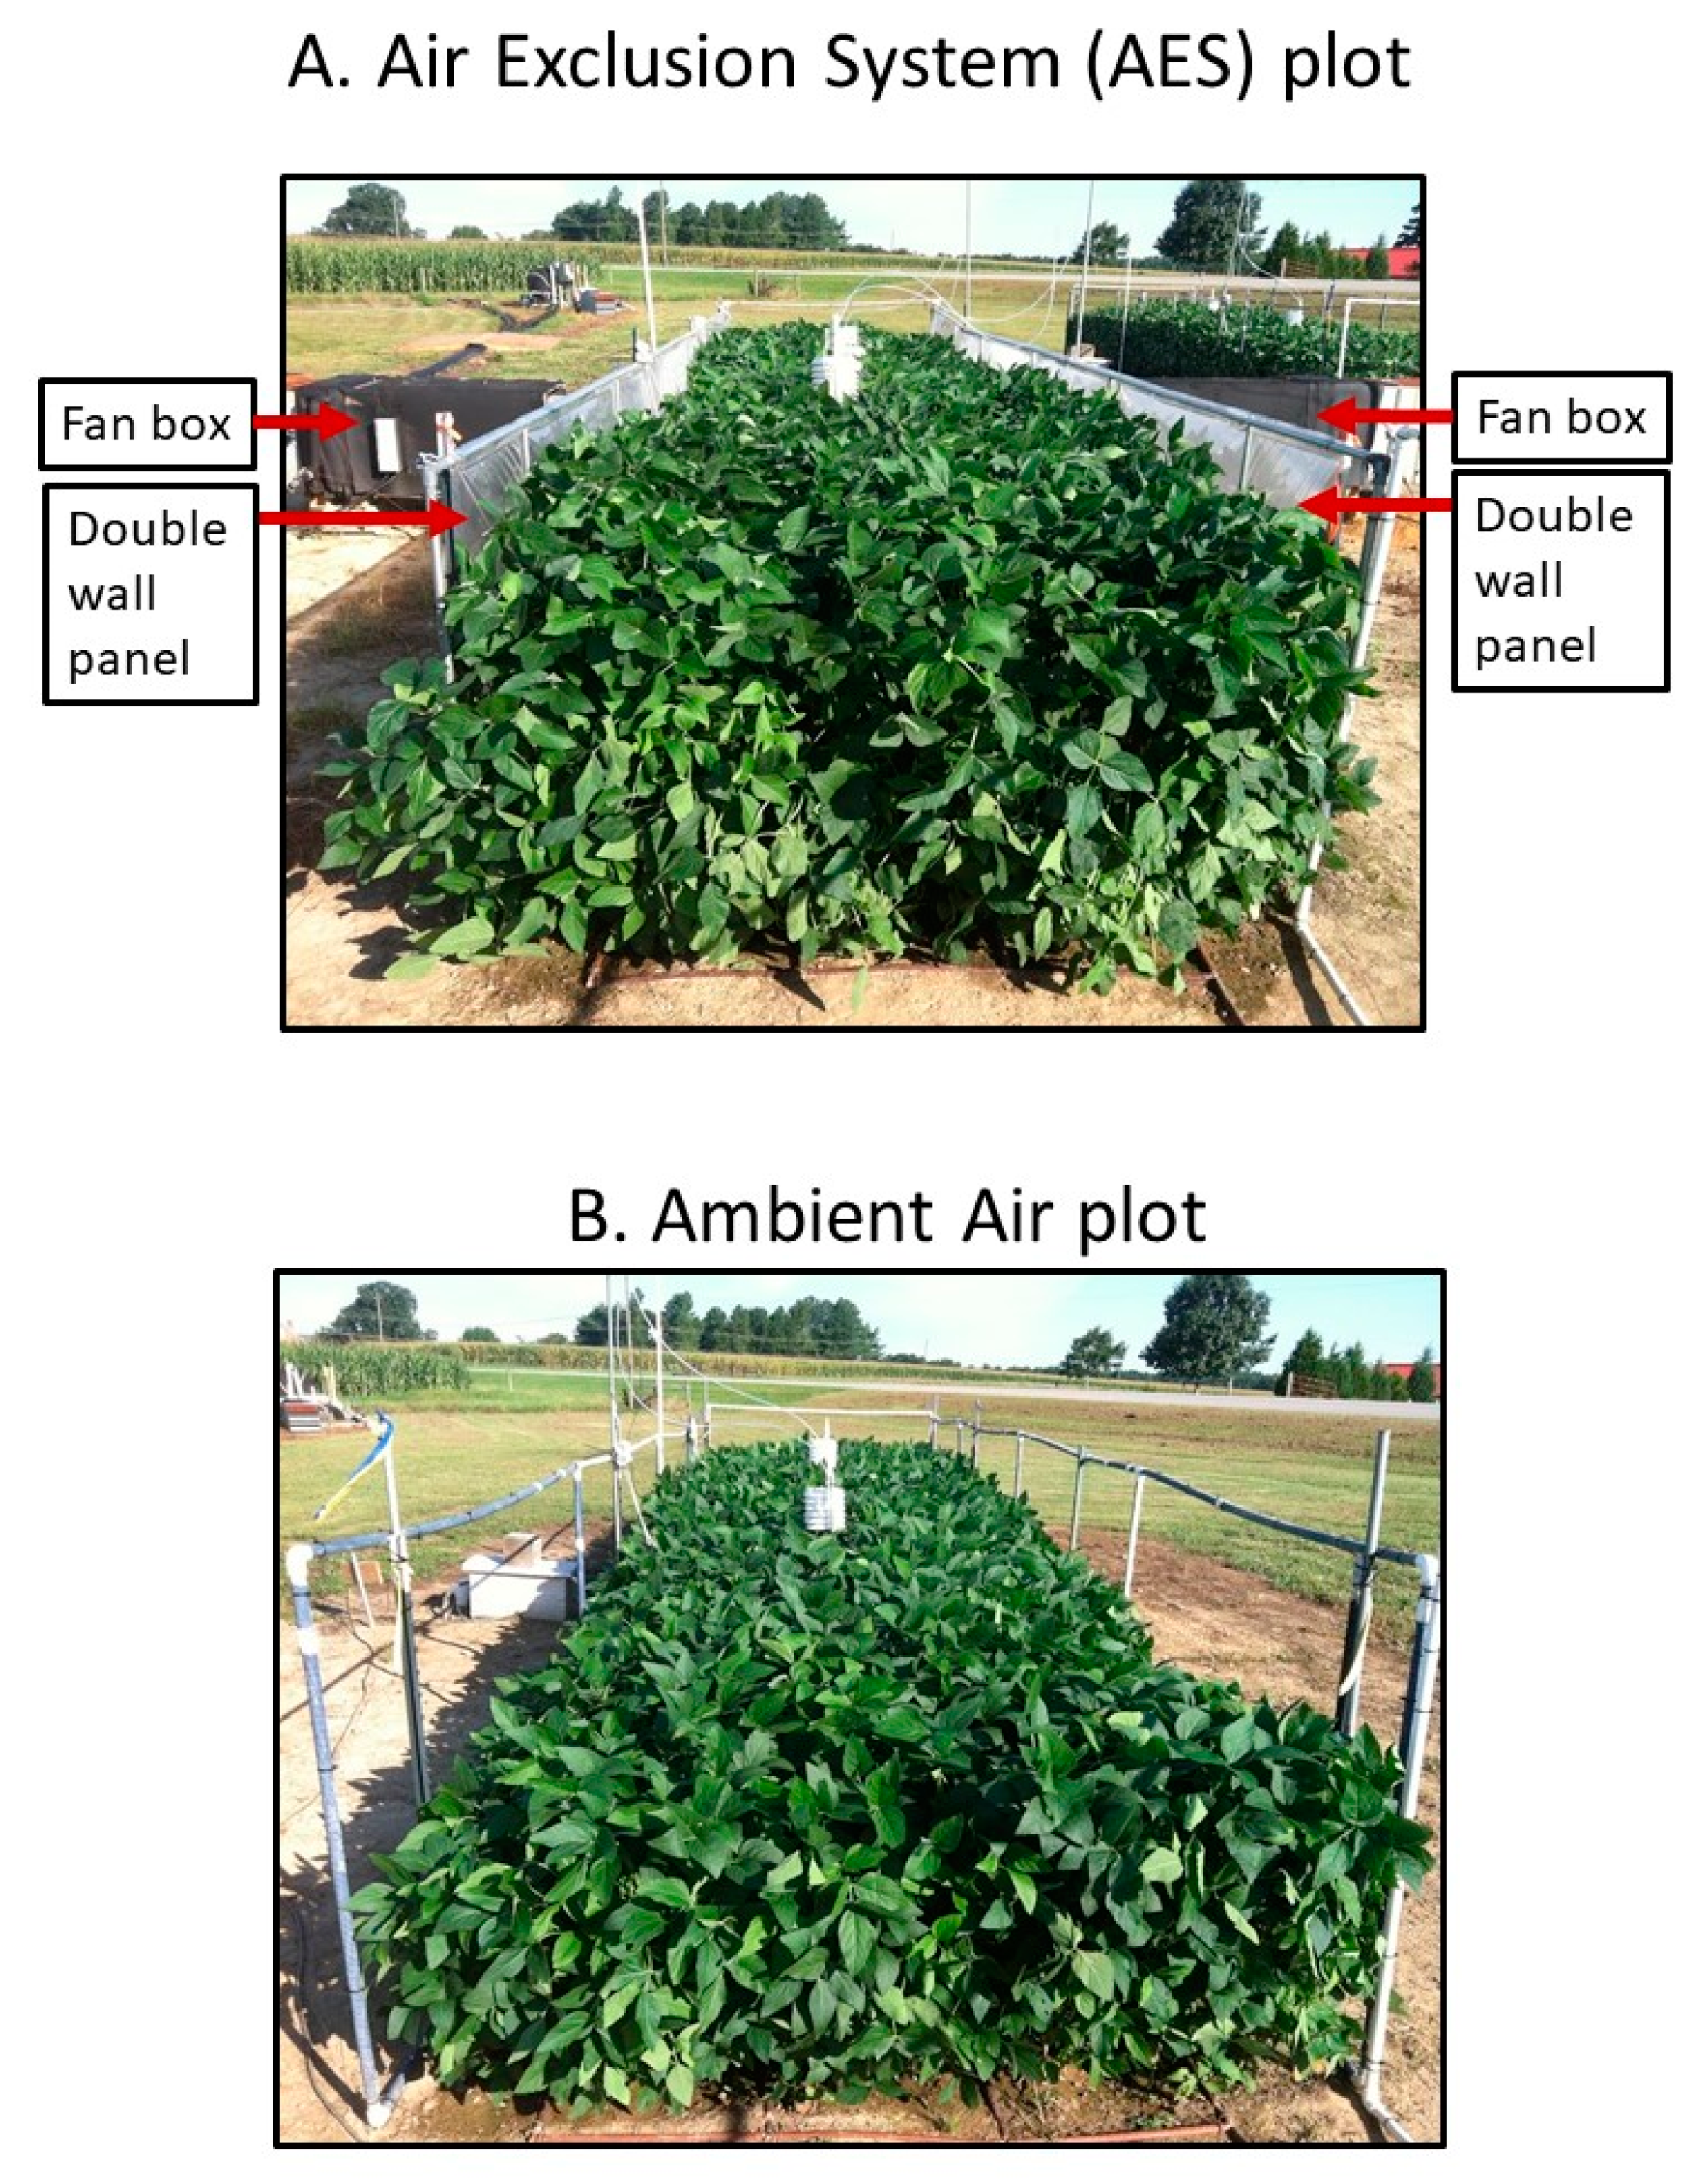
2.2. Air Exclusion System (AES) Description

An air exclusion system (AES) was developed and deployed for temperature, ozone, and humidity control in field plots (Figure 1A). The treated area of each plot measures approximately 8.2 m in length × 2.1 m wide. Double wall panels constructed of clear PVC (vinyl) film (0.2 mm thick outer layer, 0.4 mm thick inner layer) were erected along the length of each side of the plot at a height of 1.1 m. The bottom half of the inner panel was perforated with approximately 300 equally spaced holes (2.5 cm diameter) to allow conditioned air to be directed towards the base of the plant canopy. Conditioned air was delivered to each double wall panel by a fan box providing an airflow of approximately 57 m3 min−1, totaling 114 m3 min−1 for the entire plot. Ambient air plots (Figure 1B) of the same dimensions were used to assess potential impacts of the structure on plant response. Ambient plots allowed free movement of air within the canopy by replacing the engineered structure with bird netting attached to a frame (to prevent herbivory by the local deer population). Bird netting attached to a frame was also used to restrict entry in the open ends of the AES plots.
Conditioned air entered the panels through fan boxes that initially passed ambient air through a particulate filter followed by an activated carbon filter to reduce the concentration of ambient ozone. For the elevated ozone treatment, concentrated ozone was injected into the conditioned air just downstream from the activated carbon filter using mass flow controllers (GFC17, Aalborg, Orangeburg, NY, USA) to deliver concentrated ozone to both fan boxes in a single plot through fluorinated ethylene propylene (FEP) tubing. Elevated ozone treatments were based on a 12 h daytime diurnal profile [16]. Ozone was generated from pure dry oxygen via corona cell discharge using an ozone generator (TG-20, Ozone Solutions, Hull, IA, USA). A custom software program monitored the ozone concentration (49C, Thermo Fisher Scientific, Waltham, MA, USA) in all plots, and controlled the dispensing to the elevated plots. Ozone measurements and adjustments were made at 30-minuite intervals. Dispensing was performed during daylight, but ozone measurements were recorded continuously. Ozone was sampled at canopy height at two points (between the three subplots) centered along the length of each main plot.
Elevated temperature treatments were achieved by two separate components integrated within the fan box: electrical resistance heater elements and water-to-air heat exchangers. Two 4000-watt finned tubular heating elements (FTH40B-B, Vulcan Electric Company, Porter, ME, USA) were installed in each fan box, totaling 16,000 watts per plot. The elements were energized continuously throughout the season. In addition, two water-to-air heat exchangers (HWC-24X24, Outdoor Furnace Supply, Middleport, NY, USA) were welded together in series inside each fan box, providing additional heating during daylight hours. The water was heated by incident solar radiation through an array of black polyethylene collector pipes. The heat was transferred from the water to the airstream in the fan box and the water was recirculated back to the collector pipes. Heating was proportional to the incident solar radiation, so the benefit followed a general diurnal pattern.
Relative humidity declines as air is heated. To compensate for this loss, moisture was introduced into the heated air stream prior to being discharged into the plant canopy. Six stainless steel misting nozzles (51410, Aeromist, Phoenix, AZ, USA) were attached inside each double wall panel for the heated plots. A single misting pump (50151K, Aeromist) provided flow to all nozzles in all heated field plots at 6.9 MPa (1000 psi).
Air temperature and relative humidity were measured and recorded in all plots with sensors (HOBO U23, Onset Computer Corp., Bourne, MA, USA) at mid-canopy and full-canopy heights. Sensors were placed between the three subplots centered along the length of each main plot. Soil temperature and moisture were also measured (EP100DL-08, EnviroPro Dialectrics, Moonta, South Australia) in the center of each plot from 5 to 75 cm at 10 cm increments. All environmental measurements were recorded at 5-min intervals by a data acquisition system controlled with custom software.

2.3. Crop Management

Soybean (Glycine max (L.) Merr.) cultivar “Jake” [17] of maturity group V was selected for this study because it is a high yielding variety with broad resistance to soybean nematodes. Fertilizer was surface applied in the spring prior to planting based on North Carolina Department of Agriculture soil test recommendations except in 2016 when fertilizer additions were made prior to a wheat crop that preceded the soybean crop. Fertilizer amendments included dolomite limestone (Ca, Mg), urea (N), triple superphosphate (P), potassium chloride (K) and gypsum (Ca, S). Seeds were hand planted between 5 and 13 June each year. Each AES plot and ambient plot consisted of eight rows with a row spacing of 25 cm. After emergence, plants were thinned to 20 plants m−2 and grown to maturity. Each plot was equipped with four drip irrigation lines to supplement natural rainfall in order to minimize drought stress. Soil moisture was assessed twice weekly with a portable TDR sensor (HydroSense II, Campbell Scientific, Logan, UT, USA) to determine irrigation timing with additional water added to heated plots to maintain similar soil moisture as non-heated plots. Weeds were managed with glyphosate to control broadleaves and grasses before planting and Dual Magnum was used as a post plant pre-emergent herbicide. Bifenthrin, Floramite SC, and Conserve SC were used as needed to control insect pests.

2.4. Treatments

The study involved five treatments. Non heated plots with charcoal-filtered air (CF) served as the sub-ambient ozone control for the study. Other treatments included heated CF air (CF + warming) and ozone added to CF air (CF + ozone) and CF air with the combination treatment (Ozone + warming). Ambient air plots were included within each experimental block.

2.5. Harvests

Each main plot was divided into three subplots each with dimensions of 1 m length × 2.1 m width with a 0.5 m interval between subplots. Biomass harvests were conducted at the flowering stage and again at the pod filling stage of development using the subplots located at the ends of each main plot, reserving the middle subplot for the final harvest. For biomass harvests, plants (19–20 individuals) were removed from a 1 m2 area in the center 4 rows of each subplot. Leaves, branches, and pods (when present) were counted for each subplot and leaf area measured using an area meter (model LI-3100; Li-Cor, Lincoln, NE, USA). Biomass was separated into leaves, stems and petioles, and pods (when present) and dried to determine dry weight. At final harvest, plants from a 1 m2 area in the final subplot of each main plot were separated into stems, pods with seeds, and unfilled pods. Tissues were dried and weighed, and seeds removed from pods, counted, and weighed to calculate final seed yield and harvest index.

2.6. Statistics

The experimental design was a randomized complete block with three replications in each of the four years of study. Data were pooled data across years for analysis. Effects of temperature, ozone, and the interaction were analyzed using the GLIMMIX Procedure in SAS (SAS Institute Inc., Cary, NC, USA) followed by Tukey means testing.

3. Results

3.1. Environmental Conditions

The charcoal-filters in the AES fan boxes reduced the ozone concentration of ambient air (~33 ppb, 12 h mean) by approximately half in the CF control (18 ppb, 12-h mean) plots with the elevated ozone treatment plots (~66 ppb, 12 h mean) averaging approximately twice the concentration of ambient air (Table 1). The combination of electrical resistance heat and solar heated water increased the average daytime temperature by +3.5 °C in the heated plots while nighttime temperature without the benefit of solar heating averaged +2.4 °C higher in the heated plots (Table 1). Adding moisture to heated air prior to entry into the plant canopy maintained the daytime relative humidity in the heated plots at approximately 63% compared to 70% in the unheated plots (Table 1).

3.2. Year-to-Year Differences in Yield Potential

A field study with soybean was conducted over four growing seasons (2015–2018) to assess interactions between elevated temperature and elevated ozone. Seed yield averaged across treatments varied significantly (p < 0.0005) between years by 32% with the yield in 2016 (519 g m−2) being lower than the other years (624–684 g m−2). The lower yield in 2016 may have been the result of fertilizer application prior to planting the winter wheat crop with no additional fertilization prior to soybean planting. There were no year–temperature (p = 0.8016) or year–ozone (p = 0.6701) interactions. On this basis, results were combined across years for detailed analysis.

3.3. Mid-Season Biomass Production

Biomass production was assessed at two intermediate stages of development. At flowering (R-stage 2), total biomass in the heated plots was not different than the CF control (Table 2), but there were differences in biomass partitioning within the above-ground tissues. Warming decreased branch number (−26%), leaf number (−10%), and leaf area (−7%) that were compensated by increased stem-petiole dry weight (+7%). At the flowering stage, elevated ozone reduced total biomass (−11%) relative to the CF control through reductions in leaf number (−10%), leaf area (−24%), leaf dry weight (−10%), and stem-petiole dry weight (−9%). The effects of ozone and warming in the combined treatment appeared to be additive with no warming–ozone interactions observed (Table 2). For example, the reduction in branch number at flowering in response to warming alone was also observed in the combination treatment (Table 2).
At the pod filling (R-stage 6), total above-ground biomass was similar in all treatments (Table 3), but there were significant treatment differences in biomass partitioning. Branch number, leaf number, leaf area, leaf dry weight, and pod number were similar in the CF control and heated plots, but there were significant differences in partitioning into pod and stem-petiole biomass. Pod biomass was reduced (−26%) in the heated plots relative to the CF controls while stem-petiole biomass was increased (+12%) in the warming treatment (Table 3). At the pod filling stage, total biomass and biomass partitioning were similar in the CF control and elevated ozone treatments. The effects of ozone and warming in the combined treatment appeared to be additive with no warming–ozone interactions observed (Table 3). For example, the reduction in pod dry weight observed in response to warming alone was also observed in the combination treatment (Table 3).

3.4. Final Yield Assessment

The warming treatment reduced seed yield by an average of 25% relative to the CF control over the four-year study (Table 4). This was the result of a significant reduction in seed number (−20%) and a small non-significant reduction in seed size (−5%). The yield loss in the elevated temperature treatment was associated with a decrease in mature pod number (−13%) and a threefold increase in unfilled pods (Table 4). This combination of factors reduced harvest index by 13%.
In contrast, the elevated ozone treatment did not affect seed yield. There was a non-significant reduction of 2% relative to the CF control averaged across the four-year study (Table 4). However, significant ozone effects on the underlying dynamics contributed to this result. Elevated ozone increased pod number (+14%) and seed number (+18%) while seed size was reduced (−16%), resulting in the non-significant 2% reduction in seed yield.
There was no evidence of a significant warming–ozone interaction in any of the final yield parameters (Table 4). In general, significant impacts in the individual warming or ozone treatments were observed in the combined treatment. For example, reduced pod weight in the warming treatment and reduced seed size in the ozone treatment were observed when the treatments were combined.

4. Discussion

The AES proved to be a reliable exposure system for imposing elevated ozone and temperature systems in the field. The CF treatment maintained a sub-ambient ozone level that was approximately half that of the ambient air levels (Table 1), suggesting the structure provided by the panels and the continuous air flow from the fan boxes provided a net air flow out of the plots to limit ambient air incursions except under windy conditions. Adding ozone to a background of charcoal-filtered air allowed better control of target ozone concentrations in the elevated ozone treatment. The average +3.5 °C daytime temperature represents the maximum elevated temperature for the system given that the electrical resistance heaters ran continuously and were supplemented with solar heated water during the daylight hours. In general, biomass and seed production in the CF control plots were similar to the ambient air plots (Table 2, Table 3 and Table 4), suggesting the infrastructure associated with the AES provided a realistic environment to assess ozone and temperature effects on cropping systems.
Soybean cultivar “Jake” was found to be sensitive to elevated temperature. While there was no impact on overall biomass production, there was evidence for a shift in carbon allocation toward stems and petioles during mid-season biomass assessments at flowering (Table 2) and pod filling (Table 3). The final result was an average seed yield loss of 25% associated with a decline in harvest index that occurred primarily through a reduction in seed number (Table 4). The reduced seed number was associated with a threefold increase in unfilled pods (Table 4) supporting the findings that pollination is inhibited under heat stress [10,18]. A future area of research will be to investigate the genetic variation in heat stress response of soybean and other crops to assess the magnitude of the problem and identify germplasm for future breeding programs.
In contrast, cultivar “Jake” appeared to be relatively ozone tolerant. The average 12 h mean ozone concentration of 66 ppb (Table 1) in the elevated ozone treatment during the four-year study resulted in a non-significant 2% seed yield loss (Table 4). In related work [19], higher ozone levels of 87 ppb (12 h mean) were required to observe a significant yield loss for this cultivar. However, there were significant ozone effects on “Jake” associated with the non-significant effects on yield in this study. Pod numbers, and as a result seed numbers, were both increased under the elevated ozone treatment, but this increase was offset by a reduction in seed size resulting in the absence of a yield effect (Table 4). The reduction in seed size can be attributed to reduced carbon availability from the negative effects of ozone on photosynthesis [20], but the increase in pod numbers was unexpected. There is evidence to suggest that elevated ozone can increase the number of flowers per plant [21], and we speculate that the inherent ozone tolerance of cultivar “Jake” combined with ozone exposure conditions in this study resulted in a retention of pods resulting in the increased pod numbers observed here. This phenomenon was not observed when cultivar “Jake” was exposed to much higher ozone concentrations [19]. Thus, increased flowering and pod retention under certain ozone stress scenarios may be a trait that contributes to ozone tolerance.
A major finding of this study was the general absence of any significant interaction between warming and elevated ozone. A wide range of biomass or yield parameters were measured, yet no significant warming–ozone interaction terms were found (Table 2, Table 3 and Table 4). In general, significant individual effects of warming and ozone were additive in the combined treatment. Similar conclusions have been reported for controlled environment studies that included combinations of elevated ozone and temperature [14,15]. However, cultivar “Jake” was found to be relatively ozone tolerant, and this trait may have prevented observation of a significant warming–ozone interaction that could be present in an ozone-sensitive cultivar. If confirmed in future studies, the absence of an interaction between ozone and temperature has important implications for modeling plant response to multiple stress factors. The ability to model plant response in complex environments will benefit farmers by identifying management strategies for adapting cropping systems to climate change.

Author Contributions

Conceptualization, K.B. and S.R.; methodology, K.B., S.R., W.P.; software, S.R.; investigation, K.B., R.T., R.Z., S.R., W.P.; data curation, S.R., W.P.; writing—original draft preparation, K.B.; writing—review and editing, K.B., R.T., R.Z., S.R., W.P. All authors have read and agreed to the published version of the manuscript.

Funding

This research received no external funding.

Acknowledgments

The authors acknowledge the outstanding technical support provided throughout this project by Amanda Bailey, Jeff Barton, Salvio Torres, and Pablo Rios.

Conflicts of Interest

The authors declare no conflict of interest.

References

  1. Heggestad, H.E.; Middleton, J.T. Ozone in high concentrations a cause of tobacco leaf injury. Science 1959, 129, 208–210. [Google Scholar] [CrossRef] [PubMed]
  2. Booker, F.; Muntifering, R.; McGrath, M.; Burkey, K.; Decoteau, D.; Fiscus, E.; Manning, W.; Krupa, S.; Chappelka, A.; Grantz, D. The ozone component of global change: Potential effects on agricultural and horticultural plant yield, product quality and interactions with invasive species. J. Integr. Plant Biol. 2009, 51, 337–351. [Google Scholar] [CrossRef] [PubMed]
  3. Ainsworth, E.A.; Yendrek, C.R.; Sitch, S.; Collins, W.J.; Emberson, L.D. The effects of tropospheric ozone on net primary productivity and implications for climate change. Annu. Rev. Plant Biol. 2012, 63, 637–661. [Google Scholar] [CrossRef] [PubMed] [Green Version]
  4. Fishman, J.; Creilson, J.K.; Parker, P.A.; Ainsworth, E.A.; Vining, G.G.; Szarka, J.; Booker, F.L.; Xu, X. An investigation of widespread ozone damage to the soybean crop in the upper Midwest determined from ground-based and satellite measurements. Atmos. Environ. 2010, 44, 2248–2256. [Google Scholar] [CrossRef]
  5. Ainsworth, E.A. Understanding and improving global crop response to ozone pollution. Plant J. 2017, 90, 886–897. [Google Scholar] [CrossRef] [PubMed]
  6. Mills, G.; Sharp, K.; Simpson, D.; Pleijel, H.; Burkey, K.; Emberson, L.; Uddling, J.; Broberg, M.; Feng, Z.; Kobayashi, K.; et al. Closing the global ozone yield gap: Quantification and co-benefits for multi-stress tolerance. Glob. Chang. Biol. 2018, 24, 4869–4893. [Google Scholar] [CrossRef] [PubMed] [Green Version]
  7. Schauberger, B.; Rolinski, S.; Schaphoff, S.; Müller, C. Global historical soybean and wheat yield loss estimates from ozone pollution considering water and temperature as modifying effects. Agric. For. Meteorol. 2019, 265, 1–15. [Google Scholar] [CrossRef]
  8. Zheng, B.; Chenu, K.; Dreccer, M.F.; Chapman, S.C. Breeding for the future: What are the potential impacts of future frost and heat events on sowing and flowering time requirements for Australian bread wheat (Triticum aestivium) varieties? Glob. Chang. Biol. 2012, 18, 2899–2914. [Google Scholar] [CrossRef] [PubMed]
  9. Teixeira, E.I.; Fischer, G.; van Velthuizen, H.; Walter, C.; Ewert, F. Global hot-spots of heat stress on agricultural crops due to climate change. Agric. For. Meteorol. 2013, 170, 206–215. [Google Scholar] [CrossRef]
  10. Boote, K.J.; Allen, L.H.; Prasad, P.V.V.; Baker, J.T.; Gesch, R.W.; Synder, A.M.; Pan, D.; Thomas, J.M.D. Elevated temperature and CO2 impacts on pollination, reproductive growth, and yield of several globally important crops. J. Agric. Meteorol. 2005, 60, 469–474. [Google Scholar] [CrossRef] [Green Version]
  11. Ruiz-Vera, U.M.; Siebers, M.; Gray, S.B.; Drag, D.W.; Rosenthal, D.M.; Kimball, B.A.; Ort, D.R.; Bernacchi, C.J. Global warming can negate the expected CO2 stimulation in photosynthesis and productivity for soybean grown in the Midwestern United States. Plant Physiol. 2013, 162, 410–423. [Google Scholar] [CrossRef] [PubMed] [Green Version]
  12. Ruiz-Vera, U.M.; Siebers, M.; Drag, D.W.; Ort, D.R.; Bernacchi, C.J. Canopy warming caused photosynthetic acclimation and reduced seed yield in maize grown at ambient and elevated [CO2]. Glob. Chang. Biol. 2015, 21, 4237–4249. [Google Scholar] [CrossRef] [PubMed]
  13. IPCC. Climate Change 2014: Synthesis Report; Contribution of Working Groups I, II and III to the Fifth Assessment Report of the Intergovernmental Panel on Climate Change; Core Writing Team, Pachauri, R.K., Meyer, L.A., Eds.; IPCC: Geneva, Switzerland, 2014; p. 151. [Google Scholar]
  14. Clausen, S.K.; Frenck, G.; Linden, L.G.; Mikkelsen, T.N.; Lunde, C.; Jørgensen, R.B. Effects of single and multifactor treatments with elevated temperature, CO2 and ozone on oilseed rape and barley. J. Agron. Crop Sci. 2011, 197, 442–453. [Google Scholar] [CrossRef]
  15. Hansena, E.M.Ø.; Hauggaard-Nielsena, H.; Launayb, M.; Roseb, P.; Mikkelsen, T.N. The impact of ozone exposure, temperature and CO2 on the growth and yield of three spring wheat varieties. Environ. Exp. Bot. 2019, 168, 103868. [Google Scholar] [CrossRef]
  16. Flowers, M.D.; Fiscus, E.L.; Burkey, K.O.; Booker, F.L.; Dubois, J.J.B. Photosynthesis, chlorophyll fluorescence, and yield of snap bean (Phaseolus vulgaris L.) genotypes differing in sensitivity to ozone. Environ. Exp. Bot. 2007, 61, 190–198. [Google Scholar] [CrossRef]
  17. Shannon, J.G.; Wrather, J.A.; Sleper, D.A.; Robbins, R.T.; Nguyen, H.T.; Anand, S.C. Registration of ‘Jake’ soybean. J. Plant. Regist. 2007, 1, 29–30. [Google Scholar] [CrossRef]
  18. Vara Prasad, P.V.; Bheemanahalli, R.; Krishna Jagadish, S.V. Field crops and the fear of heat stress—Opportunities, challenges and future directions. Field Crop. Res. 2017, 200, 114–121. [Google Scholar] [CrossRef] [Green Version]
  19. Tisdale, R.H.; Zentella, R.; Burkey, K.O. Impact of elevated ozone on yield and carbon-nitrogen content in soybean cv. Jake. Plant. Sci. (under review).
  20. Betzelberger, A.M.; Yendrek, C.R.; Sun, J.; Leisner, C.P.; Nelson, R.L.; Ort, D.R.; Ainsworth, E.A. Ozone exposure response for U.S. soybean cultivars: Linear reductions in photosynthetic potential, biomass, and yield. Plant Physiol. 2012, 160, 1827–1839. [Google Scholar] [CrossRef] [PubMed] [Green Version]
  21. Leisner, C.P.; Ainsworth, E.A. Quantifying the effects of ozone on plant reproductive growth and development. Glob. Chang. Biol. 2012, 18, 606–616. [Google Scholar] [CrossRef]
Figure 1. An air exclusion system (AES) plot (A) and an ambient air plot (B). Conditioned air is supplied to the AES plot through double-wall panels on each side of the plot with fan boxes providing a continuous flow of air throughout the season. The air flow in the ambient air plot is dependent on natural wind speed and direction. See text for a detailed description of the features.
Agronomy 10 01803 g001
Table 1. Summary of Environmental Conditions. Values are seasonal means.
Year Average Night Temperature (°C)Average Day Temperature (°C)Ozone Concentration 12-Hour Mean (ppb)Average Day Relative Humidity (%)
No Heat 1+Heat 2No Heat 1+Heat 2AmbCF 3+Ozone 4No Heat 1+Heat 2
201521.424.32.927.431.64.234.115.861.368.158.5
201622.023.71.728.131.02.933.919.565.870.165.2
201720.523.02.527.030.43.434.219.266.368.562.0
201822.024.52.527.731.33.631.418.671.373.865.9
Study average21.523.92.427.631.13.533.418.366.270.162.9
1 Data combined from charcoal-filtered air (CF) and heated charcoal-filtered air (CF +) ozone plots. 2 Data combined from CF + warming and ozone + warming plots. 3 Data combined from CF and CF + warming plots. 4 Data combined from CF + ozone and ozone + warming plots.
Table 2. Mid-season soybean biomass at the flowering stage.
TREATMENTBranch No.Leaf No.Leaf AreaLeaf Dry WeightStem-Petiole Dry WeightTotal Dry Weight
(m−2)(m−2)(m2 m−2)(g m−2)(g m−2)(g m−2)
Ambient127 ± 6623 ± 257.83 ± 0.30234 ± 10396 ± 19631 ± 28
CF control132 ± 7 A655 ± 23 A8.91 ± 0.26 A278 ± 10 AB456 ± 16 AB734 ± 25 AB
CF + warming97 ± 7 B593 ± 25 AB8.30 ± 0.30 AB288 ± 10 A487 ± 17 A775 ± 26 A
CF + Ozone130 ± 7 A587 ± 23 AB7.46 ± 0.26 BC252 ± 10 AB403 ± 16 B655 ± 25 B
Ozone + warming93 ± 7 B509 ± 23 B6.78 ± 0.26 C250 ± 10 B417 ± 16 B667 ± 25 B
ANOVAPr > FPr > FPr > FPr > FPr > FPr > F
Warming<0.00010.00590.01900.69570.16760.2911
Ozone0.63400.0030<0.00010.00210.00060.0007
Warming–ozone0.93360.72870.89710.54070.60090.5631
Values are least squares means ± SE. Numbers followed by the same letter in each column were not significantly different at p < 0.05. Ambient plot data are provided for comparison.
Table 3. Mid-season soybean biomass at the pod filling stage.
TREATMENTBranch No.Leaf No.Leaf AreaLeaf Dry WeightStem-Petiole Dry WeightPod No.Pod Dry WeightTotal Dry Weight
(m−2)(m−2)(m2 m−2)(g m−2)(g m−2)(m−2)(g m−2)(g m−2)
Ambient171 ± 7485 ± 236.32 ± 0.23259 ± 11533 ± 201953 ± 79455 ± 191246 ± 43
CF control191 ± 8 A534 ± 21 B7.28 ± 0.21 A303 ± 11 A617 ± 19 BC2248 ± 84 A529 ± 19 A1448 ± 41 A
CF + warming198 ± 8 A540 ± 20 B7.00 ± 0.20 A306 ± 10 A694 ± 17 A2477 ± 80 A394 ± 18 B1395 ± 38 A
CF + Ozone198 ± 8 A580 ± 20 AB7.23 ± 0.20 A301 ± 10 A578 ± 17 C2429 ± 80 A537 ± 18 A1416 ± 38 A
Ozone + warming187 ± 8 A625 ± 20 A6.87 ± 0.20 A307 ± 10 A655 ± 17 AB2535 ± 80 A388 ± 18 B1350 ± 38 A
ANOVAPr > FPr > FPr > FPr > FPr > FPr > FPr > FPr > F
Warming0.82110.21610.12010.67360.00010.0462<0.00010.1340
Ozone0.81280.00350.65990.97420.03410.14970.94370.3314
Warming–ozone0.26810.36580.84180.91650.98460.45180.68030.8764
Values are least squares means ± SE. Numbers followed by the same letter in each column were not significantly different at p < 0.05. Ambient plot data are provided for comparison.
Table 4. Soybean final harvest.
TREATMENTPod No.Pod WeightUnfilled Pod No. 1Seed No.100 Seed MassSeed YieldHarvest Index
(m−2)(g m−2)(m−2)(m−2)(g−1)(g m−2)
Ambient1794 ± 74844 ± 37102 ± 343823 ± 15716.9 ± 0.3649 ± 280.555 ± 0.006
CF control1885 ± 66 B924 ± 32 A137 ± 36 B3930 ± 144 B17.9 ± 0.3 A706 ± 24 A0.569 ± 0.006 A
CF + warming1648 ± 66 B740 ± 32 B425 ± 36 A3129 ± 144 C17.0 ± 0.3 A528 ± 24 B0.493 ± 0.006 C
CF + Ozone2145 ± 66 A898 ± 32 A170 ± 36 B4627 ± 144 A15.1 ± 0.3 B695 ± 24 A0.582 ± 0.006 A
Ozone + warming1897 ± 68 AB767 ± 34 B561 ± 36 A3675 ± 144 BC15.2 ± 0.3 B552 ± 24 B0.517 ± 0.006 B
ANOVAPr > FPr > FPr > FPr > FPr > FPr > FPr > F
Warming0.0008<0.0001<0.0001<0.00010.2698<0.0001<0.0001
Ozone0.00050.98050.02620.0001<0.00010.78160.0023
Warming–ozone0.93270.41240.16420.60690.10780.48440.3689
Values are least squares means ± SE. Numbers followed by the same letter in each column were not significantly different at p < 0.05. Ambient plot data are provided for comparison. 1 Data collected in 2016–2018 only.
Publisher’s Note: MDPI stays neutral with regard to jurisdictional claims in published maps and institutional affiliations.

