Abstract
Manure phosphorus (P) accumulation in soils is of environmental concern. The objectives were to determine P concentrations and fate in soils following 119 years of manure and 89 years of chemical fertilizer application. The recovery and distribution of P were evaluated for five years in soils from the untreated check, and soils amended with manure, fertilizer-P, or NPK. Total P concentrations were significantly higher in fertilizer-treated surface soils, compared to manure application. Treated plots had significantly higher P concentrations than the check. Virtually all of the added P was accounted for, either remaining in the soil or harvested in grains. Over 50% of fertilizer-P and about 38% of manure-P were found in the top 15 cm of the soil. A majority (81–99%) of the added fertilizer-P was found in the top 30 cm, while about 40% of manure-P leached down to the 30–90 cm level of the soil profile. Following 119 years of moderate application, manure-P did not reach deeper than 90 cm, suggesting that leaching to groundwater is not a concern at this site. Preserving P in the lower soil profile could enhance the potential for plant uptake.
1. Introduction
Large-scale livestock feeding operations have resulted in high volumes of concentrated manure applied to nearby land for economically efficient waste disposal [1]. From 2015 to 2017, livestock production in the U.S. increased from 647 million to 677 million heads [2] and generated over 330 million tons of wet-weight manure based on estimation conducted using the method by Zhang and Schroder [3]. Manure has been traditionally applied based on crop nitrogen (N) demand. With an average N:P ratio of 3:1 in manure, compared to 8:1 in crops [4,5], N-based manure application results in P inputs exceeding crop needs and accumulation of P in soils [6,7]. Globally, manure-P applied to soils increased from 15 to 24.3 Tg year−1 from 2000 to 2010 [8,9]. Ten percent of P inputs from either fertilizers or manure to soils may be lost to aquatic systems (~2–3 Tg P year−1) [10,11]. With increasing concerns about harmful algal blooms (HABs) [12], it is crucial to understand the fate of manure-P in the environment.
Following century-long cattle manure and 70 years of chemical phosphorus fertilizer application, Parham et al. [13] recovered 32% of added manure-P and about 80% of added fertilizer-P in the top 30 cm of soil. A lower recovery of manure-P was also reported by van der Bom et al. [14], who found that up to 76% of pig manure-P was unaccounted for at 0–20 cm following application for 20 years. Whalen and Chang [15] reported that after a 16-year study, 1.4 Mg P ha−1 was not accounted for in irrigated plots receiving 180 Mg cattle manure ha−1 year−1. The manure-P unaccounted for was hypothesized to be lost through runoff or leached below 150 cm in the soil profile. Many experiments addressing manure-P issues were short-term studies conducted for <4 years [16,17]. The study by Parham et al. [13] reported on a century-old experiment, but only the top 30 cm of soil was evaluated. Therefore, the century-old site was revisited with respect to P recovery to a soil depth up to 90 cm. The objectives were to determine P concentrations, and the fate and distribution of added P in these soils.
2. Materials and Methods
The study site is a continuous winter wheat (Triticum aestivum L.) experiment located in central Oklahoma, U.S.A. (36°07′03.7″ N 97°05′37.0″ W). According to Oklahoma Climatological Survey [18], the annual average rainfall from 1895 to 2019 was 974.09 mm (38.35 inches) and annual average temperature is 15.3 °C (59.5 °F). The experiment was initiated on a Kirkland (fine, mixed, thermic Udertic Paleustolls) silt loam, with the manure treatment (MT) initiated in 1899, and the P fertilizer (PF) and nitrogen-P-potassium (NPK) treatments initiated in 1930. Cattle feedlot manure was applied every four years at 134.5 kg N ha−1 until 1966 then at 269 kg N ha−1 since 1967. The manure was incorporated into soil immediately following application before planting in October. The average N:P ratio of the applied manure was about 3.3:1, which is equivalent to 40.8 kg P ha−1 from 1899 to 1966 and 81.5 kg P ha−1 from 1967 to 2018 that was applied every four years (equivalent to an annual input of 10.19 and 20.38 kg P ha−1 year−1 for 1930–1966 and 1967–2018, respectively). Chemical fertilizers were applied annually at 67 kg N, 14.6 kg P and 28 kg K ha−1. Phosphorus was used in the form of ordinary (single) superphosphate from 1930 to 1967, and triple superphosphate from 1968 to the present. Plots received N as sodium nitrate between 1930 and 1967, ammonium nitrate from 1968 to 2004, and urea from 2005 to the present. Potassium was added as salts of nitrates, sulfates and chlorides. All plant residues were returned to the soil. No other treatments were done (i.e., no irrigation, application of pesticides or herbicide, etc.)
Soil samples were taken prior to planting in five different years (1998, 1999, 2000, 2006, and 2018), at depths of 0–15, 15–30, 30–60, and 60–90 cm from untreated check (CK), MT, PF, and NPK. Unfortunately, the application of statistics to agricultural experiments was not yet in place at the time when this study was initiated. To compensate for the no-replication restriction, evaluations were based on random, individual samples in combination with samples in different years. At each sampling event, each treatment plot (30.4 × 6.5 m) was divided into three subplots (10 × 6.5 m each). A five-core composite sample was taken from each subplot to account for spatial variation in the field. Soils were passed through a 2 mm sieve, air-dried, and kept in sealed containers at 23 °C until analysis.
Soil pH was determined using a combination glass electrode (soil: water ratio = 1:2.5), and the organic carbon (C) and total N by dry combustion using a Carlo-Erba NA 1500 Nitrogen/Carbon/Sulphur Analyzer [19]. Particle size distribution was determined using the hydrometer method [20]. Total P was determined using the wet digestion method described by EPA 3050B [21]. The basic properties of soils sampled in 2018 did not differ significantly from those reported by Parham et al. [13] and are shown in Table 1.

Table 1.
Basic properties of soils sampled in 2018 by treatment and depth.
The recovery of P (%) from the added P was calculated as follows:
where P input (kg P year−1) = added manure- or fertilizer-P (kg P year−1) and P removal = P in harvested grain (kg P year−1). Unit conversion of soil P is explained in the footnote of Table 2. Data were divided and analyzed in two periods (1930–1966 and 1967–2018) because of major changes in management practices. Phosphorus removal was estimated based on the average grain yield of different periods and average grain-P content of 12 years (1980–1986, 1991–1995). Statistical analysis was performed using SAS 9.4. Evaluations were conducted by repeated measures over the years. Significant differences between the treatments at a specified depth interval were determined using PROC GLM according to Tukey’s HSD test at an alpha = 0.05.
% P recovery = ((P removed in grain + P in treated soil − CK soil P)/P input) × 100
Table 2.
Input and output of phosphorus (P) to the system under various fertilizer treatments.
3. Results
Compared with the CK, NPK resulted in significantly lower soil pH, while MT had significantly higher pH. The P treatment had little influence on soil pH in the top 30 cm (Table 1). Treatments had a limited effect on pH in subsurface soils. Organic C and total N in MT and NPK were significantly higher than CK, while little difference was detected between PF and CK. Treatments did not result in significant changes in soil texture.
Due to a change in rate, P input to soil from manure was lower than fertilizer-P from 1930 to 1966, but higher from 1967 to 2018 (Table 2). Grain yields between MT and NPK during the 89 years were not significantly different from each other, but significantly higher than CK and PF (Table 2). Total soil P averaged 193.1, 268.4, 326.4, and 319.6 mg P kg−1 soil in 0–15 cm profile over five years for CK, MT, PF, and NPK, respectively (Table 3). All treatment plots had significantly higher total soil P than CK, and fertilizer plots were higher than MT. Total P at 30–60 and 60–90 cm was generally higher in MT than CK, PF or NPK.
Table 3.
Total P concentration in soils at depth, treatment, and year specified.
Nearly all of the added P was recovered in all treatments (Table 4). The added P from MT was transported deeper into the soil profile than P added from PF and NPK. Phosphorus recovery in five different years in the top 15 cm was markedly higher in NPK (67.2%) than MT (38.2%) or PF (51.6%) (Table 4). For PF and NPK, recovery was about 100% in 0–60 cm. For MT, the soil sampling depth was extended to 90 cm to recover around 100% of the P added. However, P recoveries from each depth were significantly different among treatments in the surface 15 cm of soils (Figure 1). Within each treatment, P recovery from 0–15 cm was significantly higher than subsurface soils. The P recoveries for MT at 15–30, 30–60, and 60–90 cm were not significantly different, while the recoveries for PF and NPK were significantly higher in 15–30 than 60–90 cm. The slightly greater than 100% recovery for NPK in 2018 reflected a discrepancy regarding estimation based on data from long-term treatments.
Table 4.
Recovery (%) of added P calculated based on input and output by sampling year, soil depth, and treatment.
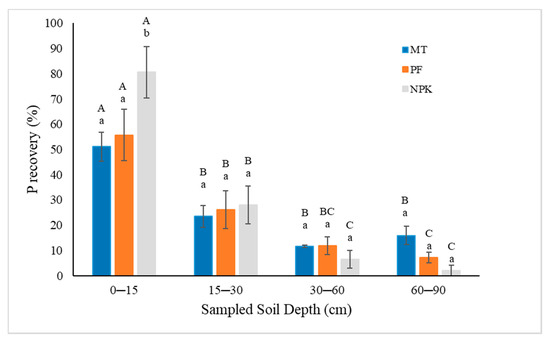
Figure 1.
Average P recovery (%) at 0–15, 15–30, 30–60, and 60–90 cm for 2006 and 2018. MT = manure treatment, PF = phosphorus fertilizer, NPK = nitrogen-phosphorus-potassium. Error bars represent standard error. Different lowercase letters represent significantly different treatment means within each soil depth, and capital letters represent comparisons of depth means within each treatment determined by Tukey’s HSD test (p < 0.05).
4. Discussion
Although accumulation of P in soil following manure application has been widely reported [22,23], P accumulation in soil was less in MT than PF and NPK following 119 years of manure application and 89 years of fertilizer treatment. One can argue that the application rates of 10.2 and 20.4 kg P ha−1 year−1 are relatively low compared to the 39.6 kg P ha−1 year−1 application reported by Pizzeghello et al. [22]. However, a similar observation was reported when 220 kg P ha−1 year−1 was applied for six consecutive years [24]. In their study, total soil P concentrations in manure- and fertilizer-treated plots from 0 to 30 cm were 1008 and 1107 mg P kg−1, respectively. Accumulation of manure-P is more a concern than fertilizer-P because leaching of fertilizer-P constitutes less than 1% of the P added (<2 kg P ha−1) [25,26].
Repeated manure overapplication could saturate the soil’s capacity to retain manure-P [27]. A survey of 10 long-term experiments (10–50 years) revealed that soils reached 25% P saturation after 10–30 years [28]. Some of the accumulated P could potentially reach adjacent water bodies [29] and cause HABs [12]. Nonpoint sources of P in agricultural runoff contribute a significant portion of freshwater P inputs [6]. However, the leaching of organic P should not be dismissed [30]. About 70 to 90% of total P from leachates of soil columns and lysimeters were in organic form, and the percentage of organic P in total dissolved P increased with increasing soil depth [13,31]. Leaching of P to groundwater would be of environmental concern [15]. However, P’s movement to lower in the soil profile could enhance P storage and use efficiency in agricultural production.
About 100% of the added P was recovered from soil samples to a 90 cm depth at long-term manure treatment sites (119 years for the current report and 15 years in the study by Boitt et al. [32]), suggesting a low probability of groundwater contamination at these sites. Shepherd and Withers [33] also found close to 100% recovery of added manure- and fertilizer-P in the 0–35 cm soil profile following a 4-year study. However, other studies reported that not all added P was accounted for, including 25–30% in a two-year study [34] and one third from a 12-year experiment [35]. These two studies tested the top 20 cm of soil and the unaccounted for manure-P was assumed to be lost from leaching or erosion. It is possible that the unaccounted for manure-P leached deeper into the soil profile. However, in a study based on the evaluation of 0–150 cm of the soil profile in irrigated land that was amended with up to 180 Mg ha−1 year−1 of wet cattle manure (equivalent to 804 kg P ha−1 year−1), 7–15% of the added manure-P was not recovered following 16 years of treatment [15]. This was a concern because the water table at this site ranged from 50 to 250 cm. The application rates reported by Whalen and Chang [15] were considerably higher than other studies discussed earlier.
In this study, a portion of added manure-P transported deeper in the soil profile than fertilizer-P. Excluding P removed by grain, the added fertilizer-P was all accounted for in the top 30 or 60 cm of soil following 89 years of application, while on average 40% of the added manure-P was found in the 30–90 cm range of the soil profile. Although 50% of wheat roots are located in the top 16.8 cm of soil [36], the active rooting of winter wheat can reach up to 120 cm [37]. Manure-P in the deeper soil profile could be taken up by plants, enhancing P use efficiency. Wheat and maize are efficient in using residual P that accumulated in soils [38]. Phosphorus is the second-most limiting nutrient, being deficient in 67% of cropland [39]. The potential to enhance P use efficiency from a mere 16% on average between 1961 and 2013 [40] is of great significance in promoting crop productivity while preserving environmental health.
5. Conclusions
Added P accumulated in soils. Chemical fertilizer P accumulated more in the surface soils, while manure P moved more downward to the lower soil profiles. However, nearly all of the added P was recovered by sampling to 90 cm. Over 50% of fertilizer-P remained in the top 15 cm. Excluding grain-P, the added fertilizer-P was mostly in the top 30 cm, while 40% of added manure-P was in the deeper soil up to 90 cm. Considering that the manure treatment has been in place for 119 years, it is not likely that manure-P at this site would reach ground water and cause concern. On the other hand, the P leached lower into the soil profile and could enhance P storage and use efficiency.
Author Contributions
Conceptualization, S.D. and A.P.; methodology, S.D. and A.P.; validation, S.D., A.P., W.R., and H.Z.; formal analysis, A.P.; investigation, S.D. and A.P.; resources, S.D. and H.Z.; data curation, S.D., A.P., W.R.; writing—original draft preparation, A.P.; writing—review and editing, S.D., A.P. and H.Z; visualization, S.D. and A.P.; supervision, S.D.; project administration, S.D.; funding acquisition, S.D. and H.Z. All authors have read and agreed to the published version of the manuscript.
Funding
This work was supported in part by Arthur L. Reed Endowment and Oklahoma Agricultural Experiment Station (OAES) under project(s) h-OKLO03136.
Acknowledgments
Authors thank Yang Wang for her technical support of this project.
Conflicts of Interest
The authors declare no conflict of interest.
References
- Long, C.M.; Muenich, R.L.; Kalcic, M.M.; Scavia, D. Use of manure nutrients from concentrated animal feeding operations. J. Great Lakes Res. 2018, 44, 245–252. [Google Scholar] [CrossRef]
- United States Department of Agriculture. Agricultural Statistics. 2018. Available online: https://www.nass.usda.gov/Publications/Ag_Statistics/2018/Complete%20Publication.pdf (accessed on 12 May 2020).
- Zhang, H.; Schroder, J. Animal manure production and utilization in the US. In Applied Manure and Nutrient Chemistry for Sustainable Agriculture and Environment; He, Z., Zhang, H., Eds.; Springer: Amsterdam, The Netherlands, 2004; pp. 1–21. ISBN 978-94-017-8807-6. [Google Scholar]
- Zhang, H.; Johnson, G.; Fram, M. Managing Phosphorus from Animal Manure. 2004. Available online: http://poultrywaste.okstate.edu/Publications/files/f-2249web.pdf (accessed on 25 May 2020).
- Bouwman, A.F.; Beusen, A.H.W.; Lassaletta, L.; Van Apeldoorn, D.F.; Van Grinsven, H.J.M.; Zhang, J.; van Ittersum, M.K. Lessons from temporal and spatial patterns in global use of N and P fertilizer on cropland. Sci. Rep. 2017, 7, 40366. [Google Scholar] [CrossRef] [PubMed]
- Sharpley, A.N.; Chapra, S.C.; Wedepohl, R.; Sims, J.T.; Daniel, T.C.; Reddy, K.R. Managing Agricultural Phosphorus for Protection of Surface Waters: Issues and Options. J. Environ. Qual. 1994, 23, 437–451. [Google Scholar] [CrossRef]
- Sharpley, A.; McDowell, R.W.; Kleinman, P.J.A. Amounts, Forms, and Solubility of Phosphorus in Soils Receiving Manure. Soil Sci. Soc. Am. J. 2004, 68, 2048–2057. [Google Scholar] [CrossRef]
- Smil, V. Phosphorus in theenvironment: Natural flows and human interferences. Annu. Rev. Energy Environ. 2000, 25, 53–88. [Google Scholar] [CrossRef]
- Potter, P.; Ramankutty, N.; Bennett, E.M.; Donner, S.D. Characterizing the Spatial Patterns of Global Fertilizer Application and Manure Production. Earth Interact. 2010, 14, 1–22. [Google Scholar] [CrossRef]
- Bouwman, A.F.; Beusen, A.H.W.; Billen, G. Human alteration of the global nitrogen and phosphorus soil balances for the period 1970–2050. Glob. Biogeochem. Cycles 2009, 23. [Google Scholar] [CrossRef]
- Seitzinger, S.P.; Mayorga, E.; Bouwman, A.F.; Kroeze, C.; Beusen, A.H.W.; Billen, G.; Van Drecht, G.; Dumont, E.; Fekete, B.M.; Garnier, J.; et al. Global river nutrient export: A scenario analysis of past and future trends. Glob. Biogeochem. Cycles 2010, 24. [Google Scholar] [CrossRef]
- United States Environmental Protection Agency. A Compilation of Cost Data Associated with the Impacts and Control of Nutrient Pollution. Available online: https://www.epa.gov/nutrient-policy-data/compilation-cost-data-associated-impacts-and-control-nutrient-pollution (accessed on 5 April 2020).
- Parham, J.A.; Deng, S.P.; Raun, W.R.; Johnson, G.V. Long-term cattle manure application in soil: I. Effect on soil phosphorus levels, microbial biomass C, and dehydrogenase and phosphatase activities. Biol. Fertil. Soils 2002, 35, 328–337. [Google Scholar] [CrossRef]
- Van der Bom, F.; McLaren, T.I.; Doolette, A.; Magid, J.; Frossard, E.; Oberson, A.; Jensen, L. Influence of long-term phosphorus fertilisation history on the availability and chemical nature of soil phosphorus. Geoderma 2019, 355, 113909. [Google Scholar] [CrossRef]
- Whalen, J.K.; Chang, C. Phosphorus Accumulation in Cultivated Soils from Long-Term Annual Applications of Cattle Feedlot Manure. J. Environ. Qual. 2001, 30, 229–237. [Google Scholar] [CrossRef] [PubMed]
- Eghball, B.; Gilley, J.E. Phosphorus and Nitrogen in Runoff following Beef Cattle Manure or Compost Application. J. Environ. Qual. 1999, 28, 1201–1210. [Google Scholar] [CrossRef]
- Eghball, B. Leaching of Phosphorus Fractions Following Manure or Compost Application. Commun. Soil Sci. Plant Anal. 2003, 34, 2803–2815. [Google Scholar] [CrossRef]
- Oklahoma Climatological Survey Payne County Climate Summary. Available online: http://climate.ok.gov/county_climate/Products/County_Climatologies/county_climate_payne.pdf (accessed on 27 November 2020).
- Schepers, J.S.; Francis, D.; Thompson, M. Simultaneous determination of total C, total N, and 15N on soil and plant material. Commun. Soil Sci. Plant Anal. 1989, 20, 949–959. [Google Scholar] [CrossRef]
- Gee, G.W.; Or, D. Particle size analysis. In Methods of Soil Analysis. Part 4. Physical Methods; Dane, G.H., Topp, G.C., Eds.; Soil Science Society of America: Madison, WI, USA, 2002; ISBN 978-0-891-18893-3. [Google Scholar]
- United States Environmental Protection Agency. Method 3050B: Acid Digestion of Sediments, Sludges, and Soils; Revision 2; United States Environmental Protection Agency: Washington, DC, USA, 1996. Available online: https://www.epa.gov/sites/production/files/2015-06/documents/epa-3050b.pdf (accessed on 4 June 2020).
- Pizzeghello, D.; Berti, A.; Nardi, S.; Morari, F. Relationship between soil test phosphorus and phosphorus release to solution in three soils after long-term mineral and manure application. Agric. Ecosyst. Environ. 2016, 233, 214–223. [Google Scholar] [CrossRef]
- Wironen, M.B.; Bennett, E.M.; Erickson, J.D. Phosphorus flows and legacy accumulation in an animal-dominated agricultural region from 1925 to 2012. Glob. Environ. Chang. 2018, 50, 88–99. [Google Scholar] [CrossRef]
- Yan, Z.; Chen, S.; Dari, B.; Sihi, D.; Chen, Q. Phosphorus transformation response to soil properties changes induced by manure application in a calcareous soil. Geoderma 2018, 322, 163–171. [Google Scholar] [CrossRef]
- Sharpley, A.N.; Withers, P.J.A. The environmentally-sound management of agricultural phosphorus. Fertil. Res. 1994, 39, 133–146. [Google Scholar] [CrossRef]
- Smith, K.A.; Chalmers, A.G.; Chambers, B.J.; Christie, P. Organic manure phosphorus accumulation, mobility and management. Soil Use Manag. 1998, 14, 154–159. [Google Scholar] [CrossRef]
- Nair, V.D.; Graetz, D.A.; Reddy, K.R. Dairy Manure Influences on Phosphorus Retention Capacity of Spodosols. J. Environ. Qual. 1998, 27, 522–527. [Google Scholar] [CrossRef]
- Hooda, P.S.; Truesdale, V.; Edwards, A.; Withers, P.; Aitken, M.; Miller, A.; Rendell, A. Manuring and fertilization effects on phosphorus accumulation in soils and potential environmental implications. Adv. Environ. Res. 2001, 5, 13–21. [Google Scholar] [CrossRef]
- James, D.W.; Kotuby-Amacher, J.; Anderson, G.L.; Huber, D.A. Phosphorus Mobility in Calcareous Soils under Heavy Manuring. J. Environ. Qual. 1996, 25, 770–775. [Google Scholar] [CrossRef]
- Schepers, J.S.; Schlemmer, M.R.; Ferguson, R.B. Site-Specific Considerations for Managing Phosphorus. J. Environ. Qual. 2000, 29, 125–130. [Google Scholar] [CrossRef]
- Chardon, W.J.; Oenema, O.; Del Castilho, P.; Vriesema, R.; Japenga, J.; Blaauw, D. Organic Phosphorus in Solutions and Leachates from Soils Treated with Animal Slurries. J. Environ. Qual. 1997, 26, 372–378. [Google Scholar] [CrossRef]
- Boitt, G.; Schmitt, D.E.; Gatiboni, L.C.; Wakelin, S.A.; Black, A.; Sacomori, W.; Cassol, P.C.; Condron, L.M. Fate of phosphorus applied to soil in pig slurry under cropping in southern Brazil. Geoderma 2018, 321, 164–172. [Google Scholar] [CrossRef]
- Shepherd, M.; Withers, P. Applications of poultry litter and triple superphosphate fertilizer to a sandy soil: Effects on soil phosphorus status and profile distribution. Nutr. Cycl. Agroecosyst. 1999, 54, 233–242. [Google Scholar] [CrossRef]
- Pheav, S.; Bell, R.W.; White, P.F.; Kirk, G.J.D. Phosphorus Mass Balances for Successive Crops of Fertilised Rainfed Rice on a Sandy Lowland Soil. Nutr. Cycl. Agroecosyst. 2005, 73, 277–292. [Google Scholar] [CrossRef]
- Lemming, C.; Oberson, A.; Magid, J.; Bruun, S.; Scheutz, C.; Frossard, E.; Jensen, L. Residual phosphorus availability after long-term soil application of organic waste. Agric. Ecosyst. Environ. 2019, 270–271, 65–75. [Google Scholar] [CrossRef]
- Fan, J.; McConkey, B.; Wang, H.; Janzen, H. Root distribution by depth for temperate agricultural crops. Field Crop. Res. 2016, 189, 68–74. [Google Scholar] [CrossRef]
- Walsh, O.S.; Klatt, A.R.; Solie, J.B.; Godsey, C.B.; Raun, W.R. Use of soil moisture data for refined GreenSeeker sensor based nitrogen recommendations in winter wheat (Triticum aestivum L.). Precis. Agric. 2013, 14, 343–356. [Google Scholar] [CrossRef]
- Khan, A.; Lu, G.; Ayaz, M.; Zhang, H.; Wang, R.; Lv, F.; Yang, X.; Sun, B.; Zhang, S. Phosphorus efficiency, soil phosphorus dynamics and critical phosphorus level under long-term fertilization for single and double cropping systems. Agric. Ecosyst. Environ. 2018, 256, 1–11. [Google Scholar] [CrossRef]
- Batjes, N.H. A world dataset of derived soil properties by FAO–UNESCO soil unit for global modelling. Soil Use Manag. 1997, 13, 9–16. [Google Scholar] [CrossRef]
- Dhillon, J.; Torres, G.; Driver, E.; Figueiredo, B.; Raun, W.R. World Phosphorus Use Efficiency in Cereal Crops. Agron. J. 2017, 109, 1670–1677. [Google Scholar] [CrossRef]

Publisher’s Note: MDPI stays neutral with regard to jurisdictional claims in published maps and institutional affiliations. |
© 2020 by the authors. Licensee MDPI, Basel, Switzerland. This article is an open access article distributed under the terms and conditions of the Creative Commons Attribution (CC BY) license (http://creativecommons.org/licenses/by/4.0/).